Abstract
To avoid unnecessary power loss during switching between the various power sources of a composite electric vehicle while achieving smooth operation, this study focuses on the development and dynamic simulation analysis of a control system for the power of a parallel composite vehicle. This system includes a power integration and distribution mechanism, which enables the two power sources of the internal combustion engine and electric motor to operate independently or in coordination to meet the different power-output requirements. The integration of the electric motor and battery-charging engine reduces the system complexity. To verify the working efficiency of the energy control strategy for the power system, the NEDC2000 cycle is used for the vehicle driving test, a fuzzy logic controller is established using Matlab/Simulink, and the speed and torque analysis of the components related to power system performance are conducted. Through a dynamic simulation, it is revealed that this fuzzy logic controller can adjust the two power sources (the motor and internal combustion engine) appropriately. The internal combustion engine can be maintained in the optimal operating region with low, medium, and high driving speeds.
1. Introduction
Vehicles with internal combustion engines produce greenhouse gases [1,2,3]. However, pure electric vehicles have issues in terms of endurance, cost, charging time, and reliability of the lithium battery itself [4,5,6,7]. Therefore, hybrid power vehicles can meet the needs of consumers at this stage. The electric motor works at low speed, while the internal combustion engine of a hybrid power vehicle is set to operate in the high-energy conversion efficiency area. That may significantly reduce the fuel consumption and air pollution [8,9,10]. According to the architecture of power control, hybrid electric vehicles can be divided into series and parallel configurations [11,12]. In the series configuration, only one power source provides the driving force required by the vehicle, while in the parallel configuration, two or more power sources are used to provide the driving force required by the vehicle [13,14,15]. The parallel configuration has better efficiency than the series configuration, because in the former configuration, the internal combustion engine and electric motor can operate simultaneously, and hence, greater power is synthesized through the power integration and distribution mechanism to drive the vehicle. Moreover, when the output power of the internal combustion engine exceeds the power required by the vehicle, the battery can be charged by driving the generator, which serves as an electric power source when the electric motor operates. When the vehicle starts and runs at a low speed, the internal combustion engine does not move and is powered by the motor.
In addition, a fuzzy logic controller has been proposed to improve the energy efficiency of hybrid vehicles with parallel configuration [16,17,18]. The basic theme of fuzzy rules is to optimize the operating efficiency of all components as a system. Simulation results have been used to evaluate the controllers. A forward-facing hybrid vehicle model is used for implementing and simulating the controller. Compared to other controllers, the use of fuzzy logic improves the fuel economy and maximizes the engine efficiency. The innovation and improvement of the control system allows the vehicle with a parallel hybrid power system to obtain better power output. Buntin and Howze [19] used a logic-based switching control system to convert the drive torque control of the internal combustion engine into an auxiliary control, for the purpose of achieving better torque output through the vehicle’s electronic throttle control device. Berenji and Ruspini [20] used fuzzy logic and neuro-fuzzy logic to establish fuzzy control rules, so that the control system can have self-learning ability in addition to its automation function. Koo et al. [21] proved the effectiveness of decision-making using a fuzzy logic controller, to improve the driving performance through a vehicle road test, which also improves the battery-charging mechanism while reducing NOx emissions. Cikanek et al. [22] developed an integrated power transmission system for parallel hybrid electric vehicles using mathematical models and computer control software. Baumann et al. [23] used fuzzy logic control to establish vehicle operation strategies with high and low loads and verified the feasibility of this control design through simulation. Lin et al. [24] developed a simulation tool for hybrid electric trucks, which comprised feed forward control, dynamic equations of subsystem modules, and basic vehicle features. Delprat et al. [25] proposed an optimal control theory, based on rules that exhibited lower computational complexity compared to other methods. Chau and Wong [26] summarized the power flow control methods of parallel hybrid power and electric vehicle systems, and explained that the optimal energy efficiency can be obtained by controlling the internal combustion engine in the minimum fuel consumption area and the maximum torque area. Schouten et al. [16] used driving commands, state of charge (SOC), and motor speed as input conditions for establishing a set of rules on which fuzzy control is based, so that the electric motor and internal combustion engine can distribute and transmit energy more smoothly. Schouten et al. [27] also used a fuzzy logic energy management control strategy for brake control and gear shifting. The simulation results proved that using fuzzy logic can improve the fuel economy when the efficiency of the internal combustion engine is in the optimal operating region. Wong and Langari [28,29] established intelligent energy management control strategies, combining a fuzzy torque distributor and SOC, to distribute the torque of an internal combustion engine, so that the optimal energy distribution can be achieved under different operating conditions. Sciarretta et al. [30] proposed an immediate load control strategy that incorporates fuel energy and electrical energy into the calculation for estimating vehicle fuel economy and SOC performance. Delprat et al. [31] proposed a set of simulation processes that can shorten the calculation time to evaluate the minimum fuel consumption of a vehicle. Kheir et al. [32] used a fuzzy logic control unit to perform optimal parameter design to improve the vehicle’s fuel economy and reduce pollutant emissions. Won et al. [33] established an energy management strategy to distribute the torque and charging procedures. Moreover, fuzzy rules based on driving awareness were used to determine the timing of power switching, and the practicability of the system was analyzed and verified using the simulation results [34].
To maintain the internal combustion engine in the parallel hybrid power system in the optimal operating region under the various driving conditions, a fuzzy control system is designed to simulate and analyze the power of the parallel hybrid vehicle. This system comprises a power integration and distribution mechanism that enables the two power sources of the internal combustion engine and electric motor to be used individually or in combination to output different power requirements. To verify the effectiveness of the energy control strategy of the power system, based on the NEDC2000 test, a numerical simulation is conducted to verify that the control system can properly adjust the two power sources of the motor and the internal combustion engine. The internal combustion engine can be maintained in the optimal operating region under different driving conditions, and the switching between the power sources achieves good operation to avoid unnecessary power loss.
2. Materials and Methods
The architecture of the parallel hybrid power system proposed in this study is shown in Figure 1. After starting the internal combustion engine, calculations are used to control and maintain it at its optimal operating point, as much as possible, and at the same time, the generator can be used to charge the battery according to the external load at any time. The three power-output modes include motor power-only mode, internal combustion engine power-only mode, and dual-power mode. The corresponding system energy management strategies include low-, medium-, and high-power flow (Figure 2a–c) and braking energy recharge (Figure 2d). The system dynamic modules, hybrid power control module, and energy management control module in the control system are described below.
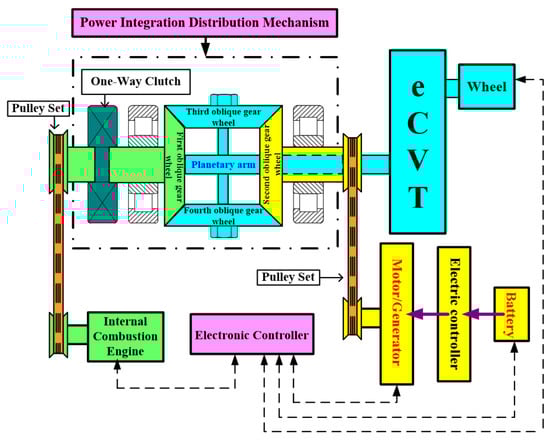
Figure 1.
Schematic of the parallel hybrid power system.
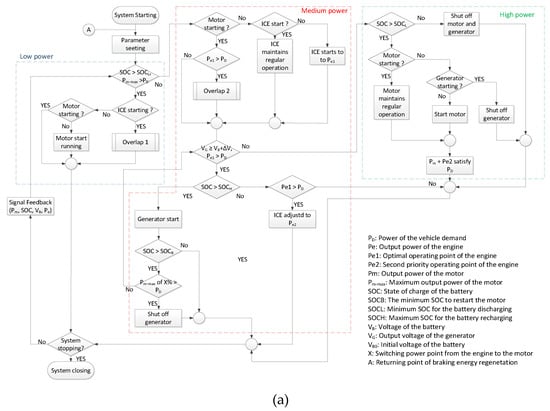
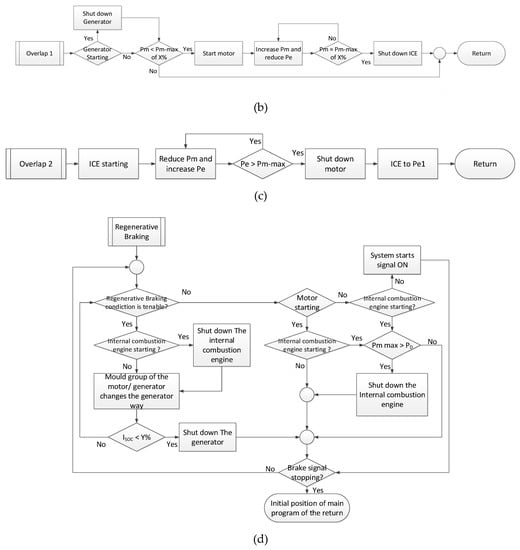
Figure 2.
(a) Power system energy management strategy, (b) overlap 1, (c) overlap 2, (d) brake energy recharge management strategy.
2.1. Dynamic System Model Establishment
There are a total of seven modules: internal combustion engine dynamic module, motor dynamic module, generator dynamic module, power integration and distribution mechanism module, electronically-controlled continuously variable transmission (eCVT) mechanism module, vehicle running resistance module, and tire dynamic module. In this study, Matlab/Simulink® is used for model establishment. These modules are shown in Supplementary Figure S1. By connecting all modules, the system dynamic module is obtained in Supplementary Figure S2. An opening command is input to the power distribution module of the fuzzy logic controller, and the output positions of the electric motor and internal combustion engine are turned on according to the changes in vehicle speed and SOC. To maintain the output position of the internal combustion engine at a fixed load, when the external load changes, the generator output is adjusted accordingly. The output position of the internal combustion engine is combined with that of the electric motor through the power integration and distribution mechanism module, to obtain the dynamic response of tires through the eCVT module. Then, the dynamic response of torque and speed required for the acceleration and deceleration of the hybrid power vehicle to overcome the load at the time is calculated.
2.2. Hybrid Power Control Module
This module uses the relation among vehicle electric position, vehicle speed, and SOC as the basis for power distribution, allowing the power from the internal combustion engine, electric motor, and generator to be properly distributed. The electric position of the electric motor is analogized to the throttle position of the internal combustion engine. It controls the power output of the motor. First, the input conditions are converted, via the fuzzy controller, into linguistic variables expressed by a fuzzy set. This step is called fuzzification, and its input conditions are shown in Figure 3a–c. The vehicle speed for the electric position is divided into 12 attribution functions—including those in the low-speed range (Z, TL, T-L1, T-L2, T-L3), with the attribution functions set to 0–35 km/h; those in the medium-speed range (T-M), with the attribution functions set to 36–65 km/h; and those in the high-speed range (T-H, T-H1, T-H2, T-H3, T-H4, T-H5, T-H6), with the attribution functions set to 66–130 km/h. The division of the vehicle-speed input attribution functions is roughly the same as that of the attribution functions of the electric position. The attribution function of SOC is divided into two. The first is when the SOC is low (LOW), in the range 0–30, and the second is when the SOC is normal (HIGH), in the range 30–100.
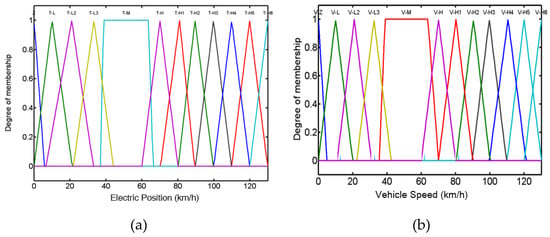
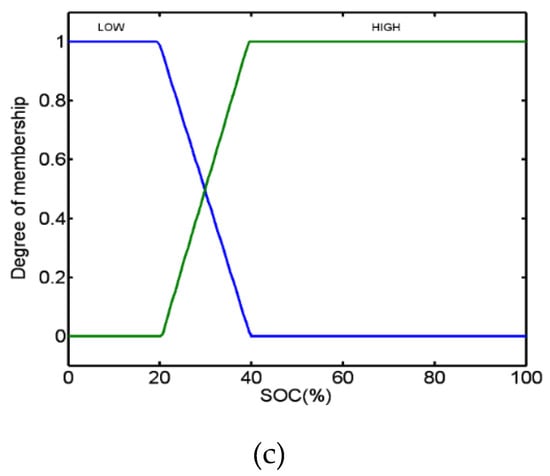
Figure 3.
Input attribution functions of (a) electric position, (b) vehicle speed, and (c) state of charge (SOC).
The control rule base is formulated according to the characteristics of the control target and the state to be controlled. Figure 4a–d show a 3D diagram representing the relative relations of the rule base. The rules established in the fuzzy logic control rule base adjust the output power percentage of the internal combustion engine and the electric motor according to conditions such as the electric position, vehicle speed, and SOC. As for the attribution function of the output power, this study uses middle of maxima defuzzification as its output condition, as shown in Figure 5a–c. There are 11 throttle positions, of which “off” means the throttle is closed. The optimal range of throttle positions for the internal combustion engine is set to 80%. This setting is based on the test torque data of the internal combustion engine in this system. The optimal operating range of this system is achieved when the throttle position is ~80%, at a speed of 5700 rpm and a torque of 13.1 Nm. The specification of combustion engine is showed in Supplementary Figure S3. According to the control rules of this system, the electric motor position is determined to range from 0% to 100%, and there are 11 output attribution functions, where Zm indicates that the electric motor is turned off. There are three attribution functions for the generator to control the position output, which are mainly divided into low, medium, and high regions.
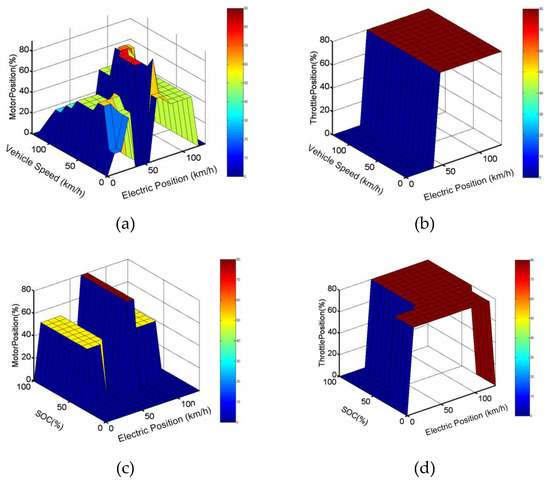
Figure 4.
Three-dimensional maps of the rule base for (a) electric position and vehicle speed vs. motor position, (b) electric position and vehicle speed vs. throttle position, (c) electric position and SOC vs. motor position, and (d) electric position and throttle position vs. SOC.
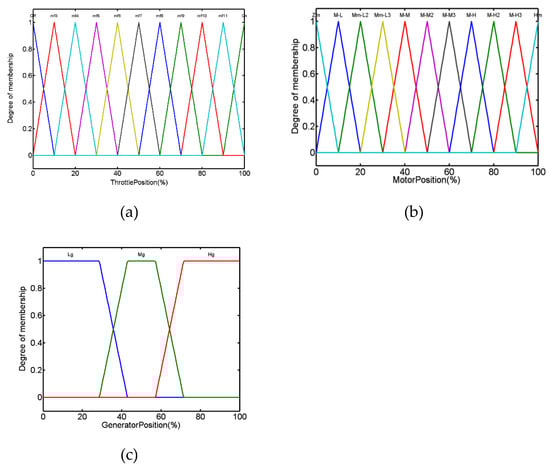
Figure 5.
Output attribution functions of (a) throttle position, (b) motor position, and (c) generator position.
2.3. Energy Management Control Module
Stateflow in Matlab/Simulink® is used to build the energy management control module, as shown in Supplementary Figure S4. The power input of each module is used to determine the switching sequence for achieving the optimal switching control, and then, the controller module is incorporated to make the system control smoother. The low-power operation (Supplementary Figure S4b) is to decide whether to turn off the internal combustion engine and whether to turn on the electric motor. The timing to turn off the internal combustion engine and turn on the motor is revealed through Overlap 1, to avoid stagnation during the power source switching. The medium-power module (Supplementary Figure S4c) is to decide whether to operate the generator and whether to switch the internal combustion engine to the optimal low-power region, as well as to determine whether the SOC is low, and thus, it becomes necessary to start the generator and convert the excess kinetic energy into electrical energy to help the battery charge. The medium-to-high-power (Supplementary Figure S4d) switching is for judging whether to turn on the internal combustion engine and whether to turn off the electric motor. Overlap 2 is used to judge the timing of power switching, to avoid the delay when increasing power. The high-power module (Supplementary Figure S4e) is used to determine whether the electric motor/generator should be turned off to allow the internal combustion engine to run alone, or the electric motor and internal combustion engine should be started simultaneously, to achieve the dual-power output for meeting the highest output demand.
3. Results and Discussion
The experimental parameters include the inertial vehicle weight of 270 kg, road friction resistance (μ) of 0.018, air resistance coefficient (Cd) of 0.43, driving gradient at 0, eCVT transmission reduction ratio of 0.3–2.5, final reduction ratio of 6, SOC of 80%, and dynamic load radius of 0.19 m. The driving test is based on the NEDC2000 high-speed driving test, as shown in Figure 6. The experimental results are explained below.
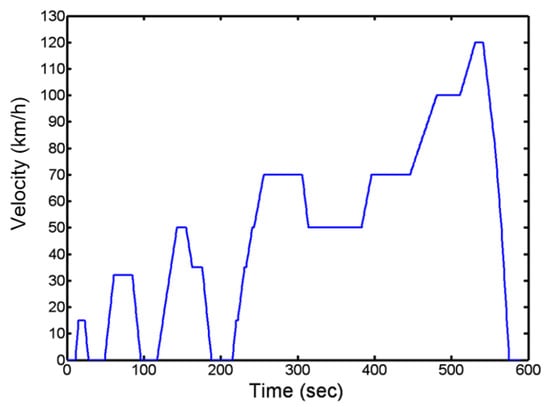
Figure 6.
NEDC2000 high-speed driving pattern.
3.1. Output Torque and Speed of Motor, Generator and Internal Combustion Engine
The torque output is shown in Figure 7a. At the 12th s, the electric motor outputs 6.2 Nm to allow the car to move forward until it is turned off at the 26th s. The electric motor is turned on again at the 50th s. When the car starts to move at a constant speed at the 57th s, the torque provided by the electric motor also stabilizes at 11 Nm until it is turned off at the 85th s. At the 118th s, the electric motor again provides a torque of 11 Nm until the 136th s. When the electric motor is about to shut down, the internal combustion engine is turned on to provide 13 Nm torque. When the internal combustion engine enters the preset optimal operating region at the 137th s, the system starts the generator to assist the internal combustion engine to overcome the output torque changed by various resistances. At the 161st s, under the system judgment, the internal combustion engine and generator are turned off, and the electric motor is started to provide a torque of 11 Nm until it is turned off at the 182nd s. The electric motor provides 10 Nm of torque from the 216th s onward until it is shut off at the 234th s. Next, the internal combustion engine is turned on to provide 13 Nm of torque, as the road demand exceeds the performance of the electric motor. When the internal combustion engine enters the optimal operating region at the 237th s, the system starts the generator to assist the internal combustion engine to overcome the output torque changed by various resistances. At the 240th s, the system determines that the torque demand has increased, so it turns off the generator and starts the electric motor to assist the internal combustion engine to increase the power output. However, when the electric motor starts, it causes the internal combustion engine to briefly jump out of the optimal operating region. This is because the torque output by the electric motor at the beginning has not been stabilized, so there will be a temporary power transmission loss before the output is stabilized. At the 252nd s, the torque output from the internal combustion engine (13 Nm) and that from the electric motor (13.7 Nm) become similar, and the operation of the mechanism tends to stabilize. At the 308th s, the vehicle begins to decelerate to 50 km/h; therefore, starting from the 309th s, the internal combustion engine alone provides 13 Nm of torque. At this time, as the road demand is less than the output power of the internal combustion engine, the generator is turned on until the 391st s, when it is turned off again. From the 392nd s, the internal combustion engine alone cannot meet the torque output requirements, and the electric motor is started to provide 13.7 Nm of torque until the 460th s. After the 460th s, the vehicle must accelerate to 100 km/h, and thus, the motor torque is reduced to 12 Nm. After the 510th s, the vehicle must accelerate again to 120 km/h, and thus, the motor torque is again reduced to 10.4 Nm until the end of the 541st s. At the 562nd s, the motor is turned off and the internal combustion engine is running alone. At this time, the generator is started to assist the internal combustion engine until the 567th s. At this second, the internal combustion engine and generator are turned off, and the electric motor is started to assist the vehicle to slow down to zero speed.
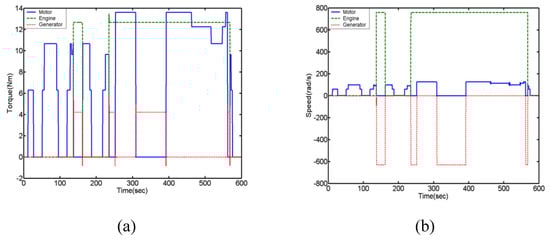
Figure 7.
Output (a) torque, (b) rotational speed of motor, generator, and internal combustion engine.
The speed output is shown in Figure 7b. The electric motor outputs a rotational speed of 60 rad/s at the 12th s until it becomes stationary at the 27th s. At the 51st s, the electric motor is started. At the 57th s, the vehicle starts to move at a constant speed, and a steady output speed of 100 rad/s is maintained until the 90th s, when the electric motor becomes stationary. At the 119th s, the electric motor again outputs a speed of 100 rad/s until it stops at the 137th s. When the electric motor is about to shut down, the internal combustion engine starts to provide a rotational speed of 700 rad/s. When the internal combustion engine reaches the optimal operating region, the generator is turned on, providing a speed of 610 rad/s in the reverse direction. At the 162nd s, the vehicle speed is decreased from the predetermined 50 km/h to that of 35 km/h. The system makes the judgment to shut down the internal combustion engine and generator, and to start the electric motor at a speed of 100 rad/s, to advance the vehicle until the 182nd s. The electric motor again provides a rotational speed of 100 rad/s at the 217th s until it becomes stationary at the 235th s. When the electric motor is about to shut down, the system determines to turn on the internal combustion engine to provide a rotational speed of 700 rad/s, and to turn on the generator when the internal combustion engine reaches the optimal operating region, providing 610 rad/s speed in the reverse direction. At the 252nd s, the system determines to start the electric motor and turn off the generator. The internal combustion engine and the electric motor provide the rotation speed until the 309th s. At this second, the vehicle begins to decelerate to 70 km/h, such that a 700 rad/s output is provided by the internal combustion engine alone. The generator is started at the same time and then stopped at the 392nd s. At the 392nd s, the electric motor starts, and the internal combustion engine accelerates again with dual power until the vehicle speed reaches 100 km/h. At this time, the electric motor provides an output speed of 120 rad/s. At the 463rd s, the speed is reduced to 110 rad/s because the controller judges that the motor can reduce the output. At the 515th s, the motor further reduces its speed to 100 rad/s. The motor becomes stationary at the 565th s, and the internal combustion engine runs with the generator until the 570th s. Finally, the motor is started separately to provide a 90 rad/s output speed until it decelerates to 0 rad/s.
3.2. Output Torque and Speed of Power Integration and Distribution Mechanism
The output torque of the power integration and distribution mechanism is shown in Figure 8a. At the 12th s, the electric motor provides power to allow the output torque from the mechanism to reach 13 Nm until it stops at the 27th s. At the 51st s, the electric motor again provides power to increase the torque from the mechanism to 21 Nm until the end of the 90th s. At the 119th s, the electric motor again provides power, but is turned off at the 136th s as it cannot meet the driving demand, and the internal combustion engine is turned on to allow the mechanism torque to reach 25 Nm. At the 162nd s, the internal combustion engine and generator are turned off, and the electric motor is started to provide a torque of 21 Nm until the 182nd s. At the 217th s, the electric motor provides the mechanism torque until it is turned off at the 225th s. When the electric motor is about to shut down, the internal combustion engine is turned on to provide torque. The generator starts after the internal combustion engine enters the optimal operating region at the 235th s, so the torque from the mechanism is 25 Nm. At the 252nd s, the system determines to start the electric motor and turn off the generator. The torque of the mechanism is maintained at 26 Nm until the 309th s, when the motor is turned off and the generator is started, before it is turned off at the 392nd s; the mechanism torque during this period is 25 Nm. After that, due to the demand generated by vehicle acceleration, the generator is turned off again while the motor is started to assist the internal combustion engine; the torque of the mechanism returns to 26 Nm. At the 463rd s, as the vehicle continues to accelerate, the torque demand of the mechanism drops to 24 Nm. At the 515th s, due to the continuous acceleration of the vehicle, the torque of the mechanism drops further to 22 Nm. After the 541st s, the vehicle speed begins to decrease, and the torque output of the mechanism fluctuates somewhat under the overall control of the motor, internal combustion engine, and generator, until the vehicle stops after the 570th s.
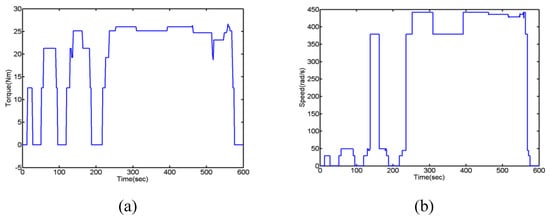
Figure 8.
Output (a) torque, (b) rotational speed of power integration, and distribution mechanism.
The output rotational speed of the power integration and distribution mechanism is shown in Figure 8b, which is 29 rad/s at the 12th s and zero at the 27th s. The output rotational speed of the mechanism at the 51st s is 49 rad/s until it decelerates to zero at the 90th s. At the 119th s, an output rotational speed of 49 rad/s is first provided by the electric motor until it is turned off at the 136th s, and then, an output speed of 378 rad/s is provided under the operation of the internal combustion engine and the generator. After that, as the vehicle speed drops from 50 to 32 km/h, the mechanism speed is provided by the electric motor alone at the 163rd s, so the speed becomes 49 rad/s until the electric motor is turned off at the 182nd s. At the 217th s, the electric motor provides a mechanism output speed of 49 rad/s until the 225th s, and then, the internal combustion engine is combined with the generator to provide a mechanism speed of 378 rad/s. As the electric motor is started and the generator is turned off at the 252nd s, the internal combustion engine and electric motor provide a speed of 441 rad/s until the 309th s. The motor is turned off after that, and the generator and the internal combustion engine are started to operate until the 392nd s, and the speed of the mechanism is 378 rad/s during this period. At the 392nd s, the generator is turned off and the motor is started again. At this time, the electric motor and internal combustion engine provide a mechanism speed of 441 rad/s until the 463rd s. At the 463rd s, because the controller judges that the output speed of the mechanism exceeds the demand, the speed is reduced to 430 rad/s. At the 515th s, the controller again reduces the speed to 420 rad/s. At the 541st s, due to the gradual slowdown of the vehicle to a standstill, the speed of the mechanism fluctuates slightly, and eventually falls to zero at the 570th s.
3.3. Output Torque of eCVT Mechanism
Figure 9a shows the eCVT speed reduction ratio, and Figure 9b shows the eCVT output torque during the full course. At the 12th s, the electric motor provides torque to produce the eCVT output 6 Nm of torque. At the 23rd s, because the electric motor stops outputting torque, the torque output by the eCVT drops to 3 Nm until the driving resistance consumes it all. At the 49th s, the electric motor again provides torque and eCVT outputs 11.7 Nm until the 95th s. At the 119th s, the electric motor provides torque again. However, as the electric motor alone cannot provide sufficient power to drive, it is turned off at the 132nd s. At this time, the eCVT torque also drops from 8 to 7 Nm. When the electric motor is about to shut down, the internal combustion engine starts to provide power. At the 143rd s, the eCVT torque increases from the original 13 Nm to ~17 Nm because the system starts the generator. At the 162nd s, because the vehicle speed drops, the system shuts down the internal combustion engine and the generator but restarts the electric motor, so that only 12 Nm of torque from the eCVT is left at the moment of engagement. This is because the power provided by the electric motor has not yet been stabilized. At the 164th s, the power provided by the electric motor tends to be stable, such that the eCVT torque is maintained at 11.7 Nm. The electric motor stops providing power at the 187th s, but soon starts to provide power again at the 217th s. However, as the power provided by the electric motor alone is insufficient to meet the driving requirements, eCVT provides 6–7 Nm torque to drive the vehicle forward until the electric motor shuts down at the 222nd s. When the electric motor is about to shut down, the internal combustion engine starts to provide power. At the 235th s, the eCVT torque is 12 Nm as the system decides to start the generator. At the 252nd s, the system judges to turn on the electric motor and turn off the generator. Before the output of the electric motor becomes stabilized, power transmission loss and oscillation occur briefly. At the 253rd s, the torque outputs from the internal combustion engine and the electric motor start to become similar, and the eCVT operation tends to provide a stable torque of 23 Nm until the motor is turned off at the 309th s. After the 309th s, the car starts to decelerate, and the generator is started. Until the generator is turned off at the 392nd s, the eCVT torque is dropped to 17 Nm. At the 392nd s, the motor assists the internal combustion engine to accelerate the vehicle again, at which time the eCVT provides 22 Nm output torque. At the 463rd s, as the vehicle speed increases again, eCVT increases its torque to 33 Nm. At the 515th s, the vehicle speed is increased again, and eCVT continues to increase the torque to 44 Nm. At the 541st s, the torque begins to decrease gradually to 0 Nm.
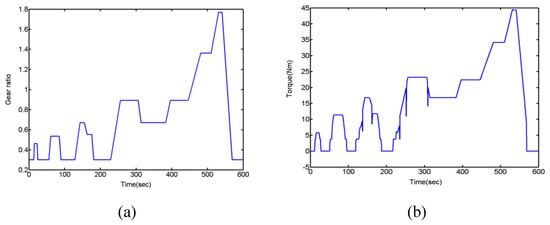
Figure 9.
Output (a) speed reduction ratio and (b) torque of transmission mechanism.
3.4. Comparison of Experimental Results with NEDC2000 High-Speed Driving Test Pattern
Figure 10a is a graph comparing the experimental results with the speed of the driving test pattern. The first driving pattern is powered by the electric motor in the system. The vehicle is started from the 12th s and reaches 15 km/h at the 15th s. The power supply stops after the 23rd s, and the vehicle returns to a stationary state at the 28th s. The second driving pattern is also powered by the electric motor. The vehicle is driven forward from the 51.9th s onward until it reaches 32 km/h at the 60th s. The power supply stops after the 85th s, and the vehicle speed returns to zero at the 93rd s. The third driving pattern is initially powered solely by the electric motor. Due to the delay in acceleration performance of the power provider, the vehicle starts to move forward only at the 125th s. At the 137th s, the system decides to switch power, stopping the operation of the electric motor and using the internal combustion engine to output power instead. This causes an oscillation when the power is switched at the 137th s. At the 143rd s, the vehicle speed begins to move at a constant speed. After the 155th s, the internal combustion engine stops outputting power, and the car begins to decelerate. The electric motor starts to output power at the 162nd s, and the vehicle speed starts to decrease from 50 to 32 km/h at the 172nd s. After the 176th s, the power supply stops, and the vehicle speed returns to zero at the 185.5th s. The fourth driving pattern is first powered by the electric motor at the 220th s, and initial oscillations similar to those in the third driving pattern are generated. At the 235th s, the system determines to switch power, stopping the electric motor and restarting the internal combustion engine to output power. As such, an oscillation occurs at the 235th s during the power switch. At the 252nd s, the generator is turned off, the electric motor and internal combustion engine provide power simultaneously, and another oscillation is caused by this power switch. At the 256th s, the vehicle speed stabilizes at 70 km/h. At the 306th s, the electric motor stops outputting power, and the vehicle starts to decelerate. At the 314th s, the internal combustion engine alone provides power, and the generator is started to maintain the vehicle speed at 50 km/h. At the 383rd s, the generator is turned off and the motor is started for acceleration. From the 396th s onward, the vehicle moves at a constant speed of 70 km/h until the 446th s. At this second, as the vehicle speed is required to be accelerated to 100 km/h, the motor increases its power to meet the system requirements. A brief oscillation due to the acceleration occurs at the 462nd s. At the 481st s, the vehicle starts to move at constant speed until the 510th s. After the 510th s, the motor increases the power again to increase the speed, such that an oscillation similar to that occurring at the 462nd s is again generated. After reaching 120 km/h at the 531st s, the vehicle moves at a constant speed. After the 541st s, the vehicle speed starts to decrease. At the 562nd s, the electric motor is turned off and the generator is started. At the 568th s, the internal combustion engine and generator are turned off. At this time, the motor is started, and the speed is reduced until the motor is turned off at the 572nd s. At the 573rd s, the vehicle returns to a standstill. Figure 10b shows a comparison with the long-term NEDC2000 experiment results, indicating that the control system established in this study can successfully complete the speed following even with the addition of more driving patterns.
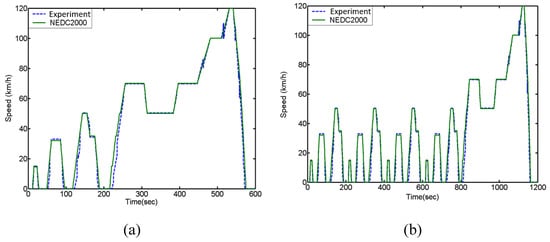
Figure 10.
Comparison graphs of (a) experimental results and driving test patterns, (b) experimental results and long-term NEDC2000.
4. Conclusions
In this study, the dynamic system model, hybrid power control module, and energy management control module are used to allow the internal combustion engine in the new parallel hybrid power system to operate in the optimal operating region under various driving conditions. When the driving demand is less than the output of the internal combustion engine, the control system starts the generator to help counteract the changes in the output torque caused by various resistances, so as to allow the internal combustion engine to maintain its optimal torque and speed output and avoid excessive fuel consumption. The control system developed with the NEDC2000 driving pattern test can meet the driving requirements of the vehicle. The following conclusions can be obtained from the experimental results.
- The fuzzy controller and energy management control module can decide, through the power integration and distribution mechanism, that whether the torque outputs of internal combustion engine, motor, and generator should be transmitted independently or simultaneously according to the low-, medium-, and high-power driving requirements.
- The torque of the output shaft of the power integration and distribution mechanism can indeed reach twice the input of the two power sources separately. As for the rotational speed, the output speeds of the two power sources are twice that of the output shaft. In addition, when the power demand of the vehicle exceeds the maximum output power of the electric motor, the internal combustion engine is used to provide power and the generator is turned on to convert the excess energy into electrical energy, which is saved in the battery as the power source of the electric motor.
- The eCVT mechanism between the wheel and the power integration mechanism brings benefits, especially under changing driving demands, as it achieves smooth conversion and control of the reduction ratio, so that the torque output of the power integration mechanism is not significantly affected during the power switch.
- In most cases, the difference between the experimental results and driving test speed is not large. However, oscillations occur during the last two accelerations during high-speed driving, which can be suppressed by adding a switch on the Fuzzy controller.
Supplementary Materials
The following are available online at https://www.mdpi.com/2076-3417/10/16/5467/s1. Figure S1: Dynamic system model made by Matlab/Simulink®; Figure S2: System dynamic module; Figure S3: Specification of combustion engine; Figure S4: Energy management control strategy module made by Matlab/Simulink®.
Author Contributions
Conceptualization, P.-T.C.; methodology, P.-T.C.; software, P.-T.C.; validation, P.-T.C. and K.D.H.; formal analysis, P.-T.C.; investigation, P.-T.C.; resources, C.-J.Y.; data curation, P.-T.C.; writing—original draft preparation, P.-T.C. and C.-J.Y.; writing—review and editing, P.-T.C. and C.-J.Y.; visualization, P.-T.C.; supervision, C.-J.Y. and K.D.H. All authors have read and agreed to the published version of the manuscript.
Funding
Authors thank the financial support from Ministry of Science and Technology, Taiwan, under grant numbers MOST 109-2221-E-027-008-MY2, MOST 109-2221-E-027-020, MOST 108-2622-E-020-006-CC3 and MOST 108-2113-M-002-021-MY2.
Conflicts of Interest
The authors declare no conflict of interest.
References
- Kalghatgi, G. Is it really the end of internal combustion engines and petroleum in transport? Appl. Energy 2018, 225, 965–974. [Google Scholar] [CrossRef]
- Agudelo, A.F.; Garcia-Contreras, R.; Agudelo, J.R.; Armas, O. Potential for exhaust gas energy recovery in a diesel passenger car under European driving cycle. Appl. Energy 2016, 174, 201–212. [Google Scholar] [CrossRef]
- Karvonen, M.; Kapoor, R.; Uusitalo, A.; Ojanen, V. Technology competition in the internal combustion engine waste heat recovery: A patent landscape analysis. J. Clean. Prod. 2016, 112, 3735–3743. [Google Scholar] [CrossRef]
- Schmuch, R.; Wagner, R.; Horpel, G.; Placke, T.; Winter, M. Performance and cost of materials for lithium-based rechargeable automotive batteries. Nat. Energy 2018, 3, 267–278. [Google Scholar] [CrossRef]
- Cano, Z.P.; Banham, D.; Ye, S.Y.; Hintennach, A.; Lu, J.; Fowler, M.; Chen, Z.W. Batteries and fuel cells for emerging electric vehicle markets. Nat. Energy 2018, 3, 279–289. [Google Scholar] [CrossRef]
- Feng, X.N.; Ouyang, M.G.; Liu, X.; Lu, L.G.; Xia, Y.; He, X.M. Thermal runaway mechanism of lithium ion battery for electric vehicles: A review. Energy Storage Mater. 2018, 10, 246–267. [Google Scholar] [CrossRef]
- Wu, Y.; Zhang, L. Can the development of electric vehicles reduce the emission of air pollutants and greenhouse gases in developing countries? Transp. Res. D Transp. Environ. 2017, 51, 129–145. [Google Scholar] [CrossRef]
- Martinez, C.M.; Hu, X.S.; Cao, D.P.; Velenis, E.; Gao, B.; Wellers, M. Energy management in plug-in hybrid electric vehicles: Recent progress and a connected vehicles perspective. IEEE Trans. Veh. Technol. 2017, 66, 4534–4549. [Google Scholar] [CrossRef]
- Sabri, M.F.M.; Danapalasingam, K.A.; Rahmat, M.F. A review on hybrid electric vehicles architecture and energy management strategies. Renew. Sustain. Energy Rev. 2016, 53, 1433–1442. [Google Scholar] [CrossRef]
- Huang, Y.J.; Wang, H.; Khajepour, A.; He, H.W.; Ji, J. Model predictive control power management strategies for HEVs: A review. J. Power Sources 2016, 341, 91–106. [Google Scholar] [CrossRef]
- Chen, P.T.; Pai, P.H.; Yang, C.J.; Huang, K.D. Transmission systems for parallel hybrid electric vehicles. Appl. Sci. 2019, 9, 1538. [Google Scholar] [CrossRef]
- Hoang, N.T.; Yan, H.S. Configuration synthesis of novel series-parallel hybrid transmission systems with eight-bar mechanisms. Energies 2017, 10, 1044. [Google Scholar] [CrossRef]
- Xiao, R.; Liu, B.; Shen, J.; Guo, N.; Yan, W.; Chen, Z. Comparisons of energy management methods for a parallel plug-in hybrid electric vehicle between the convex optimization and dynamic programming. Appl. Sci. 2018, 8, 218. [Google Scholar] [CrossRef]
- Kim, H.; Wi, J.; Yoo, J.; Son, H.; Park, C.; Kim, H. A study on the fuel economy potential of parallel and power split type hybrid electric vehicles. Energies 2018, 11, 2103. [Google Scholar] [CrossRef]
- Lukic, S.; Emadi, A. Effects of drivetrain hybridization on fuel economy and dynamic performance of parallel hybrid electric vehicles. IEEE Trans. Veh. Technol. 2004, 53, 385–389. [Google Scholar] [CrossRef]
- Niels, J.S.; Mutasim, A.S.; Naim, A.K. Fuzzy logic control for parallel hybrid vehicles. IEEE Trans. Control Syst. Technol. 2002, 10, 460–468. [Google Scholar]
- Teng, L.; Xiaosong, H.; Shengbo, E.L.; Dongpu, C. Reinforcement learning optimized look-ahead energy management of a parallel hybrid electric vehicle. IEEE ASME Trans. Mechatron. 2017, 22, 1497–1507. [Google Scholar]
- Shuhan, W.; Xingshuai, H.; José, M.L.; Xiangyang, X.; Peng, D. Fuzzy adaptive-equivalent consumption minimization strategy for a parallel hybrid electric vehicle. IEEE Access 2019, 7, 133290–133303. [Google Scholar]
- Buntin, D.L.; Howze, J.W. A switching logic controller for a hybrid electric/ICE vehicle. Proc. Am. Control Conf. 1995, 2, 1169–1175. [Google Scholar]
- Berenji, H.R.; Ruspini, E.H. Experiments in multiobjective fuzzy control of hybrid automotive engines. In Proceedings of the IEEE 5th International Fuzzy Systems, New Orleans, LA, USA, 11 September 1996; Volume 1, pp. 681–686. [Google Scholar]
- Koo, E.S.; Lee, H.D.; Sul, S.K.; Kim, J.S. Torque control strategy for a parallel hybrid vehicle using fuzzy logic. IEEE Ind. Appl. Conf. 1998, 3, 1715–1720. [Google Scholar]
- Cikanek, S.R.; Bailey, K.E.; Baraszu, R.C.; Powell, B.K. Control system and dynamic model validation for a parallel hybrid electric vehicle. Proc. Am. Control Conf. 1999, 2, 1222–1227. [Google Scholar]
- Baumann, B.M.; Washington, G.; Glenn, B.C.; Rizzoni, G. Mechatronic design and control of hybrid electric vehicles. IEEE ASME Trans. Mechatron. 2000, 5, 58–72. [Google Scholar] [CrossRef]
- Lin, C.C.; Filipi, Z.; Wang, Y.; Louca, L.; Peng, H.; Assanis, D.; Stein, J. Integrated, Feed-Forward Hybrid Electric Vehicle Simulation in SIMULINK and Its Use for Power Management Studies; SAE Technical Paper; SAE International: Warrendale, PA, USA, 2001; 2001-01-1334. [Google Scholar]
- Delprat, S.; Guerra, T.M.; Paganelli, G.; Lauber, J.; Delhom, M. Control strategy optimization for an hybrid parallel powertrain. Proc. Am. Control Conf. 2001, 2, 1315–1320. [Google Scholar]
- Chau, K.T.; Wong, Y.S. Overview of power management in hybrid electric vehicles. Energy Convers. Manag. 2002, 43, 1953–1968. [Google Scholar] [CrossRef]
- Schouten, N.J.; Salman, M.A.; Kheir, N.A. Energy management strategies for parallel hybrid vehicles using fuzzy logic. Control Eng. Pract. 2003, 11, 171–177. [Google Scholar] [CrossRef]
- Wong, J.S.; Langari, R. Intelligent energy management agent for a parallel hybrid vehicle. Proc. Am. Control Conf. 2003, 3, 2560–2565. [Google Scholar]
- Langari, R.; Won, J.S. Integrated drive cycle analysis for fuzzy logic based energy management in hybrid vehicles. In Proceedings of the 12th IEEE International Conference Fuzzy Systems, St Louis, MO, USA, 25–28 May 2003; Volume 1, pp. 290–295. [Google Scholar]
- Sciarretta, A.; Back, M.; Guzzella, L. Optimal control of parallel hybrid electric vehicles. IEEE Trans. Control Syst. Technol. 2004, 12, 352–363. [Google Scholar] [CrossRef]
- Delprat, S.; Lauber, J.; Guerra, T.M.; Rimaux, J. Control of a parallel hybrid powertrain: Optimal control. IEEE Trans. Veh. Technol. 2004, 53, 872–881. [Google Scholar] [CrossRef]
- Kheir, N.A.; Salman, M.A.; Schouten, N.J. Emissions and fuel economy trade-off for hybrid vehicles using fuzzy logic. Math. Comput. Simul. 2004, 66, 155–172. [Google Scholar] [CrossRef]
- Won, J.S.; Langari, R. Intelligent energy management agent for a parallel hybrid vehicle—Part ii: Torque distribution, charge sustenance strategies, and performance results. IEEE Trans. Veh. Technol. 2005, 54, 935–953. [Google Scholar] [CrossRef]
- Chou, C.H.; Chen, P.T.; Yang, C.J.; Huang, K.D. Functionalization of Wireless Control and Fuzzy Systems to Hybrid Mini-Loaders. IEEE Access 2020, 8, 80914–80921. [Google Scholar] [CrossRef]
© 2020 by the authors. Licensee MDPI, Basel, Switzerland. This article is an open access article distributed under the terms and conditions of the Creative Commons Attribution (CC BY) license (http://creativecommons.org/licenses/by/4.0/).