Outdoor Testing to Compare the Technical and Economic Aspects of Single-and Dual-Fluid Photovoltaic/Thermal (PV/T) Systems

Abstract
:1. Introduction
2. Experimental Details
2.1. Methodology
- The PV module temperature and thermal and electrical gains are calculated based on hourly variations of solar radiation and dry bulb temperature. Summation of hourly data is used to obtain daily outputs, and subsequently the daily outputs are summed up for calculating the monthly gains.
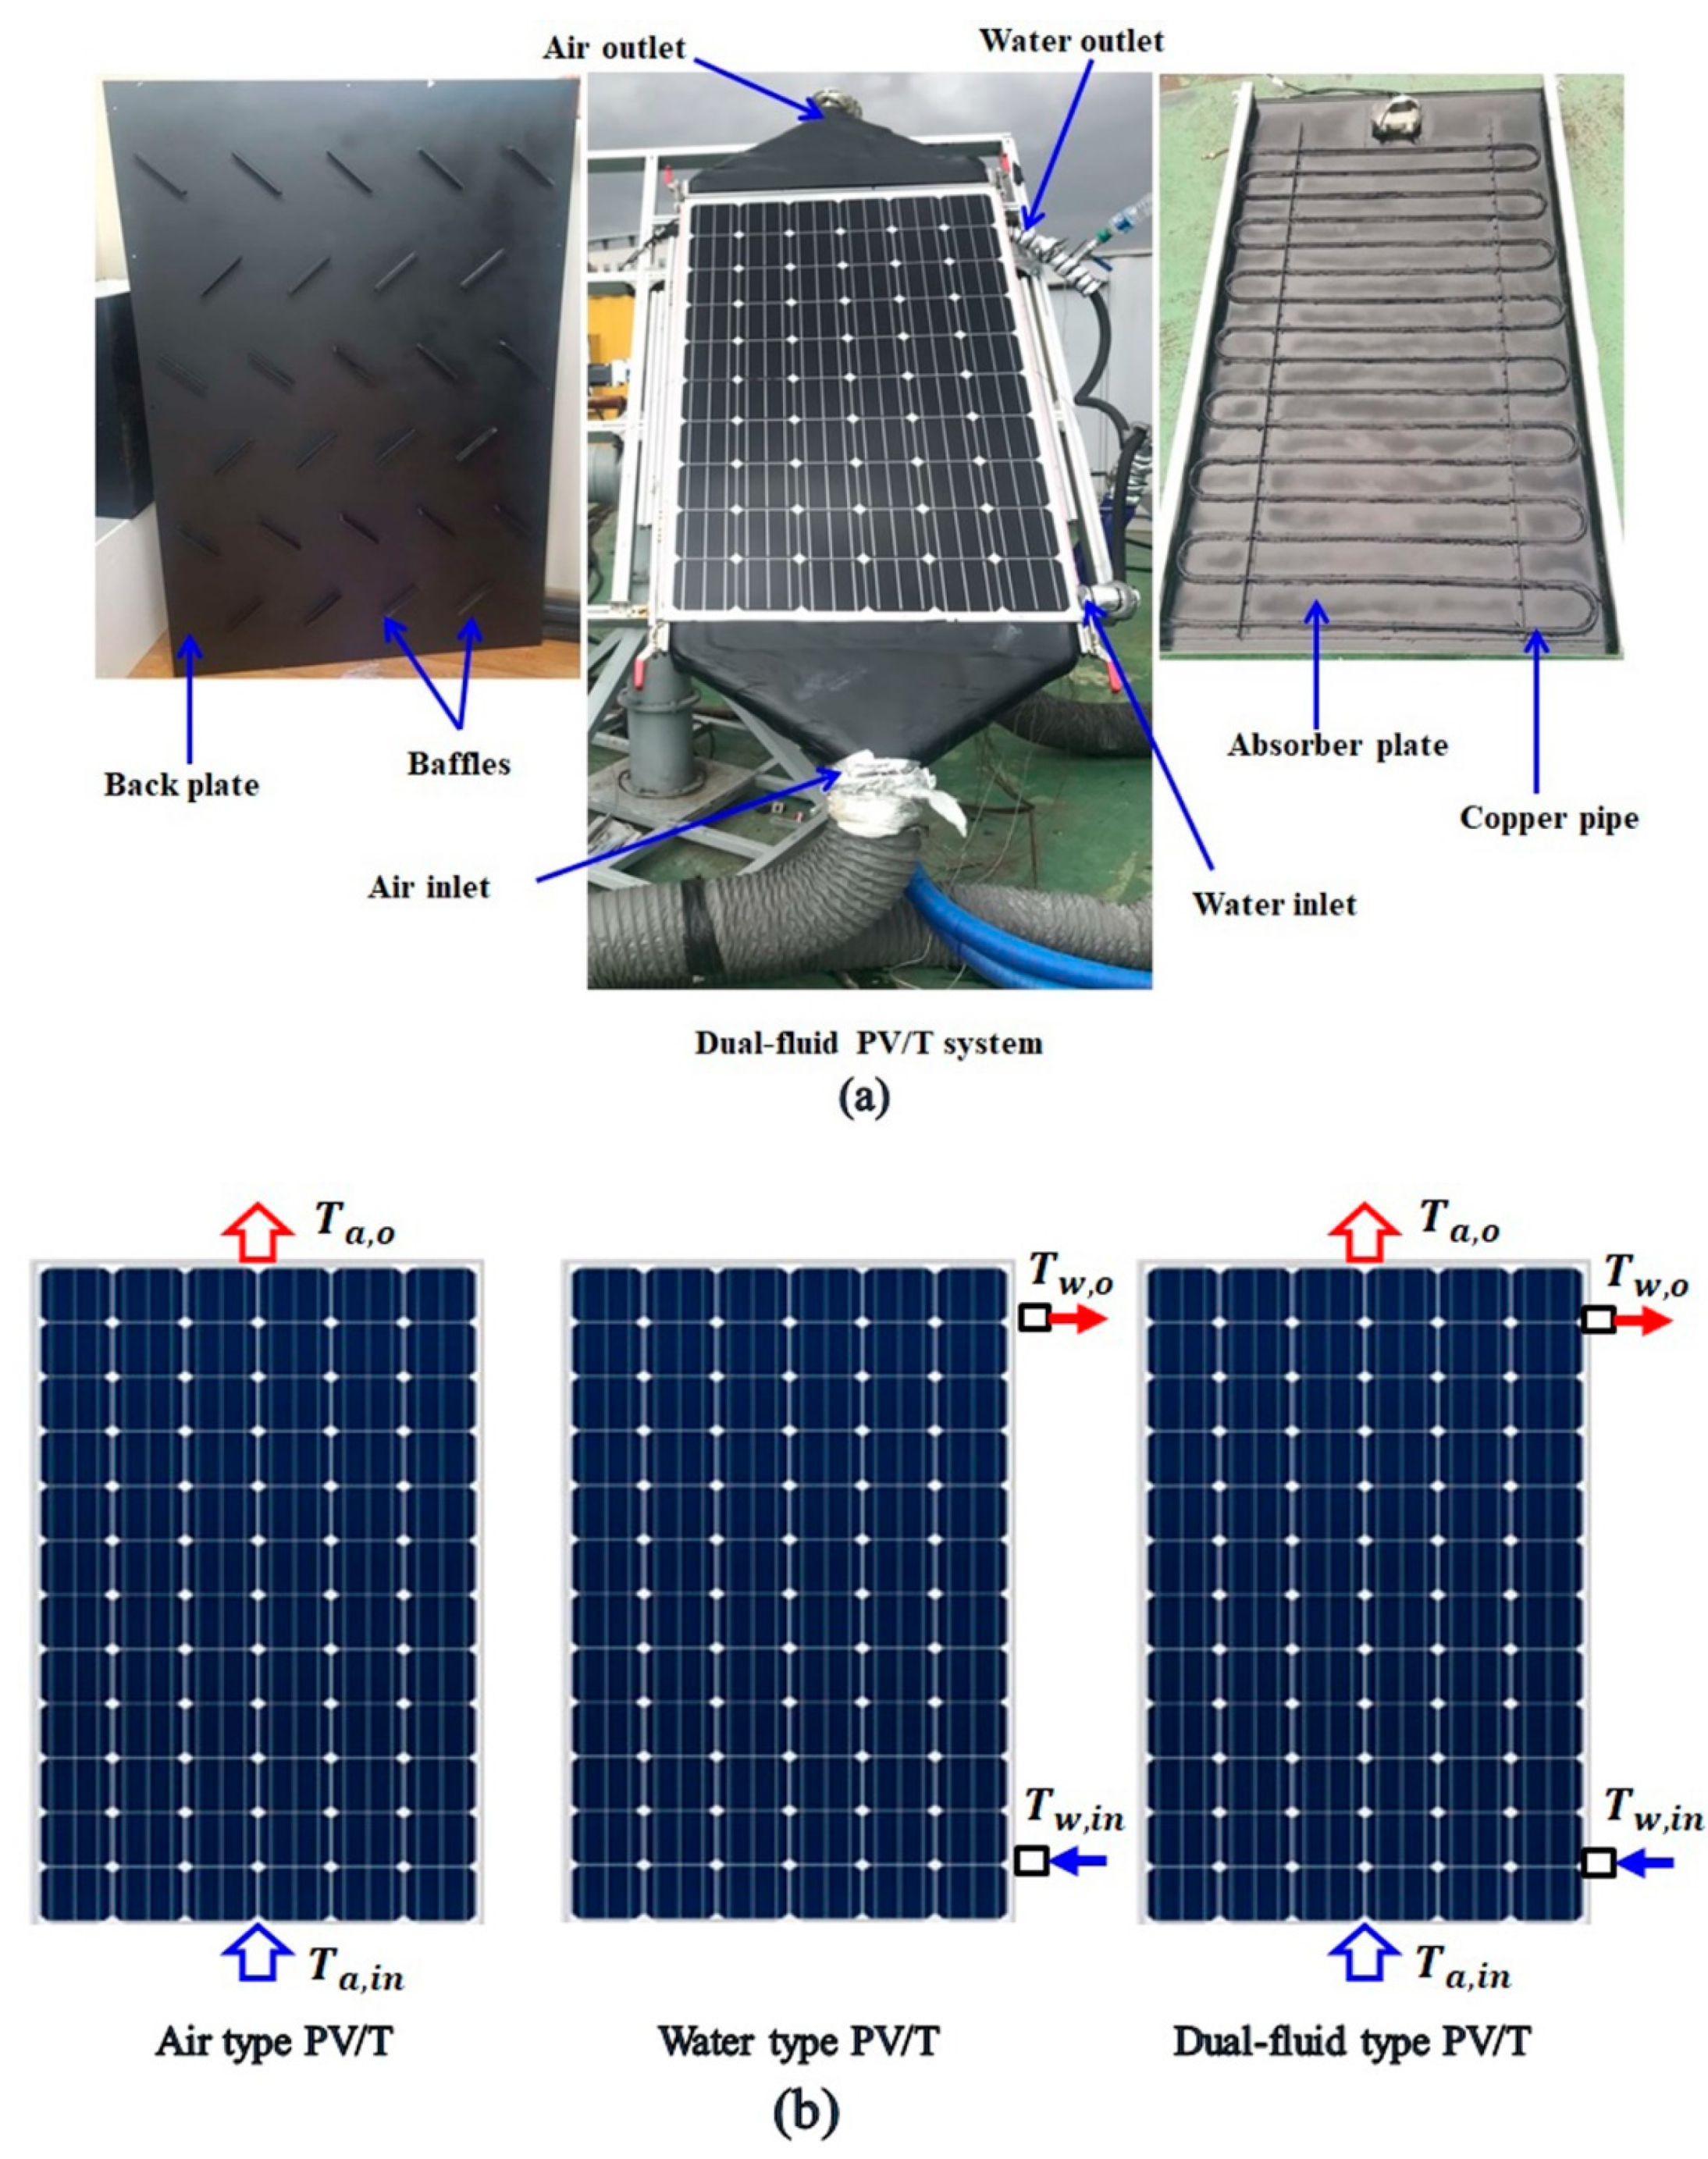
- The proposed PV/T system is designed to be used for all aforementioned flow schemes such as air, water, and air plus water. During single-fluid operation, the second fluid is kept stagnant, with a zero mass flow rate.
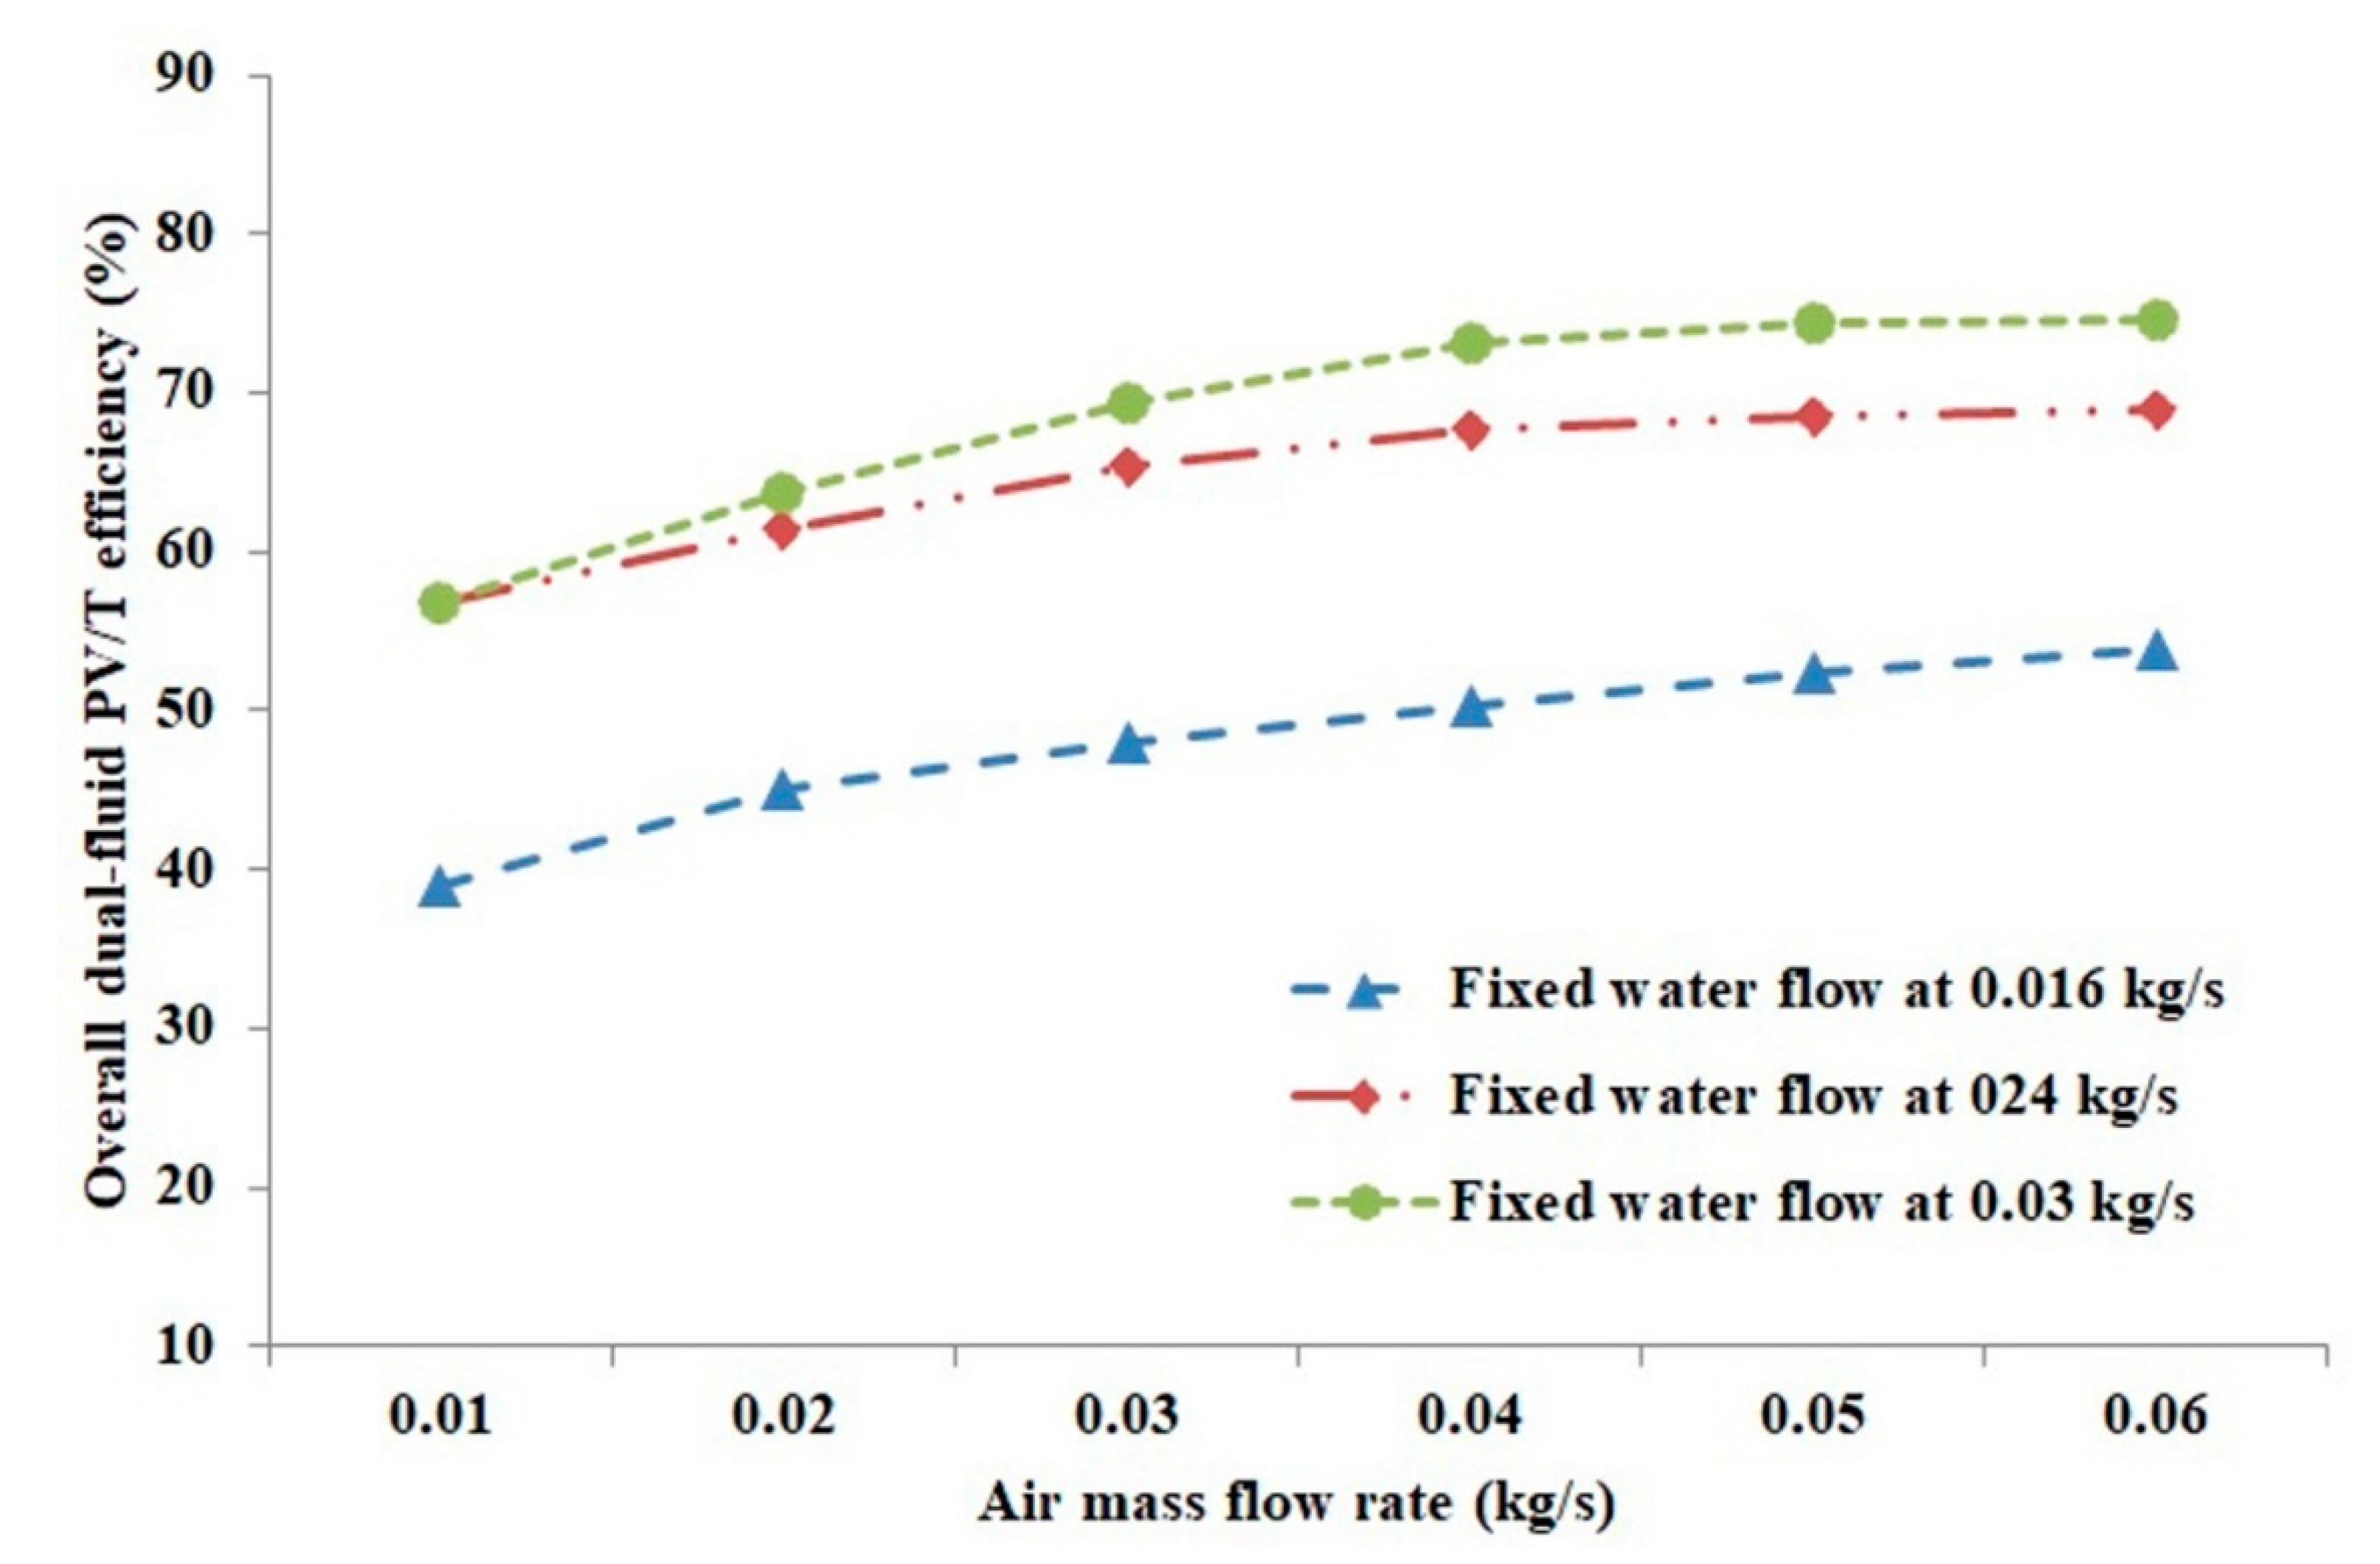
- In the case of the dual-fluid heat exchanger, the optimal flow rate for each fluid is identified in such a way that the flow rate of any of the two fluids is varied over a range from 0 to 0.03 kg/s for water and 0 to 0.06 kg/s for air, while during this variation the second fluid is kept fixed at different flow regions such as laminar, transitional and turbulent.
- Exergy efficiency is calculated based on solar radiation and the thermal and electrical outputs.
- An economic analysis is performed based on energy and exergy performance of a PV/T system with dual and single fluid heat exchangers, and considering life cost analysis parameters such as initial cost, annual savings, and return on investment.
2.2. Design and Operation Details
3. Analysis
3.1. Energy Study
3.2. Exergy Study
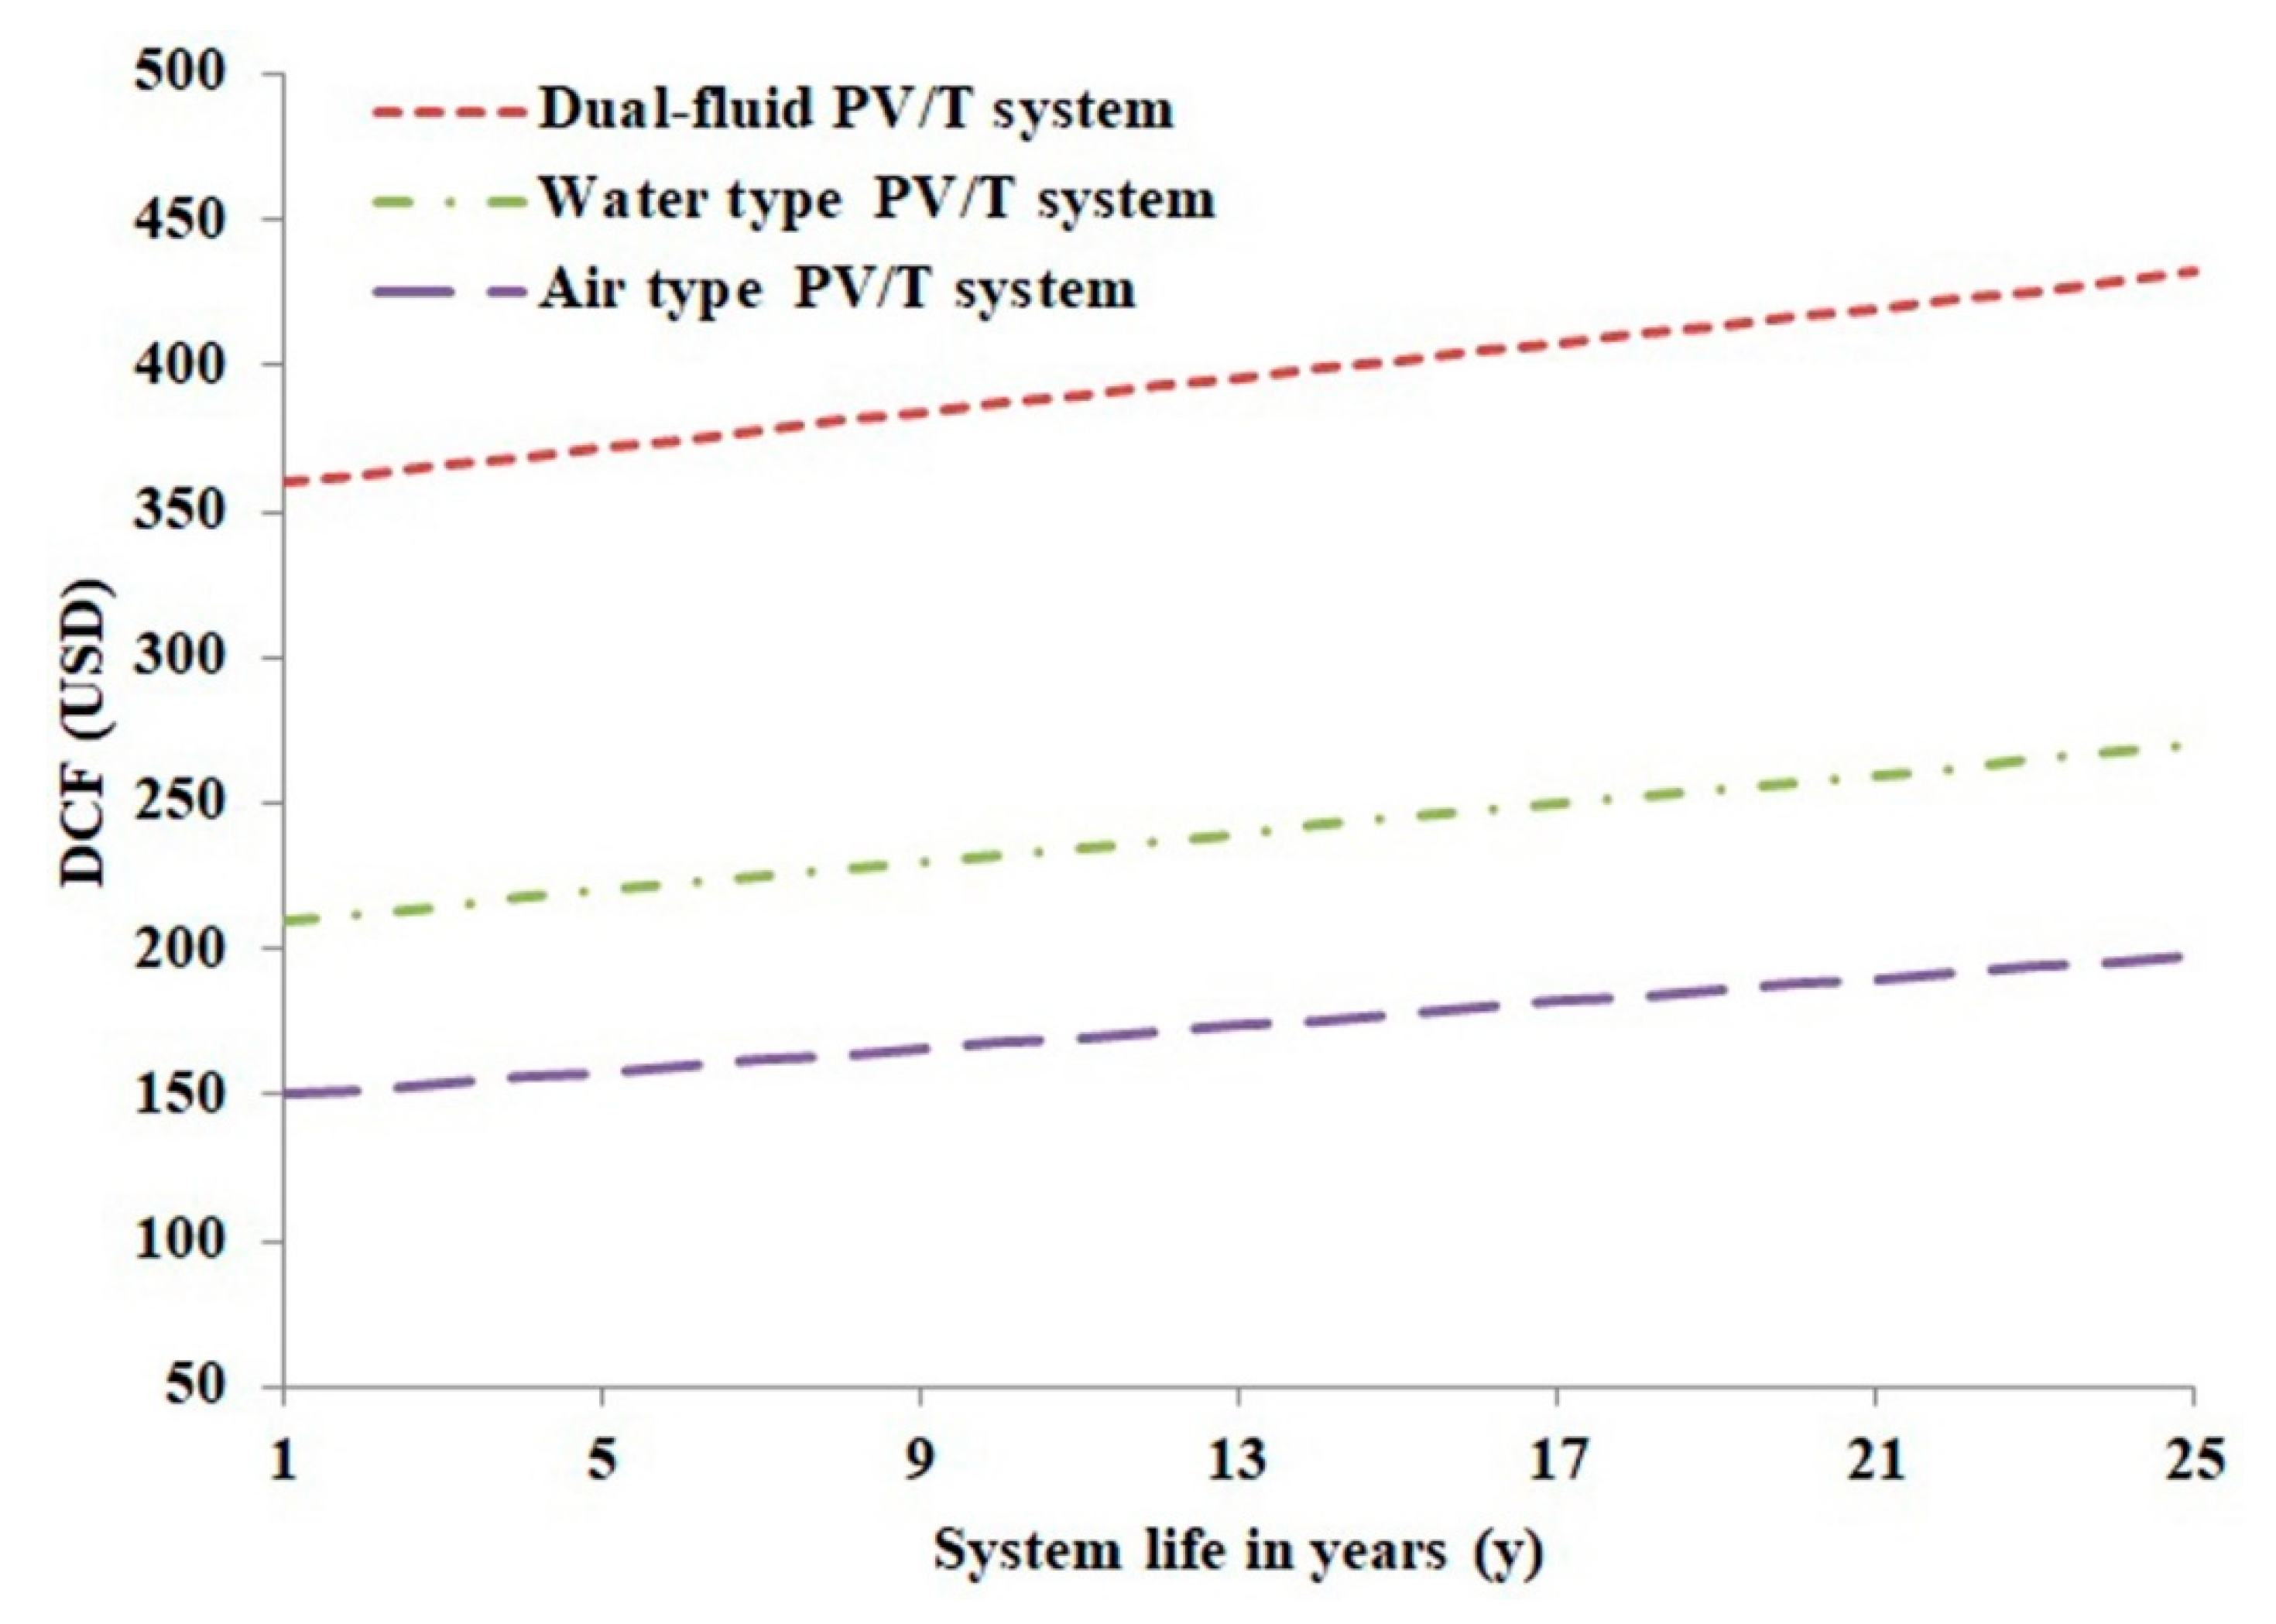
3.3. Economic Study
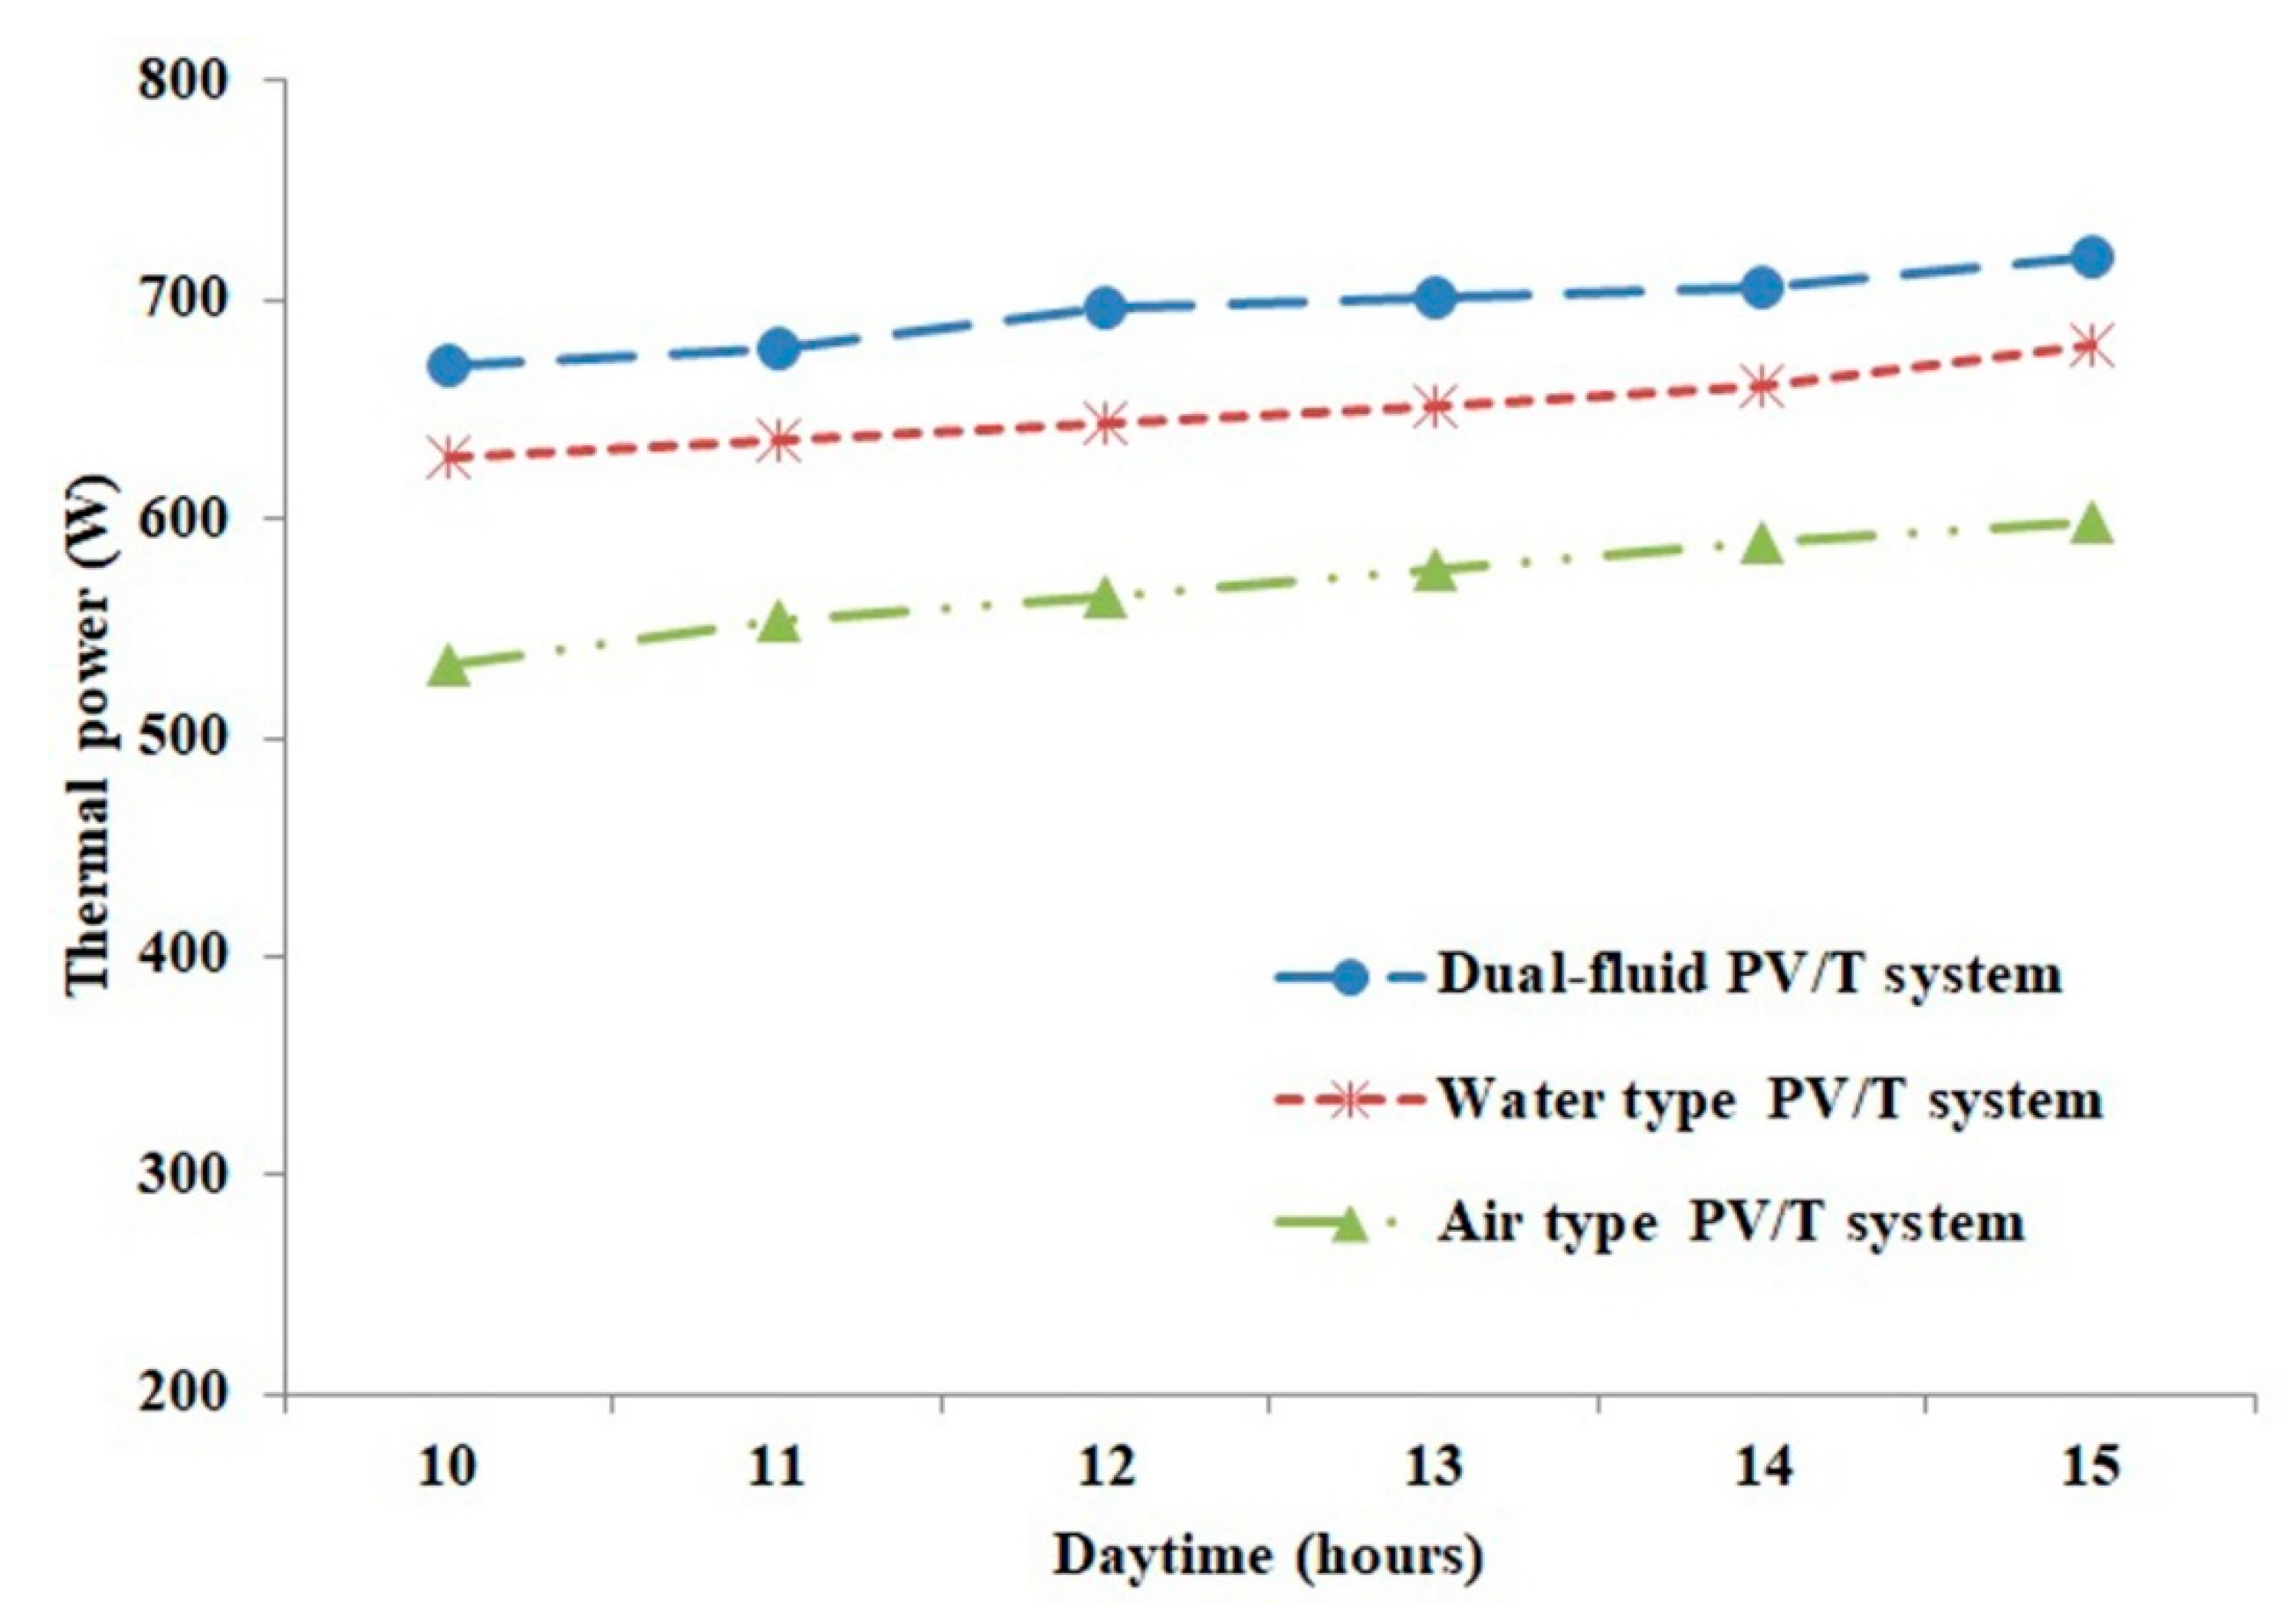
4. Results and Discussion
5. Conclusions
Author Contributions
Funding
Conflicts of Interest
Nomenclature
| mass flow rate (kg/s) | |
| specific heat (J/kg °C) | |
| temperature (°C) | |
| surface area (m2) | |
| power (W) | |
| solar radiation (W/m2) | |
| net present value | |
| discounted cash flow | |
| cash flow | |
| annual electricity saved by PV/T system | |
| annual electricity saved by electrical load | |
| annual electricity saved by thermal load | |
| annual degradation of electrical performance | |
| annual degradation of thermal performance | |
| domestic electricity cost | |
| embodied energy (J) | |
| Greek | |
| exergy rate | |
| efficiency | |
| exergy thermal efficiency | |
| exergy electrical efficiency | |
| total exergy efficiency by PV/T system | |
| inflation rate | |
| discount rate | |
| domestic electricity inflation rate | |
| Subscripts | |
| circulating water | |
| circulating air | |
| in | Inlet |
| o | Outlet |
| ambient air | |
| th | thermal |
| el | electrical |
| tot | Total |
| max | maximum |
| sc | short circuit |
| oc | open circuit |
References
- Lari, M.O.; Sahin, A.Z. Design, performance and economic analysis of a nanofluid-based photovoltaic/thermal system for residential applications. Energy Convers. Manag. 2017, 149, 467–484. [Google Scholar] [CrossRef]
- Lertsatitthanakorn, C.; Khasee, N.; Atthajariyakul, S.; Soponronnarit, S.; Therdyothin, A.; Suzuki, R.O. Performance analysis of a double-pass thermoelectric solar air collector. Sol. Energy Mater. Sol. Cells 2008, 92, 1105–1109. [Google Scholar] [CrossRef] [Green Version]
- Kumar, A.; Baredar, P.; Qureshi, U. Historical and recent development of photovoltaic thermal (PVT) technologies. Renew. Sustain. Energy Rev. 2015, 42, 1428–1436. [Google Scholar] [CrossRef]
- Hussain, M.I.; Kim, J.-H.; Kim, J.-T. Nanofluid-powered dual-fluid photovoltaic/thermal (pv/t) system: Comparative numerical study. Energies 2019, 12, 775. [Google Scholar] [CrossRef] [Green Version]
- Wolf, M. Performance analyses of combined heating and photovoltaic power systems for residences. Energy Convers. 1976, 16, 79–90. [Google Scholar] [CrossRef]
- Florschuetz, L.W. Extension of the Hottel-Whillier model to the analysis of combined photovoltaic/thermal flat plate collectors. Sol. Energy 1979, 22, 361–366. [Google Scholar] [CrossRef]
- Hendrie, S.D. Photovoltaic/Thermal Collector Development Program; Lincoln Lab., Massachusetts Inst. of Tech.: Lexington, KY, USA, 1982; Final Report. [Google Scholar]
- Raman, V.; Tiwari, G. A comparison study of energy and exergy performance of a hybrid photovoltaic double-pass and single-pass air collector. Int. J. Energy Res. 2009, 33, 605–617. [Google Scholar] [CrossRef]
- Hossain, M.; Pandey, A.; Selvaraj, J.; Rahim, N.A.; Islam, M.; Tyagi, V. Two side serpentine flow based photovoltaic-thermal-phase change materials (PVT-PCM) system: Energy, exergy and economic analysis. Renew. Energy 2019, 136, 1320–1336. [Google Scholar] [CrossRef]
- Fan, W.; Kokogiannakis, G.; Ma, Z. Optimisation of life cycle performance of a double-pass photovoltaic thermal-solar air heater with heat pipes. Renew. Energy 2019, 138, 90–105. [Google Scholar] [CrossRef]
- Özakin, A.N.; Kaya, F. Effect on the exergy of the PVT system of fins added to an air-cooled channel: A study on temperature and air velocity with ANSYS Fluent. Sol. Energy 2019, 184, 561–569. [Google Scholar] [CrossRef]
- Ibrahim, A.; Othman, M.Y.; Ruslan, M.H.; Alghoul, M.; Yahya, M.; Zaharim, A.; Sopian, K. Performance of photovoltaic thermal collector (PVT) with different absorbers design. WSEAS Trans. Environ. Develop. 2009, 5, 321–330. [Google Scholar]
- Omojaro, A.; Aldabbagh, L. Experimental performance of single and double pass solar air heater with fins and steel wire mesh as absorber. Appl. Energy 2010, 87, 3759–3765. [Google Scholar] [CrossRef]
- Elsafi, A.M.; Gandhidasan, P. Comparative study of double-pass flat and compound parabolic concentrated photovoltaic–thermal systems with and without fins. Energy Convers. Manag. 2015, 98, 59–68. [Google Scholar] [CrossRef]
- Tripanagnostopoulos, Y. Aspects and improvements of hybrid photovoltaic/thermal solar energy systems. Sol. Energy 2007, 81, 1117–1131. [Google Scholar] [CrossRef]
- Othman, M.Y.; Hamid, S.; Tabook, M.; Sopian, K.; Roslan, M.; Ibarahim, Z. Performance analysis of PV/T Combi with water and air heating system: An experimental study. Renew. Energy 2016, 86, 716–722. [Google Scholar] [CrossRef]
- Abu Bakar, M.N.; Othman, M.; Hj Din, M.; Manaf, N.A.; Jarimi, H. Design concept and mathematical model of a bi-fluid photovoltaic/thermal (PV/T) solar collector. Renew. Energy 2014, 67, 153–164. [Google Scholar] [CrossRef]
- Yazdanifard, F.; Ebrahimnia-Bajestan, E.; Ameri, M. Performance of a parabolic trough concentrating photovoltaic/thermal system: Effects of flow regime, design parameters, and using nanofluids. Energy Convers. Manag. 2017, 148, 1265–1277. [Google Scholar] [CrossRef]
- Watt, M.E.; Johnson, A.J.; Ellis, M.; Outhred, H.R. Life-cycle air emissions from PV power systems. Prog. Photovolt. Res. Appl. 1998, 6, 127–136. [Google Scholar] [CrossRef]
- Barnwal, P.; Tiwari, G. Life cycle energy metrics and CO2 credit analysis of a hybrid photovoltaic/thermal greenhouse dryer. Int. J. Low-Carbon Technol. 2008, 3, 203–220. [Google Scholar] [CrossRef]
- KEPCO. Available online: https://home.kepco.co.kr/kepco/EN/F/htmlView/ENFBHP00103.do?menuCd=EN060201 (accessed on 20 March 2020).
- Economics, T. TRADING ECONOMICS. Available online: https://tradingeconomics.com/south-korea/inflation-cpi (accessed on 15 January 2020).


| Cell Type Silicon | Mono-Crystalline |
|---|---|
| Module size | 1619 × 979 mm |
| Pmax | 260 W |
| Vmax | 31.6 V |
| Imax | 8.23 A |
| Voc | 38.1 V |
| Isc | 9.27 A |
| Aperture ratio | 48% (8 mm holes) |
| Equipment | Uncertainty |
|---|---|
| Pyranometer | <±1.5% per year |
| K-type Thermocouples | ±0.25–0.5 °C |
| PT100 Ω | ±0.1 °C |
| Flow meter | ±0.5% at full scale |
| Multi-meter | ±0.1% |
| Data logger | K-type: ±(0.05% of reading + 1.0 °C); PT100: ±0.8 °C |
| Fitting of elements | ±0.1 °C |
| Dual-Fluid PV/T System | Single-Fluid PV/T System | |
|---|---|---|
| Components | Price (USD) | Price (USD) |
| PV module | 150 | 150 |
| Heat exchanger | 530 | 290 for water type and 260 for air type |
| Charge controller | 150 | 150 |
| Digital flow meter | 120 | 120 |
| Pump | 90 | - |
| Air blower | 60 | - |
| Pump or Air blower | - | 90 or 60 |
| Water Tank (for water-type only) | 100 | 100 |
| Piping or ducting | 90 | 60 for piping and 50 for ducting |
| Installation | 150 | 150 |
| Total | 1440 | 1100 for water type and 940 for air type |
| Description | Values |
|---|---|
| Total investment | 1440 USD for dual-fluid, 1100 USD for water type, and 940 USD for air type |
| Annual maintenance cost | 15 USD |
| Cost of electricity [21] | 0.077 USD per kW/h |
| Domestic electricity inflation rate | 2.0% |
| Inflation rate [22] | 1.5% |
| Discount rate [22] | 0.5% |
| Annual degradation of PV & heat exchanger performances [1] | 1% and 1.5% |
| Life of system | 25 |
© 2020 by the authors. Licensee MDPI, Basel, Switzerland. This article is an open access article distributed under the terms and conditions of the Creative Commons Attribution (CC BY) license (http://creativecommons.org/licenses/by/4.0/).
Share and Cite
Hussain, M.I.; Kim, J.-T. Outdoor Testing to Compare the Technical and Economic Aspects of Single-and Dual-Fluid Photovoltaic/Thermal (PV/T) Systems. Appl. Sci. 2020, 10, 5641. https://doi.org/10.3390/app10165641
Hussain MI, Kim J-T. Outdoor Testing to Compare the Technical and Economic Aspects of Single-and Dual-Fluid Photovoltaic/Thermal (PV/T) Systems. Applied Sciences. 2020; 10(16):5641. https://doi.org/10.3390/app10165641
Chicago/Turabian StyleHussain, Muhammad Imtiaz, and Jun-Tae Kim. 2020. "Outdoor Testing to Compare the Technical and Economic Aspects of Single-and Dual-Fluid Photovoltaic/Thermal (PV/T) Systems" Applied Sciences 10, no. 16: 5641. https://doi.org/10.3390/app10165641