Abstract
A regional-scale landslide early warning system was developed in collaboration with a city government. The structure and distinctive features of the system are described in detail. This system employs the principles of the sequential evaluation method that consecutively applies three different evaluation stages: statistical, physically based, and geomorphological evaluations. Based on this method, the system determines five phases of warning levels with improved levels of certainty and credibility. In particular, the warning levels are systematically derived to enable the discrimination of slope failures and debris flows. To provide intuitive and pragmatic information regarding the warning capabilities of the system, a comprehensive performance analysis was conducted. Early warning level maps were generated and a historical landslide database was established for the study period from 2009 to 2016. As a result, 81% of historical slope failures and 86% of historical debris flows were correctly predicted by high-class warning levels. Miscellaneous details associated to the timing efficiency of warnings were also investigated. Most notably, five high-class warning level events and four landslide events were recorded for a study region during the eight-year period. The four landslide events were all successfully captured by four out of the five warning events.
1. Introduction
Catastrophic geological disasters caused by rainfall-induced landslides are increasing worldwide [1,2,3,4]. In South Korea, various sources have persistently reported dramatic increases in the frequency and scale of landslide disasters since the 2000s [5,6]. As Petley [7] points out, landslide damages in urban areas have particularly increased since the 2000s due to land development in hillside areas (given the persistent extension of urban and residential areas into hilly terrain), changes in precipitation trends, and population growth. In response to such circumstances, an increasing amount of focus has been directed towards landslide forecasting and the development of landslide early warning systems (hereafter referred to as LEWSs). According to Guzzetti et al. [8] and Piciullo et al. [9], territorial (or regional-scale) early warning systems are or have been operational over multiple territories across the world with various coverage boundaries: catchment [10], citywide [11,12,13], regionwide [14,15,16], and nationwide scales [17,18,19]. A majority of territorial LEWSs share a common feature involving the implementation of empirical rainfall or hydrological thresholds that rely on statistical analyses of historical rainfall and landslide information. Although these are widely preferred and convenient tools, such thresholds have been mostly oriented toward providing temporal decisions regarding early warnings without taking into consideration the effects of geophysical and geo-hydrological properties that are spatially variable; in rare cases, researchers such as Peruccacci et al. [20] suggested various regional thresholds that consider variations in environmental settings such as topography and lithology. As a result, a significant portion of past and present operational regional-scale LEWSs have not been favorable options in spatially constraining early warning information and providing physical bases. Whereas physically based landslide prediction models are actively suggested and examined in the academic field, it is still rare to find purely physically based models that have progressed to the level of achieving successfully operational LEWS at a regional scale [21].
The evaluation of the regional-scale LEWS performance is another important element in constructing a validated and credible LEWS. Nevertheless, no clear standard has been suggested as of yet to systematically evaluate the early warning performance of LEWSs, and in many cases LEWSs were operated without quantitative or qualitative performance analyses [8]. The majority of the cases that analyzed the performance of LEWSs were basically rooted on the concept of contingency tables [22] that combine two types of binary outcomes in general: true positive (event occurrence with prediction), true negative (no event occurrence with no prediction), false positive (no event occurrence with prediction; false prediction), and false negative (event occurrence with no prediction; missed prediction). From this concept, a variety of useful performance indicators [23] and skill scores [24,25] have been devised to measure the prediction capability of models. However, although such indicators and scores are used as popular and effective indices for evaluating models, they may be insufficient to a certain degree from the perspective of LEWS users (i.e., the public or decision-makers) for the following reasons. First, different terminologies are used interchangeably and it is sometimes difficult to intuitively recognize the meanings of certain terms. For example, “the probability of detection”, “true positive rate”, “hit rate”, and “sensitivity” have the same definition but are used interchangeably. Meanwhile, there are several indices with different definitions but intuitively indistinguishable terminologies. For example, it is difficult to intuitively tell apart the different practical meanings between the two different indices, “the probability of false detection” and “the probability of false alarm”. Second, all model indicators based on contingency tables ultimately refer to the degree in which a model can correctly predict events by reducing the frequency of false and missed predictions to a minimum. However, although certain pragmatic information related to early warnings is essentially required, such information is not obtainable from the model indicators.
This paper first provides a technical note that briefly describes the development, structure, principles, and techniques of a citywide landslide early warning system that has distinct features in several aspects. The LEWS implemented by the government of Busan, the second largest city in South Korea, is based on the sequential evaluation method proposed by Park et al. [21] (hereafter referred to as SEM-LEWS). By using time-varying rainfall data, the LEWS applies three consecutive evaluation stages at each time step: statistical, physically based, and geomorphological evaluations. As a result, the LEWS generates an early warning map that can be classified according to five levels at each near-real-time step with improved credibility and spatial constraints. Each of the five warning level classes defines its own unique interpretation based on the theoretical backgrounds of the evaluating thresholds. In addition, the system is designed to enable the discriminative warning of debris flows from other landslide types by assigning the highest warning level.
On the other hand, the performance analysis of this study aimed to provide pragmatic information on the comprehensive warning capabilities of the SEM-LEWS in Busan by quantitatively evaluating the conformity of the five warning level classes to their respective theoretical interpretations. The analysis was conducted based on the simulation results of the SEM-LEWS operation that involved generating a series of early warning level maps for the eight-year period from 2009 to 2016. This paper describes in detail the systematic processes involved in establishing an effective historical landslide database that classifies 186 slope failure and 36 debris flow data. With consideration of several distinctive features of the SEM-LEWS, this study addresses the processes that are undertaken to systematically evaluate the early warning performance of the SEM-LEWS from various perspectives. The performance analyses were carried out for two independent categories: prediction statistics of historical landslide data and temporal performance. As a result, the analyses resulted in miscellaneous pragmatic details regarding early warning capabilities in a probabilistic or quantitative form. Insights on the potential limitations of the performance analyses and suggestions for future study are also discussed.
2. Landslide Early Warning System for Busan: SEM-LEWS
2.1. Principles of Landslide Early Warning System: Sequential Evaluation Method
In this study, we designed a landslide early warning system for Busan to evaluate the hazard of rainfall-induced landslides and determine appropriate warning levels based on the principles of the sequential evaluation method proposed by Park et al. [21]. As shown in Figure 1, the proposed early warning system is characterized by five distinct warning levels (Null, Attention, Watch, Alert, and Emergency) that are driven by a decision-making algorithm. The algorithm sequentially uses three different evaluation stages to determine appropriate warning levels. The first evaluation phase is a statistical evaluation, initiated at the “Null” warning level. This evaluation uses two different, statistically defined rainfall thresholds in combination with a statistically derived geo-spatial threshold to determine whether the warning level should be raised to “Attention.” The two rainfall thresholds are the rainfall intensity–duration threshold (I–D curve) and the extreme rainfall-induced landslide index (IERL), while the geo-spatial threshold is represented by a landslide susceptibility index (ILS). If the outcome of the first evaluation is to raise the warning level to “Attention,” the second evaluation phase is initiated. The second stage, a physically based evaluation, applies critical continuous rainfall (CRCritical) to determine whether to increase the warning level to “Watch” or further to “Alert.” Here, if the observed or predicted rainfall reaches 70 or 100% of a physically derived critical rainfall amount, the warning level will be increased to “Watch” or “Alert,” respectively. If the warning level is determined as “Alert,” the decision-making algorithm enters the third and final evaluation stage. This third evaluation phase is a geomorphological evaluation, where a debris flow mobilization index (IDF) is used to evaluate several geomorphological factors and thereby determine whether the warning level should be increased to the highest level of “Emergency.”
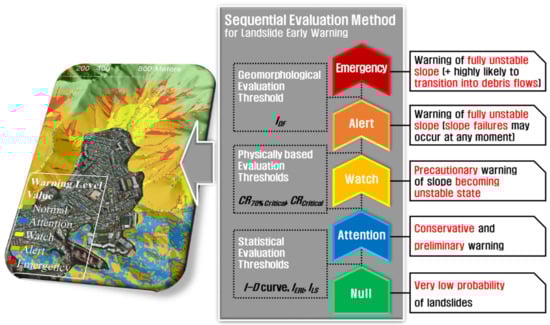
Figure 1.
Conceptual diagram of the sequential evaluation method used for landslide early warnings, including three evaluation stages and hazard interpretations of each warning level [21].
Using a series of thresholds grouped in terms of theoretical backgrounds, each of the five warning levels offers specific theoretical interpretations of landslide hazards. Firstly, by using lower limits of the three statistically defined thresholds, “Attention” represents a conservative and preliminary warning that advises for preemptive preparations. Secondly, both “Watch” and “Alert” warnings focus on slope instability from a physically based perspective. Specifically, “Watch” functions as a precautionary warning to extend response time prior to a slope becoming unstable, while “Alert” indicates that a slope has become completely unstable and that a slope failure may occur at any point. Thirdly, “Emergency” indicates that a slope is completely unstable and, in addition, the potential failed mass of the slope is highly likely to transition into channelized debris flows, which can have severe physical and social implications for surrounding communities.
Further detailed information regarding the sequential evaluation method including the relevant decision-making algorithm, theories of constituent thresholds, required parameter datasets, and processes to generate early warning level maps are described in Park et al. [21].
2.2. Development and Structure of SEM-LEWS
Busan is the second largest city in South Korea with an area that extends up to ~770 km2 populated by 3.5 million people. The city has historically been considered as a relatively vulnerable location from a geographical perspective due to the frequent landslide disasters that have occurred. A great portion of the city’s area is composed of forested mountainous terrain, and an increasing amount of land is being developed for housing and infrastructure to the point where such sites extend out to hillside locations. As a result, physical and social damages incurred by landslides have been persistently reported for several years [26,27,28,29]. The most prevailing landslide types are shallow landslides and debris flows induced by intense rainfall concentrated within several hours [30,31].
Although the Korea Forest Service operates a nationwide landslide early warning system that uses an empirically defined soil-water-index threshold [32] to share warning information with local governments in Korea, the accuracy and credibility of the warning information has often been limited when applied at the level of public activations. Through an agreement (memorandum of understanding) with the local government of Busan on a mutual working-level cooperation, our research group was able to implement a test-operational citywide landslide early warning system within the disaster safety management division of the Busan local government, in July 2017. Within this context, Figure 2 and Table 1 illustrate the structure and offer a summary of the main specifications of the SEM-LEWS, respectively. The system can be organized into different data sources, a main server, and a GIS-based graphical user interface within the national disaster management platform called Smart Big Board [33]. In the system, two different modules run independently according to temporal hazard evaluation specifications. The “Nowcasting” module determines current early warning levels for landslides using near-real-time recorded rainfall data obtained from 51 rain gauges distributed over the Busan area, while the “Forecasting” module determines landslide early warning levels 24 h in advance, primarily by using predicted rainfall data obtained from the Korea Meteorological Administration (KMA). The time required for the main server to perform a series of processes ranging from processing raw data for input parameters to generating and visualizing landslide early warning level maps for Busan is between 5 and 8 min, and this processing time is shorter than the time interval (10 min) to call the now-recorded rainfall data. Therefore, in our study, the update frequency of the landslide early warning level map for the “Nowcasting” module was set to 10 min, which is considered sufficient for the near real-time monitoring of sharply increasing landslide hazard levels. Furthermore, the Forecasting module was set to update early warning level maps every 6 h to correspond with the update interval of the rainfall prediction data from the KMA.
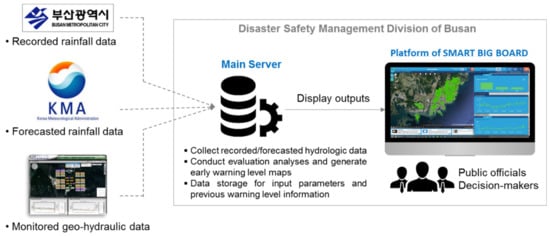
Figure 2.
Structure of the landslide early warning system for Busan based on the sequential evaluation method.

Table 1.
Specifications of the landslide early warning system for Busan based on the sequential evaluation method [21].
All calculations related to the decision-making algorithm of the sequential evaluation method were performed by the main server, which also stored all required input parameter datasets and previously generated warning level maps.
In the two designated landslide-prone valley sites, ground-monitoring instruments (including volumetric water content and matric suction sensors) were installed to monitor slope hydrological parameters. These data were transmitted every 10 min and stored on the main server. Through a comparative study, the cumulated monitoring data allows for the validation and updating of numerically analyzed rainfall infiltration modeling results used to derive a physically based threshold (CRCritical) for the SEM-LEWS.
Two landslide early warning level maps with different spatial resolutions were generated as final outputs from the single evaluation cycles of each module as follows: a specific areal warning map and an administrative warning map. The specific areal warning map includes warning level information with a spatial resolution of 5 × 5 m that helps identify warning levels related to specific areas and establish localized management plans (Figure 3a), while the administrative warning map provides individual warning level information for each primary administrative division area (Figure 3b). This allows for the rapid identification of representative warning levels per primary administrative division and thus, assists in the making of efficient and swift decisions in response to potential disasters. The outputs (landslide early warning level maps) are displayed on the GIS-based interface of Smart Big Board, which supports public officials or other decision-makers in charge of disaster management in making timely and appropriate decisions with improved certainty and efficiency. Additionally, other supplemental information on geo-properties, as well as real-time-collected rainfall tracking information relative to the thresholds of IERL, I-D curve, and CRCritical, and landslide historical information, among others, can be displayed on the system interface.
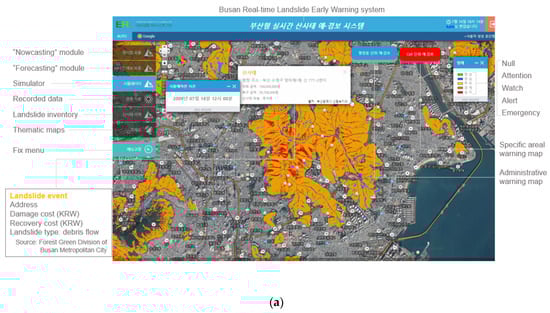
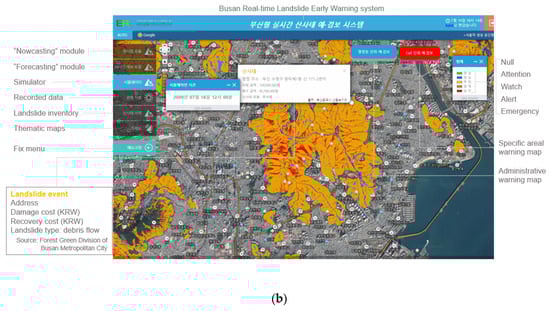
Figure 3.
Two different types of landslide early warning level maps obtained from a landslide early warning system based on the sequential evaluation method including (a) a specific areal warning map and (b) an administrative warning map.
3. Performance Analysis of SEM-LEWS Based on the Simulation Results of 8-Year Histories
3.1. Study Framework
The performance analyses were conducted based on the simulation results of SEM-LEWS operation over a period of eight years from 2009 to 2016. The rainfall input data during the eight-year period were sourced from the 17 KMA observatories that are distributed in and adjacent to the Busan area; the 51 city-owned rain gauges introduced in Section 2.2. were not feasible sources in this study as these gauges were installed and have been in operation since 2017. As shown in Figure 4, the entire area of Busan can be divided into 17 Thiessen polygon areas by black lines based on the locations of the distributed KMA observatories. In this study, each Thiessen area was considered as a unit region that exhibits independent and homogeneous meteorological behaviors (i.e., rainfall characteristics). Therefore, raster dataset layers of rainfall input parameters were generated in such a way that data values are equal within each Thiessen area. By using hourly-recorded rainfall data from the KMA observatories, early warning level maps in the form of a raster dataset were generated with an interval of 1 h for the rainy seasons (June to October) of the study period.
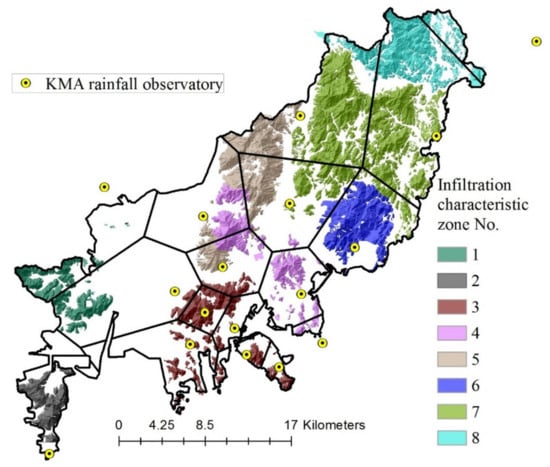
Figure 4.
Map of eight infiltration characteristic (IC) zones and 17 Korea Meteorological Administration (KMA) rainfall observatories distributed within and near the Busan territory.
On the other hand, historical landslide data with valid quality and sufficient quantity constitute an important basis for testing the performance of landslide early warning systems at a regional scale. Therefore, a GIS historical landslide database was constructed by determining time and location information using several effective methods. Detailed processes are described in detail in the Section 3.2 and Section 4.1. The data were collected in two categories depending on its landslide type: slope failure or debris flow. This is important information to test the discriminative capabilities of the SEM-LEWS in terms of debris flows that tend to cause significant damage to surrounding communities. Moreover, the collected historical landslide data were reclassified and analyzed according to the infiltration characteristic zone in which they are located. As shown in Figure 4, the mountainous areas of Busan were divided into eight different zones by considering geographical and geological features. These zones are denoted as infiltration characteristic zones (hereafter referred to as IC zones). It was presumed that unique and homogeneous geo-hydrological features are exhibited throughout each IC zone.
The SEM-LEWS performance in terms of early warnings was examined according to two categories depending on the focus of early warning performance: analysis of the prediction statistics of historical landslide data and temporal performance analysis. Figure 5 depicts the framework of the performance analysis conducted in this study.
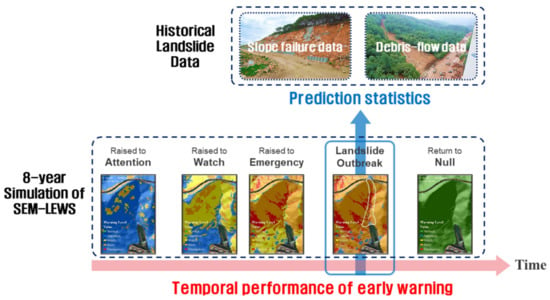
Figure 5.
Performance analysis framework of the landslide early warning system for Busan applying the sequential evaluation method.
Firstly, to analyze the prediction statistics, the relevance and accuracy of the warning level that was issued at each location of the collected historical landslide events were investigated for a particular fixed time (i.e., its occurrence time). In other words, for the simulated historical eight-year period, the prediction statistics were derived to provide answers for the following pragmatic questions: (1) Had appropriate warning levels been assigned when the landslide occurred? (2) How correctly did the warnings issued discriminate between slope failure and debris flow? (3) How many landslides occurred without the issuing of warnings (i.e., in the “Null” level)?
Secondly, for the temporal performance analysis, several quantitative warning capabilities associated to timing were analyzed for a study region with high landslide-frequency. From the perspective of users (i.e., decision makers or the public), this analysis was conducted to provide probabilistic or quantitative information as answers for the following pragmatic questions: (1) How often is a warning event expected each year? (2) What is the probability of landslides occurring given that an early warning has been issued? (3) As a particular warning level is issued, how much time can one expect to be left before landslide incidents probably take place?
3.2. Establishment of Historical Landslide Database Using Indirect Field-Checks
In our study, a historical landslide database was used to analyze and validate the developed landslide early warning system. The database consists of information on 317 reported landslides that occurred in Busan between 1999 and 2016. Primary information on these historical landslides was obtained from various sources, including landslide documents from the local government of Busan, articles from internet news archives, landslide files obtained from the National Institute of Forest Science, as well as information from several district offices and a local university in Busan. These primary sources, in a text data sheet format, generally included the following information: date of landslide occurrence, landslide location using either a road-name or land-lot format, surrounding landmarks or buildings, area of damage, and recovery costs. In an effort to construct a point feature GIS dataset that identifies landslide source areas, all landslide locations reported in the primary sources were indirectly field-checked using maps provided by Google Earth and two South Korean web portals (Naver and Daum). These map services provide annual satellite imagery, as well as aerial photographs, and street views to the public (Figure 6). The aerial photographs shown in Figure 7 represent the indirect field-check method, where a reported landslide location sourced from primary data sheets was aerial-photographed by a web portal service (Kakao Map) before and after the landslide (Figure 7a and b, respectively). By comparing the two photographs, information on the precise location of the landslide source area and landslide type (debris flow or slope failure) could be obtained.
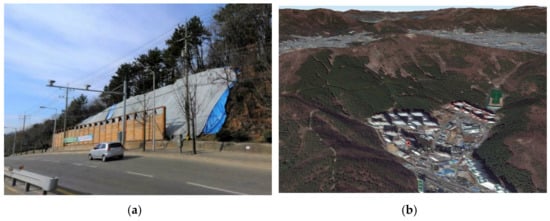
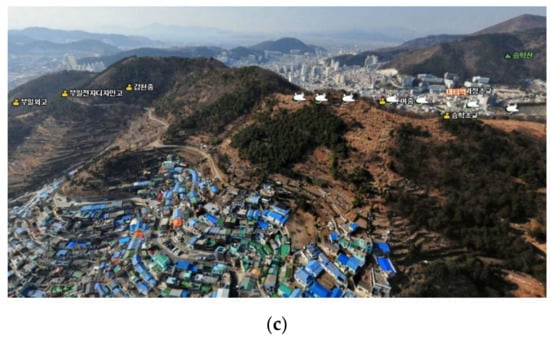
Figure 6.
Map services provided by Google Earth and South Korean web portals including (a) street view [mar]; (b) satellite imagery (Google Earth) and (c) aerial views [34].
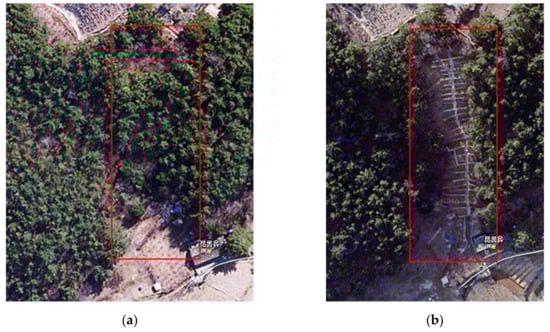
Figure 7.
Explanation of the indirect field-check method using map services from a web portal [35], with aerial photographs taken (a) before and (b) after landslide occurrence.
Based on these processes, a database consisting of 317 historical landslide data points was established in the form of GIS point feature classes (Figure 8a). Within this context, Table 2 specifies the number of GIS landslide data points according to landslide occurrence date and spatial precision class. The GIS historical landslide data was classified into three hierarchical groups according to the spatial precision of the estimated landslide source area. First-class spatial precision data included data with landslide initiation source areas clearly confirmed through indirect field-checks. Second-class spatial precision data included data with specific landslide locations, but with a lower confidence level compared to first-class data, due to a lack of confirmation through indirect field checks. Error distances of second-class data points from actual landslide initiation source areas were estimated to be less than 50 m. The first and second-class data were considered applicable for refined validation analyses on spatial performances of advanced models. Third-class spatial precision data, however, included somewhat randomly marked landslide locations within the respective boundaries of administrative areas provided by the primary sources. This is due to the provided administrative boundaries being too broad to specify landslide locations, in addition to failure to find evidential areas of landslide occurrence from indirect field checks. The maximum error distance of third-class data points from actual landslide initiation source areas was estimated to be approximately 400 m. Due to such low spatial precision, the third-class landslide data was only considered for analyses that were less sensitive to the spatial precision of historical landslide data. This included analyses associated with susceptibility zonation as well as rainfall-threshold derivation and validation at the regional- or national-scale.
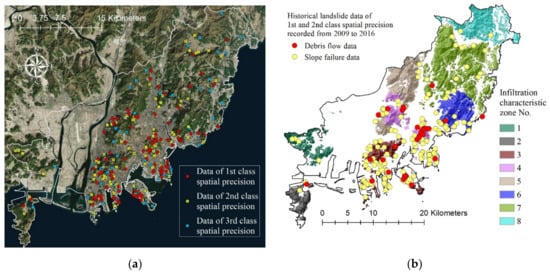
Figure 8.
Historical landslide database in the form of GIS point feature classes including the distribution of (a) data recorded from 1999 to 2016 and classified by spatial precision and (b) 1st and 2nd class spatial precision data recorded from 2009 to 2016 and reclassified by landslide type.
Table 2.
Classification of historical landslide data according to occurrence date and spatial precision.
The established historical landslide database included data on various types of landslides that could be classified as “slope failure” and “debris flow.” Figure 8b depicts the distribution of debris flow and slope failure data recorded from 2009 to 2016 with 1st and 2nd class spatial precision. Due to the lack of detailed event descriptions for each slope failure, it was not feasible to further categorize the data. Therefore, the slope failure category included landslides caused by the failure of both natural slopes as well as artificial slopes, such as embankments, retaining walls, and cut or fill slopes. However, as the source area of the majority of debris flows was located at the head of gullies in mountainous areas, the majority of recorded debris flows are highly likely to have been spontaneously induced by rainfall with negligible influence of human activities. Table 3 specifies the numbers of slope failures and debris flows depicted in Figure 8b according to the respective IC zone. This dataset includes 222 data points and was used to analyze the performance of SEM-LEWS in our study.
Table 3.
Reclassification of 1st and 2nd class historical landslide data recorded from 2009 to 2016, according to the infiltration characteristic (IC) zone and landslide type.
Notably, as indicated in Figure 8, the majority of historical landslides are distributed in the south-central part of Busan (i.e., IC zones 3 and 4), which is the most populated and urbanized region of the city. This implies that the primary data sources showed a bias towards recording damage-causing landslide events, which, in turn, indicates that regions with sparsely distributed historical landslide data (e.g., IC zones 1, 2, and 8) do not necessarily represent areas of more stable geological or meteorological conditions. The relatively sparse distribution of historical landslide data in the northeastern and southwestern areas of Busan may be because landslides triggered in outer areas or deep mountainous areas had a lower chance of being reported, as they are unlikely to have a significant impact on society.
4. Results and Discussion
4.1. Analysis of Prediction Statistics of Historical Landslide Data
In this study, we ran simulations of the SEM-LEWS operation to generate a series of landslide early warning level maps for the Busan area during the rainy season (June to October) over an eight-year period (2009–2016). During this period, the city of Busan experienced eight days in which at least one landslide was recorded. The previously introduced historical data of 186 slope failures and 36 debris flows in Figure 8b and Table 3 were all recorded during these eight days. Ideally, the timing information of each historical landslide forms the basis of the model’s evaluation, for example, an evaluation of the prediction results from the SEM-LEWS model. Especially in terms of rainfall-induced landslides, hourly-, or minute-scale timing information is necessary, as most landslide-triggering rainfall in Korea tends to be concentrated over a few hours, and therefore, landslide hazards can vary greatly over an hour. However, it is almost impossible to obtain minute-scale individual occurrence times for such a large number of historical landslides. This is primarily due the majority of primary sources used for constructing the historical landslide database being compiled by public officials and thus, in most cases, only containing information on the occurrence date or period and not the exact time of occurrence. Such uncertainties arising from the lack of the accurate landslide occurrence time information have been reported by various landslide-modelling researchers [36,37,38]. In our study, we obtained minute-scale time information for only a limited number of the 222 historical landslide data points, and these were mostly sourced from internet news archives. To obtain relevant incident times for the remainder of the historical landslides, the following assumptions were made: (1) historical landslides recorded during a particular rainstorm and distributed within the same IC zone have a negligible difference in occurrence time and thus, can be said to have occurred at the same time; (2) in the case of an IC zone containing more than one landslide with recorded occurrence times, the earliest recorded time can be used as the representative occurrence time of the IC zone for conservative evaluations; (3) in the case of an IC zone in which no landslide occurrence time information is present, the representative landslide occurrence time was postulated by considering that of adjacent IC zones with the same lithological conditions and comparatively analyzing cumulative landslide-triggering rainfall patterns of adjacent IC zones.
In terms of assumption (2), our study contained two cases in which multiple landslide-timing records were present within an IC zone on the same date. The time difference between the records was not significantly large for both cases, specifically, 1 h and 1 h 8 min, respectively. Brand [39] concluded that a large number of landslides are triggered near the peaks of severe rainstorms. In the case of a landslide where only the occurrence date and rainfall event are known, Brunetti et al. [40] considered the time (hour) of the last rainfall measurement of the day on which the landslide occurred as the landslide occurrence time. As such, determining the correct landslide occurrence time remains a limiting factor in landslide research that uses historical data. Table 4 represents the landslide occurrence times and IC zones for landslides that occurred on each of the eight landslide event dates. The representative times with superscript “P” are those that were postulated in compliance with assumption (3).
Table 4.
Representative landslide occurrence times per infiltration characteristic (IC) zones in which landslides occurred on the eight landslide event dates.
In the next step, early warning levels at the respective landslide occurrence times were investigated for each of the 222 historical landslide records using early warning level maps. These maps were generated using an hourly interval, as historical rainfall data from the KMA observatories were also recorded hourly. Therefore, the early warning level maps that correspond to the rounded-down hours of the respective landslide occurrence times were used to determine early warning levels of the historical landslide events. In addition, a polygon circle centered around each historical data point with a 50 m radius was used as the domain area for determining a representative early warning level for each historical landslide. The radius of 50 m was determined in reference to the maximum possible error distance of the 2nd class spatial precision data points, as the 222 historical landslide records contained either 1st or 2nd spatial precision data. Among the early warning levels of the grid cells (5 × 5 m) constituting the domain area, the early warning level assigned to the largest number of cells was considered as the representative early warning level of that domain area. In the case of the highest “Emergency” level, however, the domain area was represented by this level only if the number of cells classified as “Emergency” exceeded half the maximum number of cells that could be assigned this warning level within the domain area. This is because the area to which the “Emergency” level can be assigned is limited to debris-flow-prone areas by a geomorphologically fixed threshold (i.e., IDF = 0.8).
Among the 222 historically recorded landslides, 186 (84%) were categorized as slope failures and 36 (16%) as debris flows. In Figure 9, the recorded landslides are grouped into the two landslide types, and sub-grouped according to assigned warning level at the respective time of occurrence. The “Alert” and “Emergency” levels were interpreted as states in which slopes are saturated to the point of imminent danger of failure, and states in which possible failure masses are likely to mobilize as debris flow, respectively. Therefore, ideal predictions would forecast all 186 slope failures within the “Alert” level and all 36 debris flows within the “Emergency” warning level. Results from our analyses indicate that 81% (150/186) of slope failures and 86% (31/36) of debris flows were correctly predicted by the “Alert” and “Emergency” warning levels, respectively. More specifically, there were no cases of slope failures incorrectly predicted as “Emergency” or debris flows wrongly predicted by “Alert”, which shows the ability of the system to discriminate between slope failure and debris flows. The results also indicate that 17% ((12 + 20)/186) of slope failures were incompletely predicted by conservative (or low) warning levels (i.e., “Attention” and “Watch”). Considering that the interpretation of these two levels involves the possible occurrence of minor failures or erosive soil losses, it can be concluded that the SEM-LEWS succeeded in warning for 98% (182/186) of slope failures.
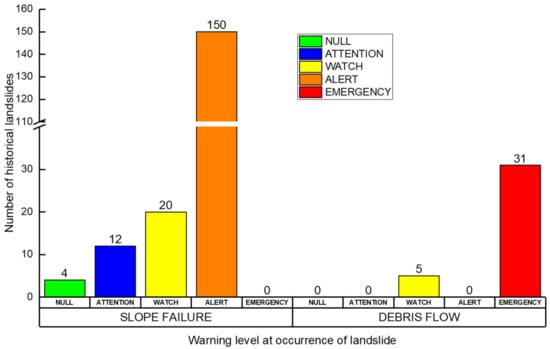
Figure 9.
Prediction results of historical landslide data based on the simulation of landslide early warning system applying the sequential evaluation method for the period of 2009–2016.
From the perspective of the fundamental purpose of early warning systems, i.e., to enable preparation for or avoidance of future danger, the most significant error of LEWS may be where landslides occurred without warning or with insufficient warning information (hereafter, referred to as missed-warning errors). Five debris flows were classified as having missed-warning errors due to warning levels only being raised to “Watch” at the time of occurrence. These five events were recorded during lower rainfall events that did not exceed thresholds of “Alert” and “Emergency” levels. Through indirect field checks and information from primary sources on damage area and recovery costs, the five events were found to be a type of minor erosive soil loss from valley channels and not large-scale debris flows. As for slope failures, four were classified to have occurred without warnings (i.e., “Null” level), and 32 occurred at low warning levels (i.e., “Attention” and “Watch”). Therefore, 36 of 186 slope failures (19%) occurred with lower rainfall than the threshold level for the “Alert” warning. We suggest that the relatively large dispersion of prediction results for slope failures, compared to that of debris flows, can be attributed to historical slope failure data that includes artificial as well as natural slopes (see Section 3.2.). As shown in Figure 10, the four slope failures that occurred without warning were found to be minor local failures of artificial slopes such as retaining walls, embankments, or cut slopes. Assuming that the respective landslide occurrence times are correct and rainfall was correctly recorded without rain gauge malfunction, these incidents indicate that the prediction of artificial slope failure may require the consideration of additional failure mechanisms and various uncertainties caused by human influence and slope-design factors.
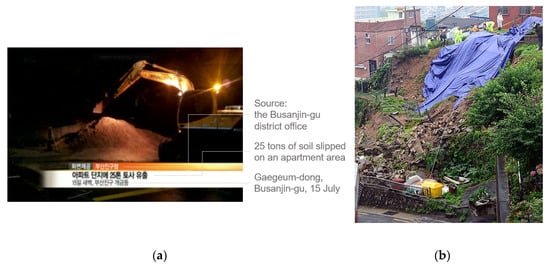
Figure 10.
Historical slope failures that occurred within the “Null” level including (a) soil loss of a cut slope in 2012 (captured from a Korean news video clip) and (b) failure of an embankment within a housing area in 2016.
Figure 11 shows the results of reclassifying predicted historical landslide data for each of the eight IC zones in Busan. While IC zones 1, 2, and 8 were regions with the least number of recorded landslides, IC zones 3 and 4 represented regions with the highest number of recorded landslides. As mentioned in Section 3.2., differences in the number of landslides depend on whether the regions were located in densely populated and urbanized areas. IC zones 1, 2, and 8 are located in the outskirts of Busan, where risk elements (people and infrastructure such as buildings and roads) are sparse. Therefore, the lower number of landslides in these areas compared to other IC zones do not necessarily indicate that they are geologically or meteorologically more stable. Although SEM-LEWS results satisfactorily predicted landslides that occurred in IC zones 3, 4, and 6, considering the large proportions of the landslides that occurred under the “Alert” and “Emergency” levels, the SEM-LEWS results did not effectively predict landslides in IC zone 5, as a large proportion of landslides occurred at relatively low warning levels (“Watch”, “Attention”, and “Null” levels).
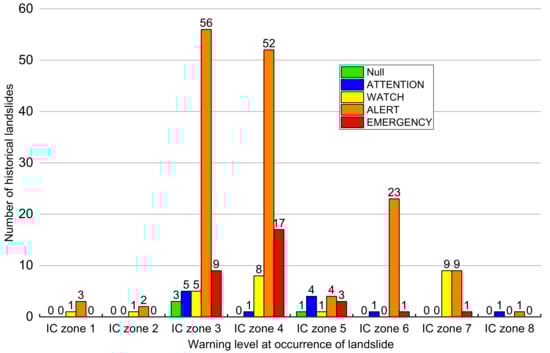
Figure 11.
Prediction results of historical landslide data in each of the eight infiltration characteristic (IC) zones in Busan.
4.2. Temporal Performance Analysis
In this section, the results of a temporal performance analysis of SEM-LEWS are described using historical rainfall and landslide data from Busan for the eight years from 2009 to 2016. For a temporal performance analysis, the scale of study area should be constrained to the point where causative factors of landslides, such as rainfall and geo-properties, are nearly homogeneous. Therefore, in this study, we selected a specific region (Figure 12) that has near-uniform meteorological and hydrogeological characteristics. In terms of meteorological characteristics, spatially uniform rainfall input data was generated for each of the 17 Thiessen districts that partition the entire Busan territory. In terms of hydrogeological characteristics, a part of IC zone 4 that overlaps with the Daeyeon Thiessen district was selected to reduce the spatial variability of hydrogeological characteristics. This was possible as IC zone boundaries demarcate areas with specific unsaturated soil characteristics so that slopes within each IC zone have near-homogeneous rainfall infiltration and subsurface water flow characteristics. In a physically based modelling study to define CRCritical thresholds of shallow landslides, Park [41] reported that, in Busan, infiltration characteristics related to unsaturated soil parameters play a bigger role in reducing slope stability than other geotechnical characteristics such as cohesion, friction angle, and slope angle. Therefore, it can be inferred that the selected region would exhibit near-uniform spatial changes regarding landslide hazard, and thus the same warning levels over the same time scales. Using historical rainfall data obtained from the Daeyeon rainfall observatory, the changes in warning levels over time were investigated for the specific region where the highest number of historical landslides were recorded within the Busan area. During the eight-year period, on four dates, landslides were recorded in this specific region (hereafter referred to as study region). The distribution of the recorded historical landslide data is shown in Figure 12. On each of the four dates, only one landslide record contained occurrence time information as follows: 09:23 on 7 July 2009, 10:40 on 16 July 2009, 10:20 on 27 July 2011, and 04:00 on 15 July 2012. The remainder of the historical landslides was assumed to have occurred concurrently.
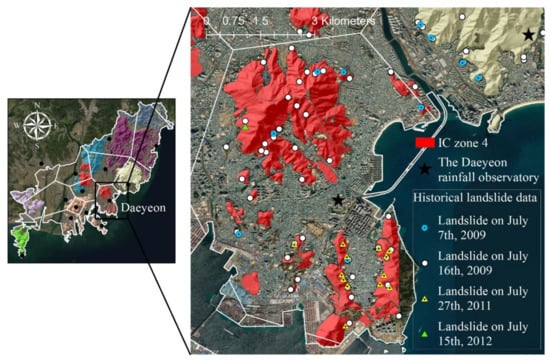
Figure 12.
Map of the study region used for temporal performance analysis including the distribution of historical landslides recorded on four different dates.
Figure 13 shows the changes in rainfall and corresponding warning levels in the study region during the rainy season (June to October) across the eight-year time period. Although small, the initiation time of a particular warning level was spatially variable within the study region. Therefore, we defined the initiation time as the time when a particular warning level starts to constitute the largest area within the study region compared to other warning levels. In the case of the highest “Emergency” level, however, the study region was considered to enter the phase of this level if the number of “Emergency” cells exceeded half the maximum number of cells that could be assigned this warning level within the study region.
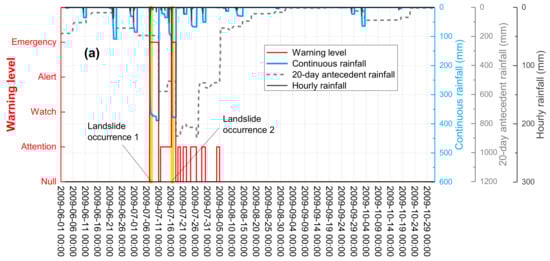
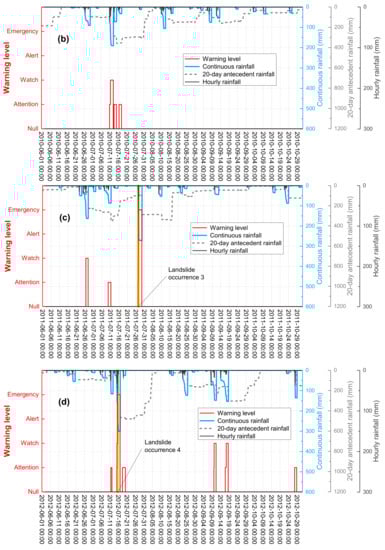
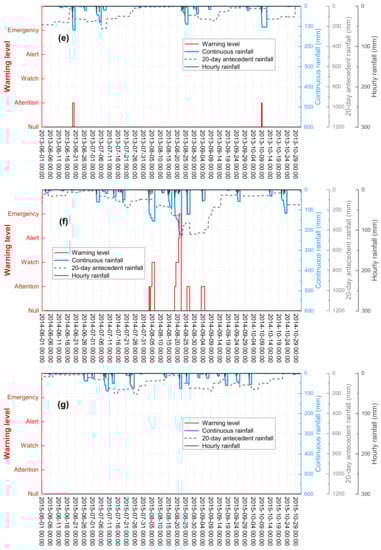
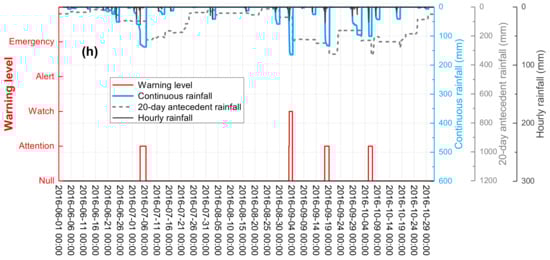
Figure 13.
Progression of changes in rainfall and corresponding warning levels in the specific case study region during the rainy season of (a) 2009; (b) 2010; (c) 2011; (d) 2012; (e) 2013; (f) 2014; (g) 2015 and (h) 2016.
During the rainy season of 2009 (Figure 13a), the landslide early warning model characterized seven rainfall conditions among various combinations of continuous rainfall and 20-day antecedent rainfall by generating warnings. In particular, SEM-LEWS successfully discriminated two rainfall conditions that triggered landslides from the five remaining rainfall conditions, by further raising the warning level to higher than “Watch.” For the remaining five rainfall conditions that did not trigger landslides, the warning level was raised to “Attention” for relatively low continuous rainfall as considerably high levels of 20-day antecedent rainfall caused the threshold of IERL to be exceeded. In the case of a weak continuous rainfall event with a high antecedent rainfall amount, we suggest a precautionary “Attention” level to be reasonable, as it offers time to prepare for possible slope instability and post-rain slope failure induced by increased soil moisture conditions. In Figure 14, the progression of continuous rainfall and the corresponding warning levels that led to Landslide occurrence 2 (a debris-flow type event) in Figure 13a are depicted over a specific time scale. Under the condition of great antecedent rainfall amounts, the warning level increased from “Attention” to the highest level of “Emergency” in response to the continuous rainfall amount increasing from approximately 140 to 200 mm in an hour. Considering that, as shown in Figure 14, the debris flow event was reported after the rainfall became tenuous, it is speculated that the debris flow actually initiated several minutes to a few hours before it was reported.
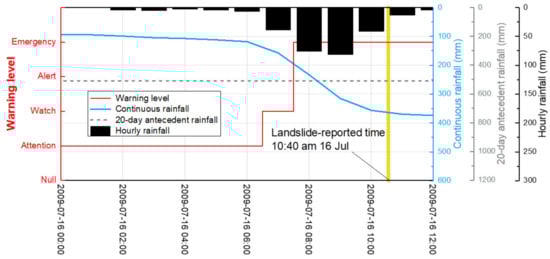
Figure 14.
Progression of changes in rainfall and the corresponding warning levels over a specific time scale leading to Landslide occurrence 2 in Figure 13a.
Before further discussing results from the temporal performance analysis, the term “warning event” should be defined as follows: an event in which a series of warning levels are initiated and then reduced to “Null.” During the 1224-day period corresponding to the duration of the rainy seasons over the eight years, a total of 55 days had warning events (4.5%). This indicates that approximately seven days with warning levels can be expected annually when the system is operational. Another important temporal characteristic of early warnings is lead-time. Corominas and Mavrouli [42] defined lead-time as “a time interval between the moment when the occurrence of a landslide event is reasonably certain (i.e., initiation of each warning level), and the moment of its actual occurrence.” Table 5 shows the mean lead-time for each warning level in the study region over the eight-year period. We suggest that the deduced mean lead times are reasonable, considering that these values are similar to the preliminary applicability test results of the SEM-LEWS model in which six historical landslide events were sampled and analyzed (Park et al., 2019). During the eight-year study period, SEM-LEWS generated a total of 30 warning events. Among the events, five were cases that involved high warning levels (“Alert” or “Emergency”), and landslides occurred in four of those five cases (Figure 13a,c,d). The remaining case that falsely warned with high warning levels is shown in Figure 13f. Here, the “Emergency” level was reached, but no landslides occurred. Therefore, from our results, landslide probabilities during a warning event and during a high-level warning event were 13% (4/30) and 80% (4/5), respectively.
Table 5.
Summary of temporal performance of the landslide early warning system based on the sequential evaluation method in the specific case study region.
By analyzing rainfall and landslide data over the eight-year study period, we suggest the importance of certain rainfall boundaries, i.e., critical amounts of rainfall that trigger landslides in the study region. With a continuous rainfall of approximately 220 mm as a criterion, no landslides were recorded in areas with smaller continuous rainfall amounts, while the occurrence of larger continuous rainfall amounts resulted in landslides. Furthermore, the two largest landslides (landslides 1 and 2, Figure 13a) could be distinguished from other landslides by having continuous rainfall amounts of more than 310 mm. The results of our analysis of the temporal performance of SEM-LEWS in the study region are summarized in Table 5.
4.3. Potential Limitations and Future Study
The performance analysis results discussed above demonstrated that the proposed SEM-LEWS was effective in providing useful and timely information associated with expected landslide type and hazard levels. However, to address potential limitations and overcome these issues in the future, it is necessary to reflect on the modeling effectiveness in terms of both the SEM-LEWS operation and historical landslide incidents during the study period. As a result, this study is considered to possess potential uncertainties and insufficiencies arising from the following three aspects.
Firstly, the results of the temporal performance analysis of this study may not represent global performance, as the analysis was limited to a specific local region that includes the most landslide-prone areas in Busan. Given the limited accessibility to perfectly collected data on historical landslide incidents that actually took place within the entire Busan area, the performance analysis results can be refined by conducting sustained and thorough investigations to ensure that future landslide events are recorded in a systematic format over time, which can further improve the credibility of SEM-LEWS.
Secondly, as Gariano et al. [24] highlighted, it was unfeasible to ensure truly complete examination of statistics associated with spatial false-warning (or false-positive) rates. This was due to the fact that it was almost impossible to find and collect historical data for all landslide incidents that could have actually taken place across the Busan area during the study period. Accordingly, this precluded the clarification of false-warning areas in which high warning levels were assigned but no landslide incidents occurred. However, considering that the fundamental purpose of landslide early warnings is directly connected to saving human lives, the tendency of the LEWS for spatial overestimations is an inevitable compromise to avoid missed-warning cases (landslides occurring without warnings). Therefore, in practice, it is desirable to consider the areas falsely warned with “Alert” and “Emergency” levels as areas with a high potential for slope failure or debris flow occurrences, respectively, which can be triggered at any moment in the near future.
Thirdly, the introduced representative occurrence times of the 222 historical landslide data may not sufficiently take into account the general tendency of time lags between slope failure and debris flow incidents. From a theoretical perspective, under the condition of equal rainfall characteristics and subsurface hydrologic processes, shallow failures are supposed to occur at an earlier stage on steep slopes when a wetting front reaches shear planes. In contrast, debris flows are generally initiated at later stages on relatively gentle slopes in channelized concave terrain as potential shear masses tend to require excessive pore-water pressures on shear planes. As a matter of fact, for both of the two cases (aforementioned in Section 4.1.) in which multiple landslide timings were recorded within an IC zone at a particular rainstorm event date, the records preceding by about 1 h were slope failure types whereas the later records were debris flow types.
Lastly, rainfall input data sourced from the historical records of the 17 KMA observatories may not have effectively reflected the pelt-points of localized intense rainfall during rainstorm events that took place in the Busan area within the study period. The spatial variability of rainfall over the distances between the observatories and historical landslide locations can diminish the reliability of the early warning modeling results. Moreover, the evolutions in early warning levels that occur within each hourly interval are not known due to the fact that hourly rainfall measurement data are the most fractionized historical records that are available from the KMA observatories. In addition, malfunctions and repair works in some of the rain gauges or other unknown circumstances may have resulted in underestimations in the rainfall records.
It should be noted that SEM-LEWS is inherently most suited for capturing rapid shallow landslide and debris flow typologies. This is because CRCritical, a physically based rainfall threshold in SEM-LEWS, was modelled considering the kinematics of shallow landslides primarily governed by short and intense rainfalls in Korean geological conditions, where poorly or well graded silty sand represents weathered residual soils in hillslope areas. In other words, the concept of CRCritical may not be applicable to regions with fine-grained soils or rainfall conditions that exhibit progressive increases. In fact, landslides in such geological/climatic settings exhibit completely different kinematics from shallow landslides and are primarily governed by long-term drainage effects of prolonged antecedent rainfalls.
The quality of rainfall recordings and predictions are paramount factors that determine the quality of warning information provided by SEM-LEWS. This is because rapid shallow landslides and debris flows are initiated by intense and spatially localized rainfalls over short time scales, as mentioned in previous sections. Rainfall patterns can dramatically differ within 2- 3 km distances under such climate characteristics. Future solutions could include increasing the number of rainfall observatories to create denser arrangements or further advancing rainfall forecasting models.
5. Conclusions
By collaborating with the city government, this research developed a regional-scale and test-operational landslide early warning system that applies the sequential evaluation method. Subsequently, the early warning performance of the developed system was comprehensively analyzed to derive intuitive and pragmatically useful information for the public as well as administrative officials. The analysis was based on simulated early warning level maps for each hourly time step and a collection of historical landslide data that classify 186 slope failure and 36 debris flow data during the rainy seasons (June to October) from 2009 to 2016. The analysis was divided according to two independent focuses: the system’s prediction statistics regarding historical landslide data and its temporal performance. The comprehensive results of this research are summarized as follows:
- According to real-time recorded or forecasted rainfall data, the developed system determines five warning level classes by consecutively applying three different evaluation stages: statistical, physically based, and geomorphological evaluations.
- Each of the five warning level phases has its own interpretations derived from the theoretical backgrounds of the evaluation thresholds. Most notably, the highest warning level class, “Emergency”, was defined to discriminatively issue warnings regarding potential debris flow initiations.
- The system exhibits nowcasting and forecasting capabilities and is able to generate two types of early warning level maps depending on the management interest: specific areal warning maps or administrative division warning maps.
- As a result of the prediction statistics analysis, 81% (150/186) of historical slope failure data and 86% (31/36) of historical debris flow data were correctly predicted by the “Alert” and “Emergency” levels, respectively.
- Four slope-failure events and five debris-flow events were classified as missed-warning errors, although these were determined as minor local failures of artificial slopes and small-scale erosive soil flows.
- As a result of analyzing temporal performance in a study region that is characterized by almost homogeneous rainfall, geo-properties, and hence the initiation timing of warning levels, miscellaneous quantitative information associated to the timing of early warnings was derived to provide answers for pragmatic questions including: “How much lead time is given?”, “What is the duration of the issued early warning?”, and “What is the probability of a landslide occurring given that an early warning has been issued?”
- During the study period, the system generated a total of 30 warning events. Among the events, five warning events were cases that involved high-class warning levels, and landslides occurred in four out of these five warning events. It was inferred that there exist critical amounts of rainfall that serve as boundaries for triggering landslide events.
The development and validation of a LEWS are complex tasks that are never conclusively achieved in any single occasion, but instead requiring robust and consistent support and investment over time for progressive improvements, periodic updates, and adaptations of the technology. Close collaboration and feedback between researchers and operating authorities are essential. In addition, clear divisions of legal responsibility between authorities and organizations associated to landslide early warnings is another important prerequisite to fully realize the implementation and sustainable operation of a territorial LEWS.
Author Contributions
Conceptualization, S.-R.L. and J.-Y.P.; methodology, J.-Y.P. and S.-R.L.; software, S.-R.L.; validation, J.-Y.P.; formal analysis, J.-Y.P.; investigation, S.-R.L., Y.-T.K., J.-Y.P., and D.-H.L.; resources, S.K. and Y.-T.K.; data curation, S.K. and D.-H.L.; writing—original draft preparation, J.-Y.P.; writing—review and editing, S.-R.L.; visualization, J.-Y.P. and D.-H.L.; supervision, S.-R.L.; project administration, Y.-T.K.; funding acquisition, S.-R.L. and Y.-T.K.. All authors have read and agreed to the published version of the manuscript.
Funding
This research was supported by the Basic Research Laboratory Program through the National Research Foundation of Korea funded by the Ministry of Science and ICT (NRF-2018R1A4A1025765), and the Basic Research Project (no. 20-3412-1) of the Korea Institute of Geoscience and Mineral Resources (KIGAM) funded by the Ministry of Science and ICT of Korea.
Acknowledgments
This work was carried out in collaboration with the disaster safety management division of the Busan local government, under Memorandum of Understanding. We express our gratitude for their help and support.
Conflicts of Interest
The authors declare no conflict of interest.
References
- Froude, M.J.; Petley, D. Global fatal landslide occurrence from 2004 to 2016. Nat. Hazards Earth Syst. Sci. 2018, 18, 2161–2181. [Google Scholar] [CrossRef]
- Haque, U.; Da Silva, P.F.; Devoli, G.; Pilz, J.; Zhao, B.; Khaloua, A.; Wilopo, W.; Andersen, P.; Lu, P.; Lee, J.; et al. The human cost of global warming: Deadly landslides and their triggers (1995–2014). Sci. Total Environ. 2019, 682, 67–684. [Google Scholar] [CrossRef] [PubMed]
- Petley, D. Global patterns of loss of life from landslides. Geology 2012, 40, 927–930. [Google Scholar] [CrossRef]
- Sultana, N. Analysis of landslide-induced fatalities and injuries in Bangladesh: 2000–2018. Cogent Soc. Sci. 2020, 6, 1737402. [Google Scholar] [CrossRef]
- Korea Forest Service. 2013 Main Business Plan Details; Korea Forest Service: Daejeon, Korea, 2013. [Google Scholar]
- National Institute for Disaster Prevention. The Field Survey Report of Damages Caused by the Typhoon RUSA in 2002; Ministry of Government Administration and Home Affairs: Seoul, Korea, 2002; p. 257.
- Petley, D.N. On the impact of climate change and population growth on the occurrence of fatal landslides in South, East and SE Asia. Q. J. Eng. Geol. Hydrogeol. 2010, 43, 487–496. [Google Scholar] [CrossRef]
- Guzzetti, F.; Gariano, S.L.; Peruccacci, S.; Brunetti, M.T.; Marchesini, I.; Rossi, M.; Melillo, M. Geographical landslide early warning systems. Earth-Sci. Rev. 2020, 200, 102973. [Google Scholar] [CrossRef]
- Piciullo, L.; Calvello, M.; Cepeda, J.M. Territorial early warning systems for rainfall-induced landslides. Earth-Sci. Rev. 2018, 179, 228–247. [Google Scholar] [CrossRef]
- Jakob, M.; Owen, T.; Simpson, T. A regional real-time debris-flow warning system for the District of North Vancouver, Canada. Landslides 2012, 9, 165–178. [Google Scholar] [CrossRef]
- Baum, R.L.; Godt, J.W. Early warning of rainfall-induced shallow landslides and debris flows in the USA. Landslides 2010, 7, 259–272. [Google Scholar] [CrossRef]
- Calvello, M.; d’Orsi, R.N.; Piciullo, L.; Paes, N.; Magalhaes, M.; Lacerda, W.A. The Rio de Janeiro early warning system for rainfall-induced landslides: Analysis of performance for the years 2010–2013. Int. J. Disaster Risk Reduct. 2015, 12, 3–15. [Google Scholar] [CrossRef]
- Wong, A.C.W.; Ting, S.M.; Shiu, Y.K.; Ho, K.K.S. Latest developments of Hong Kong’s landslip warning system. In Landslide Science for a Safer Geoenvironment; Springer: Cham, Switzerland, 2014; pp. 613–618. [Google Scholar]
- Ponziani, F.; Berni, N.; Stelluti, M.; Zauri, R.; Pandolfo, C.; Brocca, L.; Moramarco, T.; Salciarini, D.; Tamagnini, C. Landwarn: An operative early warning system for landslides forecasting based on rainfall thresholds and soil moisture. In Landslide Science and Practice; Springer: Berlin/Heidelberg, Germany, 2013; pp. 627–634. [Google Scholar]
- Segoni, S.; Battistini, A.; Rossi, G.; Rosi, A.; Lagomarsino, D.; Catani, F.; Moretti, S. An operational landslide early warning system at regional scale based on space-time-variable rainfall thresholds. Nat. Hazards Earth Syst. Sci. 2015, 15, 853–861. [Google Scholar] [CrossRef]
- Segoni, S.; Rosi, A.; Fanti, R.; Gallucci, A.; Monni, A.; Casagli, N. A regional-scale landslide warning system based on 20 years of operational experience. Water 2018, 10, 1297. [Google Scholar] [CrossRef]
- Colleuille, H.; Haugen, L.E.; Beldring, S. A forecast analysis tool for extreme hydrological conditions in Norway. In Poster Presented at the Sixth World FRIEND Conference, Marocco; UNESCO: Paris, France, 2010. [Google Scholar]
- Osanai, N.; Shimizu, T.; Kuramoto, K.; Kojima, S.; Noro, T. Japanese early-warning for debris flows and slope failures using rainfall indices with Radial Basis Function Network. Landslides 2010, 7, 325–338. [Google Scholar] [CrossRef]
- Rossi, M.; Peruccacci, S.; Brunetti, M.T.; Marchesini, I.; Luciani, S.; Ardizzone, F.; Balducci, V.; Bianchi, C.; Cardinali, M.; Fiorucci, F.; et al. SANF: National warning system for rainfall-induced landslides in Italy. Landslides Eng. Slopes Prot. Soc. Through Improv. Underst. 2012, 2, 1895–1899. [Google Scholar]
- Peruccacci, S.; Brunetti, M.; Gariano, S.; Melillo, M.; Rossi, M.; Guzzetti, F. Rainfall thresholds for possible landslide occurrence in Italy. Geomorphology 2017, 290. [Google Scholar] [CrossRef]
- Park, J.Y.; Lee, S.R.; Lee, D.H.; Kim, Y.T.; Lee, J.S. A regional-scale landslide early warning methodology applying statistical and physically based approaches in sequence. Eng. Geol. 2019, 260, 105193. [Google Scholar] [CrossRef]
- Wilks, D. Statistical Methods in the Atmospheric Sciences, 2nd ed.; International Geophysical Series; Academic Press: Cambridge, MA, USA, 1995; Volume 59, p. 464. [Google Scholar] [CrossRef]
- Calvello, M.; Piciullo, L. Assessing the performance of regional landslide early warning models: The EDuMaP method. Nat. Hazards Earth Syst. Sci. 2016, 16, 103–122. [Google Scholar] [CrossRef]
- Gariano, S.L.; Brunetti, M.T.; Iovine, G.; Melillo, M.; Peruccacci, S.; Terranova, O.; Vennari, C.; Guzzetti, F. Calibration and validation of rainfall thresholds for shallow landslide forecasting in Sicily, southern Italy. Geomorphology 2015, 228, 653–665. [Google Scholar] [CrossRef]
- Martelloni, G.; Segoni, S.; Fanti, R.; Catani, F. Rainfall thresholds for the forecasting of landslide occurrence at regional scale. Landslides 2012, 9, 485–495. [Google Scholar] [CrossRef]
- Han, J.G. The characteristics analysis of landslides and rainfall at Pusan area. J. Korean Soc. Environ. Restor. Technol. 2001, 4, 24–31. [Google Scholar]
- Kim, J.M.; Choi, J.C. Study on landslide hazard possibility for Mt. Hwangryeong in Busan Metropolitan city using the infinite slope model. J. Eng. Geol. 2016, 26, 413–422. [Google Scholar] [CrossRef]
- Lee, S.G. A Study on potential risk of landslide in Pusan. J. Korean Soc. Environ. Restor. Technol. 1999, 2, 9–23. [Google Scholar]
- Ryu, J.H.; Seo, S.H.; Kim, Y. A case study for landslide of Busan-Gyeongnam area occurred in 2014. J. Korean Soc. Hazard. Mitig 2015, 15, 143–151. [Google Scholar] [CrossRef]
- Park, Y.; Kim, J.; Jo, D.J.; Kim, S. Urban mud and debris flow disaster vulnerability assessment associated with landslide hazard map: Application to Busan, Korea. J. Korean Soc. Hazard. Mitig. 2015, 15, 283–289. [Google Scholar] [CrossRef][Green Version]
- Pradhan, A.M.S.; Lee, S.R.; Kim, Y.T. A shallow slide prediction model combining rainfall threshold warnings and shallow slide susceptibility in Busan, Korea. Landslides 2019, 16, 647–659. [Google Scholar] [CrossRef]
- Lee, C.; Kim, D.; Woo, C.; Kim, Y.S.; Seo, J.; Kwon, H. Construction and operation of the national landslide forecast system using soil water index in Republic of Korea. J. Korean Soc. Hazard. Mitig. 2015, 15, 213–221. [Google Scholar] [CrossRef]
- Seo, J.; Jeong, I.; Park, Y.; Kim, J.; Lim, J. Development of open platform for enhancing disaster risk management. In Proceedings of the 2nd International Conference on Information and Communication Technologies for Disaster Management (ICT-DM), Rennes, France, 30 November–2 December 2015; IEEE: New York, NY, USA, 2015; pp. 287–288. [Google Scholar]
- Naver Map. Online Map Service for South Korea. Available online: https://map.naver.com/ (accessed on 29 June 2020).
- Kakao Map. Online Map Service for South Korea. Available online: https://map.kakao.com/ (accessed on 29 June 2020).
- Chleborad, A.F.; Baum, R.L.; Godt, J.W.; Powers, P.S. A prototype system for forecasting landslides in the Seattle, Washington, area. Rev. Eng. Geol. 2008, 20, 103–120. [Google Scholar]
- Finlay, P.J.; Fell, R.; Maguire, P.K. The relationship between the probability of landslide occurrence and rainfall. Can. Geotech. J. 1997, 34, 811–824. [Google Scholar] [CrossRef]
- Segoni, S.; Martelloni, G.; Lagomarsino, D.; Fanti, R.; Catani, F. An operational warning system for the forecasting of landslide occurrence at regional scale. In Landslide Science and Practice; Springer: Berlin/Heidelberg, Germany, 2013; pp. 611–617. [Google Scholar]
- Brand, E.W. Landslides in Southeast Asia: A state of the art report. In Proceedings of the 4th International Symposium on Landslides, Toronto, ON, Canada, 17 September 1984; BiTech Publishers: Vancouver, BC, Canada, 1984; Volume 1, pp. 17–59. [Google Scholar]
- Brunetti, M.T.; Peruccacci, S.; Rossi, M.; Luciani, S.; Valigi, D.; Guzzetti, F. Rainfall thresholds for the possible occurrence of landslides in Italy. Nat. Hazards Earth Syst. Sci. 2010, 10, 447–458. [Google Scholar] [CrossRef]
- Park, J.Y. Development of a Regional-Scale Landslide Early Warning System Applying Statistical and Physically Based Evaluation Approaches in Sequence. Ph.D. Thesis, Korea Advanced Institute of Science and Technology, Daejeon, Korea, 2019; p. 106. [Google Scholar]
- Corominas, J.; Mavrouli, J. Living with landslide risk in europe: Assessment, effects of global change, and risk management strategies. In Documento Técnico; 7th Framework Programme Cooperafion Theme; SafeLand: Stockholm, Sweden, 2011; p. 6. [Google Scholar]


© 2020 by the authors. Licensee MDPI, Basel, Switzerland. This article is an open access article distributed under the terms and conditions of the Creative Commons Attribution (CC BY) license (http://creativecommons.org/licenses/by/4.0/).