Article

Power Flow and Efficiency Analysis of High-Speed Heavy Load Herringbone Planetary Transmission Using a Hypergraph-Based Method

1
State Key Laboratory of Mechanical Transmission, College of Mechanical Engineering, Chongqing University, Chongqing 400044, China
2
State Key Laboratory of Mechanical Transmission, College of Automotive Engineering, Chongqing University, Chongqing 400044, China
*
Author to whom correspondence should be addressed.
Appl. Sci. 2020, 10(17), 5849; https://doi.org/10.3390/app10175849
Submission received: 19 July 2020 / Revised: 18 August 2020 / Accepted: 19 August 2020 / Published: 24 August 2020
(This article belongs to the Section Mechanical Engineering)

Abstract

:
The existing research problem is that the hypergraph-based method does not comprehensively consider the power loss factors of the mechanical transmission system, especially the existing windage power loss. In the power flow diagram, it is difficult to express and calculate the power loss separately, based on the power loss mechanism. Furthermore, the hypergraph-based methods purposed by some researches are not suitable for high-speed and heavy-load conditions. This paper presents a new hypergraph-based method for analyzing the transmission efficiency of complex planetary gear trains. In addition, a formula for calculating transmission efficiency is derived. The power loss model is established for a high-speed heavy-load herringbone planetary transmission pair considering several sources of power losses such as gear meshing friction, windage, and bearing friction. Then, the efficiency of a two-stage herringbone planetary transmission system is calculated using the proposed method. Furthermore, the influence of input speed, input power, and lubrication state on transmission efficiency is investigated. Finally, the proposed method is verified by comparing calculated values with values published in the literature.

1. Introduction

1.1. Motivation and Challenge

The herringbone planetary gear train is widely used in high-speed heavy-duty transmissions owing to its simple and compact structure and several other advantages such as split path power transmission, high power efficiency, and large transmission range [1,2,3]. As the power transmitted by the gear train increases, large vibrations can increase the temperature of the machine and along with other power losses can lead to wear, which reduces the working life and reliability of the machine [4,5,6]. For these reasons, power loss mechanisms of high-speed heavy-duty helical gear transmission are widely studied [7,8,9,10,11,12].
Models of tooth surface friction were previously established to accurately predict power losses associated with gear meshing. However, most models do not consider the influence of other sources of power loss in gear trains. As a consequence, analytical expressions of transmission efficiency for any type of planetary gear train may be higher than the actual transmission efficiency. Most graph-based methods for analyzing transmission efficiency define the efficiency of each planetary gear stage as a fixed value according to meshing power loss, which is then used to calculate the overall transmission efficiency of the planetary gearbox. However, this is not consistent with real-world scenarios. To precisely model the power loss and efficiency of a planetary gear transmission system, various loss factors should be considered.

1.2. Literature Review

To analyze gear meshing losses, Marques et al. [13] proposed a dynamic lumped mass model of a four-degree-of-freedom (4-DOF) gear system, and two separate formulas for friction coefficient were used to calculate friction power losses for gears of different geometries under various working conditions. However, the influence of different lubrication conditions on gear transmission efficiency was not been considered in the study. Diez-Ibarbia et al. [14] studied the influence factor of friction factor on the efficiency of spur gears with tip reliefs, calculated them using the average friction factor along the mesh cycle, and then compared with values obtained using an enhanced friction factor formula based on the fundamentals of elastohydrodynamic lubrication, but the study does not consider the effect of temperature on the elastohydrodynamic lubrication.
Fernandes et al. [15] used experimental data to derive the average friction factor of meshing gear pairs, and discussed the relationship between friction coefficient and the type of lubricating oil. Petrishchev et al. [16] designed a machine for testing power losses and then experimentally determined the variation in gear frictional losses during each individual tooth engagement period. Shao et al. [17] calculated the frictional power loss on the tooth surface and meshing efficiency of a planetary gear train by considering elastic deformation of the flexible ring gear and dynamic friction in the contact region, but did not consider the influence of different lubrication conditions on gear transmission efficiency. Wang et al. [18] proposed a method for calculating gear meshing efficiency using data from a gear testing machine.
Recently, graph-based methods have become a major research focus [19]. Graph-based methods can be used to calculate the transmission efficiency of epicyclic gear trains, and effectively remove the need to manually determine the power flow direction, which can be cumbersome and error-prone. Liu et al. [20] proposed a method for designing automatic transmission configuration schemes based on the lever analogy. In addition, they established a process for synthesizing multi-row multi-speed automatic transmissions; whereas a three-row mixed connection was the preferred connection, both two-row and three-row connections were demonstrated.
Gomà i Ayats et al. [21] presented a hypergraph-based approach for the kinematic analysis of complex gear trains. The hypergraphs were used to aid in the understanding of the inter-relation between the various branches of the mechanism and to develop the kinematic equations. Laus et al. [22] proposed a method for calculating the efficiency of complex gear trains using graph and screw theory and established a one-to-one mapping relation between friction and efficiency, but the efficiency calculation considers the tooth surface friction power loss, ignoring other power losses.
Chen et al. [23] used graph theory to model a 2-DOF planetary gear transmission and a constraint analysis and the virtual power ratio were used to predict the efficiency of the system. Similarly, Li et al. [24] performed motion, torque, and power balances of a single-stage planetary gear transmission, plotted the power flow diagram of a 2K-H planetary gear transmission, and derived a power distribution law for the closed planetary gear transmission system. Finally, Yang et al. [25] proposed a power flow analysis method based on matrix operations to determine power flow and transmission efficiencies of multi-stage planetary gear transmission systems.

1.3. Scientific Contribution

Energy saving and reducing consumption are crucial for sustainable development of economies, and efficiency is an important performance indicator of machinery. The primary objective of this work is to develop a power flow diagram for modeling and analyzing the efficiency of planetary transmission systems. Herein, we put forward hypergraphs for analyzing power loss mechanisms within the planetary gear transmission structure. Then, precise modeling is combined with the graph-based method to analyze the overall efficiency of a planetary gear transmission system.

1.4. Outline of the Paper

The rest of this paper is organized as follows. Hypergraphs of the planetary gear train are detailed in Section 2. In Section 3, we introduce formulas for calculating transmission efficiency by following the power flow. A power flow diagram of the herringbone gear planetary drive system is presented in Section 4. In Section 5, the proposed method is used to analyze power loss and transmission efficiency of a two-stage herringbone gear transmission system under various lubrication states, input speeds, and input power. Finally, the main conclusions of the study are summarized in Section 6.

2. Loss Mechanism Hypergraph of Single-Stage Planetary Gear Transmission

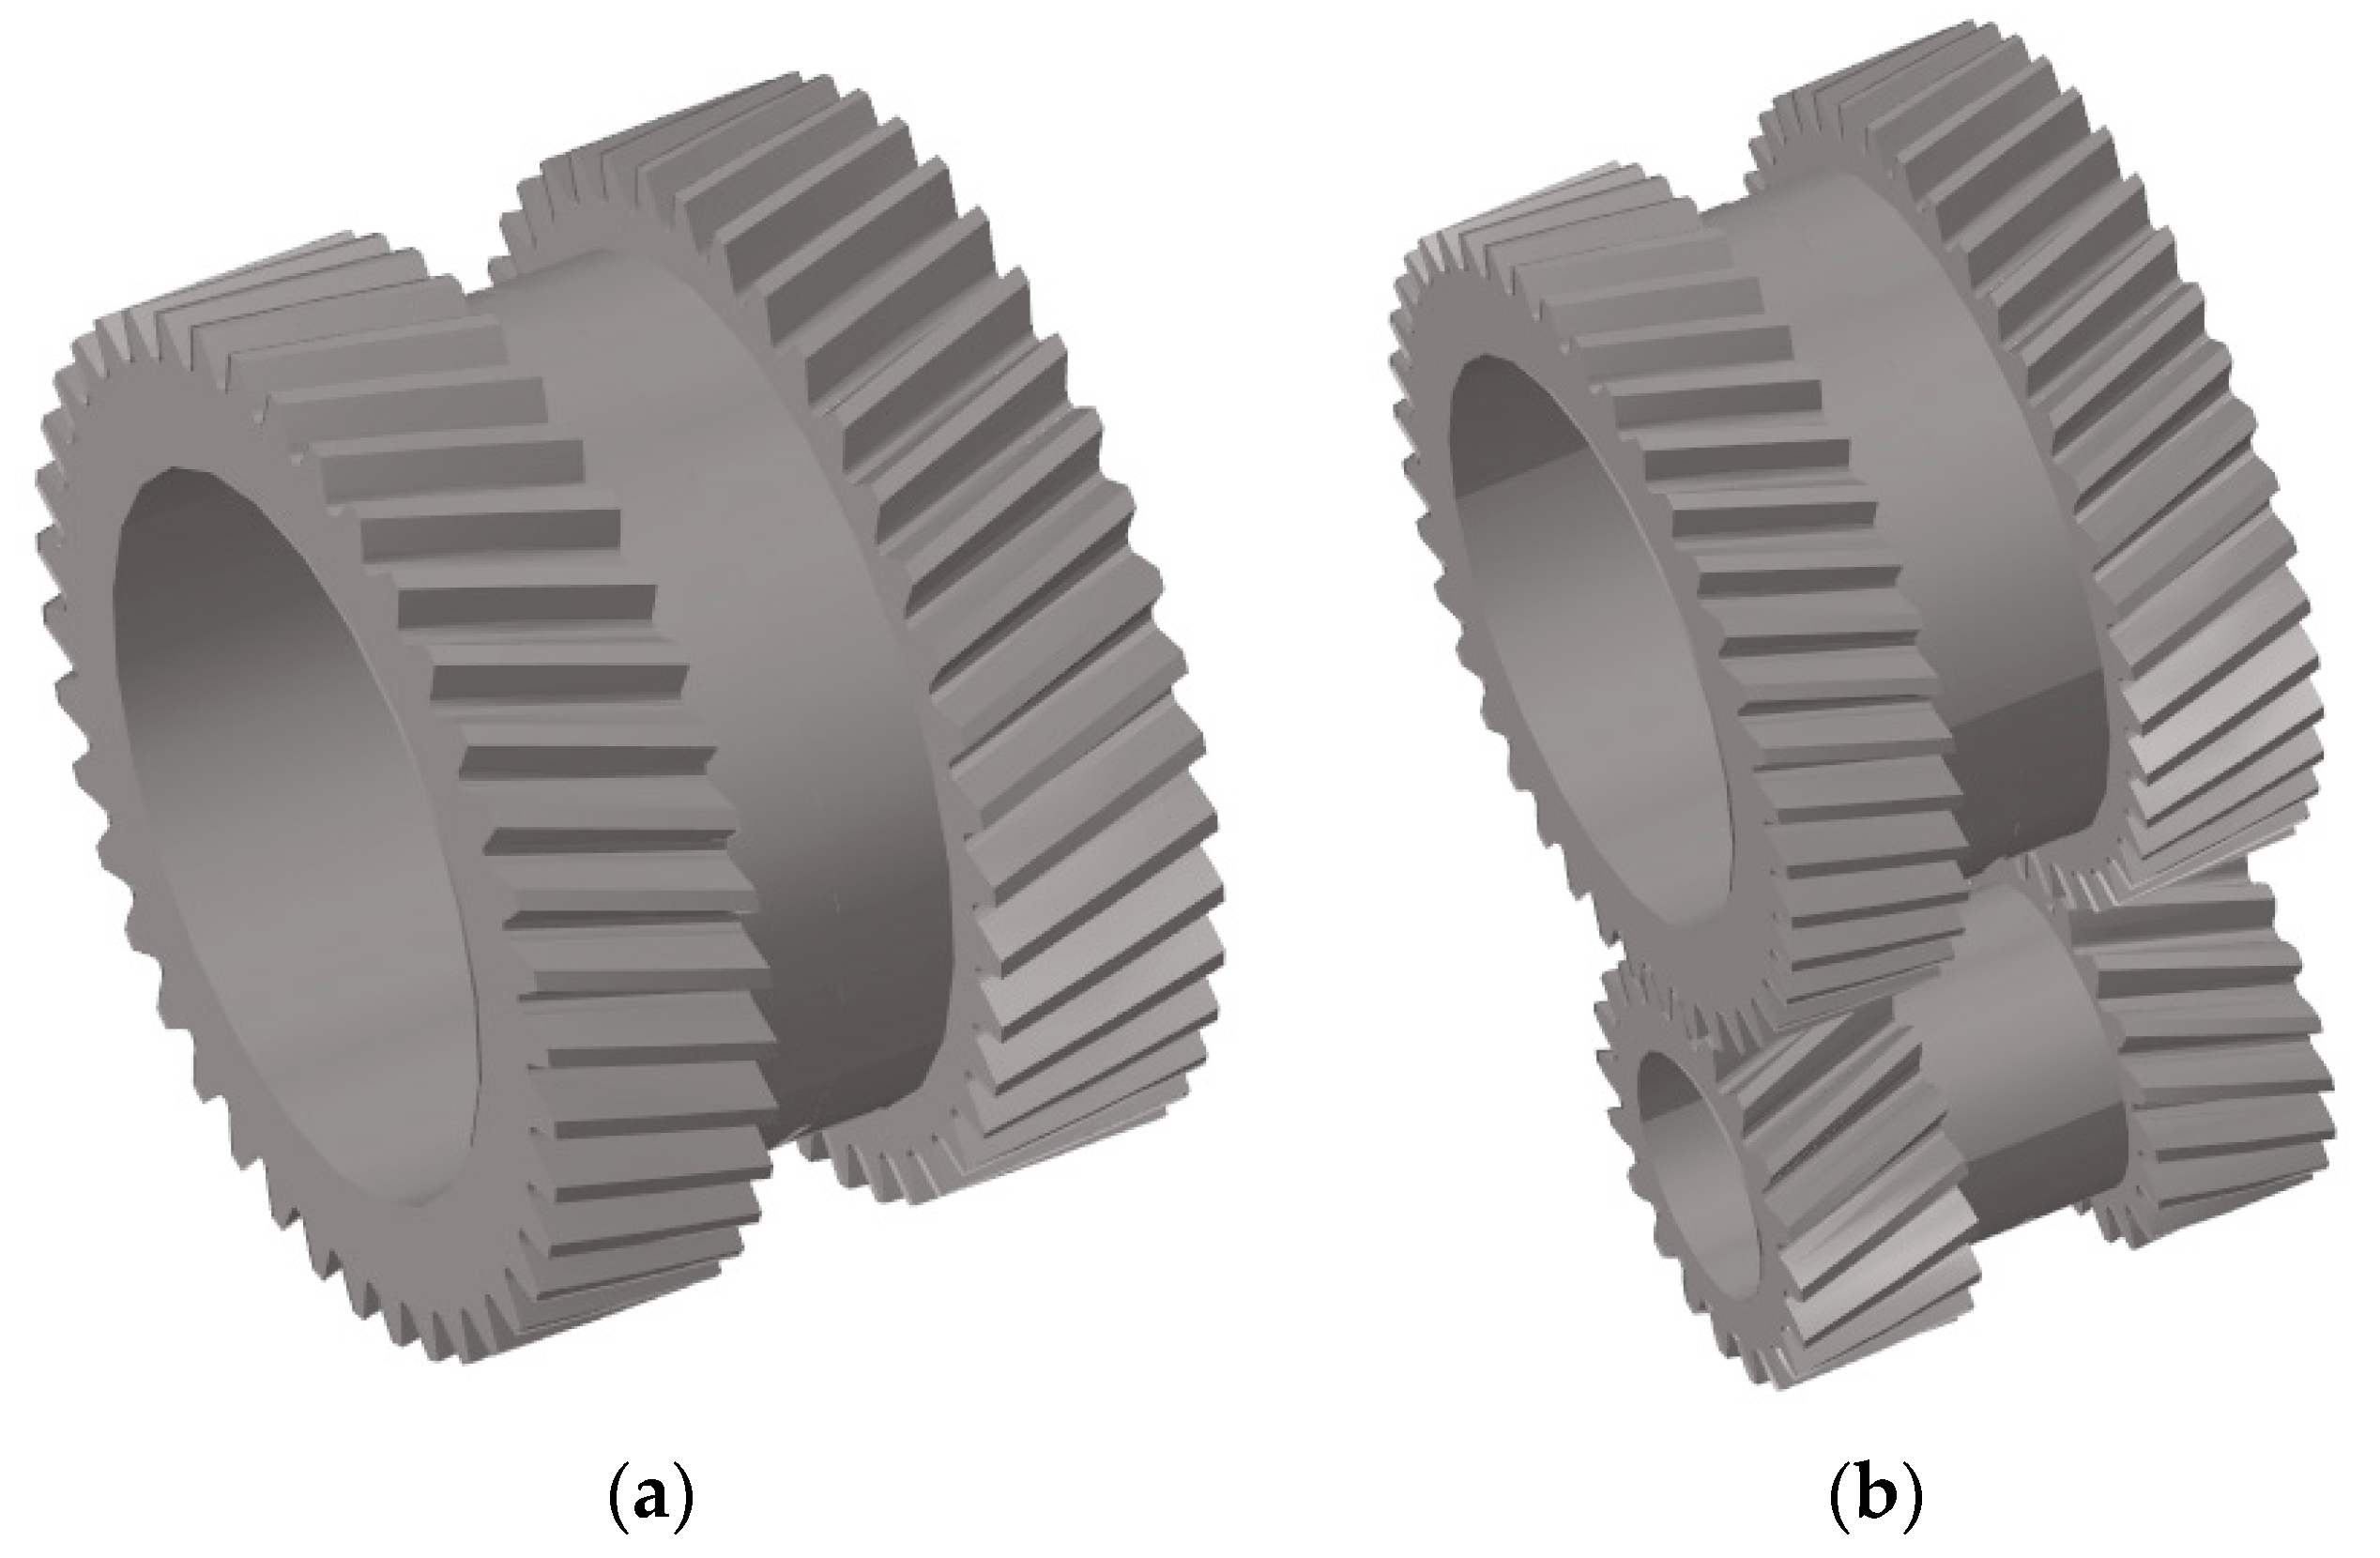
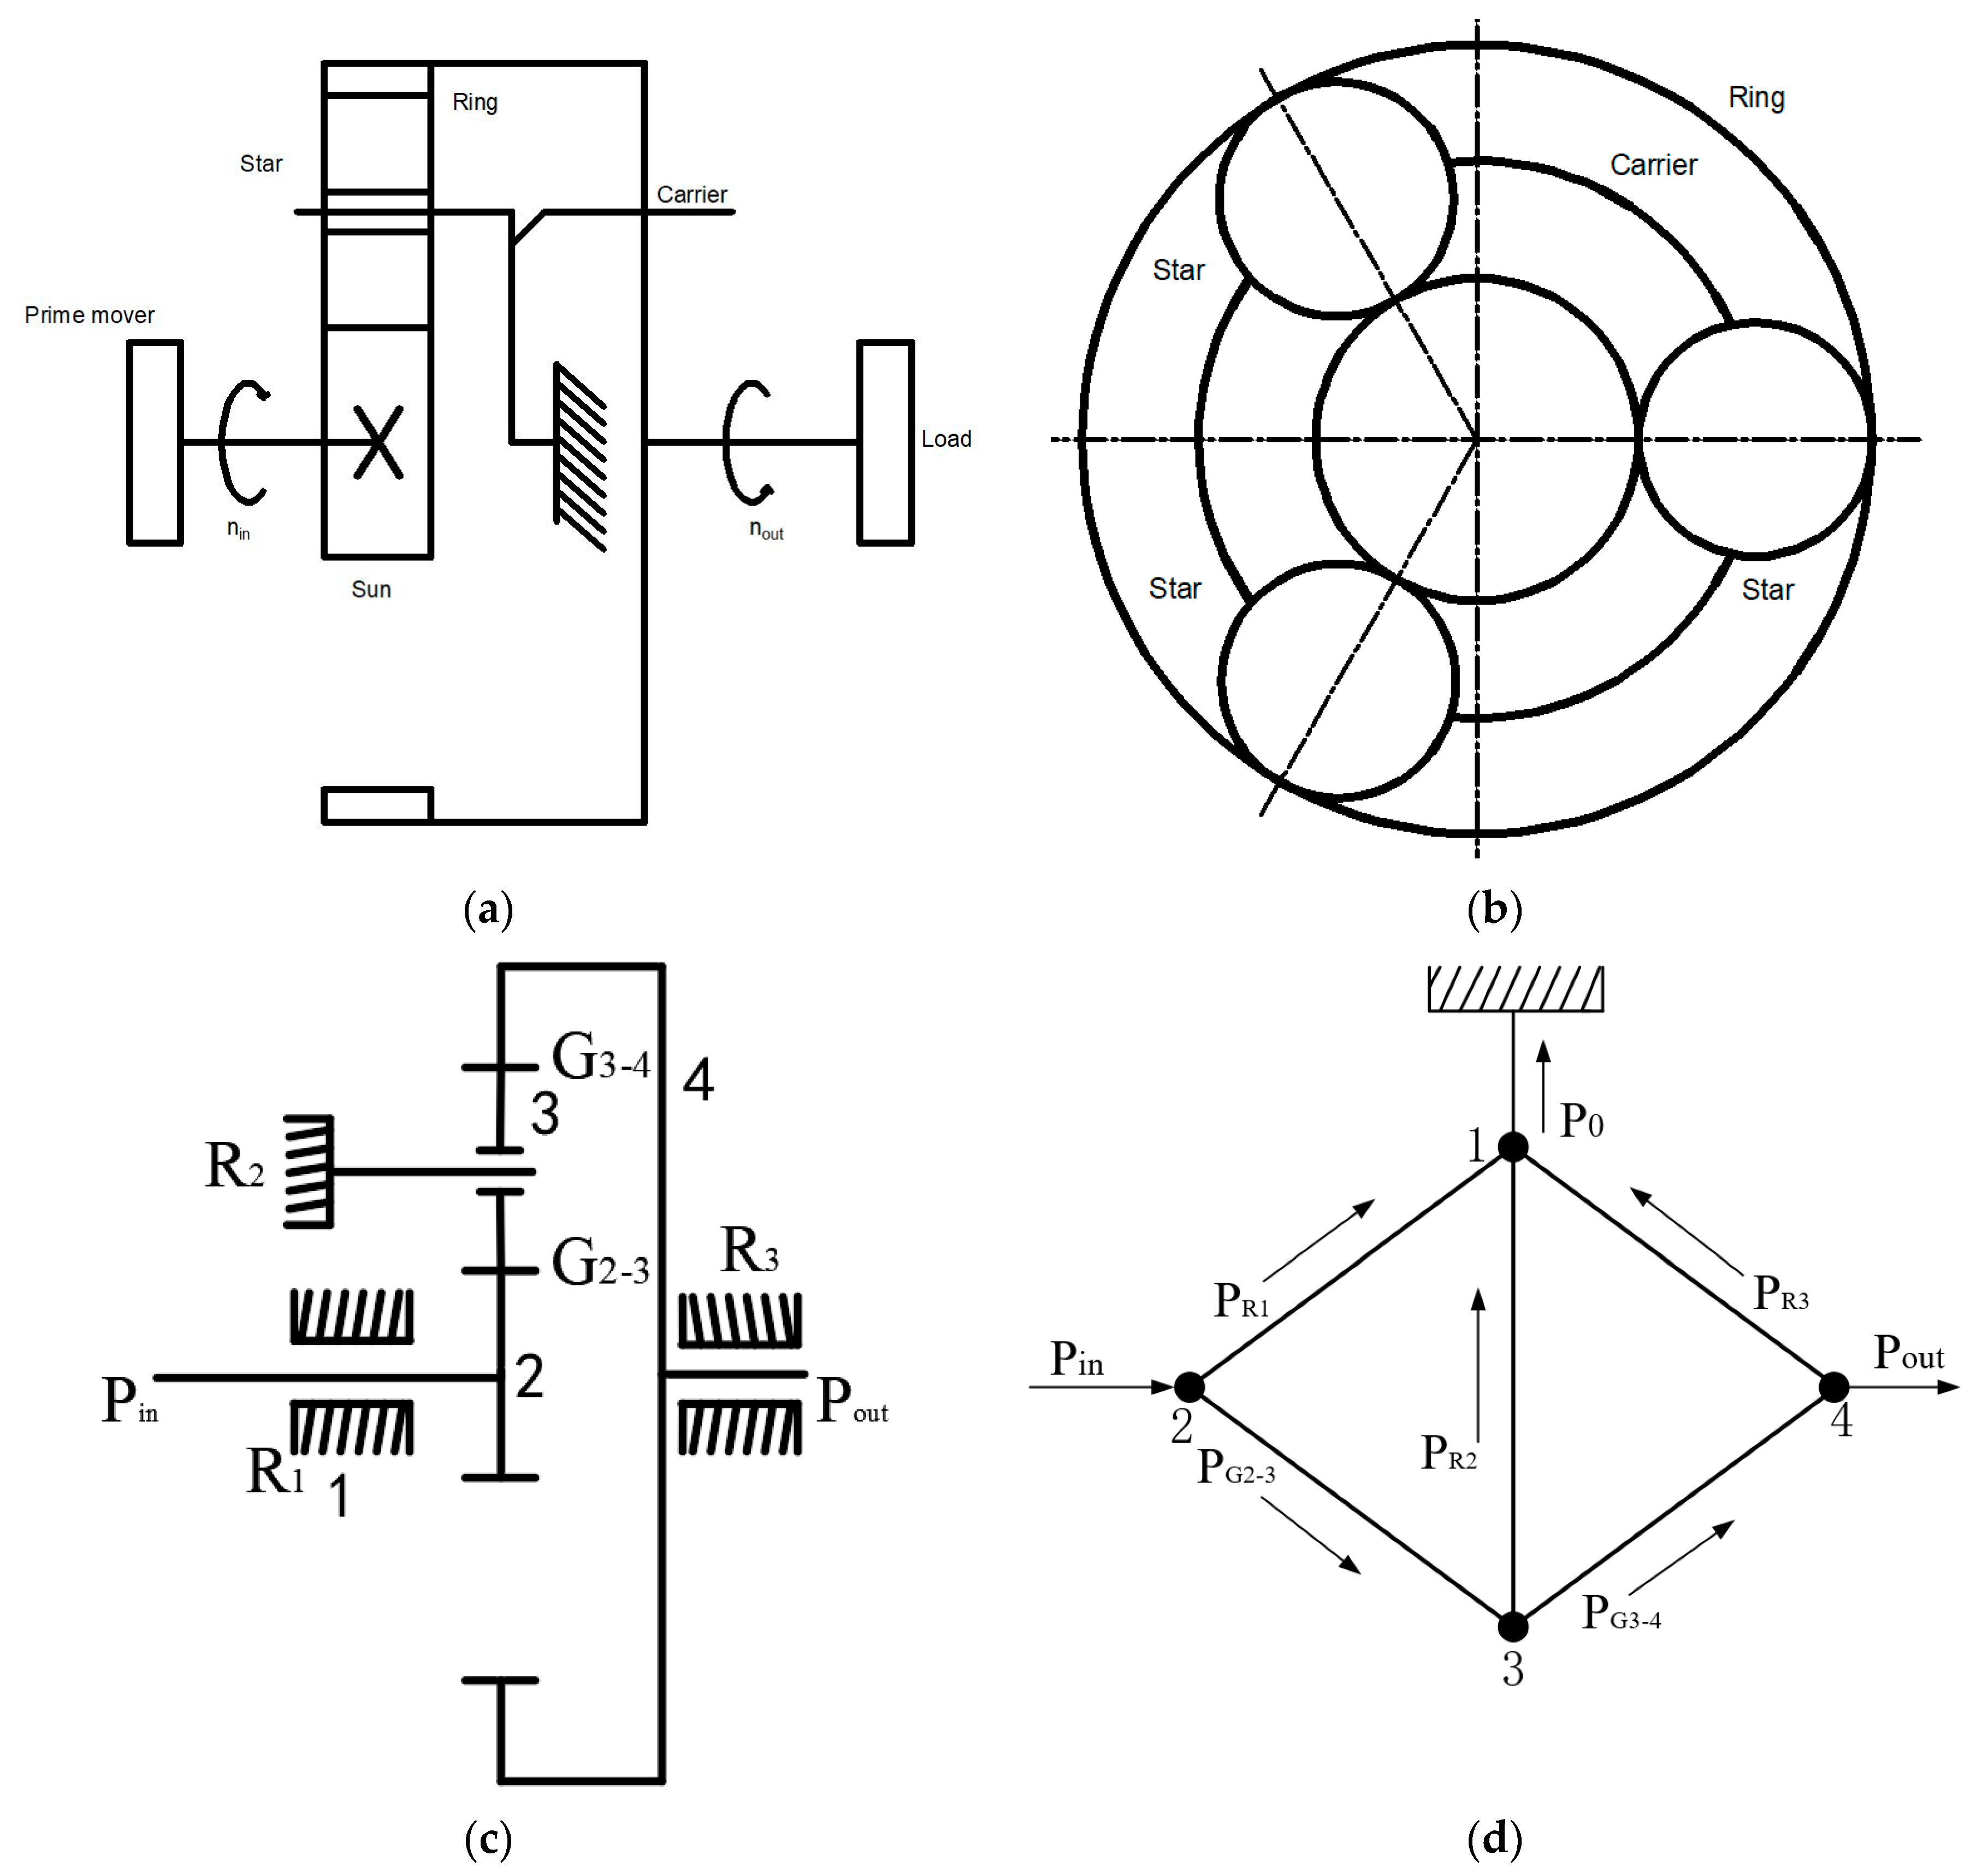
2.1. Basic Structure of Planetary Transmission System

As shown in Figure 1, the herringbone gear is comprised of two congruent helical gears with opposite tooth helical angle, with left-handed teeth on one side, right-handed teeth on the other side, and a tool withdrawal groove in the middle. The helical angles of two rows of gears are the same size, but with forces acting in opposite directions, and thus offset axial forces.
The structure of the herringbone gear planetary transmission system is illustrated in Figure 2a,b. The system consists of three planetary gears and power is first split across the planetary gears, then transmitted through an additional sun gear, which converges on the internal gears. The sun gear and planetary gears of the system have herringbone teeth and the inner ring gear engages with two internal helical gears. The herringbone gear eliminates axial forces, as described above.

2.2. Loss Mechanism of Single-Stage Planetary Gear Transmission

2.2.1. Hypergraph of Single-Stage Planetary Gear Transmission

The structure of the single-stage planetary gear transmission structure is shown in Figure 2, including the frame, sun gear, planetary gear, ring gear, bearing surface contacts, and teeth surface contacts. The topology of the system is presented as a hypergraph in Figure 2d, in which numbered vertices represent components of the gear system and edges represent kinematic pairs.
A single-stage planetary gear transmission can be represented as a diamond-shaped hypergraph with four connected nodes. Each node corresponds to one main branch of the gear train including the carrier, ring gear, sun gear, and frame. The sun gear and frame, planet gear and carrier, and ring gear and frame are connected by bearings, denoted R1, R2, and R3, respectively. In addition, a teeth surface contact link exists between the sun gear and planetary gear and between the planetary gear and ring gear.

2.2.2. Power Loss Mechanism of Single-Stage Planetary Gear Transmission System

As shown in Figure 2d, power is transmitted to the helical gear planetary drive via the sun gear, which is in direct contact with the frame. The frame is in contact with the bearings of the planetary gear and ring gear, resulting in bearing power losses PR1, PR2, and PR3. Both the sun gear-planetary gear meshing pair and ring gear-planetary gear meshing pair are in contact at the teeth surface, and gear power losses PG1 and PG2 are generated. Finally, power is transmitted via the ring gear to the output shaft. Power losses can be divided into two categories: power loss due to bearing contact and power loss due to gear meshing.
Gears of the planetary gear transmission system are mounted on a rotating shaft, which is typically supported by a roller bearing and ball bearing. Power loss due to friction of the roller bearing is
P R = 1.05 × 10 4 nM
where n is bearing speed and M is bearing friction torque.
Power loss associated with gears meshing in the lubricating oil-gas mixture, including power loss due to friction on the tooth surface and windage power loss, is
P G = P m + P ω
where Pm is tooth surface friction power loss and Pω is windage power loss.

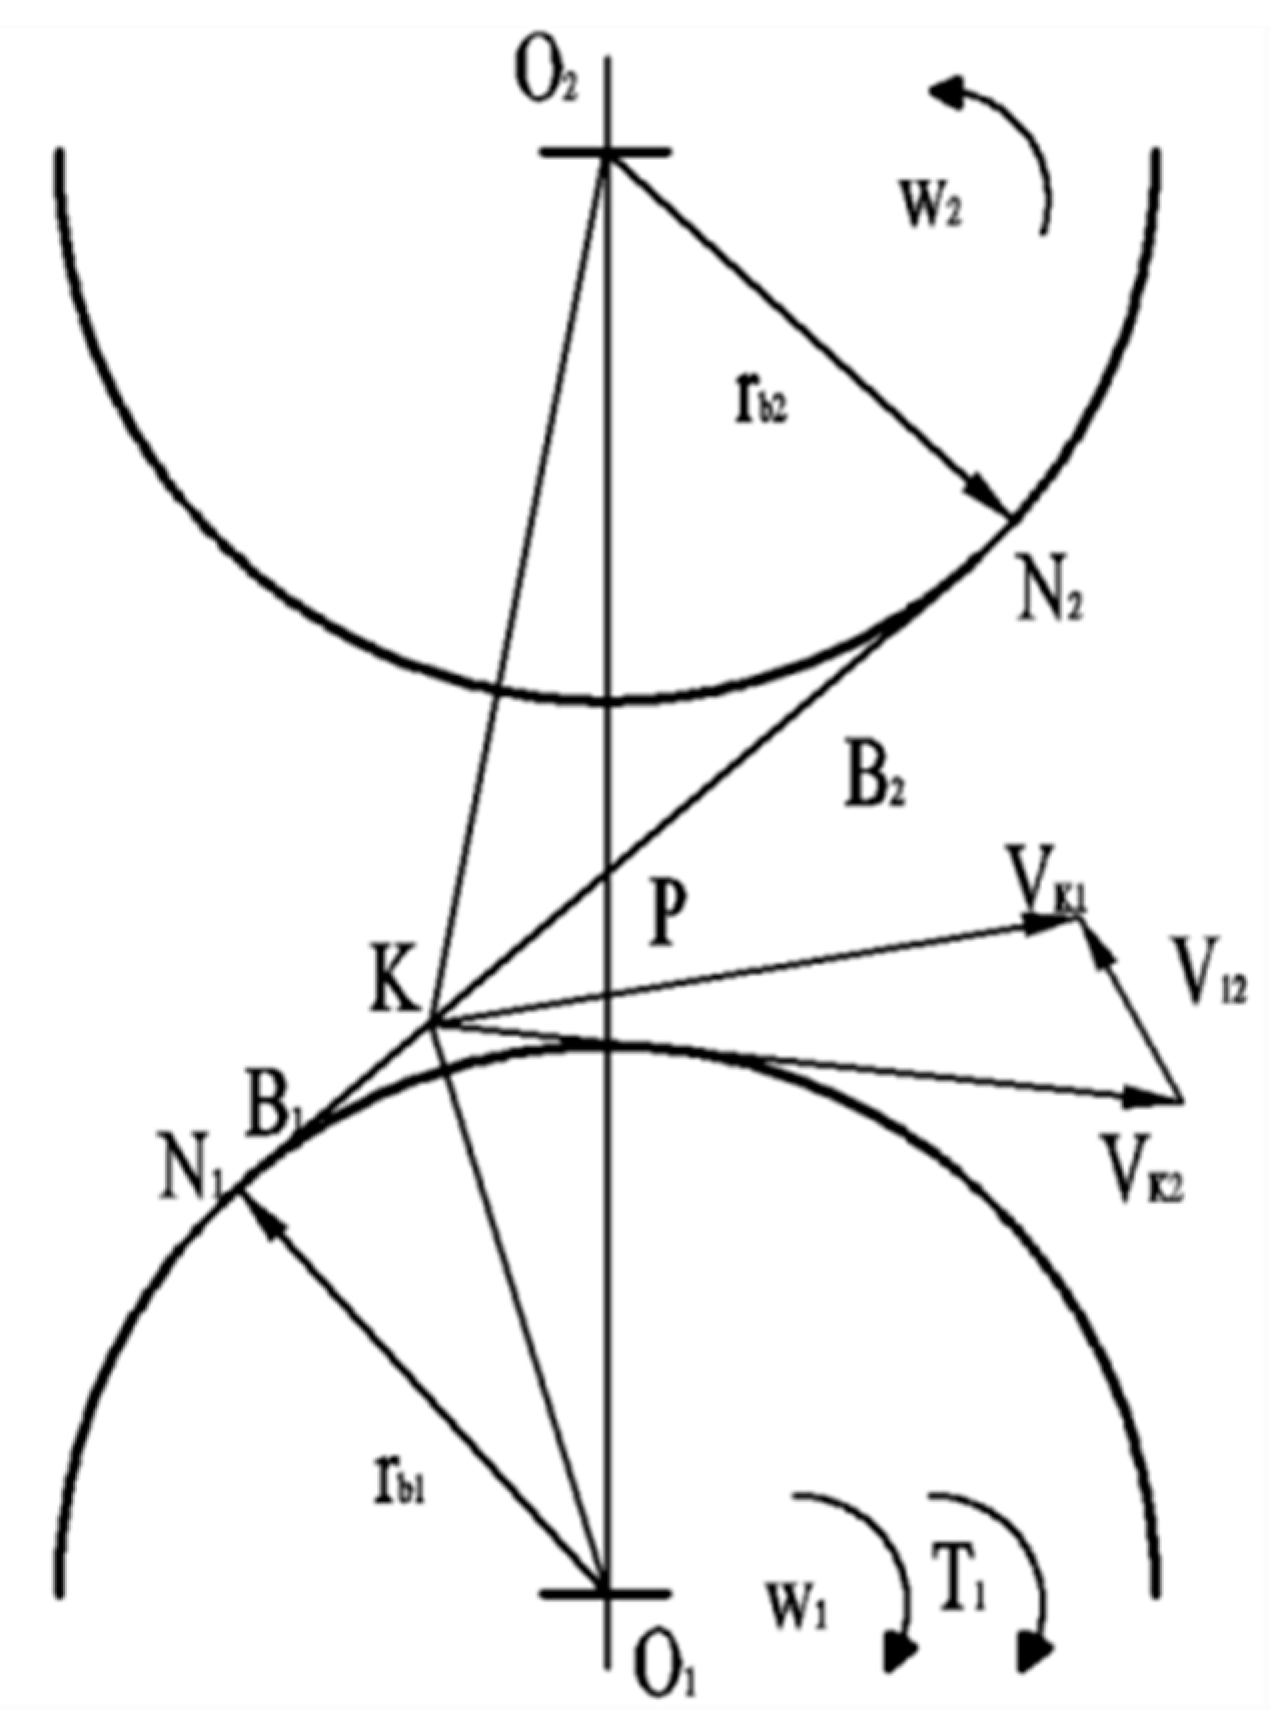
2.2.3. Structural Kinematics of Single-Stage Planetary Gear Transmission

The gear ratio of sun gear 2 and planetary gear 3 is
H = ± z 3 z 2 = ± Number   of   teeth   of   wheel   3 Number   of   teeth   of   wheel   2
where zp is the number of planetary gear teeth and zs is the number of sun gear teeth.
Figure 3 is kinematic relationship of a single-stage planetary gear. For each single-stage planetary gear transmission in the system hypergraph, the Willis equation can be obtained as
H = ω 2 ω 1 ω 3 ω 1
For a single-stage planetary gear transmission system,
T 1 + T 2 + T 3 = 0
P 2 + P 2 + P 3 = 0
P 3 P 2 = H ω 3 ω 2
P 1 P 3 = 1 H H ω 1 ω 2
where T, P and ω represent torque, power, and angular velocity, respectively; subscripts 1, 2, and 3 denote the planet carriers, sun gear, and planet gear, respectively.

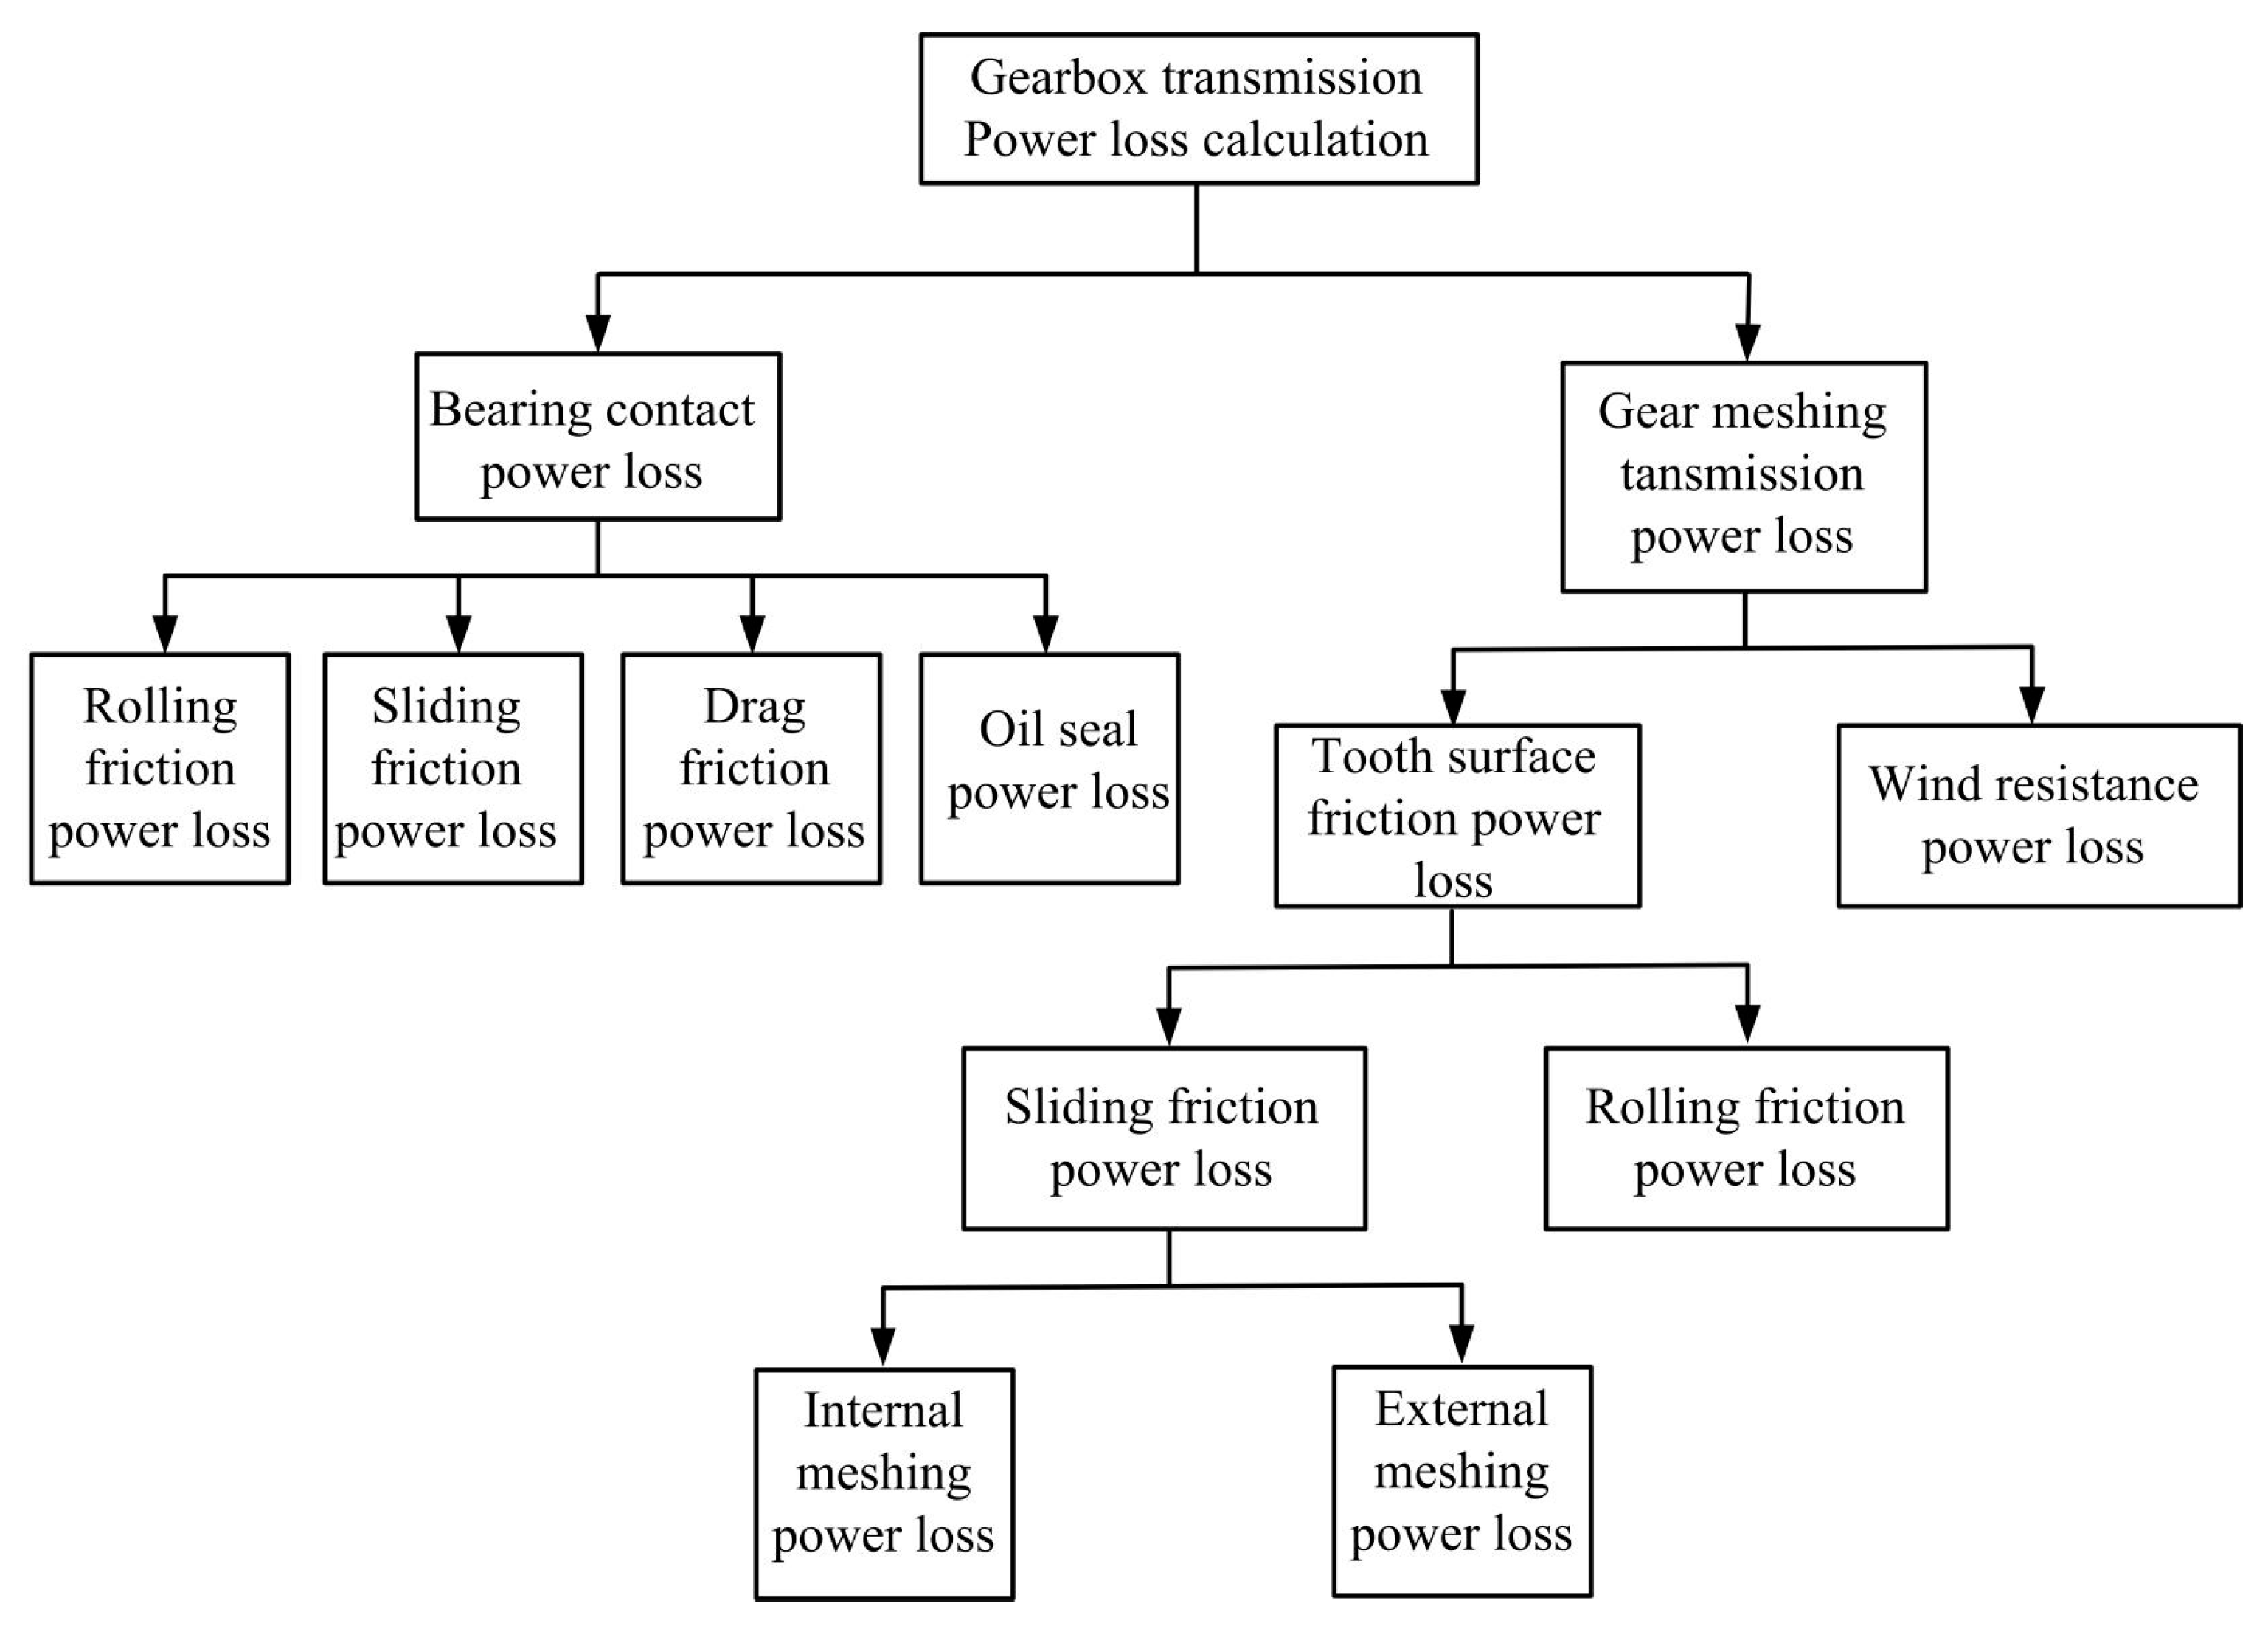
3. Efficiency Analysis of Herringbone Planetary Gear

Power loss along the transmission path in the herringbone planetary transmission is mainly owing to gear meshing transmission power loss and bearing contact power loss. The main factors that contribute to gear transmission power loss are illustrated in Figure 4. Herein, an accurate mathematical model of the gear transmission power loss is established and will lay the theoretical foundation for the subsequent power flow and efficiency analysis.

3.1. Bearing Contact Power Loss

Under heavy load and high-speed conditions, the herringbone planetary drive relies on the line contact between the rollers of the cylindrical roller bearing and raceway to withstand large radial loads. However, sliding and rolling contact between the cylindrical roller and inner and outer raceway surfaces, as well as viscosity of the lubricant and contact between the cylindrical roller and bearing cage, generate friction torque. Because the bearings were under high-speed and heavy-load conditions, the calculation model of friction torque introduced by SKF is more accurate. The amount of friction torque will depend on the type of bearing and its geometry. The parameters of the bearing are listed in Table 1.
In Table 1, R1 is a geometric constant based on bearing type; S1 is a constant based on bearing type; S2 is a constant based on bearing type and seal; Kr0, KL0, and KZ0 are geometric constants based on bearing type; and VM0 is the drag loss variable.
The frictional moment of the cylindrical roller bearing is [26,27,28]
M 0 = ϕ r i ϕ r s M r 0 + M s 0 + M s e 0 + M d 0
where M0 is total friction torque of the bearing, Mr0 is rolling friction torque of the bearing, Ms0 is sliding friction torque of the bearing, Mse0 is friction torque of the bearing seal ring, Md0 is friction torque due to eddy current drag and splash, ϕri is the heat reduction factor, and ϕrs is the lubricating oil backfill reduction factor.
A single row of cylindrical roller bearings (SKF bearing series) that are not fully loaded is adopted in the study with no seal ring structure; therefore, the effect of the frictional moment of the seal ring is not considered, Mse0 = 0.

3.1.1. Rolling Friction Moment of Cylindrical Roller Bearing

The rolling friction moment of the cylindrical roller bearing is [26,27,28]
{ M r 0 = G r 0 ( μ n z ) 0.6 G r 0 = R 1 d m 2.41 F r 0.31 F r = 2 Ttan ϑ d 1 cos β
where nz is bearing speed, u is dynamic viscosity, Gr0 is the rolling friction variable of the bearing, dm is the pitch diameter of the bearing, ϑ is pressure angle of meshing gear, and Fr is radial load of the bearing.

3.1.2. Sliding Friction Moment of Cylindrical Roller Bearing

The sliding friction moment of roller bearing can be calculated as [26,27,28]
{ M s 0 = G s 0 μ s 0 G s 0 = S 1 d m 0.9 F a + S 2 d m F r
where Gs0 is the sliding friction variable of bearing, μs0 is the sliding friction coefficient, and Fa is axial load of the bearing.

3.1.3. Drag Friction Moment of Cylindrical Roller Bearing

In a high-speed heavy-duty gearbox, frictional torque of the bearing due to drag caused by viscosity of the lubricating oil has the largest influence on total frictional torque, regardless of whether the bearing is partially or wholly immersed in lubricating oil in the gearbox.
Without considering internal dimensions of the gearbox or other nearby components, the frictional moment due to viscous drag of the cylindrical roller bearing is [26,27,28]
{ M d 0 = 10 V M 0 K r 0 B d m 4 n z 2 K r 0 = K L 0 K z 0 ( d + D ) D d × 10 12
where VM0 is the drag loss variable, D is outer diameter of the bearing, d is inner diameter of the bearing, and B is width of the bearing.

3.1.4. Reduction of Friction Coefficient Due to Heat and Backfill

When the bearing is fully lubricated, an oil film forms, but is comprised of only a small amount of the total volume of lubricating oil. The rest of the oil flows out of raceway and produces backflow, which generates shear heating. In addition, when the bearing operates at high speeds, the rolling element repeatedly passes over the raceway and a large amount of lubricating oil is extruded, reducing the amount of lubricating oil covering the bearing.
In both cases, the viscosity of the lubricating oil and the oil film thickness of the rolling friction component decrease, which can be expressed as [26,27]
{ ϕ r i = 1 1 + 1.84 × 10 9 ( n d m ) 1.28 ν 0.64 ϕ r s = 1 e K r s υ n ( d + D ) K Z 2 ( D d )
where Krs and Kz are geometric constants and ν is kinematic viscosity of the oil.

3.1.5. Analysis of Total Power Loss of Cylindrical Roller Bearing

The power loss of cylindrical roller bearing is
P R = 0.001 M 0 ω z = 1.047 × 10 4 M 0 n z
where ω z is angular velocity of the bearing.

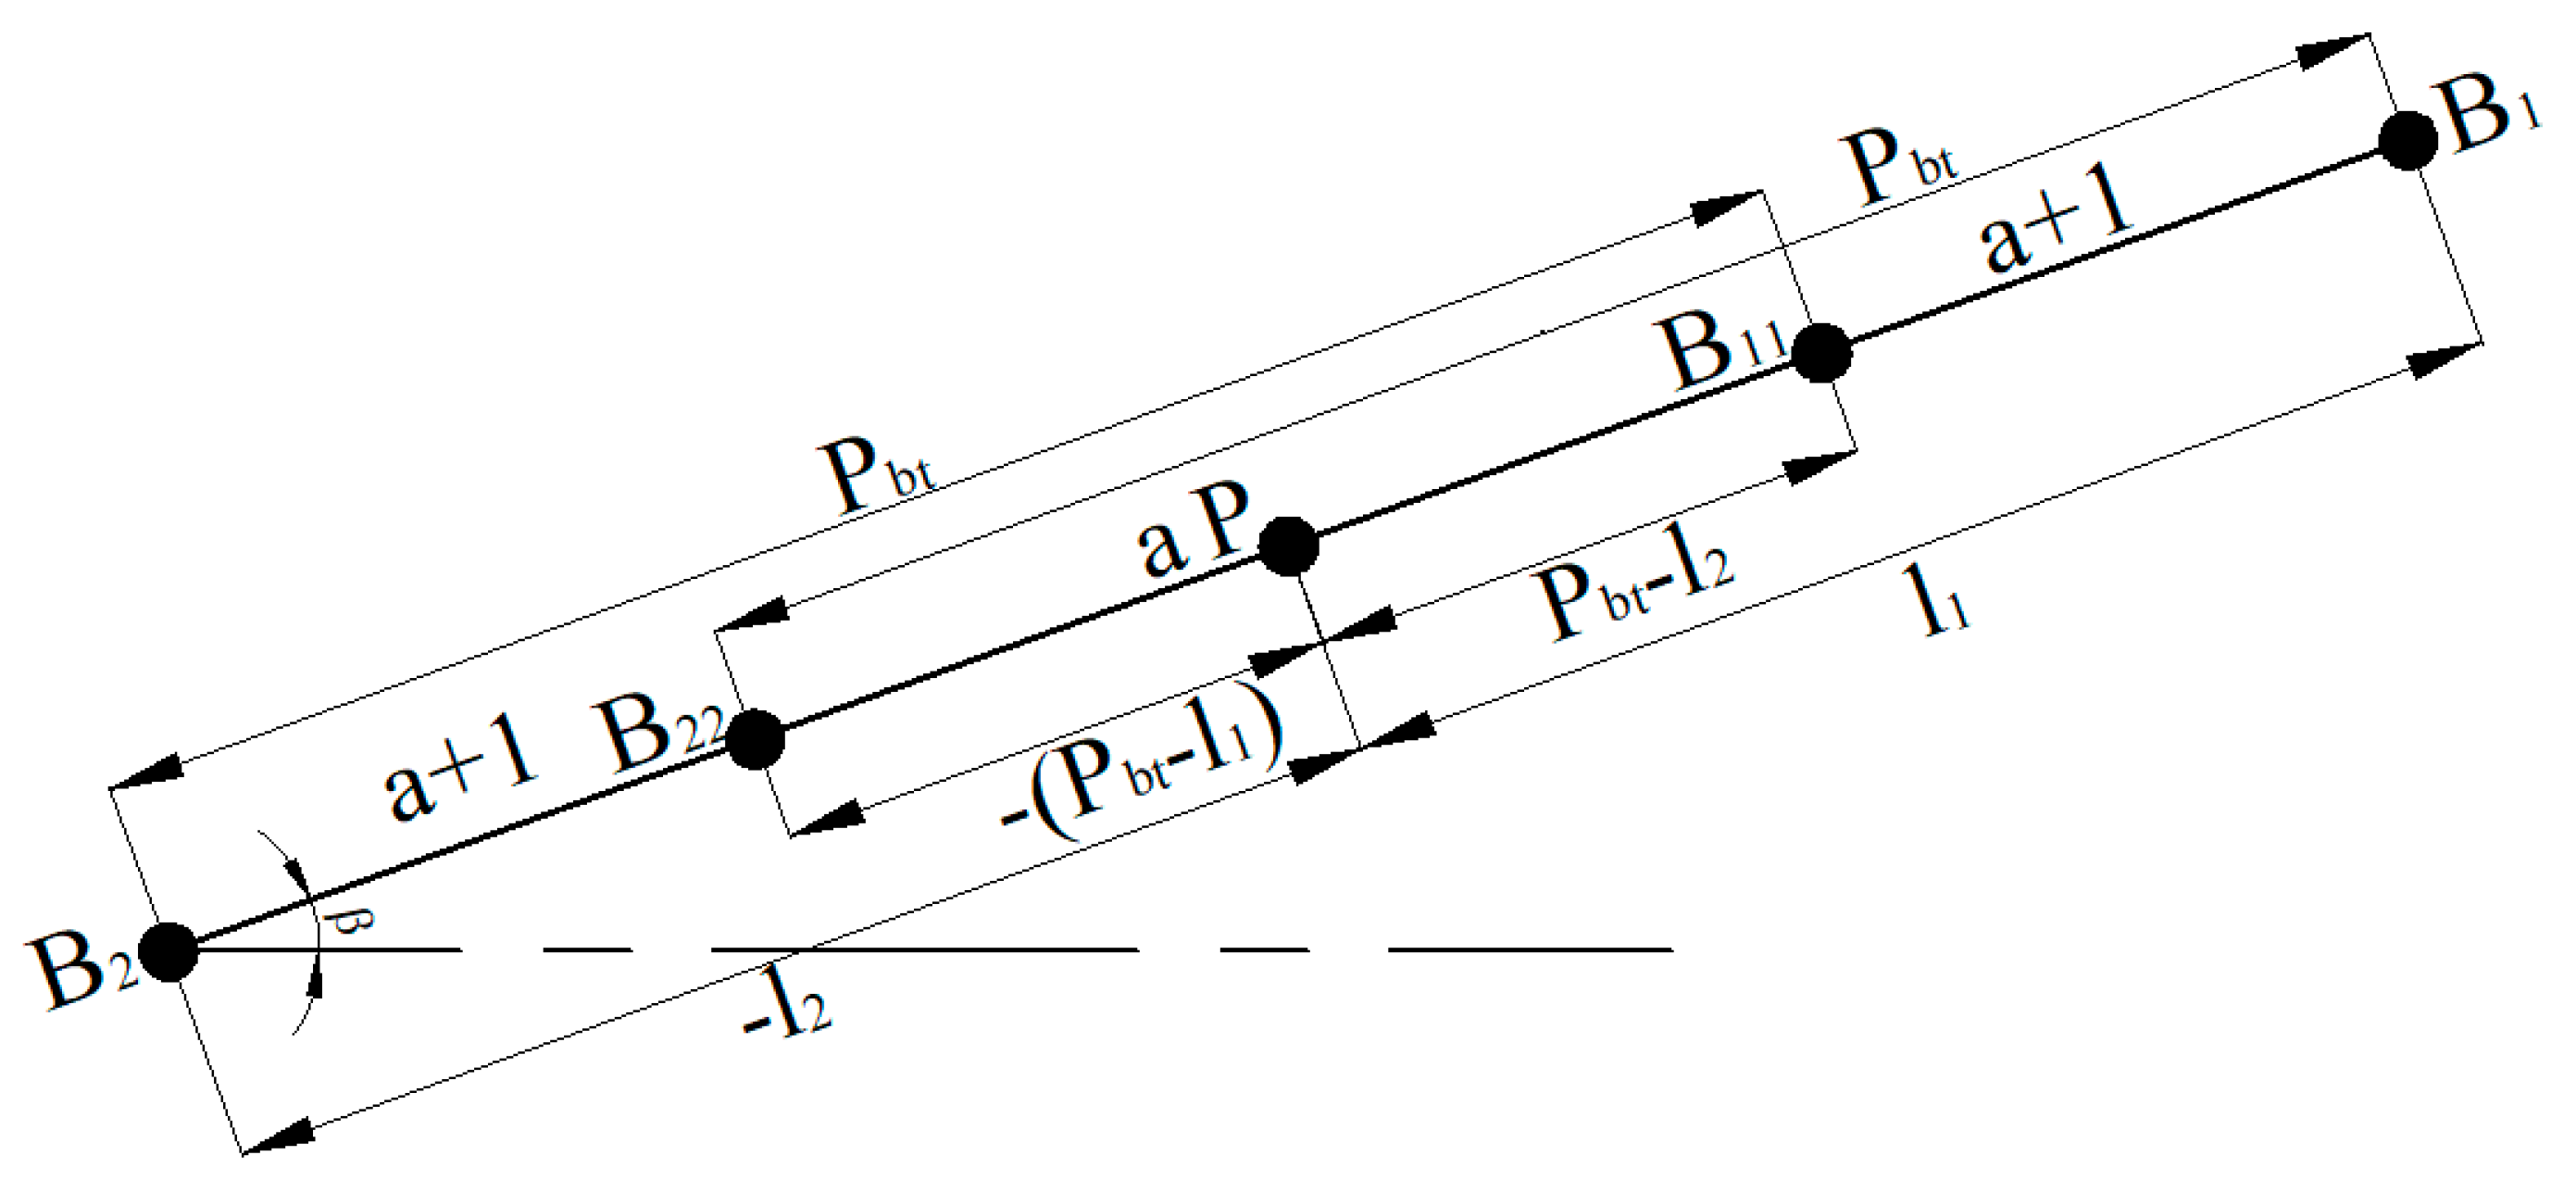
3.2. Power Loss Due to Gear Meshing

Frictional power losses associated with the gear surface can be divided into sliding friction power loss and rolling friction power loss. The total losses are related to the lubrication condition (friction coefficient of the gear surface), gear speed, and load acting on the gear tooth surface. Moreover, windage power loss is related to the viscosity of the lubricating oil, gear speed, gear radius, gear width, and so on.

3.2.1. Calculation of Gear Frictional Power Loss

The internal and external gears affect relative sliding speeds of tooth surfaces during operation. As shown in Figure 5, the theoretical meshing segment is N1N2 and the actual meshing segment is B1B2. The point of intersection of the centerline and mesh line when two gears are meshing is P. At contact point K, the sliding speed of gear 1 relative to gear 2 is [29]
V 12 = ( ω 1 + ω 2 ) l = ω 1 z 1 ( 1 z 1 + 1 z 2 ) l
where ω is angular velocity; z is number of gear teeth; subscripts 1 and 2 denote gear 1 and gear 2, respectively; and l is the distance from meshing point to node P.
Because V12 = 0 at node P, PN2 represents the positive direction. Power before and after the node, Pf+ and Pf-, are not the same. Friction loss near node P is [29]
P f ± ( l ) = F f · V 12 = ± f F N ω 1 z 1 ( 1 z 1 + 1 z 2 ) l
where f is the tooth surface sliding friction coefficient and FN is normal force of the tooth surface.
Gear drives typically have three lubrication states:
  • Under the EHL (Elastohydrodynamic lubrication) state, friction surfaces of the meshed teeth are completely separated by a viscous fluid film. The film thickness is determined by relative sliding speed of the tooth surfaces. Pressure generated by the fluid film balances the external load.
  • With boundary lubrication, gear teeth must be separated by boundary lubrication in order to separate the tooth flanks. However, absolutely smooth tooth flanks do not exist, and for this reason, almost all gears work in a hybrid lubrication state.
  • In the hybrid lubrication state, the elastic oil film will either be in a mixed or boundary-lubricated state. Mixed lubrication refers to the combination of fluid lubrication and boundary lubrication, that is, the normal load is shared by the fluid lubrication film and the boundary film, and the friction force includes fluid damping and boundary friction components.
Accurately estimating the minimum oil film thickness between tooth profiles is an important basis for analyzing the lubrication state of gears. The calculation formula of the minimum oil film thickness is as follows:
h m i n = 1.6 α 0.6 ( u ν e ) 0.7 E e 0.03 R e 0.43 δ 0.13
where ve is the the suction speed of the meshing point, Re is the equivalent radius of curvature of the meshing point, and Ee is the equivalent elastic modulus.
The viscosity of lubricating oil is affected by temperature and pressure; the relationship is as follows:
μ = μ 0 e α p
loglog ( u + a ) = b c logT
where p is lubricating oil pressure and a, b, and c are constants related to lubricating oil.
The film thickness ratio is an important parameter of the lubrication state of the gear friction pair. When the film thickness ratio coefficient λ < 1.4, it is the boundary lubrication state; when 1.4 < λ < 3, it is the mixed lubrication state; and when λ > 3, it is the elastohydrodynamic lubrication state.
λ = h m i n R a 1 2 + R a 2 2
Considering the empirical formula proposed by Benedict and Kelley [29], which involves more comprehensive factors and better practical application effect, this empirical formula is used for the friction factor in this paper.
f = 0.0127 ( 50 50 39.37 s f ) lg ( 29.66 δ u V s V r 2 )
where sf is the gear surface roughness (root mean square roughness); δ is the unit load and Vs and Vr are the instantaneous sliding speed and rolling speed of the meshing point, respectively.
From the perspective of the end face of the helical gear, the helical gear can be regarded as the superposition of an infinite number of thin-walled spur gears rotating a helix angle. When the front face wheel of the helical gear enters into engagement and disengages, its engagement is exactly the same as that of a pair of spur gears. To simplify the calculation, we assume that the gear teeth are subjected to equal loading during meshing. When contact ratio is aεra + 1, the load acting on the tooth is FN/a. As shown in Figure 6, N1N2 includes all meshed segments of the helical gear drive, B1B2 is a meshed segment of the tooth, N2B1 and B2N1 are the a + 1 meshed segments, and node P is located inside meshed tooth segment a. For P(l), friction power loss in the whole meshed segment can be obtained by taking the average integral value of the meshing segment [28].
P f = 1 P b t N 1 N 2 P f ± ( l ) d l
Integrating Equation (17) along N1N2, we obtain
P f = 1 P b t ( 3 4 l 2 ( P b t l 1 ) P f d l + ( P b t l 1 ) 0 P f d l + 0 P b t l 2 P f + d l + 3 4 P b t l 2 l 2 P f + d l ) = 1 4 P b t f F N ω 1 z 1 ( 1 z 1 + 1 z 2 ) ( P b t 2 + 2 l 1 2 P b t l 1 + 2 l 2 2 P b t l 2 )
where Pbt is normal pitch of the end face.
The transmission efficiency calculation of an internal helical gear is similar to the calculation for external meshing. The force diagram of a pair of internal helical gears is presented in Figure 7. The sliding speed V21 of gear 2 relative to gear 1 is [29]
P f ± ( l ) = F f · V 21 = ± f F N ω 2 z 2 ( 1 z 1 1 z 2 ) l
Similar to the meshing analysis for the external gear, friction power loss in the internal gear can be calculated as [29]
P f = 1 4 P b t f F N ω 2 z 2 ( 1 z 1 1 z 2 ) ( P b t 2 + 2 l 1 2 P b t l 1 + 2 l 2 2 P b t l 2 )

3.2.2. Rolling Friction Power Loss

When a pair of teeth engage at point K from node P, the relative rolling speed at the engagement point is [28]
V T = [ ω 1 ( P b t l 2 + l ) + ω 2 ( l 1 P b t + l ) ] × 10 3
The average rolling speed VTM is obtained by integrating the instantaneous speed along the meshing line N1K.
V T M = 0 B 1 K V T d l B 1 K = 0 B 1 K { [ ω 1 ( P b t l 2 + l ) + ω 2 ( l 1 P b t + l ) ] × 10 3 d l } B 1 K
According to Crook [30], an empirical formula can be derived from experimental data on the EHL of rolling friction.
F = 0.09 h b cos β
where h is the oil film thickness, b is the tooth width, and β is the helical gear helix angle.
P V T M = F · V T M
According to [31], oil film thickness h is
h = 3.07 α 0.57 κ 0.4 ( ν V T M ) 0.71 E 0.03 χ 0.11
where α is the pressure-viscosity coefficient of the lubricant, κ is the radius of curvature of the tooth profile, χ is the load factor, and E is the comprehensive elastic modulus.
From ANSI/agma6011-i03 [32], the formula for estimating the meshing power loss for a high-speed gear transmission is
P m = ( 22 0.8 α n ) 0.01 P 1 [ z 1 + z 2 z 1 z 2 ]

3.2.3. Calculation of Power Loss Due to Gear Transmission Windage

As free space inside the gearbox is reduced during power transmission, the contact area between the surrounding air and a rotating body, such as a gear moving at a higher rotational speed, increases relative to the volume reduction, resulting in windage. This increases the relative motion between rotating parts, which is accompanied by agitation of the lubricating oil. Furthermore, windage heats the inside of the gearbox, which can lead to the formation of oil mist. Heating, agitation, and other phenomena become more serious as the gear rotational speed increases.
According to Anderson et al. [33], the gear windage power loss can be calculated as
P = 1.047 × 10 4 T · n
Moreover, torque T can be expressed as
T = ρ ω 2 R 5 2 ( 1 + 2.3 b R ) 0.09 R e 0.2
where Re is the Reynolds number, which can be expressed as
R e = ρ ω R 2 μ
Thus, the windage power loss calculation model can be obtained.
P w = C 1 ( 1 + 2.3 b R ) ρ e q 0.8 n 2.8 R 4.6 μ e q 0.2
C 1 = 2.04 × 10 8
ρ e q = ρ + 34.25 ρ a i r 35.25
μ e q = μ + 34.25 μ a i r 35.25
where b is the tooth width, μeq is the dynamic viscosity of the air–oil mixture, μeq is the air–oil equivalent density, ρair is the air density, μair is the air dynamic viscosity, and R is the pitch radius.

4. Power Flow Diagram of Herringbone Gear Planetary Drive System

4.1. System Power Flow

The two-stage herringbone planetary transmission system is illustrated in Figure 8. A schematic representation of the structure is depicted in Figure 8a and the corresponding power flow diagram is shown in Figure 8b. The power flow diagram uses the following conventions: components are represented by a solid circle, bearing contacts are represented by a hollow circle, and teeth contacts are shown as a hollow triangle. In the first diagram, 1 represents the frame, 2 denotes the first-stage sun gear, 3 represents the first-stage transmission planet carrier, 4 is the first-stage ring gear, 4″ represents the secondary sun gear, 5 is the secondary planetary gear, 6 represents the secondary ring gear, and power is output via the secondary ring gear. Hollow circles PR1, PR2, and PR3 represent bearing contact power losses; hollow triangles PG2-3, PG3-4, PG4”-5, and PG5-6 represent gear meshing power losses; and subscript 2–3 indicates that gear 2 and gear 3 are meshed.

4.2. System Equations

According to the law of conservation of energy, basic power balance equations at the nodes are
{ P I N = P 2 I N + P R 1 P 2 I N = P 32 + P G 2 3 P 32 = P 43 + P G 3 4 + P 63 P 43 = P 4 4 + P R 2 P 4 4 = P 5 4 + P G 4 5 P 5 4 = P G 5 6 + P 51 + P 65 P 51 + P R 3 = 0 P o u t = P 63 + P 65 P R 4
The transmission efficiency of the system is equal to the ratio of output power to input power, which can be calculated as follows:
η I N 2 = P I N P R 1 P I N = P 2 I N P I N × 100 %
η 2 3 = P 32 P 32 + P G 2 3 = P 32 P 2 I N × 100 %
η 3 4 = P 43 P 43 + P G 3 4 × 100 %
η 4 4 = P 4 4 P 4 4 + P R 2 = P 4 4 P 43 × 100 %
η 4 5 = P 54 P 54 + P G 4 5 = P 54 P 4 4 × 100 %
η 5 6 = P 65 + P 63 P 65 + P G 5 6 + P R 3 + P R 4 = P 65 + P 63 P 54 + P R 4 × 100 %

5. Case Study

In a 1-DOF planetary gear train with six links, as shown in Figure 8, input power turns the sun gear and the power is subsequently split among the planetary gears (3, 4, 5, 6), and then transmitted via the ring gear to the output shaft. The rotational speed of each axis is listed in Table 2. The main parameters of the high-speed heavy-load herringbone gear transmission system are listed in Table 3. The rated speed of the gear system is 10,000 rpm, and the rated power is 1000 Kw.

5.1. Power Flow Analysis Ignoring Power Loss

Power flow through the system can be described as follows.
Hypothesis PIN = 1:
{ P I N = P 2 I N = P 32 P 32 = P 43 + P 63 P 43 = P 4 4 = P 54 = P 65 P o u t = P 63 + P 65

5.2. Power Flow Analysis Considering Power Loss

The flow diagram of power loss along the transmission path is shown in Figure 9 and the results of the transmission efficiency calculations are presented in Table 4.
Table 4 shows the transmission efficiency when power is transmitted along the transmission path. The transmission efficiencies of planetary transmission systems with 3, 4, 5, and 6 planetary gears are shown on the line graphs presented in Figure 10, and were calculated as 96.53%, 95.45%, 94.37%, and 93.32%, respectively.
Transmission efficiencies of each transmission element along the transmission path as well as the total efficiencies are presented in Figure 11. As shown in Figure 11a, different power losses occur in different components of the planetary gear transmission system. The transmission efficiency from gear 2 to gear 3 and from gear 4 to gear 5 is lower because the sun gear meshes with multiple planet gears. Therefore, wind resistance loss and tooth surface friction loss will be large. As shown in Figure 11b, each transmission element produces some power loss and the total power loss is the sum of power losses of single elements.
It can be noticed that tooth surface friction efficiency decreases and windage efficiency increases as speed increases, and bearing friction efficiency decreases very slowly. Figure 12 shows that 4.2 per cent of the total loss is owing to bearing friction, 5.3 percent of the total loss is owing to windage, and 90.5 per cent of the total loss is owing to tooth friction with an input speed of 4920 rpm. It further shows that 3.9 per cent of the total loss is owing to bearing fricition, 15.1 per cent of the total loss is owing to windage, and 81 per cent of the total loss is owing to tooth friction with an input speed of 9348 rpm. Y Diab studies the power loss in high-speed gears based on experiments. Analysing the distribution of each power loss, 46 per cent of the total loss is owing to windage [34]. Therefore, in the gear transmission system, distribution of each power loss is related to the structure and working conditions of the gear system. Different input conditions will also leasd to the different power loss distribution.
Under high-speed and heavy-load conditions, owing to the relatively high sliding speed of the meshing tooth surface, the instantaneous temperature rise directly affects the internal temperature of the gear system. As shown in Figure 13, the higher the tooth surface temperature, the smaller the power loss, because the viscosity of the lubricating oil decreases with the increasing temperature.

5.3. Results and Discussion

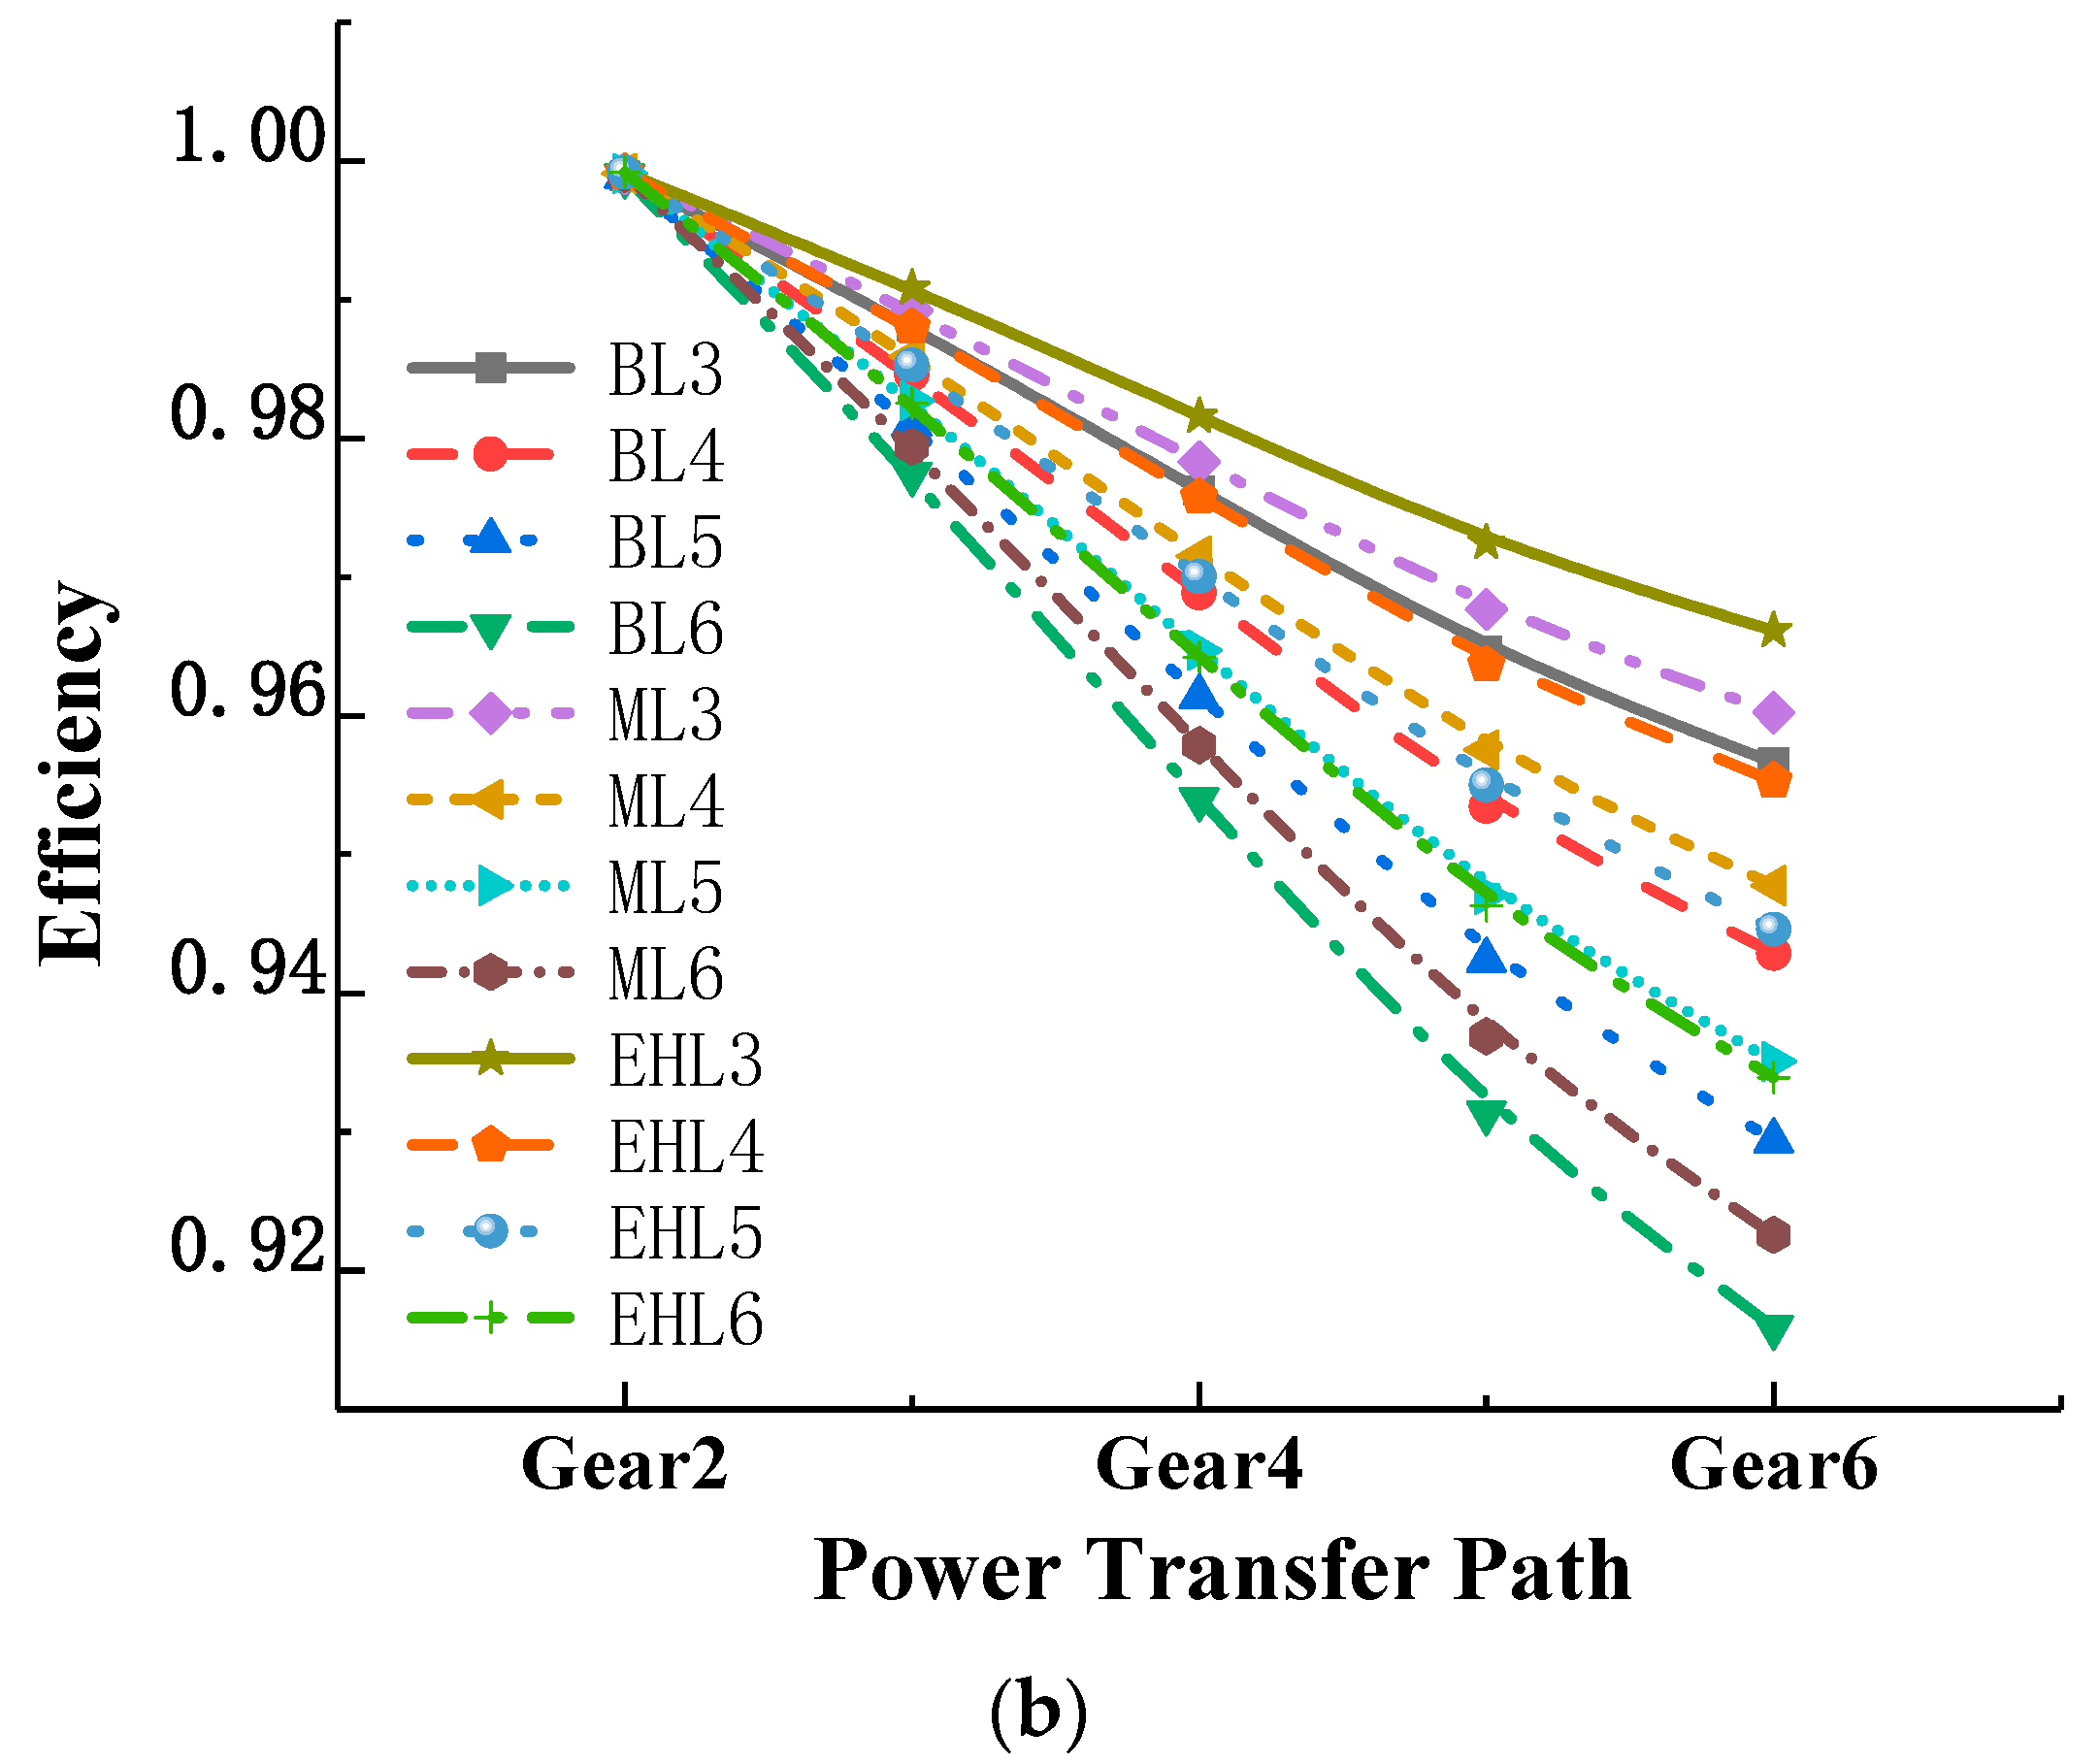
5.3.1. Analysis of Transmission Efficiency under Different Lubrication Conditions

Power losses of the gear system under three possible lubrication conditions are shown in Figure 14. With boundary lubrication, partial surface contact occurs between rough tooth surfaces and the friction coefficient is highest. As relative density and relative dynamic viscosity of the lubricating oil increase, windage loss will also increase.
In the EHL state, the viscous fluid membrane completely separates the two gear tooth surfaces, thereby greatly reducing the friction coefficient. The mixed lubrication state occurs when only part of the contact surface is under the EHL condition and other areas of the contact surfaces are in the boundary lubrication state.
Transmission efficiency of the gear system is highest under the EHL condition, followed by the mixed lubrication state, and is lowest under the boundary lubrication state. As the number of planetary gears increases, power losses increase and transmission efficiency drops, as shown in Figure 15.

5.3.2. Variation of Transmission Efficiency with Input Speed

The input speed was varied while the input torque remained constant and the transmission efficiency of the herringbone planetary transmission system was analyzed. Variation of power loss with input speed is shown in Figure 16. Frictional power losses on the tooth surface increased as the rotational speed increased, and the windage power loss increases, suggesting that, when the rotational speed increases, the increase in resistance due to the surrounding air is greater than the increase of frictional power loss. The bearing power loss is different at different positions. The power loss at bearing 2 is the largest. With the speed increment, the total power loss at the bearing increases. As shown in Figure 17, the gear meshing efficiency slowly decreases as the rotational speed increases. However, windage losses rapidly increase, suggesting windage power loss is an essential consideration for gear systems operating at high rotational speeds.

5.3.3. Variation of Transmission Efficiency with Input Power

Various power inputs were analyzed under the same input speed, and the transmission efficiency of the herringbone gear planetary transmission system was calculated. As shown in Figure 18, power loss due to friction on the tooth surface increases rapidly, whereas the power loss of the bearing increases, and the power loss at the bearings 2 and 4 is higher than the power loss at locations 2 and 3. Frictional power loss is greatly affected by the friction factor and load on the tooth surface.
As gears rotate lubricant is flung off the gear teeth in small oil droplets owing to the centrifugal force acting on the lubricant. These lubricant droplets create a fine mist of oil that is suspended inside the gear housing. The effect of this oil mist is an increase in ‘friction resistance’ on the gears, and hence an increase in the power consumption. With the input torque increases, the expulsion of the oily atmosphere from the tooth spaces as the gear teeth come into engagement creates turbulence within the gearbox and increases the power consumption. As the power increases, the torque also increases, resulting in larger loads on the tooth surface and an increase in gear tooth frictional power loss. Moreover, the transmission efficiency of the herringbone planetary transmission system slowly increases as the input power increases.

5.4. Algorithm Verification

The proposed method was verified by comparing calculated efficiency values with previously published values. In [24], the transmission efficiency of a transmission system with five planetary gears and an input rotational speed of 12,300 rpm was calculated as 93.39%, versus 93.1% using the method proposed in this paper. Thus, our approach can correctly estimate the transmission efficiency of a herringbone planetary gear transmission system, which was slightly lower in this paper because we comprehensively considered power losses, whereas previously, only power losses associated with gear meshing were considered.
The power loss of the planetary transmission system in the literature [3,35] was calculated based on the method proposed in this paper, and the following results were obtained. As shown in the Figure 19, when the input torque is 1000 N·m, the method of calculation of tooth surface friction power loss in this paper is compared with the experimental results in the literature [35], and the total power loss of the gear transmission system is compared with the experimental results in the literature [3]. It can be concluded that the magnitude of power loss is the same, and as the speed increases, the trend of power loss is also consistent.

5.5. Summary

(1) This paper presented a formula for calculating the transmission efficiency of a power-split planetary gearbox. The transmission efficiency was calculated for a herringbone planetary gear transmission system with different numbers of planetary gears. The transmission efficiency was found to gradually decrease as power was transmitted along the transmission path; however, the rate at which the transmission efficiency decreased varied.
(2) The influence of power loss and transmission efficiency on the herringbone planetary transmission system was studied under different lubrication conditions. The results suggest that lubrication state has a large influence on transmission efficiency and selecting the optimal lubrication method can greatly reduce gear tooth frictional power loss and increase the transmission efficiency.
(3) The input speed was varied and the influence of power losses and transmission efficiency of the herringbone planetary transmission system was studied. When the rotational speed increased, the gear meshing efficiency decreased more slowly than the windage efficiency. Moreover, input speed was found to have a larger influence on windage power loss than on gear tooth frictional power loss. Thus, windage power loss should not be neglected in transmission efficiency calculations, particularly when gears operate at higher speeds.
(4) Finally, the input power was varied and the influence of power losses on the transmission efficiency of the herringbone planetary transmission system was analyzed. Frictional power loss at the tooth surface was found to rapidly increase with increasing input power, whereas the windage power loss hardly changed at all. Furthermore, the transmission efficiency of the gear transmission system increased with the increasing input power.

6. Conclusions

In this paper, a mathematical power loss model was combined with power flow diagrams to study the efficiency of planetary gear transmission systems. A novel method for analyzing the transmission efficiency of complex planetary gear systems based on the hypergraph was introduced and the power loss model was established by considering several power losses sources such as gear meshing friction, windage, and bearing friction. The proposed method was then used to analyze power loss and transmission efficiency of a two-stage herringbone gear transmission system under different lubrication conditions, input speeds, and input power. The results suggest that all of the main loss factors should be considered in the transmission efficiency calculation; in particular, windage loss should not be neglected, particularly for gears operating at high speeds. Studying the influence of various power loss factors is necessary for developing methods to improve transmission efficiency; thus, this paper provides a useful reference for analyzing and improving gear transmission efficiency.

Author Contributions

Conceptualization, Y.W. and W.Y.; methodology, Y.W.; software, X.T.; validation, Y.W., W.Y., and X.T.; formal analysis, Y.W.; investigation, X.L.; resources, Z.H.; data curation, Y.W.; writing—original draft preparation, Y.W.; writing—review and editing, W.Y.; visualization, Y.W.; supervision, W.Y.; project administration, W.Y.; funding acquisition, W.Y. All authors have read and agreed to the published version of the manuscript.

Funding

This research was funded by National Key R & D Projects [grant number No: 2018YFB2001502], and Chongqing Natural Science Foundation [grant number No: cstc2018jcyjAX0468].

Conflicts of Interest

The authors declare no conflict of interest.

References

  1. Yuan, S.; Dong, H.; Li, X. Contact analysis of helical gears based on MEPE and EHL theories. J. Tribol. 2012, 32, 286–290. [Google Scholar] [CrossRef]
  2. Nutakor, C.; Kłodowski, A.; Sopanen, J.; Mikkola, A.; Pedrero, J.I. Planetary gear sets power loss modeling: Application to wind turbines. Tribol. Int. 2017, 105, 42–54. [Google Scholar] [CrossRef]
  3. Kahraman, A.; Hilty, D.R.; Singh, A. An experimental investigation of spin power losses of a planetary gear set. Mech. Mach. Theory 2015, 86, 48–61. [Google Scholar] [CrossRef]
  4. Tang, X.L.; Yang, W.; Hu, X.S.; Zhang, D.J. A novel simplified model for torsional vibration analysis of a series-parallel hybrid electric vehicle. Mech. Syst. Signal Process. 2017, 85, 329–338. [Google Scholar] [CrossRef]
  5. Yang, W.; Tang, X.L.; Liang, Q. Tooth Surface Contact Analysis of Involute Rotate Vector Reducer Based on a Finite Element Linear Programming Method. IEEE Access 2019, 7, 176719–176731. [Google Scholar] [CrossRef]
  6. Xu, L.X.; Chen, B.K.; Li, C.Y. Dynamic modelling and contact analysis of bearing-cycloid-pinwheel transmission mechanisms used in joint rotate vector reducers. Mech. Mach. Theory 2019, 137, 432–458. [Google Scholar] [CrossRef]
  7. Xu, L.X. A dynamic model to predict the number of pins to transmit load in a cycloidal reducer with assembling clearance. Proc. Inst. Mech. Eng. Part C J. Mech. Eng. Sci. 2019, 233, 4247–4269. [Google Scholar] [CrossRef]
  8. Yang, W.; Tang, X.L. Modelling and modal analysis of a hoist equipped with two-stage planetary gear transmission system. Proc. Inst. Mech. Eng. Part K J. Multibody Dyn. 2017, 231, 739–749. [Google Scholar] [CrossRef]
  9. Xu, L.X.; Han, Y.C.; Dong, Q.B.; Jia, H.L. An approach for modelling a clearance revolute joint with a constantly updating wear profile in a multibody system: Simulation and experiment. Multibody Syst. Dyn. 2019, 45, 457–478. [Google Scholar] [CrossRef]
  10. Mo, S.; Ma, S.; Guoguang, J.; Jiabei, G.; Ting, Z.; Shengping, Z. Design principle and modeling method of asymmetric involute internal helical gears. Proc. Inst. Mech. Eng. Part C J. Mech. Eng. Sci. 2018, 233, 244–255. [Google Scholar] [CrossRef]
  11. Tang, X.L.; Hu, X.S.; Yang, W.; Yu, H.S. Novel Torsional Vibration Modeling and Assessment of a Power-Split Hybrid Electric Vehicle Equipped with a Dual-Mass Flywheel. IEEE Trans. Veh. Technol. 2018, 67, 1990–2000. [Google Scholar] [CrossRef]
  12. Mo, S.; Zhang, Y.; Wu, Q.; Wang, F.; Matsumura, S.; Houjoh, H. Load Sharing Behavior of Star Gearing Reducer for Geared Turbofan Engine. Chin. J. Mech. Eng. 2017, 30, 796–803. [Google Scholar] [CrossRef]
  13. Marques, P.M.T.; Martins, R.C.; Seabra, J.H.O. Gear dynamics and power loss. Tribol. Int. 2016, 97, 400–411. [Google Scholar] [CrossRef]
  14. Diez-Ibarbia, A.; del Rincón, A.F.; de-Juan, A.; Iglesias, M.; Garcia, P.; Viadero, F. Frictional power losses on spur gears with tip reliefs. The load sharing role. Mech. Mach. Theory 2017, 112, 240–254. [Google Scholar] [CrossRef] [Green Version]
  15. Fernandes, C.M.C.G.; Marques, P.M.T.; Martins, R.; Seabra, J. Gearbox power loss. Part II: Friction losses in gears. Tribol. Int. 2015, 88, 309–316. [Google Scholar] [CrossRef]
  16. Benedict, G.H.; Kelley, B.W. Instantaneous Coefficient of Gear Tooth Friction. ASLE Trans. 1961, 4, 59–70. [Google Scholar] [CrossRef]
  17. Shao, Y.; Li, X.; Li, H. Efficiency Analysis of Planetary Gear Train under Ring Gear Deformation. In Proceedings of the 18th International Conference on Control, Automation and Systems (ICCAS 2018), YongPyong Resort, PyeongChang, Korea, 17–20 October 2018. [Google Scholar]
  18. Wang, C.; Wang, S.-R.; Wang, G.-Q. A method for calculating gear meshing efficiency by measured data from gear test machine. J. Cent. South Univ. Nat. Sci. Ed. 2018, 119, 97–101. [Google Scholar] [CrossRef]
  19. Xue, H.-L.; Liu, G.; Yang, X.-H. A review of graph theory application research in gears. Proc. Inst. Mech. Eng. Part C J. Mech. Eng. Sci. 2015, 230, 1697–1714. [Google Scholar] [CrossRef]
  20. Liu, J.; Yu, L.; Zeng, Q.; Li, Q. Synthesis of multi-row and multi-speed planetary gear mechanism for automatic transmission. Mech. Mach. Theory 2018, 128, 616–627. [Google Scholar] [CrossRef]
  21. Ayats, J.G.; Diego-Ayala, U.; Minguella-Canela, J.; Fenollosa, F.; Vivancos, J. Hypergraphs for the analysis of complex mechanisms comprising planetary gear trains and other variable or fixed transmissions. Mech. Mach. Theory 2012, 51, 217–229. [Google Scholar] [CrossRef]
  22. Laus, L.; Simas, H.; Martins, D. Efficiency of gear trains determined using graph and screw theories. Mech. Mach. Theory 2012, 52, 296–325. [Google Scholar] [CrossRef]
  23. Chen, C.; Chen, J. Efficiency analysis of two degrees of freedom epicyclic gear transmission and experimental validation. Mech. Mach. Theory 2015, 87, 115–130. [Google Scholar] [CrossRef]
  24. Li, J.; Hu, Q. Power Analysis and Efficiency Calculation of the Complex and Closed Planetary Gears Transmission. In Proceedings of the 3rd International Conference on Power and Energy Systems Engineering, CPESE 2016, Kitakyushu, Japan, 8–12 September 2016. [Google Scholar]
  25. Yang, F.; Feng, J.; Zhang, H. Power flow and efficiency analysis of multi-flow planetary gear trains. Mech. Mach. Theory 2015, 92, 86–99. [Google Scholar] [CrossRef]
  26. Carlos, F. Power Loss in Rolling Bearings and Gears Lubricated with Wind Turbine Gear Oils. Ph.D. Thesis, Porto Engineering University, Porto, Portugal, 2015. [Google Scholar] [CrossRef]
  27. Tang, X.; Zou, L.; Yang, W.; Huang, Y.; Wang, H. Novel mathematical modelling methods of comprehensive mesh stiffness for spur and helical gears. Appl. Math. Model. 2018, 64, 524–540. [Google Scholar] [CrossRef]
  28. Xu, L.; Yang, Y. Dynamic modeling and contact analysis of a cycloid-pin gear mechanism with a turning arm cylindrical roller bearing. Mech. Mach. Theory 2016, 104, 327–349. [Google Scholar] [CrossRef]
  29. Radzevich, S.P. Theory of Gearing; CRC Press: Boca Raton, FL, USA, 2012. [Google Scholar]
  30. Crook, A.W. The lubrication of rollers IV. Measurements of friction and effective viscosity. Philos. Trans. R. Soc. 1963, 255, 281–312. [Google Scholar] [CrossRef]
  31. Dowson, D.; Higginson, G. Elasto-Hydrodynamic Lubrication; Pergamon: Oxford/London, UK, 1977. [Google Scholar]
  32. AGMA. Specification for High Speed Helical Gear Units: ANSI/AGMA 6011—I03, 1st ed.; Alexandria, S., Ed.; AGMA: Alexandria, VA, USA, 2004. [Google Scholar]
  33. Dawson, P.H. Windage Loss in Larger High-Speed Gears. Proc. Inst. Mech. Eng. 1984, 198, 51–59. [Google Scholar] [CrossRef]
  34. Diab, Y.; Ville, F.; Velex, P. Investigations on power losses in high-speed gears. Proc. Inst. Mech. Eng. Part J 2014, 220, 191–198. [Google Scholar] [CrossRef]
  35. Talbot, D.; Kahraman, A. A methodology to predict power losses of planetary gear sets. In Proceedings of the International Gear Conference 2014, Lyon, France, 26–28 August 2014; pp. 625–635. [Google Scholar]
Figure 1. Photographs of herringbone tooth drive. (a) Structure of herringbone gear; (b) herringbone gear transmission.
Applsci 10 05849 g001
Figure 2. Schematic representation of herringbone planetary gear transmission system. (a) Herringbone planetary gear structure; (b) cross-sectional view of planetary gear; (c) schematic of transmission structure; (d) hypergraph of power loss mechanism (1, 2, 3, and 4 denote the frame, sun gear, planetary gear, and ring gear, respectively; R1, R2, and R3 represent bearing contacts and G2-3 and G2-4 represent tooth surface contacts, respectively).
Applsci 10 05849 g002
Figure 3. Kinematic relationship between gear 2, gear 3, and carrier 1.
Applsci 10 05849 g003
Figure 4. Main factors affecting gear transmission power loss.
Applsci 10 05849 g004
Figure 5. Schematic diagram of external helical gear transmission.
Applsci 10 05849 g005
Figure 6. Schematic diagram of helical gear engagement.
Applsci 10 05849 g006
Figure 7. Schematic diagram of internal gear transmission.
Applsci 10 05849 g007
Figure 8. Double-stage herringbone planetary gear transmission system. (a) Schematic drawing; (b) power flow diagram; (c) graphical representation of fixed rotary.
Applsci 10 05849 g008
Figure 9. Flowchart of gear drive power loss calculation process.
Applsci 10 05849 g009
Figure 10. Variation of efficiency along the transmission path using hypergraph method. (a) Three planetary gears; (b) four planetary gears; (c) five planetary gears; (d) six planetary gears.
Applsci 10 05849 g010aApplsci 10 05849 g010b
Figure 11. Transmission efficiency along the power transmission path. (a) Efficiency of each transmission element; (b) efficiency along the transmission path.
Applsci 10 05849 g011
Figure 12. Power loss distribution according to the rotational speed for an input power of 424 Kw. (a) Power loss distribution according to the rotational speed; (b) partially enlarged view of the figure.
Applsci 10 05849 g012
Figure 13. Comparison of power loss as functions of Ωsun at 50 °C and 90 °C.
Applsci 10 05849 g013
Figure 14. Power losses of herringbone planetary gear transmission system under different lubrication conditions. (a) Power loss due to tooth friction; (b) windage power loss; (c) total power loss.
Applsci 10 05849 g014aApplsci 10 05849 g014b
Figure 15. Transmission efficiency under different lubrication conditions. (a) Efficiency of each transmission element along the transmission path; (b) efficiency along the transmission path.
Applsci 10 05849 g015aApplsci 10 05849 g015b
Figure 16. Variation of power loss with input speed. (a) Frictional power loss on tooth surface; (b) windage power loss; (c) bearing power loss at different positions; (d) bearing friction power loss.
Applsci 10 05849 g016aApplsci 10 05849 g016b
Figure 17. Variation of efficiency loss with input speed. (a) Gear meshing efficiency loss; (b) windage efficiency loss.
Applsci 10 05849 g017
Figure 18. Variation of power loss and transmission efficiency with input power. (a) Gear tooth frictional power loss; (b) bearing power loss; (c) total power loss; (d) total transmission efficiency.
Applsci 10 05849 g018
Figure 19. Power loss comparison with literature experimental results. (a) Tooth surface friction power loss; (b) total power loss.
Applsci 10 05849 g019
Table 1. Main parameters of cylindrical roller bearing.
ParameterR1S1S2KL0KZ0KrsVM0
Value1.48 × 10−60.161.5 × 10−30.655.16 × 10−81.2 × 10⁻⁴
Table 2. Rotational speed of each gear shaft (rpm).
n 1 n 2 n 3 n 4 n 5 n 6
04920−4640−1190.41344429.6
Table 3. Main parameters of high-speed heavy-duty herringbone gear transmission system.
Gear ParameterPinionGear
Number of teethz2 = z4″ = 35
z3 = z5 = 31
z4 = z6 = 97
Normal modulus (mm)7
Normal pressure angle (°)20
Helix angle β (°)22
Tooth width (mm)80
Elastic modulus (Gpa)210
Poisson’s ratio0.3
Root mean square roughness (um)0.1
Face addendum coefficient1
Face radial coefficient0.25
Ambient temperature (K)323
Ambient viscosity (Pa.s)0.08
Bearing inner diameter (mm)110
Bearing outer diameter (mm)170
Bearing width (mm)38
Bearing clearance (mm)0.06
Input speed (rpm)4920
Input power (kW)424
Table 4. Transmission efficiency when power transmitted along the transmission path.
Efficiency (%)ηIN-2η2-3η3-4η4-5η5-6
Number of Planetary Gears
399.9898.8399.0998.8999.23
499.9898.4698.8298.5298.97
599.9898.0898.5598.1698.71
699.9897.7198.2997.7998.46

