Article

Spatial and Temporal Variation in Microbial Diversity and Community Structure in a Contaminated Mangrove Wetland

1
School of Geography, South China Normal University, Guangzhou 510631, China
2
Faculty of Science, Engineering and Built Environment, Deakin University, Burwood VIC 3125, Australia
*
Authors to whom correspondence should be addressed.
Appl. Sci. 2020, 10(17), 5850; https://doi.org/10.3390/app10175850
Submission received: 2 July 2020 / Revised: 20 August 2020 / Accepted: 21 August 2020 / Published: 24 August 2020
(This article belongs to the Section Environmental Sciences)

Abstract

:
Field and laboratory investigations were conducted to characterize bacterial diversity and community structure in a badly contaminated mangrove wetland adjacent to the metropolitan area of a megacity in subtropical China. Next-generation sequencing technique was used for sequencing the V4–V5 region of the 16s rRNA gene on the Illumina system. Collectively, Proteobacteria, Chloroflexi, Planctomycetes, Actinobacteria and Bacteroidetes were the predominant phyla identified in the investigated soils. A significant spatial variation in bacterial diversity and community structure was observed for the investigated mangrove soils. Heavy metal pollution played a key role in reducing the bacterial diversity. The spatial variation in soil-borne heavy metals shaped the spatial variation in bacterial diversity and community structure in the study area. Other environmental factors such as total carbon and total nitrogen in the soils that are affected by seasonal change in temperature could also influence the bacterial abundance, diversity and community structure though the temporal variation was relatively weaker, as compared to spatial variation. The bacterial diversity index was lower in the investigated site than in the comparable reference site with less contaminated status. The community structure in mangrove soils at the current study site was, to a remarkable extent, different from those in the tropical mangrove wetlands around the world.

1. Introduction

Mangrove forests are rich, diverse and complex ecosystems that are distributed in tidal zones of tropical and subtropical regions around the world [1,2]. Mangrove wetlands are among the most productive ecosystems, which provide unique ecosystem goods and services for human society and coastal/marine systems [3,4]. The microorganisms inhabiting mangrove soils play an important role in facilitating the biogeochemical cycling of carbon, sulfur, nitrogen, phosphorus, etc., and promoting plant growth by generating phytohormone and siderophore [5,6].
There have been increasing research interests in microbiomes in mangrove soils by using next-generation sequencing in recent years [6,7]. Available reports showed that the structure of microbial community in mangrove soils tended to change in response to variations in environmental conditions such as vegetation type [8], water salinity and tidal flooding [9], pollution [7,10] and nutrient supply status [11].
Tidal sediments/soils adjacent to metropolitan areas are subject to contamination by heavy metals [12]. It is well established that heavy metal pollution can inhibit microbial activities and consequently affect the microbial community structure in the contaminated soils [13]. However, detailed research work linking microbial characteristics with heavy metal contamination in mangrove soils has been so far limited to tropical areas [10]. In this study, we investigated the characteristics of the bacterial community in subtropical mangrove soils that were contaminated by heavy metals in a mangrove wetland adjacent to a megacity with a population of 12.53 million people. The objective was to characterize the bacterial community in the mangrove soils with a focus on the seasonal and spatial variations in the community structure in the investigated area.

2. Materials and Methods

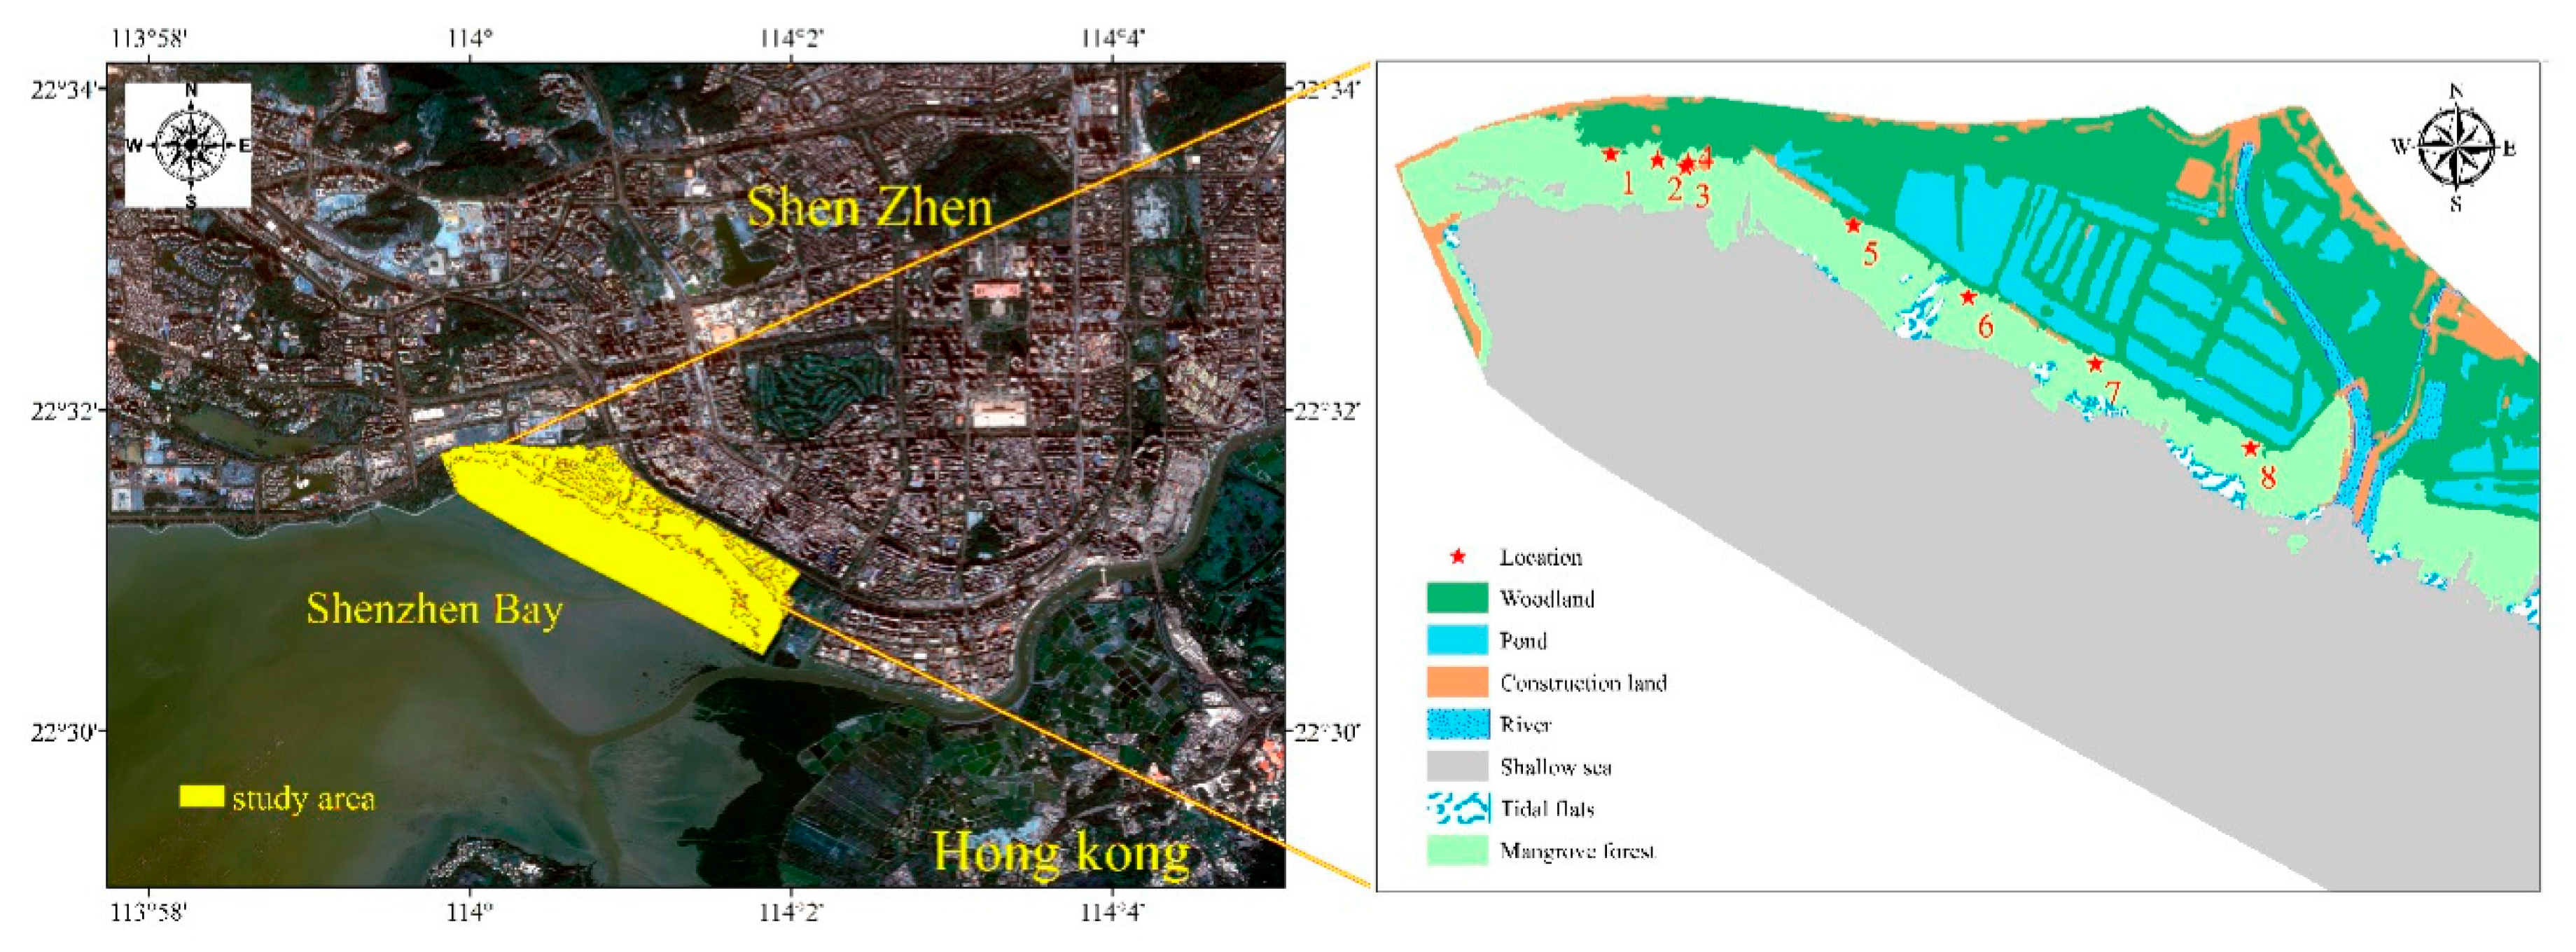
2.1. Site Description and Sampling Methods

The sampling area (22°30′–22°32′ N, 113°56′–114°3′ E) is part of the Futian National Mangrove Nature Reserve located in Shenzhen City, Guangdong Province, China (Figure 1). This area is subject to a subtropical marine climate with a mean annual temperature of 22.4 °C and a mean annual rainfall of 1940 mm. The rainy season usually occurs from May to September and the average annual relative humidity is 74%. The tides in Shenzhen Bay are semidiurnal with an average range of 1.9 m [14]. Shenzhen Bay receives discharges from three major rivers: the Pearl River from the northwest, the Shenzhen River from the northeast, and the Yuen Long River from the southeast. Previous reports showed that mangrove soils in the Futian National Mangrove Nature Reserve have been badly contaminated by heavy metals [15,16].
Futian National Mangrove Nature Reserve has a total area of 367 ha with approximately 100 ha being covered by various types of mangrove plants. The reserve was divided into three functional zones: core zone (122.20 ha), buffer zone (131.58 ha) and experimental zone (113.86 ha). Eight locations across the whole area of the reserve were selected for collection of soil samples (Figure 1). Site accessibility was taken into account when selecting these sampling locations, as part of the fieldwork risk assessment. A composite sampling method [17] was used to collect a representative soil sample at each of the eight locations for soil characterization. Three discrete soil samples within 1 m2 were taken from the 0–10 cm layer at each sampling location in two sampling campaigns: one in July 2018 and another in January 2019. The soil samples were put in sealable plastic bags, stored in an ice box and transported to the laboratory within 6 h.

2.2. Analytical Methods

2.2.1. Soil Pretreatment

In the laboratory, large stones and plant roots contained in the soil samples were removed. For microbiological analysis, a portion (approximately at an equal amount) was taken from each of the three soil samples collected at each location to form a composite sample by thorough mixing. The sample for microbiological analysis was stored at −80 °C in a freezer prior to use. Chemical analysis was done using the unmixed soil samples (i.e., three samples for each location) after oven-drying at 60 °C, grinding with a pestle and mortar, and passing through a 0.149 mm sieve.

2.2.2. Soil Chemical Analysis

Total carbon (TC) and total nitrogen (TN) were determined by an elementar vario EL cube multi-element analyzer (Elementar Analysensysteme GmbH, Germany). Soil pH and electrical conductivity (EC) were measured in a 1/2.5 (w/w) soil suspension by a portable pH meter and EC meter, respectively. The heavy metals in soils were determined by inductively coupled plasma mass spectrometry (IPC-MS Agilent 7700) after digesting 0.13 g of soil with 8 mL of HNO3 and 2 mL of HF in a microwave digestion system (MARSTM 6). The internal standard method was applied to test the recovery of heavy metals. In this study, the recoveries of heavy metals ranged from 93.23% to 103.41%.

2.2.3. Microbial DNA Isolation, PCR Amplification and MiSeq PE250 Sequencing

The microbial DNA was extracted from the soil samples using a Fast DNATM SPIN kit according to the manufacturer’s instructions (Mobio, Carlsbad, CA, USA). At the same time, soil samples in Lysing Matrix A tubes were homogenized three times (20 s for each time) using a FastPrep™ FP120 machine (MP Biomedicals, Solon, OH, USA) with the speed level set at 4. The V4–V5 region of the 16S rDNA gene was amplified from the microbial DNA by polymerase chain reaction (PCR) using modified primers 515F (5′-GTGCCAGCMGCCGCGG-3′) and 907R (5′- CCGTCAATTCMTTTRAGTTT-3-3′), as described by Li et al. [18]. The PCR products were purified with a PCR Clean-Up™ kit (MO BIO Labs, Solana Beach, CA, USA) and then sequenced using an Illumina MiSeq PE250 sequencer (Illumina, San Diego, CA, USA). All the analyses were performed by Genesky Biotechnologies Inc. in Shanghai.

2.2.4. Illumina Read Data Processing and Analysis

The raw data of sequences were assigned to samples according to their unique indices. The adaptor and primer sequences were removed from the sequences by using TrimGalore (version 0.5.0, Babragam Bioinformatics, UK, http://www.bioinformatics.babraham.ac.uk/projects/trim_galore/) and Mothur (version 1.25.1, USA, https://www.mothur.org/), respectively. Only the sequences >200 bp with an average quality score >20 and without ambiguous base calls were included in the subsequent analyses. The remaining sequences were clustered into operational taxonomic units (OTUs) at a sequence similarity level of 97%. Taxonomic annotation through the RDP database was performed by Mothur and obtained text files for different levels of taxonomy labels such as kingdom, phylum, class, order, family and genus. Raw reads data have been deposited in the NCBI sequence read archive (SRA) under accession number PRJNA640402 and PRJNA641273.

2.3. Statistical Analysis

The α-diversity indices of the microbial community such as Shannon and ACE indices, canonical correlation analysis (CCA) and the heatmap were determined using R (version 3.5.1,). Statistical analyses were carried out using IBM SPSS 24.0 version. A significant difference analysis was performed using a one-way ANOVA. Pearson’s correlation coefficient was used to test the interaction between different parameters. A post hoc multiple comparison for observed means from the IBM SPSS 24.0 was performed using Duncan’s multiple range test to further separate the mean to test for significant differences. All the diagrams were drawn using R (version 3.5.1) and Origin (version 8.0). The Kolmogorov–Smirnov test shows that the data obtained from this study are normally distributed.

3. Results

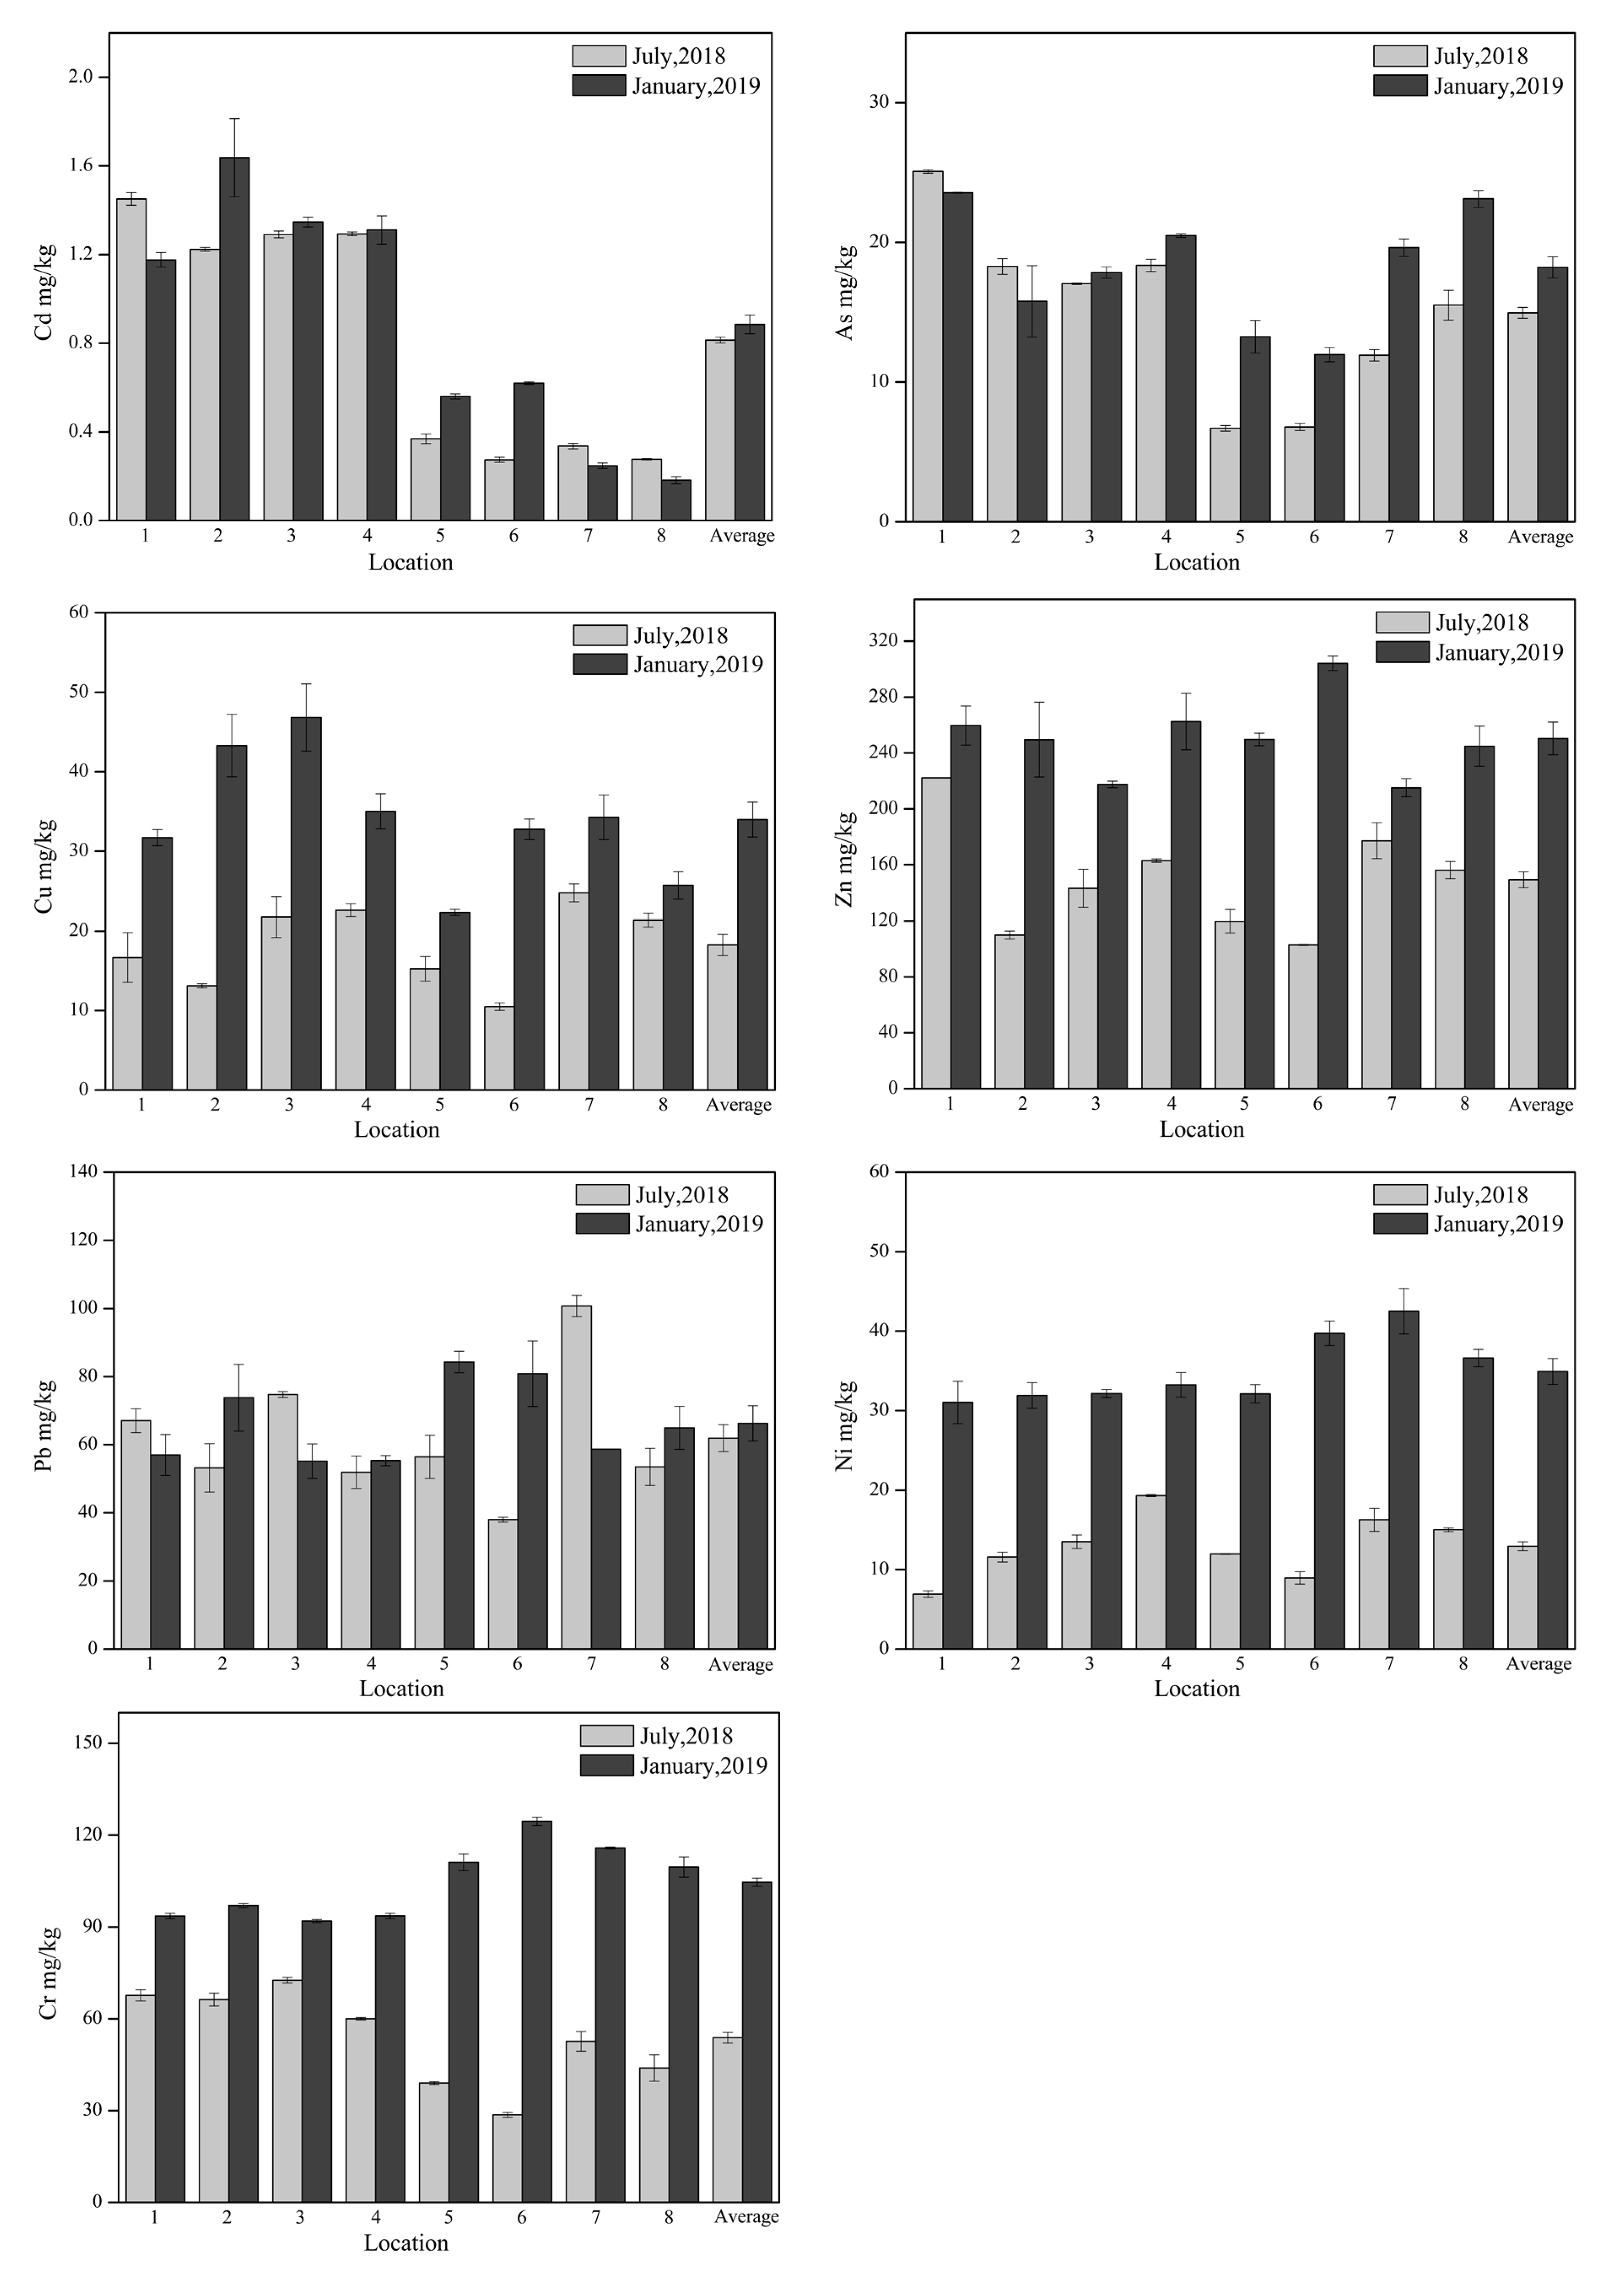
3.1. Soil Physicochemical Characteristics

The soil physicochemical properties were shown in Table 1. The pH value ranged from 6.44 to 7.13 with an average of 6.82. The highest and lowest EC values were recorded at Location 4 for the soil collected in January 2019 (19.10 mS cm−1) and Location 2 for the soil collected in July 2018 (3.45 mS cm−1), respectively. Total carbon (TC) and total nitrogen (TN) were spatially and temporally variable; TC ranged from 13.27 to 69.20 g/kg and from 28.65 to 102.93 g/kg for the soil collected in July 2018 and in January 2019, respectively, while TN ranged from 13.27 to 69.20 g/kg and from 28.65 to 102.93 for the soil collected in July 2018 and in January 2019, respectively. Besides, the concentration of both TC and TN was significantly higher in January 2019 than in July 2018, but there was no significant difference in the pH and EC.
The heavy metal concentrations for the investigated soils were presented in Figure 2. Generally, the concentration of heavy metals was in the following decreasing order: Zn > Cr > Pb > Cu > Ni > As > Cd. Most of the heavy metals exceeded the limits set for Class I marine sediment equality in the National Standard of China [17] except for As. In particular, Cd had a concentration almost 5 times higher than the Class I value set for marine sediment equality. In general, the concentration of most heavy metals tended to be higher in Locations 1–4 than in Locations 5–8. For example, Cd concentration in Location 2 was 1.64 ± 0.18 mg/kg while Cd concentration in Location 8 was only 0.18 ± 0.02 mg/kg. The concentration of Zn, Cr, Ni and Cu was significantly higher in the sample collected in January 2019, as compared to that collected in July 2018. However, the concentrations of Cr, Zn and As did not show significant differences between the two sampling campaigns.

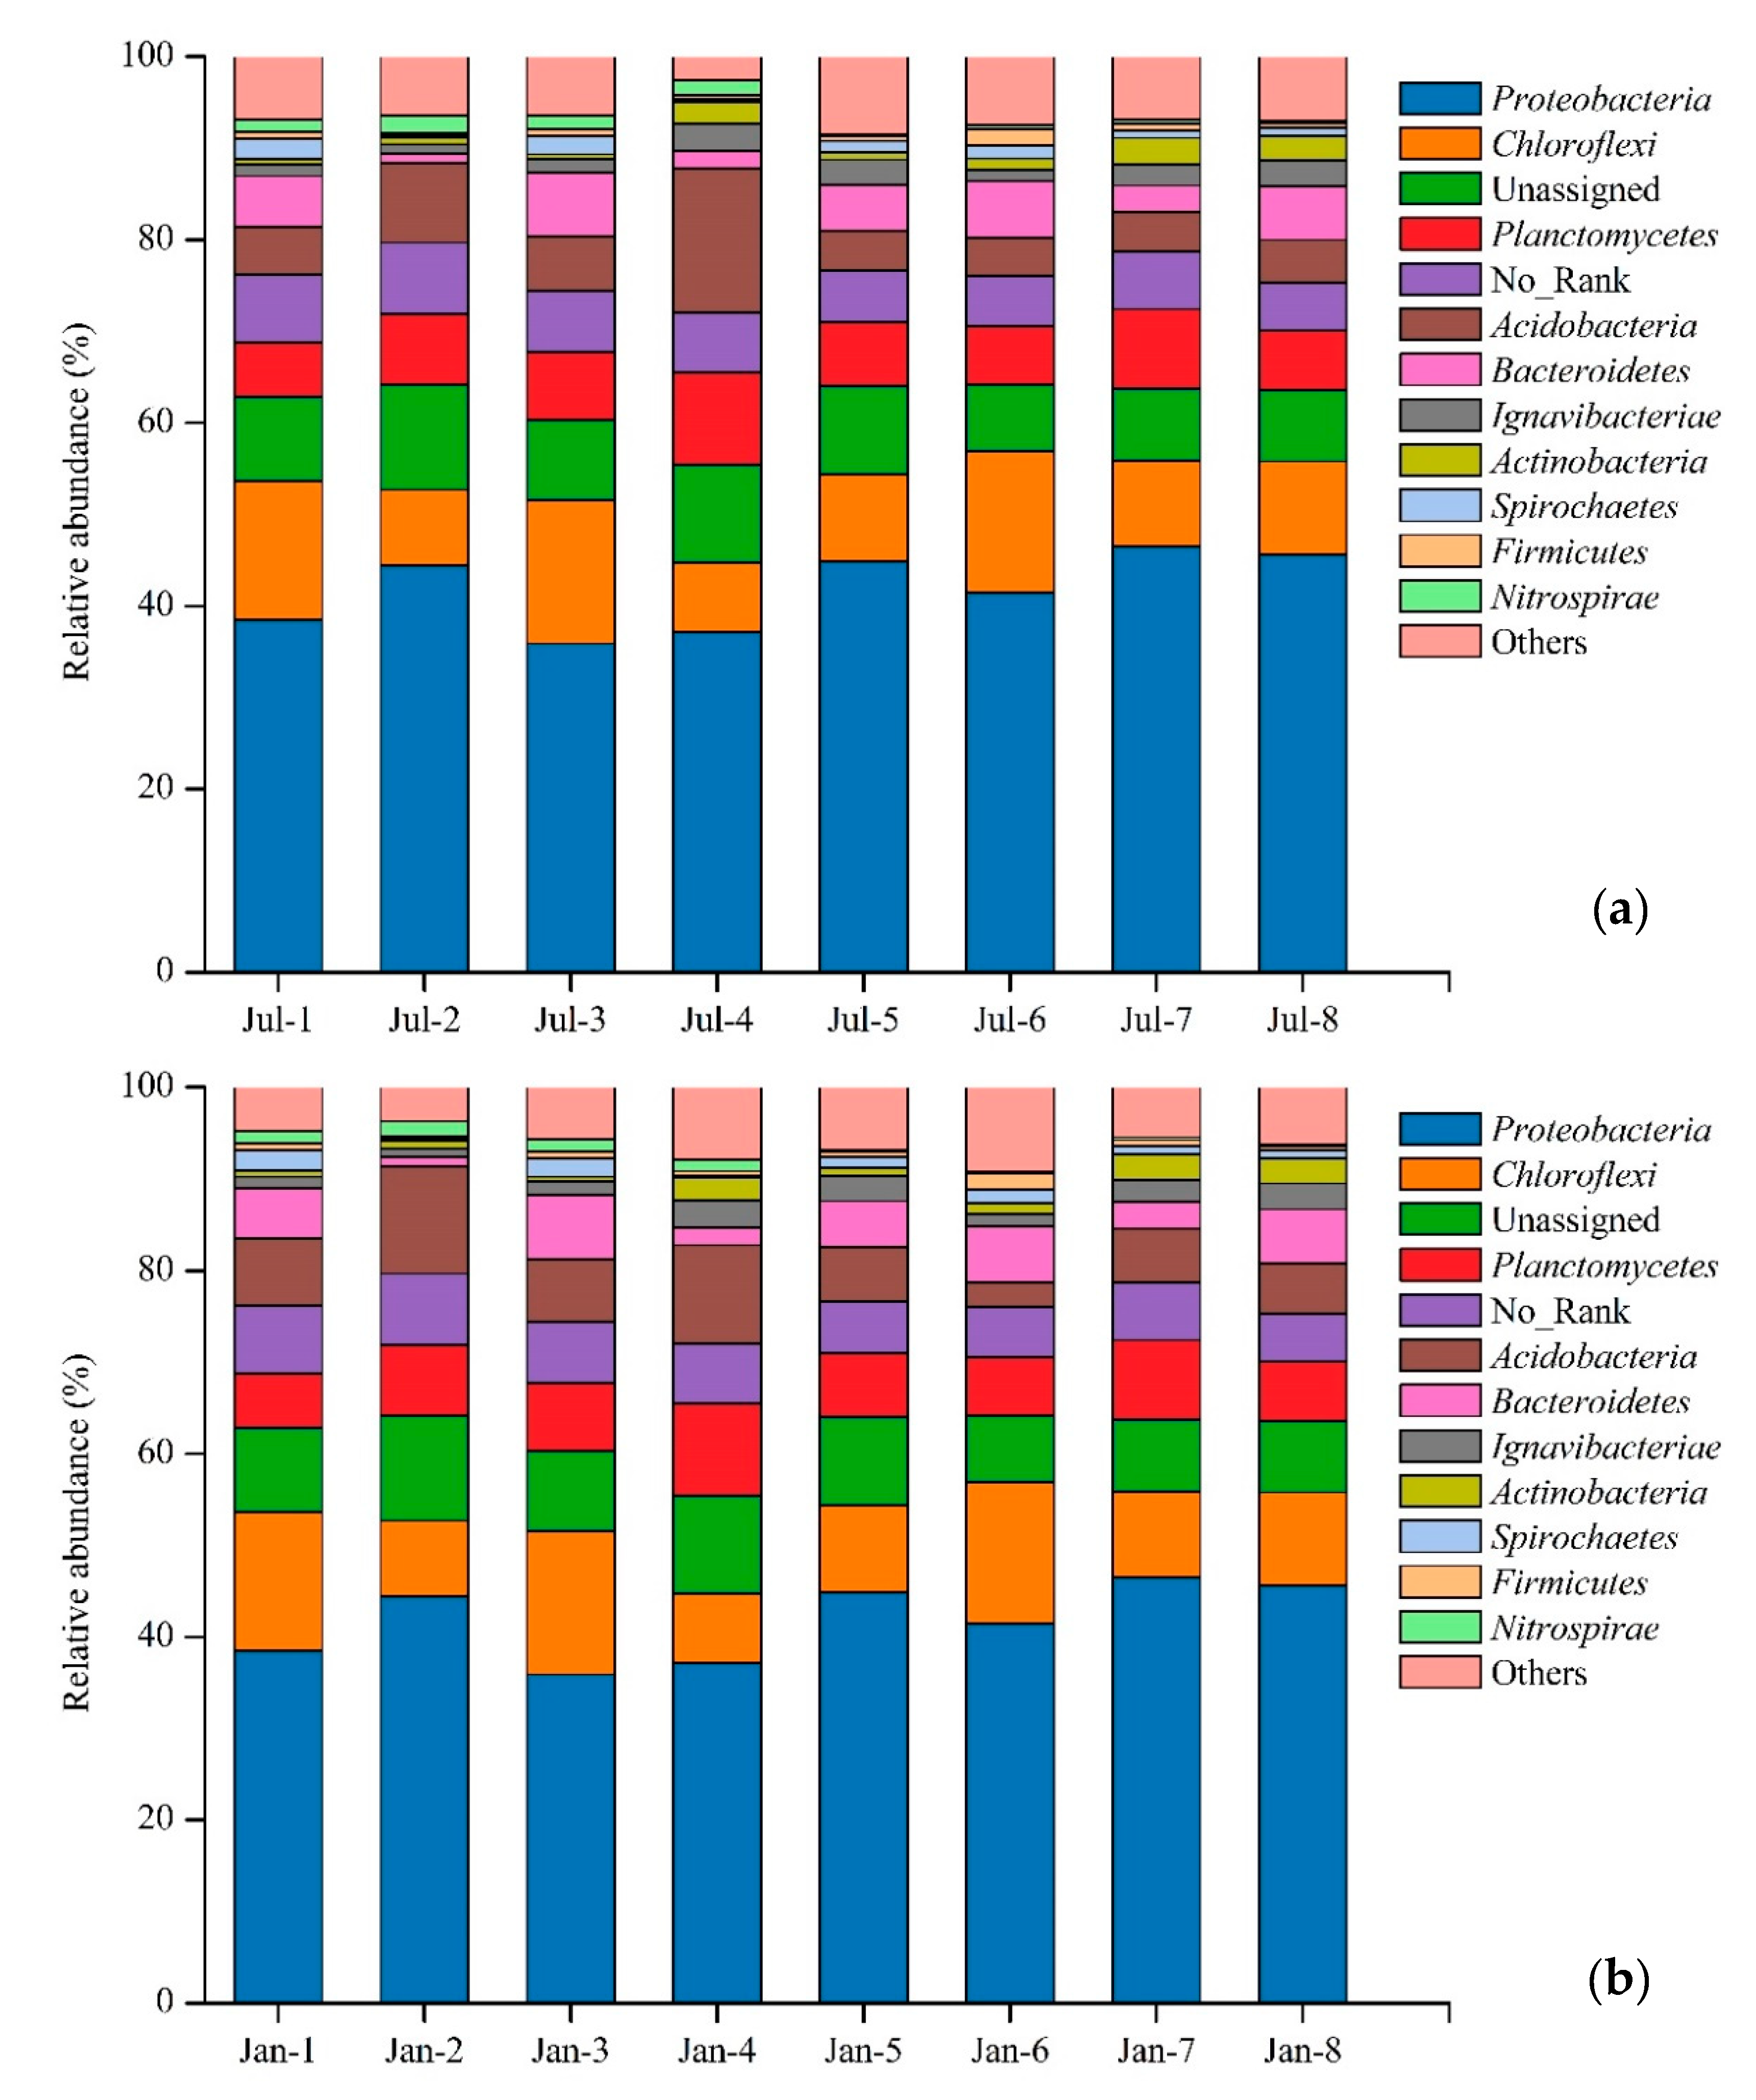
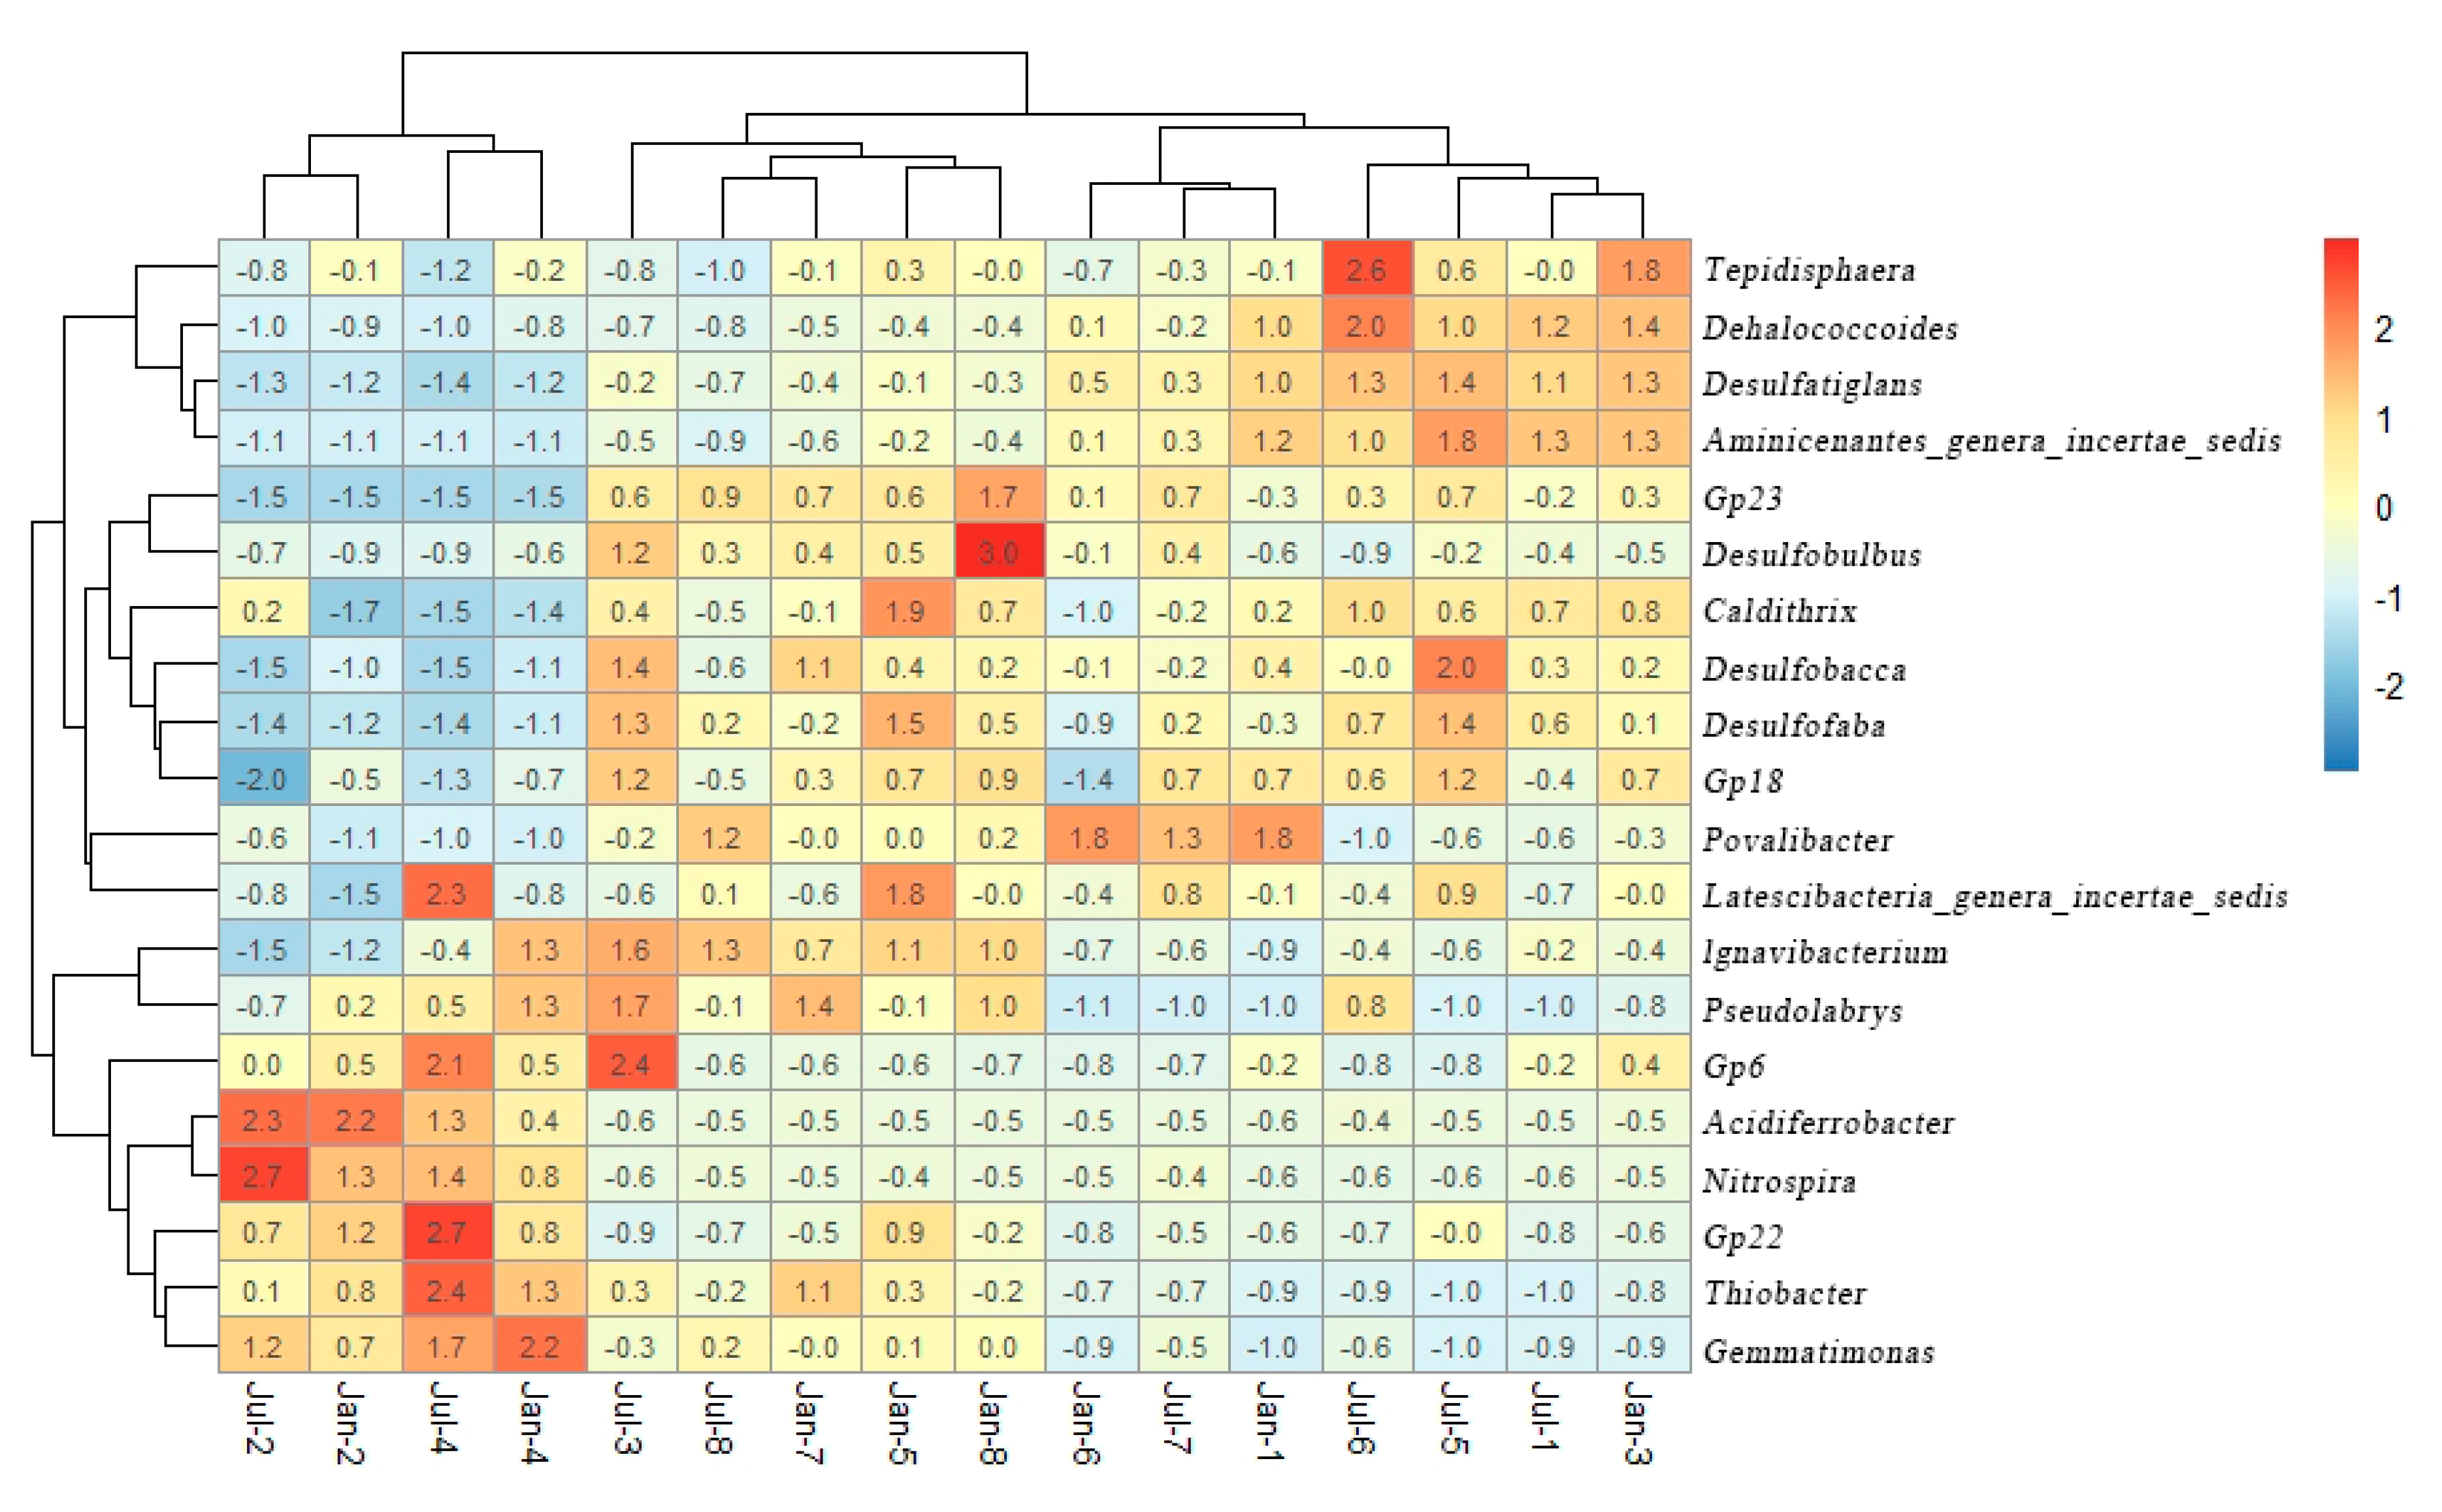
3.2. Soil Microbial Community

There were 3,722,533 valid sequences of 16S rDNA being clustered into 128,730 OTUs from all the 16 soil samples. The numbers of taxon tags ranged from 210,165 to 264,602 for the samples with Location 8 having the largest number of OTUs (166,432) and Location 3 having the smallest number of OTUs (126,439; Table 2). Alpha diversity index (Chao1 richness, ACE, Shannon and evenness) was shown in Table 2. The values of Shannon’s diversity index ranged from 6.79 to 7.85 and from 6.45 to 7.82 for the soils collected in July 2018 and January 2019, respectively. Both the values of Shannon’s diversity index and ACE metric indicated that Location 2 and Location 4 possessed lower species richness than others did. The same was observed for the Evenness. Furthermore, the average of Shannon’s diversity index in July 2018 (7.37) was slightly higher than that collected in January 2019 (7.34).
According to the sequencing results, over 90% of the reads fell within 41 bacterial phyla and the relative abundances of the bacteria at the phylum level were shown in Figure 3. On average, the five most abundant phylum-level bacteria were Proteobacteria (41.81%), Chloroflexi (11.38%), Planctomycetes (7.47%), Acidobacteria (6.86%) and Bacteroidetes (4.41%). At the class level, Deltaproteobacteria (19.75%), Gammaproteobacteria (11.16%), Alphaproteobacteria (5.40%), Anaerolineae (4.01%) and Betaproteobacteria (3.97%) were the five largest bacterial classes, accounting for 44.65% of the taxon tags. At the family level, the five most dominant families were Desulfobacteraceae (7.1%), Anaerolineaceae (4.33%), Ectothiorhodospiraceae (2.70%), Ignavibacteriaceae (1.94%) and Desulfobulbaceae (1.92%). At the genus level, Desulfatiglans (1.72%), Dehalococcoides (1.52%), Ignavibacterium (1.46%), Acidiferrobacter (1.42%) and Gp6 (1.41%) were the five largest genera.
The twenty most abundant genera were used to draw a heat map diagram (Figure 4). As shown in the heat map, Locations 2, 3 and 4 were characterized by the higher concentration of six genera, namely Gemmatimonas, Thiobacter, Nitrospira, Acidiferrobacter and GP6, but an opposite trend was observed at Locations 5 and 6. Further, the abundance of Dehalococcoides, Desulfatiglans and Gp18 were notably high at Locations 5 and 6, which was different from that at Locations 2 and 4. Notably, Desulfobulbus, Ignavibacterium and GP23 were more abundant at Locations 5, 6 and 7 during the January 2019 sampling campaign. Meanwhile, cluster analysis showed similarities between the microbial communities from the 8 sampling locations were in good agreement with their temporal characteristics except at Location 1.

4. Discussion

The current study showed that Cd, Zn, Cu and Pb were the dominant heavy metals at the investigated Futian mangrove soils according to their levels against the thresholds set for Class I marine sediment equality in the National Standard of China [15]. This is in good agreement with other published work showing that Cd, Cu and Zn were the major heavy metals in the Pearl River Estuary [19,20]. The more heavily contaminated status in Locations 1–4 than in Locations 5–8 was previously noted by Li et al. [21] and Xu et al. [16]. This was due to the closer proximity of Locations 1–4 to urban roads, as compared to Locations 5–8. The higher total carbon concentration of soils collected in January 2019 than that in July 2018 reflected the seasonal influence on soil carbon dynamics. It is well established that decomposition of organic matter tended to be slow during the winter season, resulting in the accumulation of soil organic carbon [22]. It is expected that spatial and temporal variations in the key soil parameters have impacts on microbial activities [23]. Spearman’s correlation analysis (Figure 5) between various environmental factors and the dominant bacteria at the phylum level indicated Proteobacteria and Chlamydiae had a positive correlation with TC and TN (p ≤ 0.01), while the Chloroflexi showed a negative correlation with TC (p ≤ 0.01). The pH was also a key factor influencing the community structure, as shown by Planctomycetes that had a strong negative relationship with pH (p ≤ 0.01). Furthermore, the canonical correlation analysis (CCA) between OTU and the basic soil properties allowed 65.35% of the variation in the species data being explained (Figure 6a). PERMANOVA showed that the contribution from the environmental factors towards the bacterial community structure was in the following decreasing order: TC > TN > Cd > EC > pH (Figure 6b). The dominant influence of the total carbon may reflect its role in providing carbon and energy sources for microbial growth [8].
Heavy metal pollution directly impacts the microbial ecosystem, including alterations in the physiology, diversity and abundance of microorganisms [10,24]. Spearman’s correlation analysis (Figure 5) showed that Cd had a strong positive correlation with the relative abundance of Nitrospirae and Acidobacteria phylum (p ≤ 0.01). The investigated area can be divided into two subareas based on the status of heavy metals in the soils (Figure 2): (a) higher-polluted area (Location 1–4) and lower-polluted area (Location 5–8). The relative abundance of Nitrospirae and Acidobacteria in the higher-polluted area was greater than that in the lower-polluted area (Figure 7). This suggests that these two bacterial phyla were more tolerant to heavy metal toxicity, as compared to other bacterial phyla, which was consistent with the results of previous studies [10,25]. Nitrospirae as important nitrite-oxidizing bacteria plays a special role in nitrogen cycling [26].
The studies also revealed that heavy metal could decrease bacterial diversity and abundance. The Venn diagram of bacterial OTUs (Figure 7c) showed that there were 10,725 core OTUs in the investigated area. The higher-polluted soils (Location 1–4) had 3103 and 4257 unique OTUs for July 2018 and January 2019, respectively. This was slightly lower than those in the lower-polluted soils (Location 5–8), which had 3231 and 4357 unique OTUs for July 2018 and January 2019, respectively. The bacterial diversity was generally greater in the lower-polluted soils (Location 5–8) than in the higher-polluted soils (Location 1–4; Figure 7d). Spearman’s correlation analysis (Table 3) showed that there was a stronger (p < 0.05) negative relationship between Cd and diversity index (ACE and Shannon). This confirms that increased heavy metal concentration could reduce bacterial diversity and abundance in the study area, which was in good agreement with the work by Zhang et al. [23].
The results from this study suggested that temporal variation in microbial structure was not remarkable. Proteobacteria was found to be the most predominant phyla in the soils collected during both sampling campaigns, which is consistent with previous research in other mangrove soils [27]. However, most of the diversity indices were significantly higher in the summer (July 2018) than in the winter (January 2019; Table 2 and Figure 7d), indicating a less diverse bacterial community in the winter. It was likely that the low temperature during winter time inhibited the activities of the bacteria [27]. There was work showing that there was no significant seasonal variation in bacterial abundance [28,29]. However, both OTUs number and Venn figure in this study indicated that the bacterial abundance was higher during the winter (January 2019) than during the summer (July 2018; Figure 7c and Table 2).
Mai Po Mangrove Wetland in Hong Kong, China is adjacent to the study area. In comparison, the Shannon index was higher in the Mai Po than in the current investigated area (Table 4). This may be attributable to the less contaminated status in the former [27]. Both sites shared 4 out of the 5 most abundant bacterial phyla with a slightly different order. The bacterial community structure in the current study area was also comparable to other mangrove sites along the South China coast with some levels of difference in terms of diversity index and community structure (Table 4), reflecting the difference in local environmental conditions that influence microbial activities. By comparison with some of tropical mangrove wetlands around the world, it is interesting to note that the community structure in the mangrove soils along the subtropical South China coast was, to a remarkable extent, different from those shown in the tropical reference sites though the most abundant phylum-level bacteria are the same (Table 4).

5. Conclusions

There was a significant spatial variation in bacterial diversity and community structure in the mangrove soils in the investigated area. Heavy metal pollution generally reduced the bacterial diversity and consequently the spatial variation in soil-borne heavy metals in the investigated area controlled the spatial variation in bacterial diversity and community structure. In addition, total carbon and total nitrogen in the soils that are affected by seasonal change in temperature could also influence the bacterial abundance, diversity and community structure though the temporal variation was relatively weaker, as compared to spatial variation. In comparison, the bacterial diversity index was lower, as compared to comparable reference site with less contaminated status. The community structure in mangrove soils at the current study site was, to a remarkable extent, different from those in the tropical mangrove wetlands around the world. The findings obtained from this study have implications for understanding the biogeochemical processes in the contaminated mangrove wetland for better management of the urban mangrove wetlands.

Author Contributions

Conceptualization, S.X. and J.M.; methodology, J.M., T.Z.; investigation, J.M., C.X., and D.S.; resources, S.X.; data curation, J.M. and T.Z.; writing—original draft preparation, J.M.; writing—review and editing, C.L.; visualization, J.M. and T.Z.; supervision, S.X. and C.L.; project administration, S.X.; funding acquisition, S.X. All authors have read and agreed to the published version of the manuscript.

Funding

This research was funded by the National Natural Science Foundation of China, grant number 41877411.

Acknowledgments

We are grateful to the support from International Training Project for Outstanding Young Scientific Research Talents in Guangdong Universities in 2018.

Conflicts of Interest

The authors declare no conflict of interest.

References

  1. Queiroz, L.d.S.; Rossi, S.; Calvet-Mir, L.; Ruiz-Mallén, I.; García-Betorz, S.; Salvà-Prat, J.; Meireles, A.J.d.A. Neglected ecosystem services: Highlighting the socio-cultural perception of mangroves in decision-making processes. Ecosyst. Serv. 2017, 26, 137–145. [Google Scholar] [CrossRef]
  2. Sandilyan, S.; Kathiresan, K. Mangrove conservation: A global perspective. Biodivers. Conserv. 2012, 21, 3523–3542. [Google Scholar] [CrossRef]
  3. Giri, C.; Ochieng, E.; Tieszen, L.L.; Zhu, Z.; Singh, A.; Loveland, T.; Masek, J.; Duke, N. Status and distribution of mangrove forests of the world using earth observation satellite data. Glob. Ecol. Biogeogr. 2011, 20, 154–159. [Google Scholar] [CrossRef]
  4. Li, R.; Chai, M.; Qiu, G.Y. Distribution, Fraction, and Ecological Assessment of Heavy Metals in Sediment-Plant System in Mangrove Forest, South China Sea. PLoS ONE 2016, 11, e0147308. [Google Scholar] [CrossRef] [Green Version]
  5. Holguin, G.; Vazquez, P.; Bashan, Y. The role of sediment microorganisms in the productivity, conservation, and rehabilitation of mangrove ecosystems: An overview. Biol. Fertil. Soils 2001, 33, 265–278. [Google Scholar] [CrossRef]
  6. Gong, B.; Cao, H.; Peng, C.; Perculija, V.; Tong, G.; Fang, H.; Wei, X.; Ouyang, S. High-throughput sequencing and analysis of microbial communities in the mangrove swamps along the coast of Beibu Gulf in Guangxi, China. Sci. Rep. 2019, 9, 9377. [Google Scholar] [CrossRef] [PubMed]
  7. Dos Santos, H.F.; Cury, J.C.; do Carmo, F.L.; dos Santos, A.L.; Tiedje, J.; van Elsas, J.D.; Rosado, A.S.; Peixoto, R.S. Mangrove bacterial diversity and the impact of oil contamination revealed by pyrosequencing: Bacterial proxies for oil pollution. PLoS ONE 2011, 6, e16943. [Google Scholar] [CrossRef] [PubMed] [Green Version]
  8. Gao, G.F.; Li, P.F.; Zhong, J.X.; Shen, Z.J.; Chen, J.; Li, Y.T.; Isabwe, A.; Zhu, X.Y.; Ding, Q.S.; Zhang, S.; et al. Spartina alterniflora invasion alters soil bacterial communities and enhances soil N2O emissions by stimulating soil denitrification in mangrove wetland. Sci. Total Environ. 2019, 653, 231–240. [Google Scholar] [CrossRef]
  9. Chambers, L.G.; Guevara, R.; Boyer, J.N.; Troxler, T.G.; Davis, S.E. Effects of Salinity and Inundation on Microbial Community Structure and Function in a Mangrove Peat Soil. Wetlands 2016, 36, 361–371. [Google Scholar] [CrossRef]
  10. Fernandez-Cadena, J.C.; Ruiz-Fernandez, P.S.; Fernandez-Ronquillo, T.E.; Diez, B.; Trefault, N.; Andrade, S.; De la Iglesia, R. Detection of sentinel bacteria in mangrove sediments contaminated with heavy metals. Mar. Pollut. Bull. 2020, 150, 110701. [Google Scholar] [CrossRef]
  11. Hossain, M.; Siddique, M.R.H.; Abdullah, S.M.R.; Saha, S.; Ghosh, D.C.; Rahman, M.S.; Limon, S.H. Nutrient Dynamics Associated with Leaching and Microbial Decomposition of Four Abundant Mangrove Species Leaf Litter of the Sundarbans, Bangladesh. Wetlands 2013, 34, 439–448. [Google Scholar] [CrossRef]
  12. Enya, O.; Lin, C.; Qin, J. Heavy metal contamination status in soil-plant system in the Upper Mersey Estuarine Floodplain, Northwest England. Mar. Pollut. Bull. 2019, 146, 292–304. [Google Scholar] [CrossRef] [PubMed]
  13. Enya, O.; Heaney, N.; Iniama, G.; Lin, C. Effects of heavy metals on organic matter decomposition in inundated soils: Microcosm experiment and field examination. Sci. Total Environ. 2020, 724, 138223. [Google Scholar] [CrossRef] [PubMed]
  14. Hu, Y.; Sun, Y.; Pei, N.; Zhang, Z.; Li, H.; Wang, W.; Xie, J.; Xu, X.; Luo, X.; Mai, B. Polybrominated diphenyl ethers and alternative halogenated flame retardants in mangrove plants from Futian National Nature Reserve of Shenzhen City, South China. Environ. Pollut. 2020, 260, 114087. [Google Scholar] [CrossRef]
  15. Feng, J.; Zhu, X.; Wu, H.; Ning, C.; Lin, G. Distribution and ecological risk assessment of heavy metals in surface sediments of a typical restored mangrove-aquaculture wetland in Shenzhen, China. Mar. Pollut. Bull. 2017, 124, 1033–1039. [Google Scholar] [CrossRef]
  16. Xu, S.; Lin, C.; Qiu, P.; Song, Y.; Yang, W.; Xu, G.; Feng, X.; Yang, Q.; Yang, X.; Niu, A. Tungsten- and cobalt-dominated heavy metal contamination of mangrove sediments in Shenzhen, China. Mar. Pollut. Bull. 2015, 100, 562–566. [Google Scholar] [CrossRef]
  17. Angola, G.; Arroyo, P.; de Miera, L.E.S. Characterization of the soil bacterial community structure and composition of natural and constructed wetlands. Sci. Total Environ. 2014, 473, 63–71. [Google Scholar]
  18. Li, X.; Yuan, Y.; Huang, Y.; Liu, H.W.; Bi, Z.; Yuan, Y.; Yang, P.B. A novel method of simultaneous NH4+ and NO3 removal using Fe cycling as a catalyst: Feammox coupled with NAFO. Sci Total Environ. 2018, 631, 153–157. [Google Scholar] [CrossRef]
  19. Niu, A.; Ma, J.; Gao, Y.; Xu, S.; Lin, C. Mangrove Soil-Borne Trace Elements in Qi’ao Island: Implications for Understanding Terrestrial Input of Trace Elements into Part of the Pearl River Estuary. Appl. Sci. 2020, 10, 2439. [Google Scholar] [CrossRef] [Green Version]
  20. Li, Q.; Wu, Z.; Chu, B.; Zhang, N.; Cai, S.; Fang, J. Heavy metals in coastal wetland sediments of the Pearl River Estuary, China. Environ. Pollut. 2007, 149, 158–164. [Google Scholar] [CrossRef]
  21. Li, R.; Li, R.; Chai, M.; Shen, X.; Xu, H.; Qiu, G. Heavy metal contamination and ecological risk in Futian mangrove forest sediment in Shenzhen Bay, South China. Mar. Pollut. Bull. 2015, 101, 448–456. [Google Scholar] [CrossRef]
  22. Romigh, M.M.; Davis, S.E.; Rivera-Monroy, V.H.; Twilley, R.R. Flux of organic carbon in a riverine mangrove wetland in the Florida Coastal Everglades. Hydrobiologia 2006, 569, 505–516. [Google Scholar] [CrossRef] [Green Version]
  23. Zhang, C.; Nie, S.; Liang, J.; Zeng, G.; Wu, H.; Hua, S.; Liu, J.; Yuan, Y.; Xiao, H.; Deng, L.; et al. Effects of heavy metals and soil physicochemical properties on wetland soil microbial biomass and bacterial community structure. Sci. Total Environ. 2016, 557, 785–790. [Google Scholar] [CrossRef] [PubMed]
  24. Chen, X.-P.; Chen, H.-Y.; Sun, J.; Zhang, X.; He, C.-Q.; Liu, X.-Y.; Huang, X.; Yang, M.; Wang, F.-S.; Väänänen, K. Shifts in the structure and function of the microbial community in response to metal pollution of fresh water sediments in Finland. J. Soils Sediments 2017, 18, 3324–3333. [Google Scholar] [CrossRef]
  25. Sundaramanickam, A.; Shanmugam, N.; Cholan, S.; Kumaresan, S.; Madeswaran, P.; Balasubramanian, T. Spatial variability of heavy metals in estuarine, mangrove and coastal ecosystems along Parangipettai, Southeast coast of India. Environ. Pollut. 2016, 218, 186–195. [Google Scholar] [CrossRef]
  26. Hayatsu, M.; Tago, K.; Saito, M. Various players in the nitrogen cycle: Diversity and functions of the microorganisms involved in nitrification and denitrification. Soil Sci. Plant Nutr. 2008, 54, 33–45. [Google Scholar] [CrossRef]
  27. Zhou, Z.; Meng, H.; Liu, Y.; Gu, J.D.; Li, M. Stratified Bacterial and Archaeal Community in Mangrove and Intertidal Wetland Mudflats Revealed by High Throughput 16S rRNA Gene Sequencing. Front. Microbiol. 2017, 8, 2148. [Google Scholar] [CrossRef] [PubMed]
  28. Behera, P.; Mohapatra, M.; Kim, J.Y.; Adhya, T.K.; Pattnaik, A.K.; Rastogi, G. Spatial and temporal heterogeneity in the structure and function of sediment bacterial communities of a tropical mangrove forest. Environ. Sci. Pollut. Res. Int. 2019, 26, 3893–3908. [Google Scholar] [CrossRef]
  29. Guo, H.; Nasir, M.; Lv, J.; Dai, Y.; Gao, J. Understanding the variation of microbial community in heavy metals contaminated soil using high throughput sequencing. Ecotoxicol. Environ. Saf. 2017, 144, 300–306. [Google Scholar] [CrossRef]
  30. Zhang, X.; Hu, B.X.; Ren, H.; Zhang, J. Composition and functional diversity of microbial community across a mangrove-inhabited mudflat as revealed by 16S rDNA gene sequences. Sci. Total Environ. 2018, 633, 518–528. [Google Scholar] [CrossRef]
  31. Zhu, P.; Wang, Y.; Shi, T.; Zhang, X.; Huang, G.; Gong, J. Intertidal zonation affects diversity and functional potentials of bacteria in surface sediments: A case study of the Golden Bay mangrove, China. Appl. Soil Ecol. 2018, 130, 159–168. [Google Scholar] [CrossRef]
  32. Yin, Y.; Yan, Z. Variations of soil bacterial diversity and metabolic function with tidal flat elevation gradient in an artificial mangrove wetland. Sci Total Environ. 2020, 718, 137385. [Google Scholar] [CrossRef] [PubMed]
  33. Liu, M.; Huang, H.; Bao, S.; Tong, Y. Microbial community structure of soils in Bamenwan mangrove wetland. Sci. Rep. 2019, 9, 8406. [Google Scholar] [CrossRef] [Green Version]
  34. Mendes, L.W.; Tsai, S.M. Distinct taxonomic and functional composition of soil microbiomes along the gradient forest-restinga-mangrove in southeastern Brazil. Antonie Van Leeuwenhoek 2018, 111, 101–114. [Google Scholar] [CrossRef] [PubMed]
  35. Pramanik, A.; Sengupta, S.; Bhattacharyya, M. Microbial Diversity and Community Analysis of the Sundarbans Mangrove, a World Heritage Site. In Microbial Diversity in the Genomic Era; Elsevier: Amsterdam, The Netherlands, 2019; pp. 65–76. [Google Scholar] [CrossRef]
Figure 1. Map of the study area showing the sampling locations.
Applsci 10 05850 g001
Figure 2. Concentration (mg/kg) of heavy metal in the surface soils collected at a different sampling location.
Applsci 10 05850 g002
Figure 3. Bar chart of taxonomic profiles of bacterial community at the phylum level with abundance >1% in July 2018 (a) and January 2019 (b).
Applsci 10 05850 g003
Figure 4. Heatmap of the distribution of the 20 most abundant bacterial genera present in the soil samples. The relative abundance of bacterial genera was indicated by color intensity.
Applsci 10 05850 g004
Figure 5. Effects of environmental factors on the community structures of dominant bacteria at the phylum level by Spearman’s correlation analysis. Note: the figure shows the correlation between environmental factors and microorganisms with a warm tone indicating positive correlation and cool tone indicating a negative correlation. (* indicates 0.01 < p ≤ 0.05, ** indicates 0.001 < p ≤ 0.01).
Applsci 10 05850 g005
Figure 6. Canonical correlation analysis (CCA) ordination plots for the two dimensions to show the relationship between the bacterial community structure and environmental parameters using a 16S rRNA gene sequence. (a) Correlations between environmental variables and CCA axes are represented by the length and angle of arrows (environmental factor vectors). PERMANOVA shows the explanation of single factors in the community structure of bacteria; (b) A single asterisk sign “*” next to a bar denotes significance at p < 0.05; A two-asterisk sign “**” next to a bar indicates significance at p < 0.01.
Applsci 10 05850 g006
Figure 7. Relative abundance of Acidobacteria (a) and Nitrospirae (b) at the phylum level for four groups. The Venn diagram (c) and Alpha diversity analysis (d) for four groups. Note: A and B represented the high-polluted group (Location 1–4) and the low-polluted level group (Location 5–8) soil collected in July 2018; C and D represented the high-polluted level group (Location 1–4) and low-polluted level group (Location 5–8) soil collected in January 2019; Error bars indicate standard error (n = 4). Small letters indicate significant differences among the four groups by one-way ANOVA tests (p < 0.05).
Applsci 10 05850 g007
Table 1. Soil pH, electrical conductivity (EC), total carbon and total nitrogen in the investigated mangrove soils 1.
Sampling TimeLocationpHECTCTN
July, 201816.85 ± 0.21 Bb7.83 ± 0.38 Ca13.27 ± 0.69 Cb0.95 ± 0.01 Cb
26.77 ± 0.06 Bb3.45 ± 0.29 Db52.18 ± 0.60 Bb1.70 ± 0.10 Bb
36.44 ± 0.24 Db15.63 ± 0.09 Ba66.00 ± 2.50 Ab2.24 ± 0.09 Ab
46.76 ± 0.08 Ba5.97 ± 0.77 Cb69.20 ± 8.77 Aa2.74 ± 0.22 Ab
57.09 ± 0.12 Aa7.23 ± 0.48 Cb25.68 ± 3.93 Cb1.69 ± 0.16 Bb
66.63 ± 0.09 Cb7.70 ± 0.06 Cb26.62 ± 2.32 Cb1.64 ± 0.14 Bb
77.03 ± 0.02 Aa13.57 ± 1.25 Aa62.02 ± 4.07 Ab2.57 ± 0.10 Ab
87.13 ± 0.03 Ba19.10 ± 2.23 Aa44.69 ± 5.67 Bb2.13 ± 0.26 Ab
Average6.83 ± 0.08 a9.56 ± 1.90 b50.53 ± 9.26 b2.13 ± 0.28 b
January, 201917.03 ± 0.06 Aa8.45 ± 0.01 Ca28.65 ± 3.66 Da1.79 ± 0.32 Ca
26.86 ± 0.21 Cb9.78 ± 0.00 Ba70.18 ± 2.47 Ba2.78 ± 0.06 Ca
36.93 ± 0.36 Ba16.41 ± 0.29 Aa93.91 ± 2.04 Aa3.14 ± 0.24 Ba
46.09 ± 0.27 Db10.06 ± 1.90 Ba76.94 ± 4.28 Ba2.13 ± 0.28 Ca
56.97 ± 0.02 Bb18.42 ± 1.26 Aa75.52 ± 4.96 Ba4.18 ± 0.07 Ba
66.95 ± 0.06 Ba12.17 ± 1.22 Ba49.80 ± 2.94 Ca3.96 ± 0.39 Ba
76.81 ± 0.15 Cb11.50 ± 0.15 Bb102.93 ± 9.81 Aa5.29 ± 0.48 Aa
86.84 ± 0.09 Cb9.34 ± 0.72 Bb65.15 ± 5.04 Ba4.09 ± 0.36 Ba
Average6.81 ± 0.01 a12.16 ± 1.23 a70.38 ± 8.31 a3.55 ± 0.37 a
1 Note: Values are means ± stand error (n = 3). EC: mS/cm; total carbon (TC) and total nitrogen (TN): g/kg. Means of each soil parameter with different capital letters at different sampling locations for the same sampling campaign indicate significant difference (one-way ANOVA test at p < 0.05) and means of each soil parameter with small letters for the two different sampling campaigns at the same sampling location indicate a significant difference (t-test at p < 0.05).
Table 2. Alpha diversity indicators of the soil bacteria at the different sampling locations.
TimeLocationOTUsACEChaoEvennessShannonCoverage
July, 20181162,46011,27811,2710.837.140.98
2154,32211,99011,8180.797.220.98
3126,43910,43810,2560.817.300.98
4147,4218,3268,2550.776.790.99
5155,66114,20614,0860.807.420.98
6162,04113,19213,2130.817.490.98
7157,61217,30117,2030.837.810.97
8166,43215,26715,2670.837.750.98
Average154,04912,75012,6710.817.370.98
Jan, 20191158,32413,52313,4290.807.360.98
2162,6437,9758,0700.746.450.99
3163,76317,65017,5870.827.820.97
4153,2049,2879,3100.807.100.99
5161,73312,54812,4580.807.360.98
6163,45015,96615,6890.827.730.98
7145,14311,14411,0180.817.310.98
8165,80414,67114,5460.817.550.98
Average159,25812,86412,7630.807.340.98
Table 3. Pearson correlation analysis between bacterial diversity and environmental variables 1.
OTUsACEChao1EvennessShannonCoverage
TC−0.28 −0.12 −0.13 −0.21 −0.07 0.01
TN0.05 0.10 0.10 0.05 0.19 0.02
pH0.50 *0.57 *0.57 *0.17 0.36 −0.48
EC0.04 0.37 0.38 0.41 0.46 −0.36
Cr0.05 −0.07 −0.08 −0.13 −0.08 0.11
Ni0.14 0.03 0.03 −0.16 0.01 0.12
Cu0.11 0.02 0.03 −0.23 −0.09 0.04
Zn0.32 0.01 0.01 −0.04 −0.06 0.15
As−0.08 −0.29 −0.29 0.00 −0.26 0.18
Cd−0.23 −0.53 *−0.53 *−0.47 −0.62 *0.38
Pb−0.03 0.21 0.20 0.13 0.14 −0.29
1 Note: * p < 0.05.
Table 4. Comparison of bacterial diversity and community structure in mangrove soils between this study and other reference sites around the world.
Study AreaDiversityCommunity Structure
ShannonFive Most Abundant Bacteria (%) at the Phylum Level
Beibu Gulf, China [6]9.44–10.46Proteobacteria (52.3%), Bacteroidetes (7.73%), Chloroflexi (6.09%), Actinobacteria (5.02%), Parvarchaeota (4.10%)
Mai Po Wetland, China [27]6.94–10.27Proteobacteria (45.6%), Chloroflexi (14.7%), Bacteroidetes (12.0%), Cyanobacteria (7.6%), Planctomycetes (4.5%)
Zhangjiang River, China [8]5.16–5.23Proteobacteria, Chloroflexi, Actinobacteria, Bacteroidetes, Planctomycetes
Daya Bay, China [30]7.90–9.90Proteobacteria (55%), Bacteroidetes (8.1%), Actinobacteria (5.1%), Acidobacteria (5.1%), Chloroflexi (4.6%)
Golden Bay, China [31]8.0–9.0Proteobacteria (50%), Cyanobacteria (11.5%), Bacteroidetes (11.4%), Actinobacteria (6.8%), Chloroflexi (5.4%)
Xiamen, China [32]5.39–9.28Proteobacteria, Fusobacteria, Epsilonbacteraeota, Chlorofloxi, Bacteroides
Hainan, China [33]5.10–5.85Proteobacteria, Actinobacteria, Chloroflexi, Acidobacteria, Firmicutes
Cananeia Estuary, Brazil [34]6.10–6.30Proteobacteria (60%), Firmicutes (8.1%), Acidobacteria (6.9%) Actinobacteria (6.2%),
Bengal Bay, India and Bangladesh [35]NA 1Proteobacteria, Flexibacteria, Actinobacteria, Acidobacteria, Chloroflexi,
Guayaquil Gulf, Brazil [10]NAProteobacteria (33.8%), Firmicutes (25.14%), Bacteroidetes (17.59%), Chloroflexi (5.57%), Planctomycetes (1.63% )
Bhitarkanika, India [28]NAProteobacteria (47.0%), Actinobacteria (9.8%), Bacteroidetes (7.6%), Acidobacteria (4.7%), Firmicutes (2.9%)
The study 6.45–7.81Proteobacteria (41.81%), Chloroflexi (11.38%), Planctomycetes (7.47%), Acidobacteria (6.86%), Bacteroidetes (4.41%)
1 NA means no data in the study.

