1. Introduction
The demand for renewable energy from natural sources, like sunlight and wind, is rapidly increasing all over the world. The development of high-performance storage devices, like lithium rechargeable batteries, is important for stably using these renewable energies [
1]. The lithium rechargeable batteries, as storage devices, must be high capacity, safe to use, and have a long lifetime. Increasing the size of the cell is important to achieve high capacity; observing the lithium reaction in situ and in operando in a local region in commercialized rechargeable cells is important for a long lifetime and ensuring safety. So far, various experimental techniques for observing lithium rechargeable batteries have been reported using synchrotron X-rays and neutron and electron particle beams, and also, the electronic and geometric structures of the materials have been characterized using various length and time scales [
2]. Recent cryo-electron microscopy techniques have achieved characterization of the electrode materials toward the realization of next-generation batteries [
3,
4,
5,
6]. These studies clearly visualize lithium dendrites.
Among them, Compton scattering imaging is a promising technique for non-destructively observing the structure of the matter in a local region [
7]. Compton scattering imaging is an experimental technique that uses high-energy X-rays. High-energy X-rays have high matter penetration power, which allows large-scale non-destructive construction measurement. High-energy X-rays can be used to measure light elements, as incoherent scattering (Compton) effects are enhanced with the interaction between photons and electrons. These advantages of Compton scattering imaging have been applied to a variety of fields, including the medical and security fields [
8,
9]. However, these studies have been mainly performed using a proportional counter, such as a flat-panel detector and linear array detectors, and do not analyze the energy of Compton scattering X-ray photons.
We have been developing a method for non-destructively and quantitatively monitoring lithium ions in the cell using Compton scattering imaging combined with a synchrotron-based high-energy X-ray and energy-dispersive-type detector. Thus far, we have applied this technique to the commercial lithium primary cell CR2032 under discharge, where, by measuring the Compton scattering intensities, the migration of lithium ions from the anode to the cathode was visualized as the difference in the electron density, and the structural changes due to the volume expansion of the electrodes were revealed [
10]. These results showed that the difference in the Compton scattering intensities produced by the difference in the electron density enabled the non-destructive estimation of the matter in the cell. Additionally, the change in the lithium concentration with the charge and discharge of the cell could be quantitatively determined from the line-shape of the Compton scattering X-ray energy spectrum, called the Compton profile, using line-shape parameter analysis, also known as S-parameter analysis [
11]. Lithium compositions in the commercial lithium rechargeable battery VL2020 at the cathode and anode were simultaneously obtained while cycling [
12]. S-parameter analysis was also used to show the dependency of the cycle rate on the lithiation state in the VL2020 cell [
13] and to non-destructively identify the difference between the fresh and aged 18650-type cells with micrometer-scale spatial resolution [
14]. However, the Compton scattering X-ray intensity and the S-parameter analysis were performed individually. Therefore, in this study, we non-destructively identified the degradation state of the commercial coin-type cell by combining both the Compton scattering X-ray intensities and S-parameter analysis methods.
2. Experimental
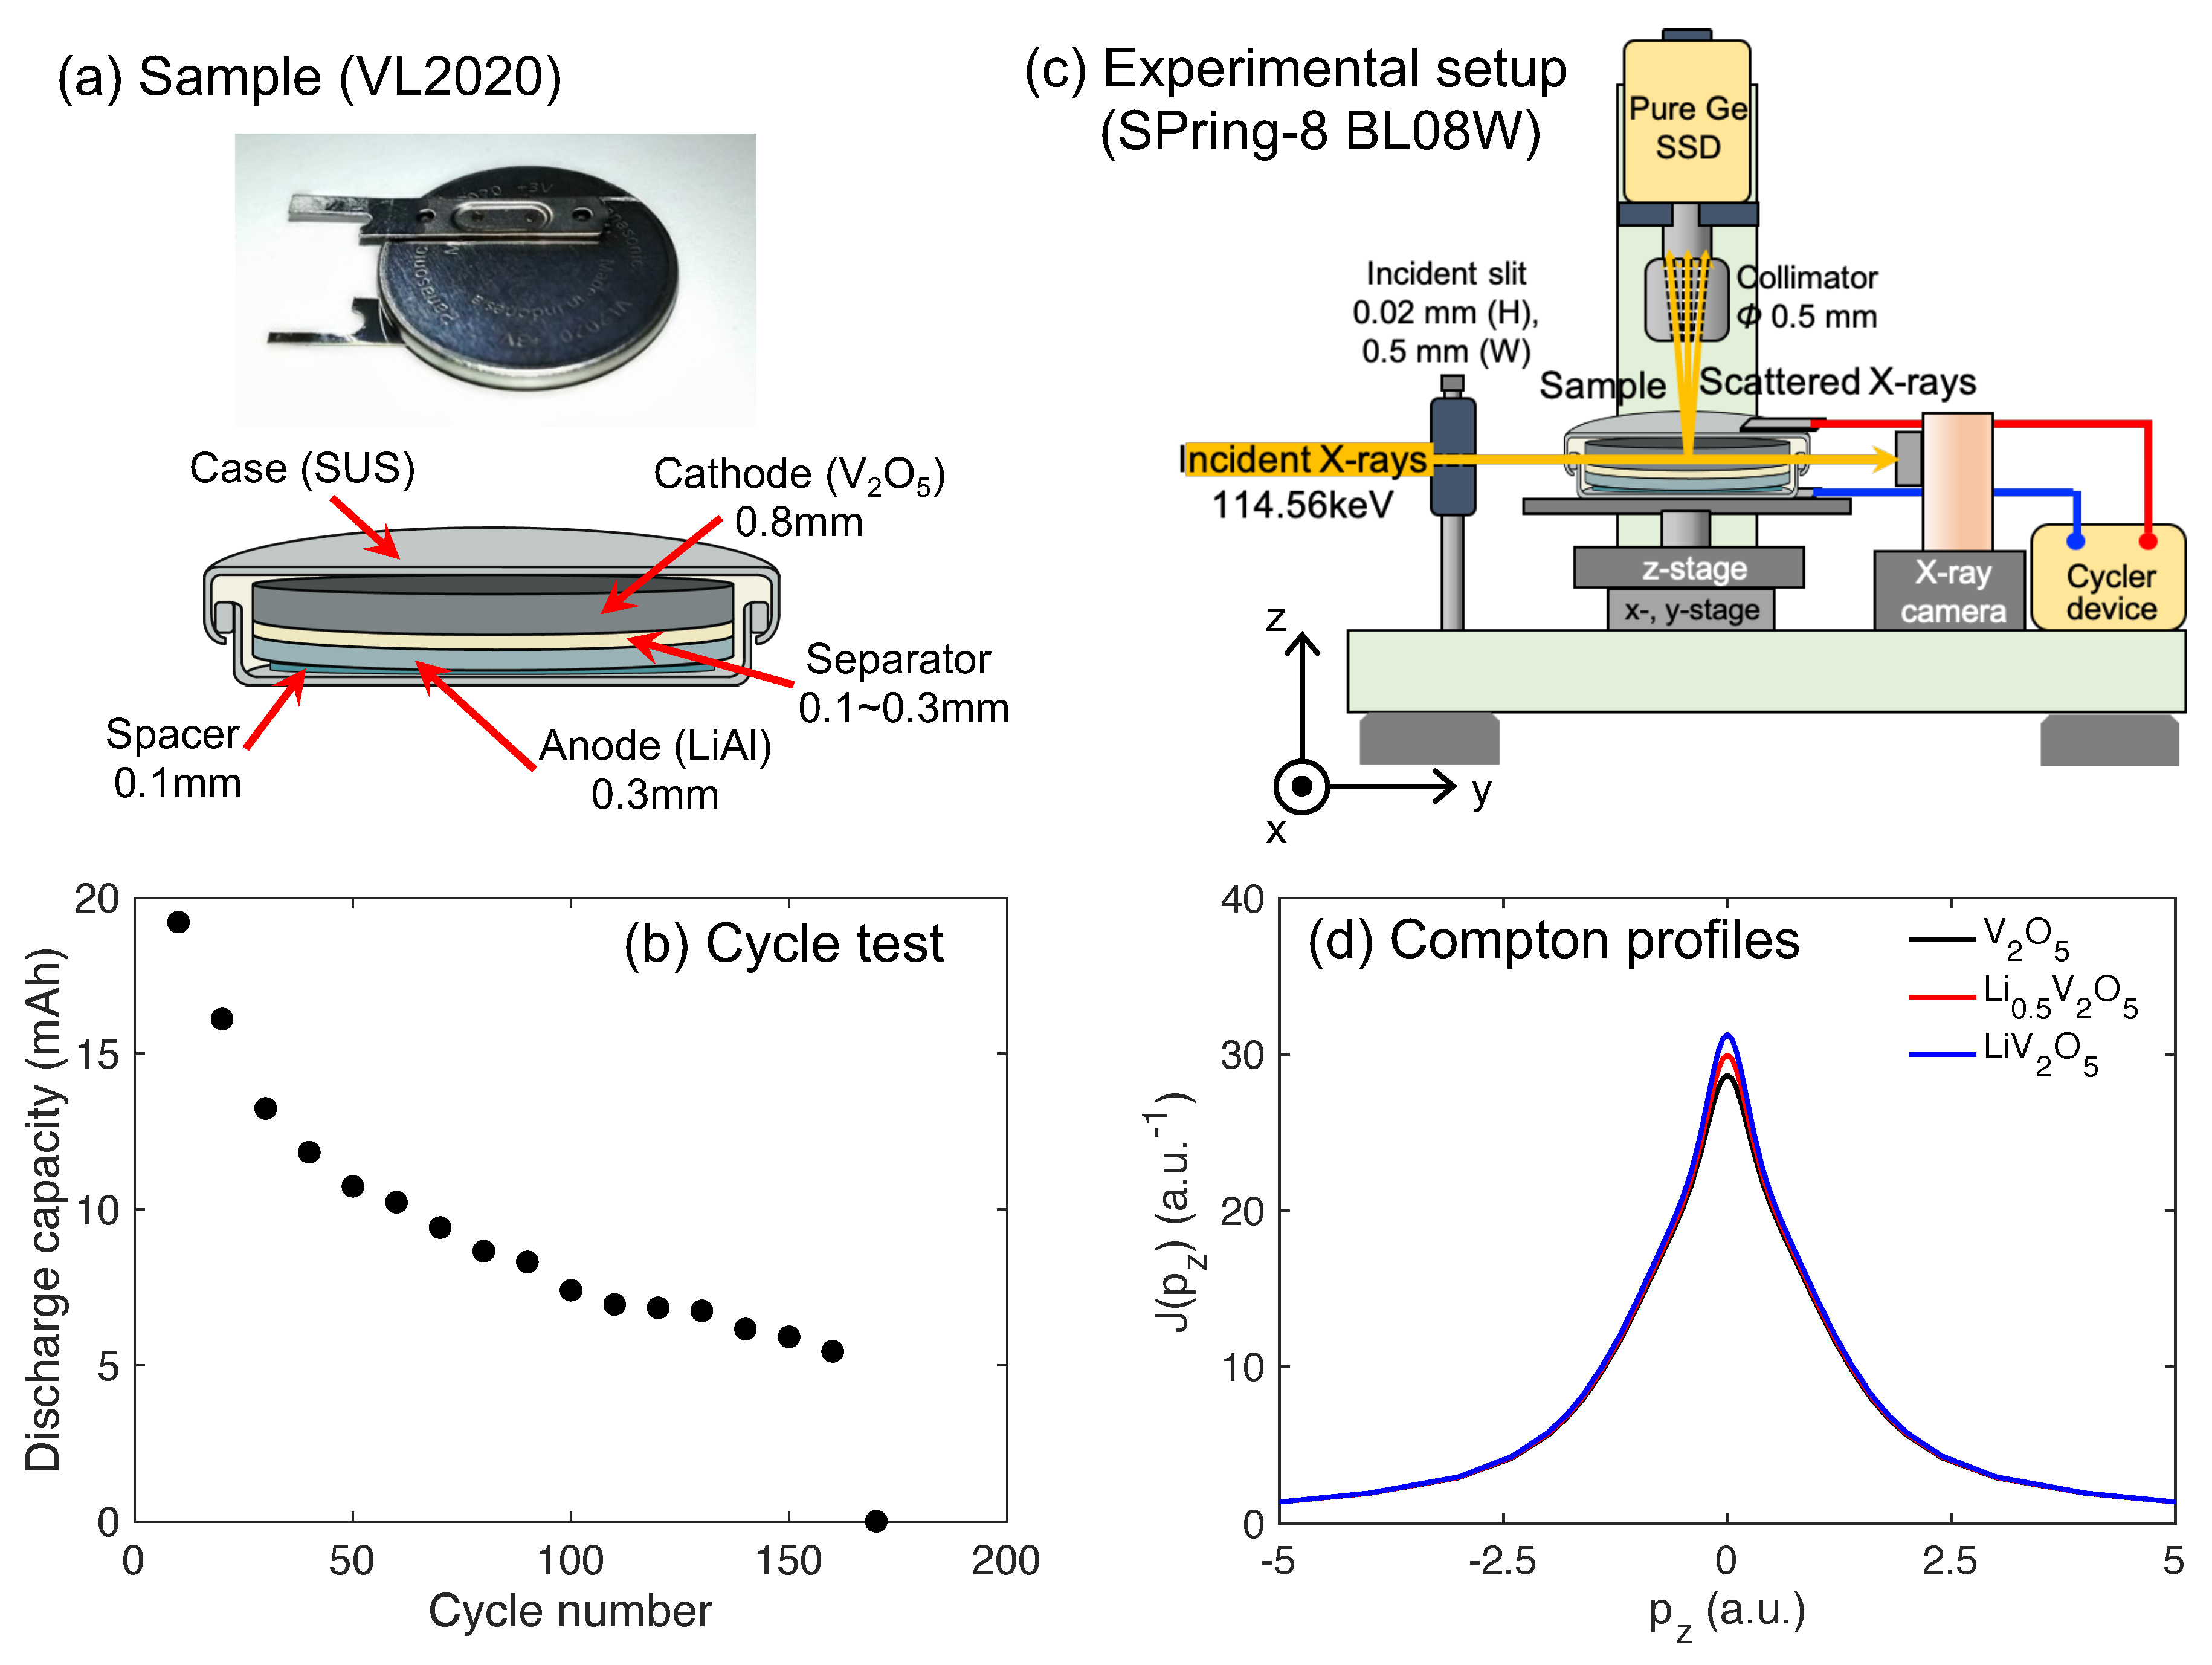
In this study, we use a commercial coin-type lithium rechargeable battery (VL2020, Panasonic Corporation, Osaka, Japan). The VL2020 is composed of a V
O
cathode, an olefin-based non-woven fabric separator, an LiAl alloy anode, and a dimethoxyethane electrolyte. Although these cathode and anode materials are different from typical lithium-ion batteries used in the industry today, the V
O
and LiAl alloy are still extensively studied for electrodes. The features of V
O
cathodes are low cost, abundance, and having the possibility for high capacity. Here, the theoretical capacities of V
O
, LiCoO
, LiMn
O
, and LiFePO
are 294 mAhg
, 274 mAhg
, 148 mAhg
, and 170 mAhg
, respectively. The V
O
of micro- and nano-structures have demonstrated good cycle performance and rate properties [
15,
16,
17]. V
O
is also considered as a cathode material for next-generation Al-ion [
18] and Mg-ion batteries [
19]. The LiAl alloy anodes are attracting attention in the battery industry. The LiAl alloys have potential as anodes for lithium-oxygen batteries and have been reported to have high cycle stability [
20]. The thicknesses of the cathode and anode are 800
m and approximately 300
m, respectively. The nominal voltage and capacity of the cell are 3 V and 20 mAh, respectively. The cut-off voltages are 2.5 and 3.5 V.
To analyze the degraded state of the cell, an unused cell (called a fresh cell) and a used cell (called an aged cell) were used. The aged cell was prepared by cycling the cell 170 times at room temperature. During the cycling process, the cell repeatedly charged and discharged with a constant current (CC) of 10 mA. A reference cycle was performed at 10 cycle intervals. In the reference cycle, the cell was charged with a CC of 2 mA until the 3.5 V cut-off voltage was reached, and the charging was continued 3 h in constant voltage (CV) mode at 3.5 V. Afterward, the discharge was performed with a CC of 2 mA until the 2.5 V cut-off voltage was reached. We confirmed that the capacity became almost 0 mAh after 170 cycles, as shown in
Figure 1b.
Compton scattering experiments were conducted at BL08Wof the Synchrotron Facility, SPring-8, Hyogo, Japan. The experimental setup is shown in
Figure 1c. The incident X-rays emitted from a multipole wiggler were monochromatized to 114.56 keV using bend-type Si(400) crystal. X-ray energy spectra along the scattering angle of 90 degrees were measured using nine segments of a pure Ge solid-state detector (SSD). These nine detectors were adjusted by the collimator slit to observe the same region in the sample cell. The observation region in the cell was limited by the incident and collimator slits. The sizes of these incident and collimator slits were 20 × 500
m
and 500
m in diameter, respectively. The cell was set on a movable stage, which had a function adjustment system using the x, y, and z positions of the sample cell and the
, azimuth, and tilt angles. The Compton scattering X-ray energy spectrum was measured using scanning incident X-rays along the vertical (z) and horizontal (x) directions of the cell. The scanning area was 0.8–1 mm in height and 5 mm in width, which corresponded from the lower end of the cathode to the end of the anode on the z-direction. The measurement time at one position was 30 s.
The obtained X-ray energy spectrum was analyzed using two methods: Compton scattering X-ray intensity and the S-parameter. The Compton scattering X-ray intensity, d
N, is calculated as [
21]:
where
is the photon flux of the incident X-rays;
and
are the path length of the incident and scattering X-rays in the target matter, respectively;
is the average electron density over the probing volume;
is the probing volume; and
is the Klein–Nishina differential cross-section. Experimentally, d
N is given by the area of the Compton scattering X-ray energy spectrum. d
N depends on
,
, and
. When the X-ray path length can be treated as constant, the Compton scattering X-ray intensity is proportional to the electron density
. Therefore, Compton scattering intensity has been used for densitometry [
21] and imaging [
7,
22], and the analysis of Compton scattering X-ray intensity allows the identification of the matter at the local region in the cell.
The S-parameter is a parameter that characterizes the modification of the Compton scattering X-ray energy spectrum with lithium insertion.
Figure 1d shows the Compton scattering X-ray energy spectrum, the so-called Compton profile, of Li
V
O
(lithium concentration
x = 0, 0.5, and 1) obtained from Hartree–Fock calculations [
23]. The peak height, which is seen to increase with increasing lithium concentration, demonstrates the sensitivity of the profile to the lithium concentration. A previous study clarified that there is linearity between the experimental S-parameter and lithium concentration obtained from inductively-coupled plasma (ICP) analysis [
11]. Therefore, the S-parameter allows us to quantitate the lithium concentration in the electrode non-destructively. The Compton profile,
, is related to the ground-state electron momentum density
in the momentum space via the following double integral [
24]:
where
= (
,
,
) is the electron momentum.
is given by [
25,
26]:
where
is the wave function of an electron in the
j-state and n
is the electron occupation. The index
j covers all constituent atoms and orbitals.
is directly linked to the wave function in real space, and the line-shape of
changes depending on the chemical element. These features have also been used to identify electronic structures and redox orbitals in the electrode reaction through the combination with first-principle calculations and have successfully visualized the redox orbitals of cathode materials [
27,
28,
29,
30]. The S-parameter is defined as [
11]:
where parameters
d and
l define the range of low- and high-momentum regions, respectively, dividing the dominant and inconspicuous lithium regions. We used
d = 1 atomic units (a.u.) and
l = 5 a.u. These were determined by comparing fully charged and discharged Compton scattering X-ray energy spectra as reported previously [
14].
3. Results and Discussion
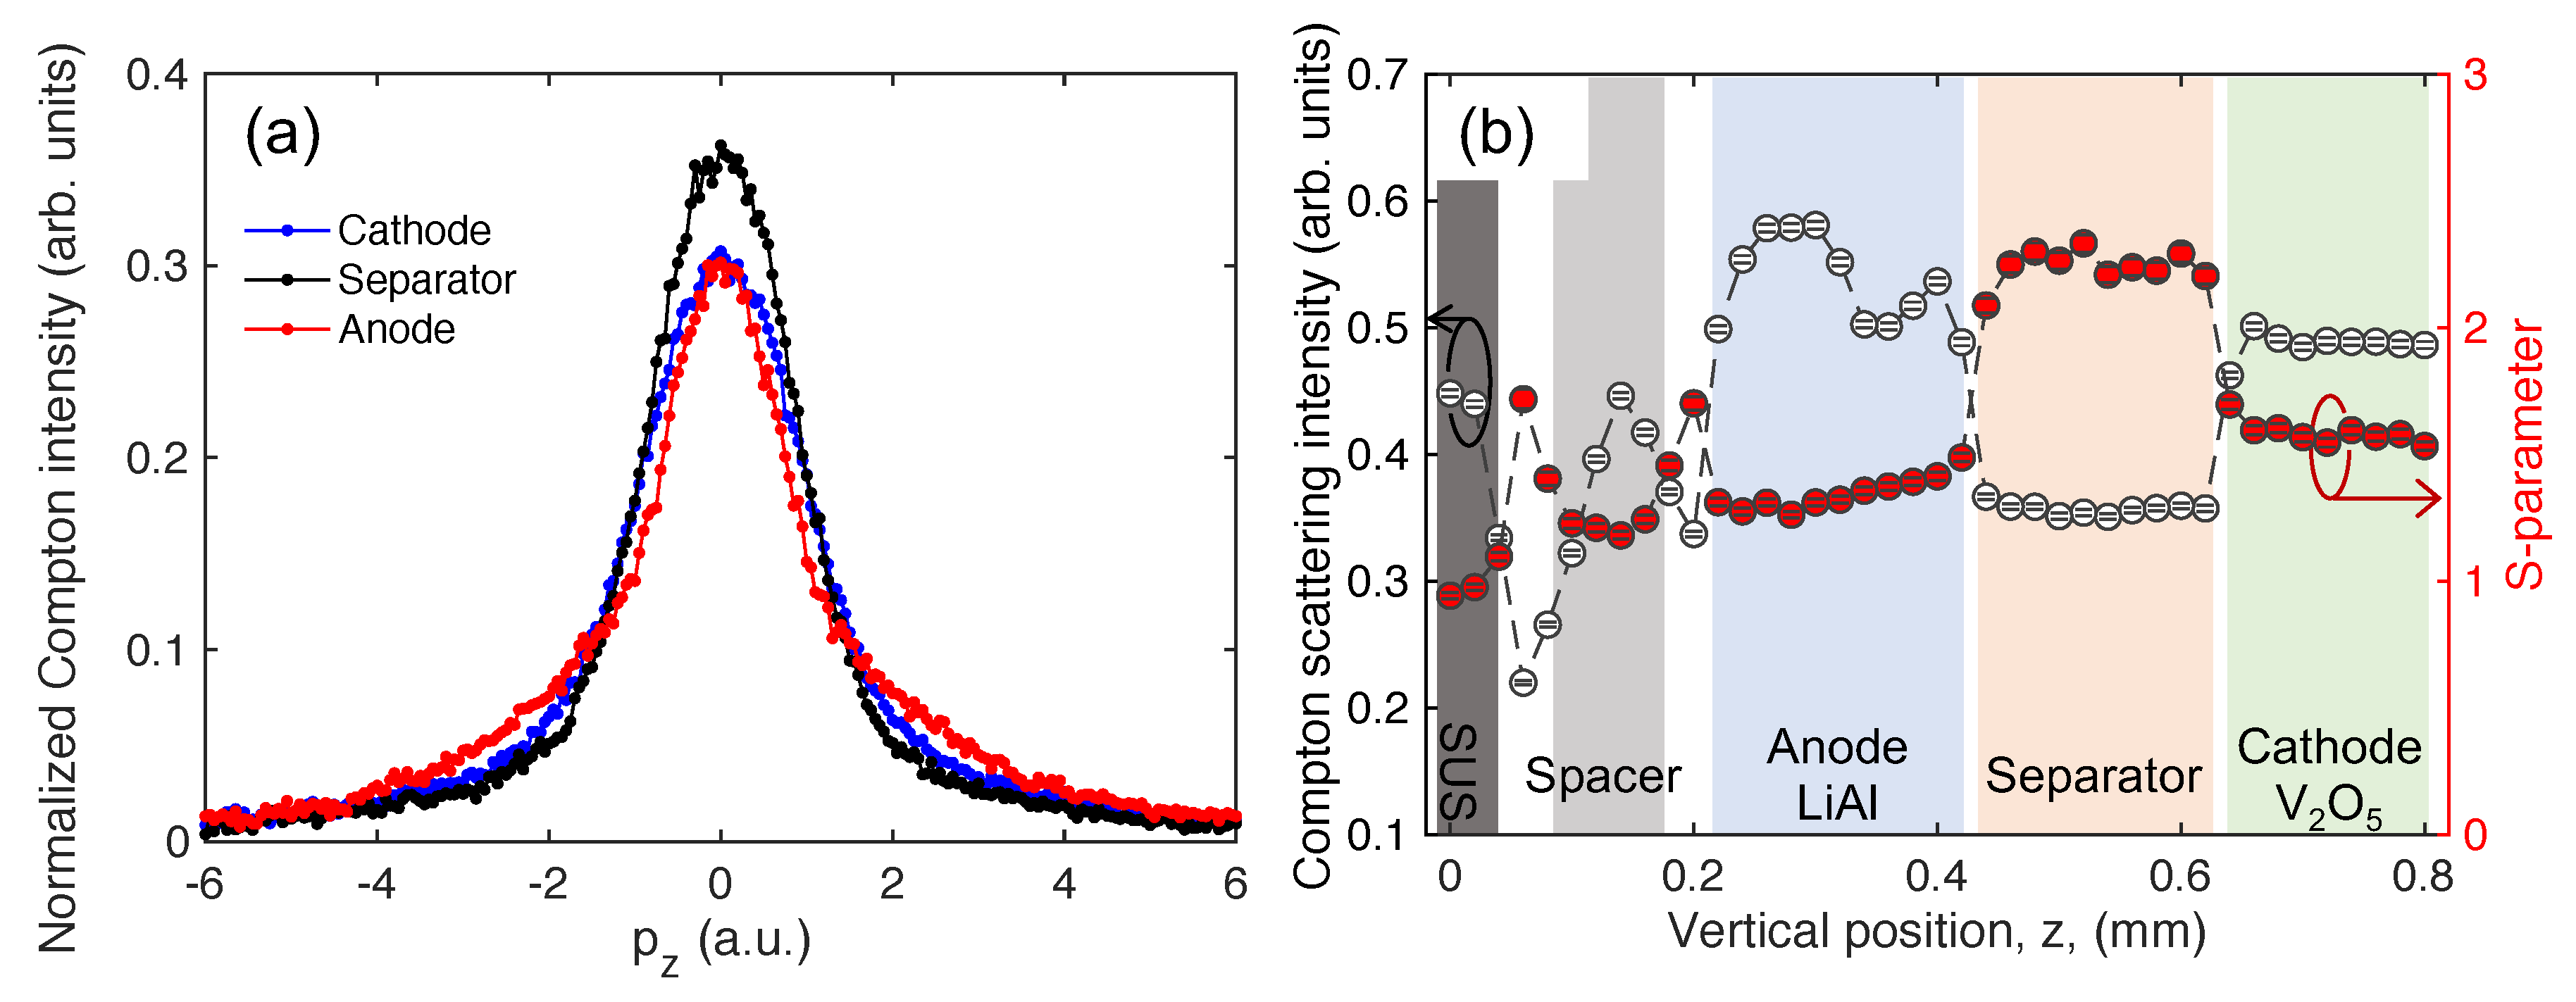
The Compton scattering X-ray energy spectra obtained from the cathode, separator, and anode of the fresh cell are shown in
Figure 2a. The area of these energy spectra was normalized to the same value to clarify the line-shape of each energy spectrum. The x-axis,
in
Figure 2a, represents the electron momentum along the z-direction, which experimentally corresponds to the scatter vector direction.
is given by [
24]:
where
is 1/
and
is the fine structure constant (as we used atomic units following the conventions of X-ray spectroscopy).
and
are the incident and scattering X-ray energy, respectively;
is the rest mass energy of the electron; and
is a scattering angle. The energy spectrum obtained from the separator has a narrow distribution, and the energy spectrum obtained from the anode has a broad distribution, as shown in
Figure 2a.
Figure 2b shows the internal structure of the fresh VL2020 cell in the discharged state observed using Compton scattering intensity and the S-parameter. These data were obtained from the Compton scattering X-ray energy spectrum, which was measured using the scanning incident X-rays from the lower end of the cathode to the end of the anode. The Compton scattering intensities were obtained by normalizing the number of photons of the Compton scattering X-rays by the number of photons of the incident X-rays, which were measured using an ion-chamber. The measurement time was 30 s at each point. The background colors in
Figure 2b indicate the region of each component of the cell. The regions at 0 mm ≥ z < 0.04 mm, 0.08 mm < z < 0.18 mm, 0.21 mm < z < 0.42 mm, 0.43 mm < z < 0.64 mm, and 0.65 mm < z ≤ 0.8 mm correspond to the stainless steel outer casing, spacer, anode, separator, and cathode, respectively. The Compton scattering intensity interestingly indicated that the anode had a two-layer structure. Although the Compton scattering intensity and S-parameter had opposite trends in this cell as shown in
Figure 2b, we can non-destructively identify the inner structure of the cell using both the Compton scattering intensity and S-parameter.
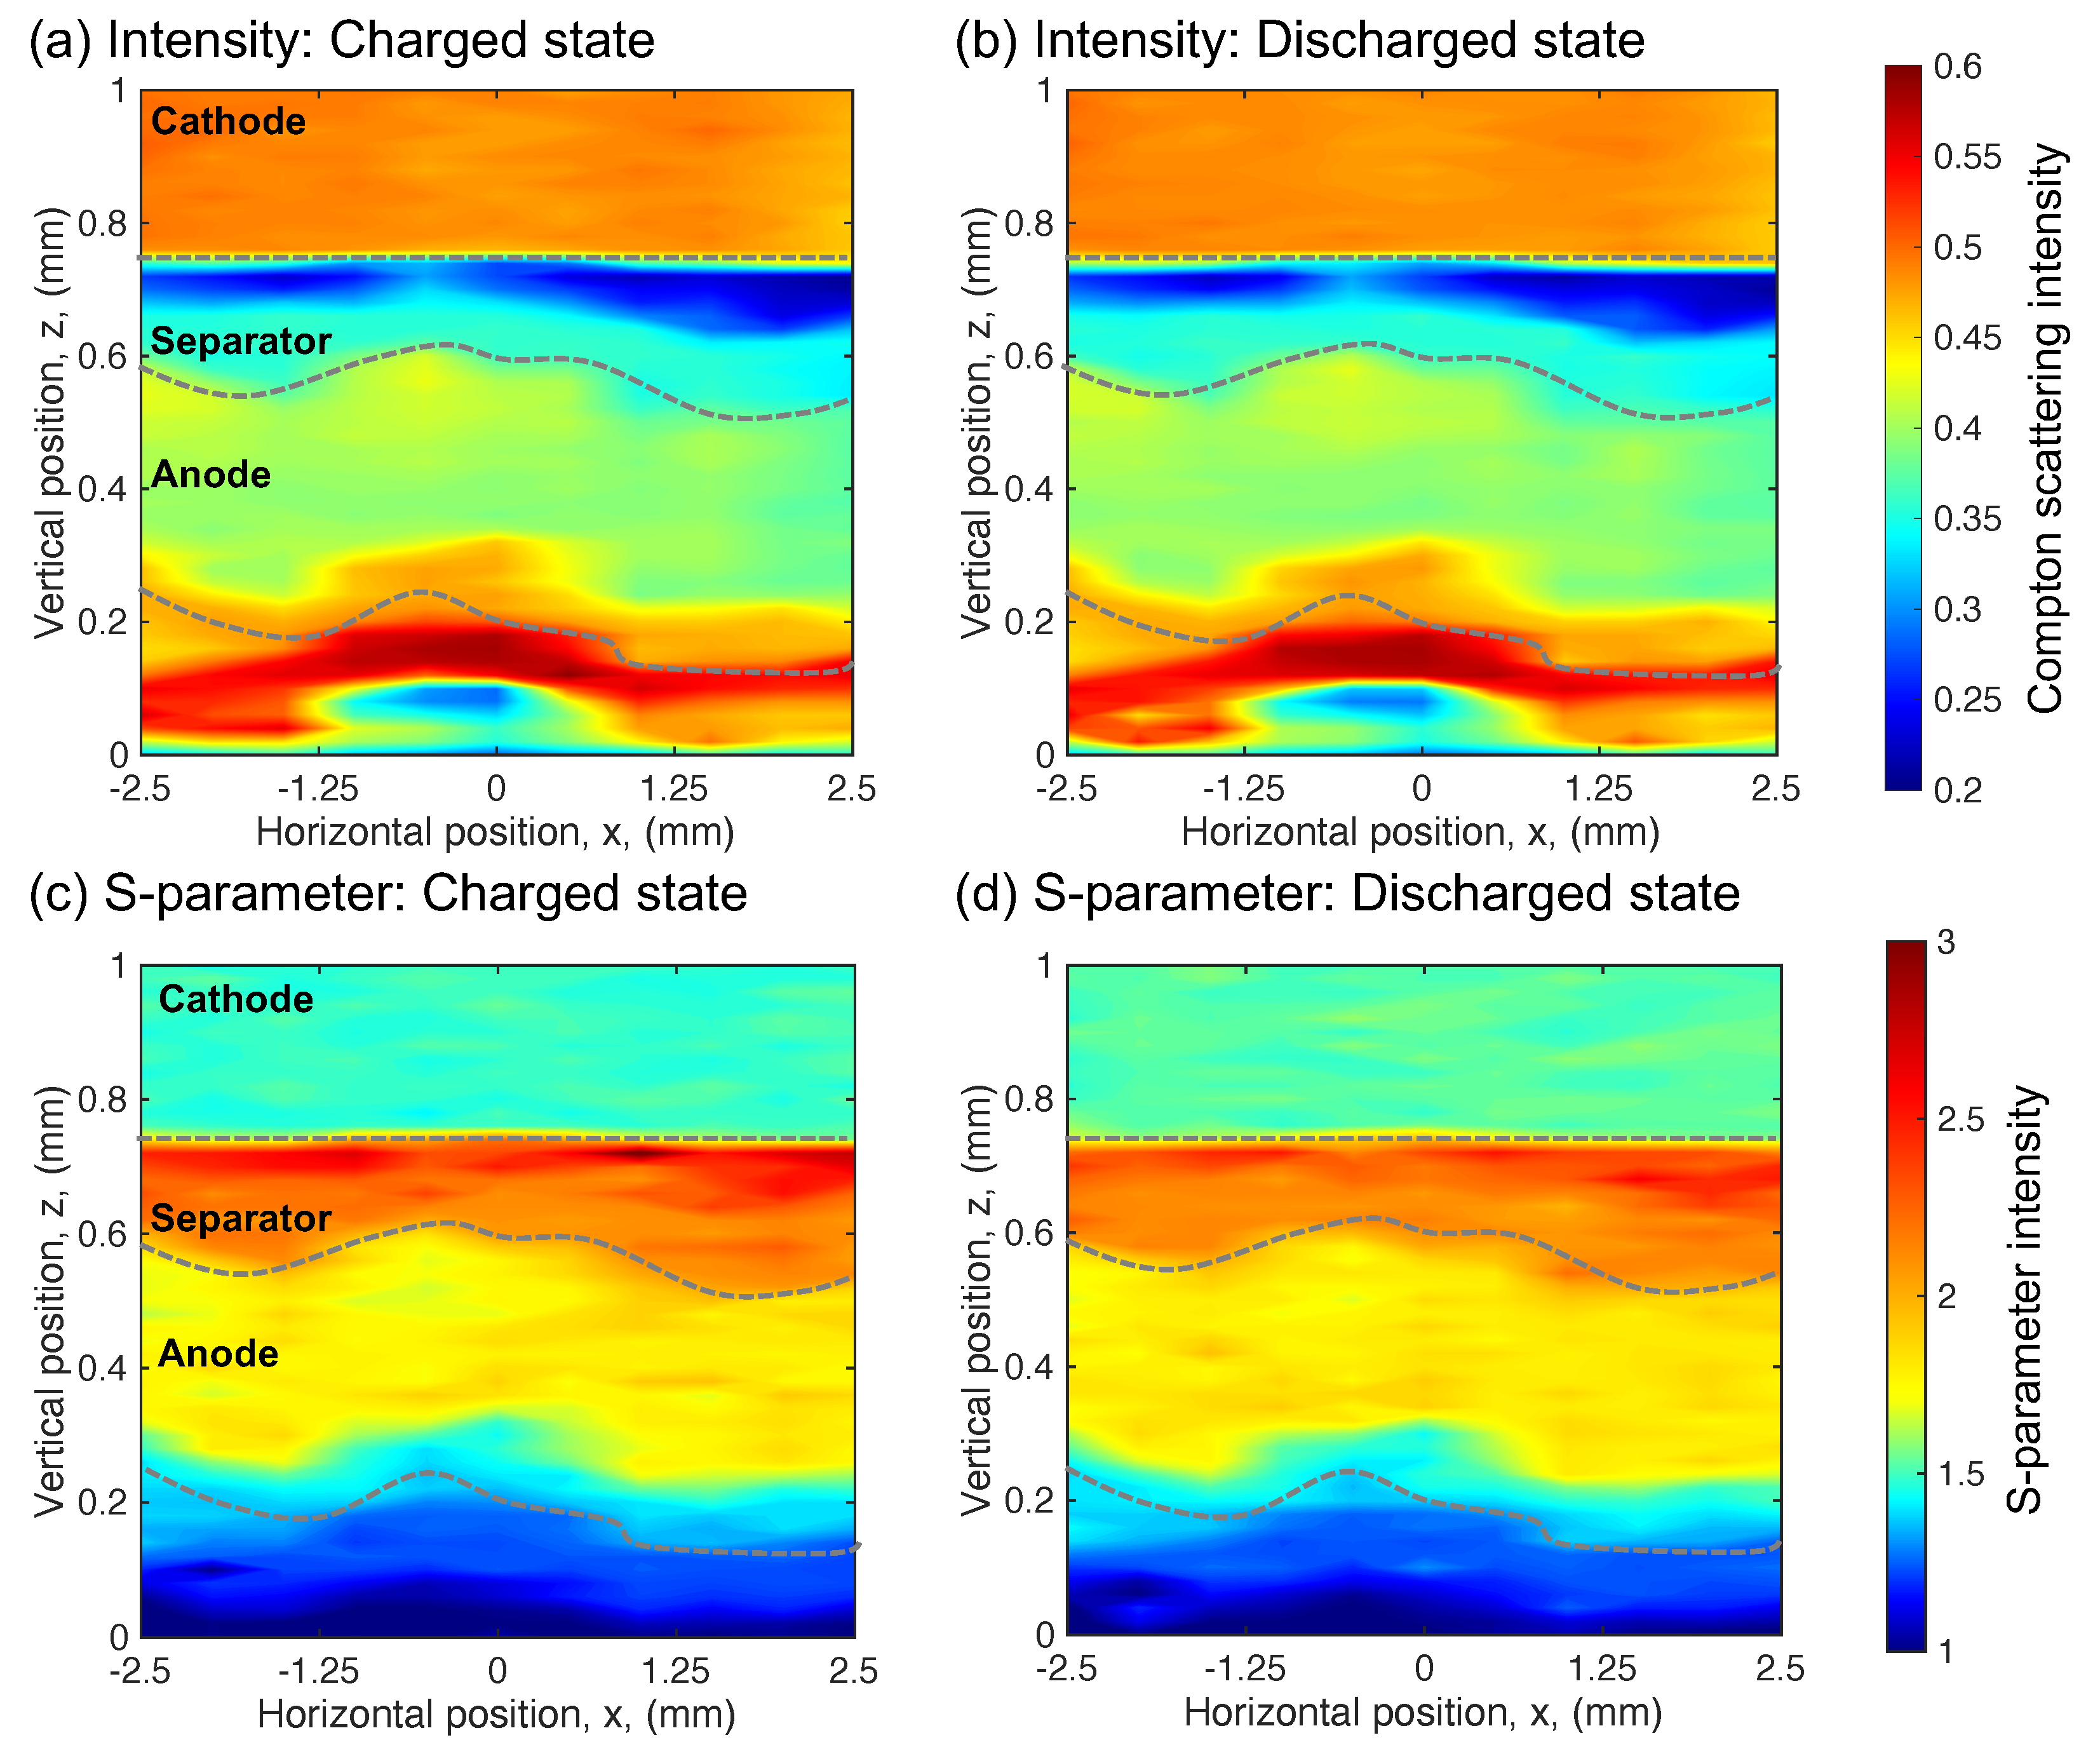
Figure 3a,b depicts the Compton scattering intensity distribution, and
Figure 3c,d is the S-parameter distribution of the charged and discharged states in the fresh cell, respectively. The state of charge on the cell changed by a constant current of 2 mA. The separator position shifted about 80
m toward the cathode direction by charging the fresh cell in both the Compton scattering intensity and S-parameter distributions. This shift in the separator position is caused by the volume expansion of the anode because the lattice volume of the LiAl alloy expands about 95% compared with that of Al by inserting lithium [
31]. Therefore, in the Compton scattering intensity distribution, the intensity of the anode region decreased by charging the cell despite the average electron density increase with the lithium insertion. The S-parameter intensity increased because lithium ions moved to the anode during charge. The averaged S-parameter at the cathode and anode in the charged and discharged states and the corresponding lithium composition are summarized in
Table 1. The lithium composition was determined using the calibration curve between the S-parameter and lithium composition, which was measured previously using inductively-coupled plasma (ICP) analysis. Here, the S-parameter obtained from the charged state in the cathode was normalized by the lithium composition in the charged state of the cathode obtained from the ICP analysis, and the S-parameter obtained from the discharged state in the anode was normalized by the lithium composition in the discharged state of the anode obtained from the ICP analysis. The details of the calibration curve were reported previously [
12]. By charging the cell, the S-parameter of the anode increases approximately 3.18%, and that of the cathode decreases approximately 1.25%. Here, the lithium composition on the cathode changes from 0.124 ± 0.190 to 0.723 ± 0.190 with the discharge; the lithium composition on the anode changes from 0.046 ± 0.031 to 0.270 ± 0.031 with the charge. From the above, we observe a clear variation in the fresh cell in the charged and discharged states via the Compton scattering intensity and S-parameter.
On the other hand, the aged cell produces a different response with charge and discharge compared with the fresh cell.
Figure 4a,b depicts the Compton scattering intensity distribution, and
Figure 4c,d depicts the S-parameter distribution of the charged and discharged states in the aged cell, respectively. The state of charge on the cell changed by a constant current with 2 mA. However, in the aged cell, a clear variation in the distribution at the charged and discharged states is not observed in both the Compton scattering intensity and S-parameter distributions. The averaged S-parameter and corresponding lithium composition of both electrodes do not show a significant change, as summarized in
Table 2. Comparing these distributions of the aged cell with those of the fresh cell, we observe that the anode expanded and the separator shrank in the aged cell. Hence, the region under the anode also shows a difference in distribution. Hamon et al. reported that the capacity loss of the cell is induced by the expansion of the LiAl alloy electrode [
32]. Interestingly, a region with a low Compton scattering intensity and high S-parameter value appears near the interface between the cathode and separator.
The correlation between the Compton scattering intensity and the S-parameter in the fresh and aged cells is shown in
Figure 5, depicting the change in the internal structure of the aged cell. In the fresh cell, the distributions between the Compton scattering intensity and S-parameter in the charged state of the cathode, separator, and anode are concentrated at the region around 0.5 in the Compton scattering intensity and 1.5 for the S-parameter, around 0.35 in the Compton scattering intensity and 2.3 for the S-parameter, and around 0.45 in the Compton scattering intensity and 1.4 for the S-parameter, respectively, as shown in
Figure 5a. The distributions in the discharged state of the fresh cell display the same trends as the charged state, as shown in
Figure 5b. By charging the fresh cell, the barycenter position of the anode distributions shifts from 0.5014 ± 0.0002 to 0.4589 ± 0.0001 in the Compton scattering intensity and from 1.3510 ± 0.0017 to 1.3977 ± 0.0017 in the S-parameter. By discharging the cell, the barycenter position of the cathode distributions shifts from 0.4937 ± 0.0001 to 0.4896 ± 0.0001 in the Compton scattering intensity and from 1.5723 ± 0.0014 to 1.5928 ± 0.0019 in the S-parameter. These results correspond to
Figure 3.
The distributions between the Compton scattering intensity and S-parameter in the aged cell are different from those of the fresh cell, as shown in
Figure 5c,d. The barycenter positions of the cathode and anode distributions do not show a significant change between the charged and discharged states. These values in the cathode of the charged and discharged states are 0.4840 ± 0.0001 and 0.4836 ± 0.0001 in the Compton scattering intensity and 1.5903 ± 0.0016 and 1.5898 ± 0.0016 in the S-parameter, respectively. These values in the anode of the charged and discharged states are 0.4177 ± 0.0001 and 0.4155 ± 0.0001 in the Compton scattering intensity and 1.7802 ± 0.0016 and 1.7807 ± 0.0017 in the S-parameter, respectively. The distribution of the anode in the 0.37–0.4 regions in the Compton scattering intensity and the 1.6–2 regions in the S-parameter appears in the aged cell. This region is highlighted in orange dotted circles in these figures. As the lattice volume of the anode expanded with degradation, as shown in both the Compton scattering intensity and S-parameter distributions in
Figure 4, a stable phase of the LiAl alloy is formed in the VL2020 cell by repeating the charge–discharge cycle. Here, the three possible alloys are AlLi, Al
Li
, and Al
Li
in the Al–Li binary diagram [
33]. Additionally, two phases of
-AlLi and AlLi
are also confirmed experimentally [
34]. As a result, the distributions that are shown in the orange dotted circles in
Figure 5c,d appeared. The region with low Compton scattering intensity and a high S-parameter value near the interface between the cathode and separator in
Figure 4 corresponds to the 0.2–0.3 regions in the Compton scattering intensity and to 2.3–2.8 in the S-parameter values in
Figure 5c,d. This region is highlighted in the blue dotted circles in these figures. A possible reason for this distribution appearing near the surface of the separator on the aged cell is the electrolyte decreasing due to the generated microbubbles.
We estimated the porosity of the separator in the aged cell from the electron density because the Compton scattering intensity is proportional to the electron density as shown in Equation (
1). The electron density
was calculated as:
where
is the Avogadro constant.
is the density of the separator in the fresh cell, and the value is 0.6956 g/cm
.
was obtained by measuring the weight and size of the separator using the electric balance after drying by pulling it out from the fresh cell.
M is the atomic weight. The atomic weight of 42.078 in the polypropylene is used as the separator. The obtained
of the separator is 9.9548 × 10
cm
, and we assume the porosity at 100%. Then, the electron density of the separator, which includes 23% of the dimethoxyethane (the atomic weight is 90.118) electrolyte is calculated as the measured polypropylene density (0.6956 g/cm
) is small, approximately 77% compared with the theoretical polypropylene density (0.905 g/cm
). This value is 1.1298 × 10
cm
, and we assume the porosity at 0%. The averaged Compton scattering intensities of the separator in the discharged fresh and aged cells are 0.3538 ± 0.0001 and 0.3146 ± 0.0001, respectively. When the Compton scattering intensity of the separator in the fresh cell is assumed with a porosity of 0%, the porosity of the separator in the aged cell is approximately 93.2%. As the Compton scattering intensity from vacancy is weak, this considers that the vacancy is introduced in the separator by the degradation of the cell. From the above, the degradation mechanism of the VL2020 cell is that first, the stable phase of the anode is formed by the overvoltage cycle, then the appearance of the microbubbles is induced by the decomposition of the electrolyte [
35] as lithium reactions with the cycle are prevented by the formation of the stable phase of the anode.
In this study, by combining Compton scattering intensity and S-parameter analysis, we non-destructively quantified the lithium composition and identified the degradation mechanism of the commercial VL2020 cell. These Compton scattering imaging features are expected to be useful as a novel non-destructive analysis of commercialized lithium rechargeable cells.

 ,
, 


