New Approach of Metals Removal from Acid Mine Drainage

 ,
, 
Abstract
:1. Introduction
2. Materials and Methods
2.1. Materials
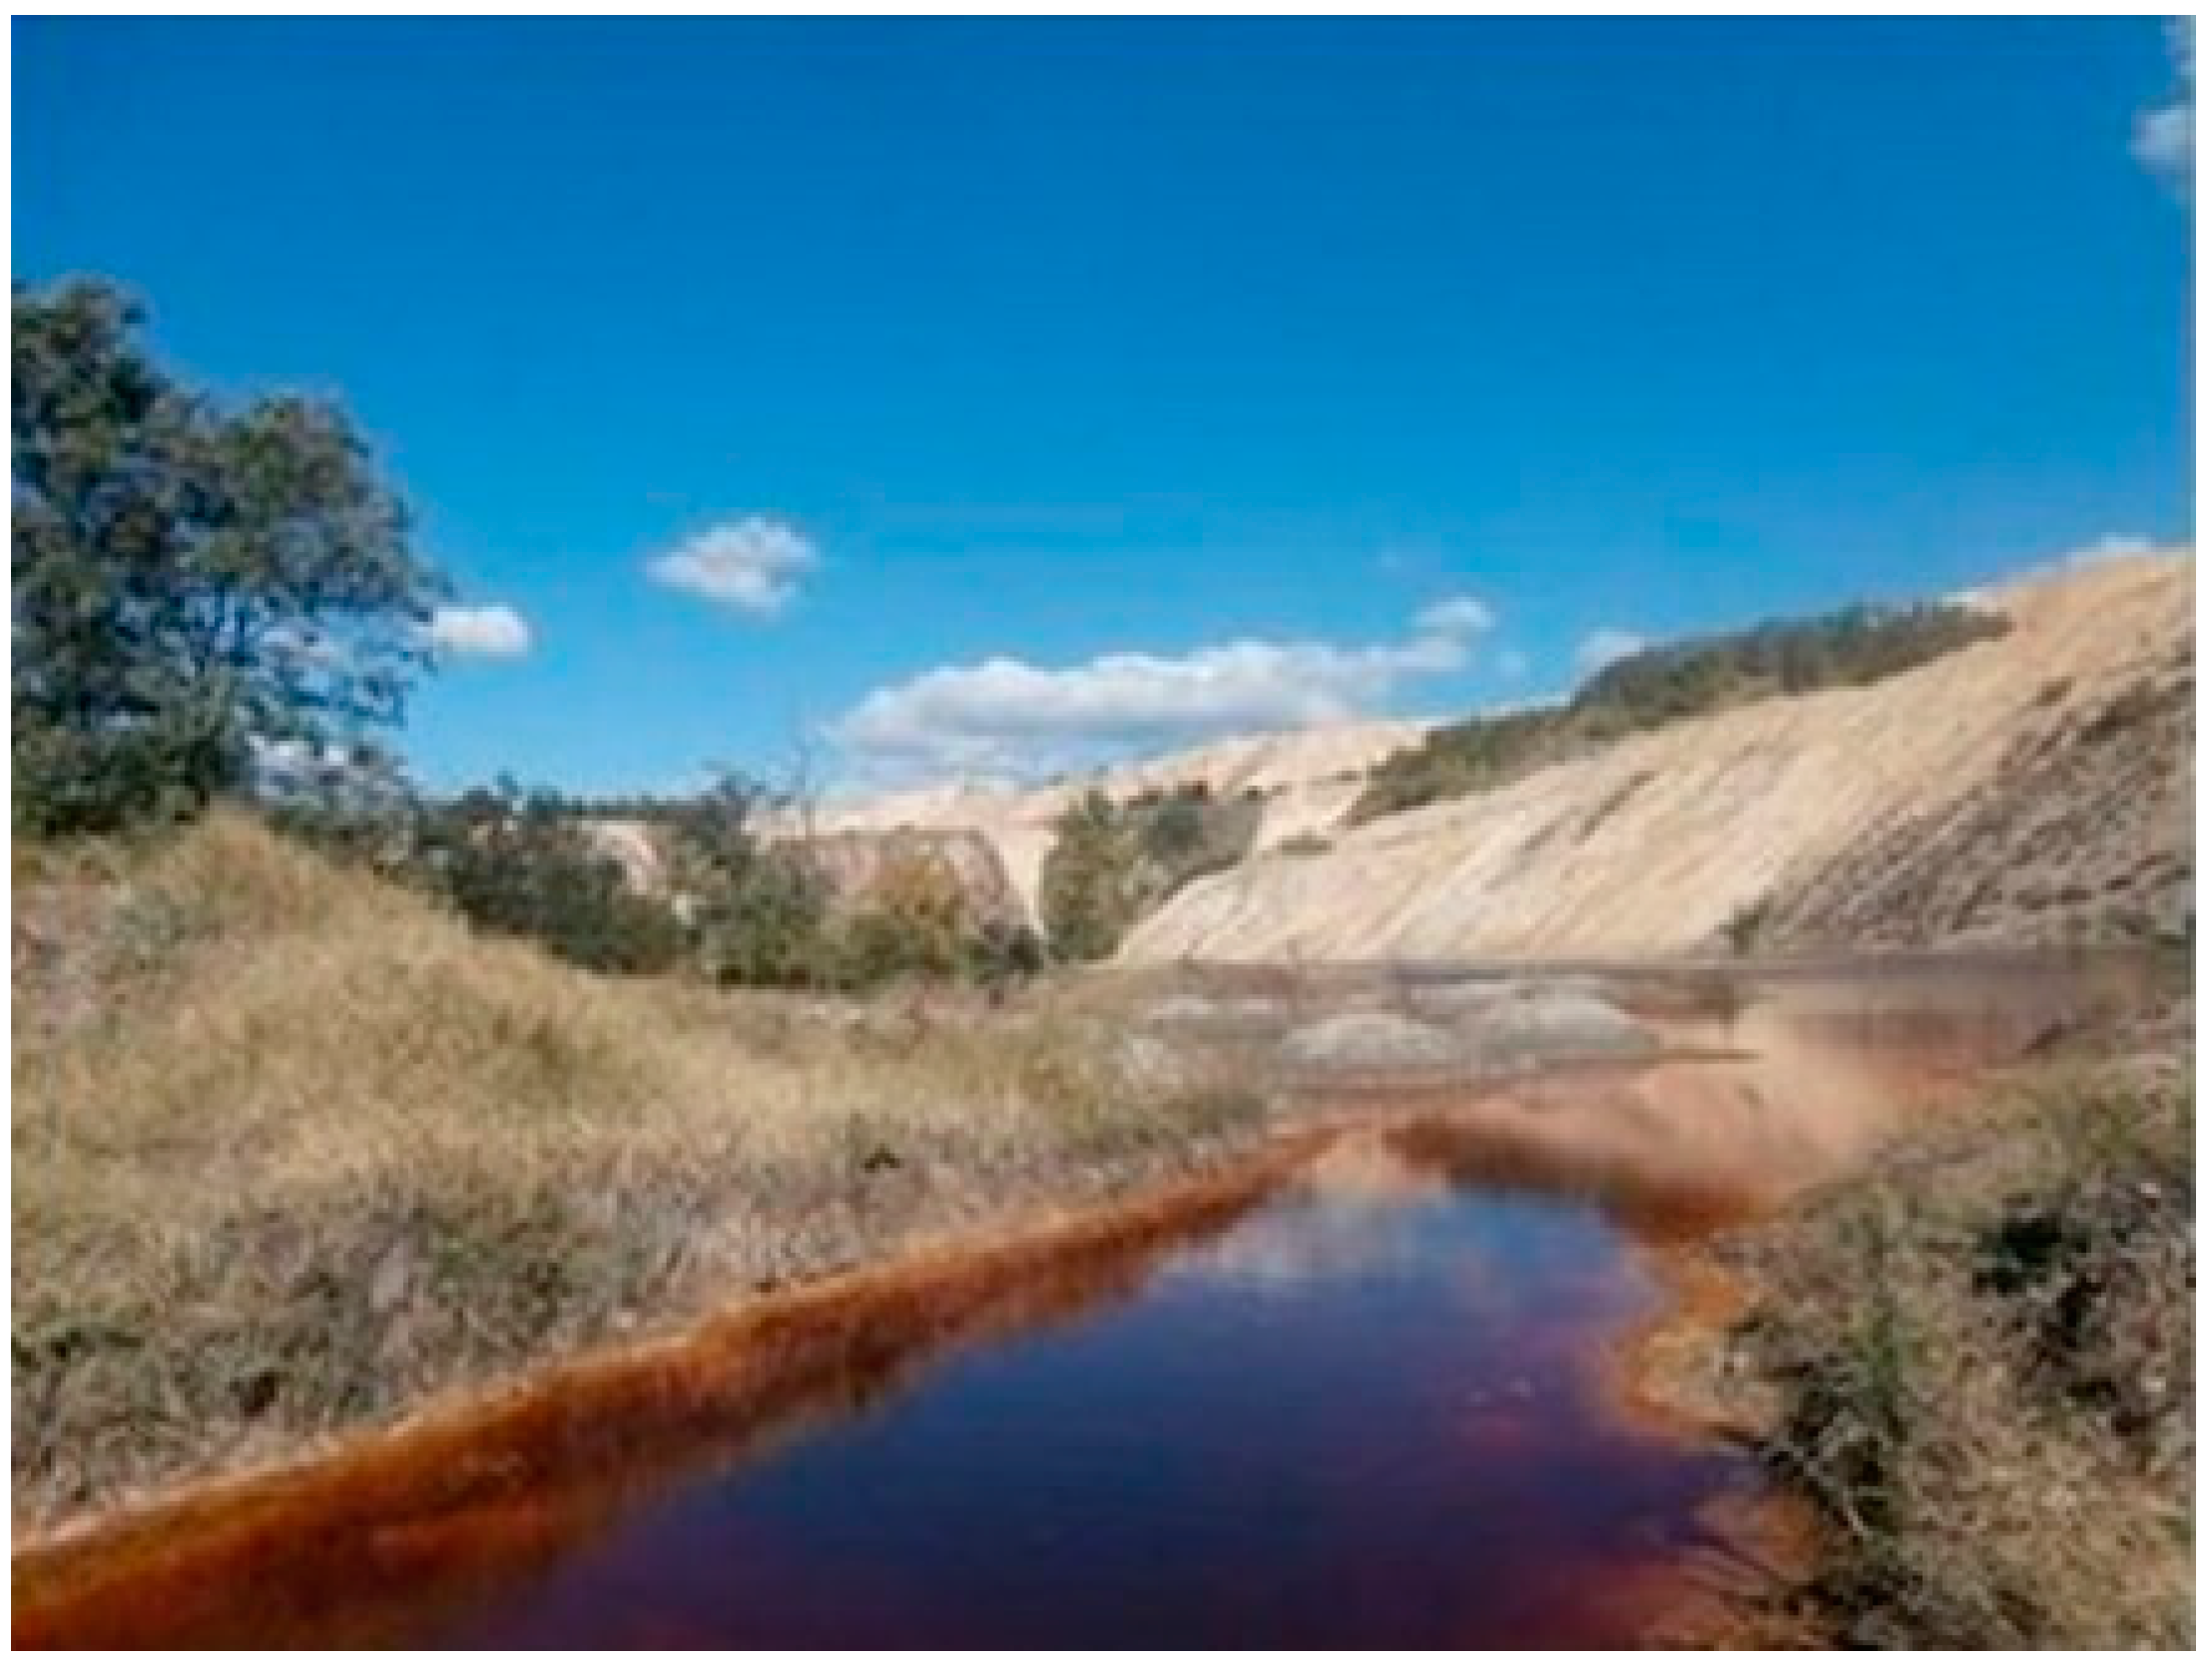
2.1.1. AMD Sample
2.1.2. Slaked Lime
2.1.3. Flocculant
2.1.4. Adsorbent
2.2. Neutralization Method
2.2.1. Laboratory Tests
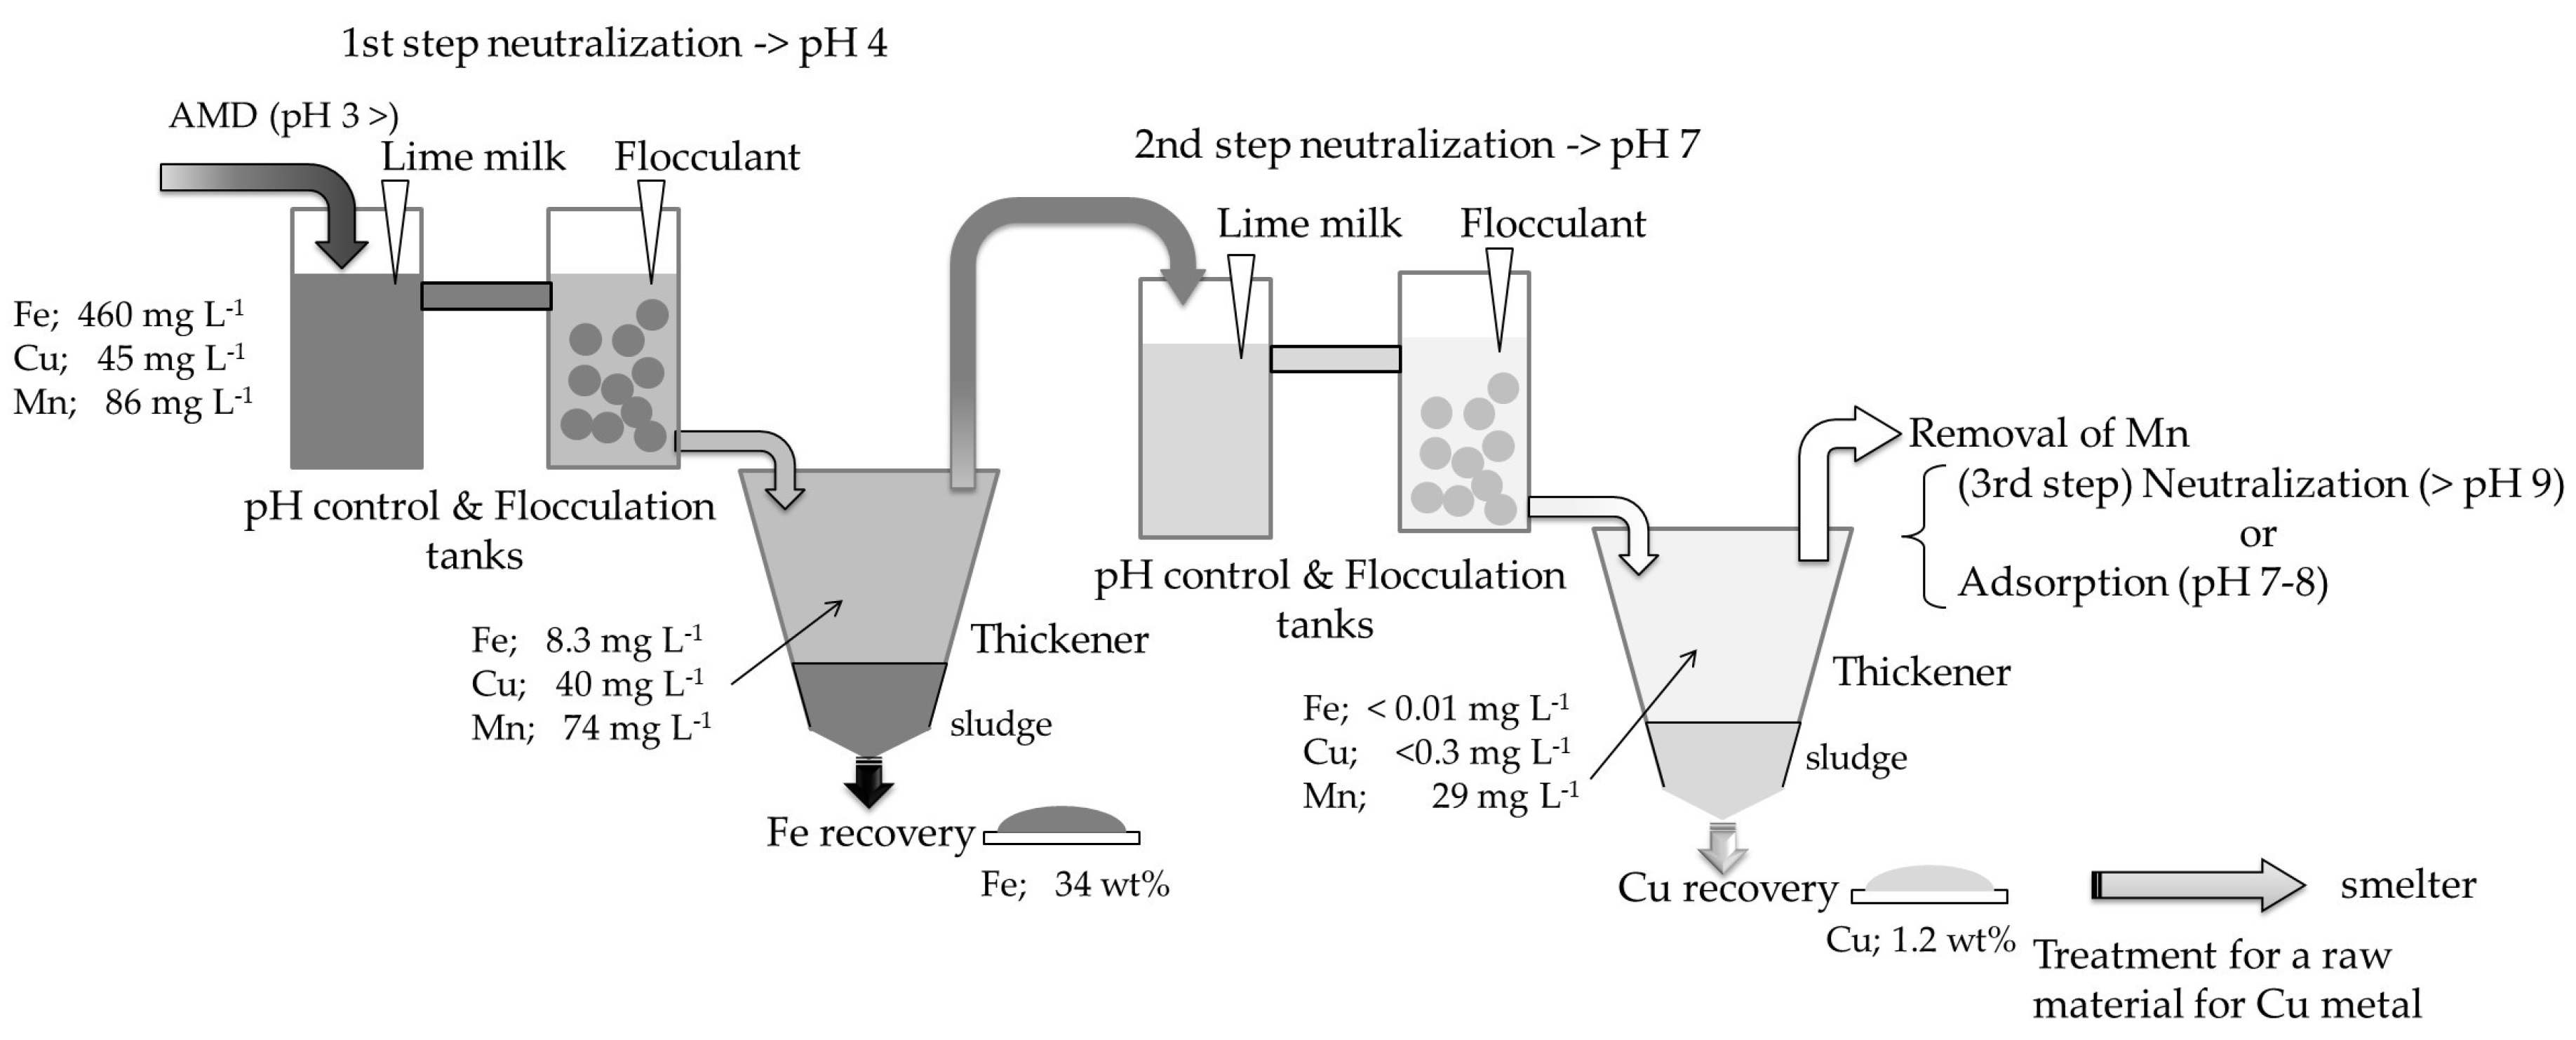
2.2.2. Two-Step Neutralization Treatment on Semi Industrial Plant
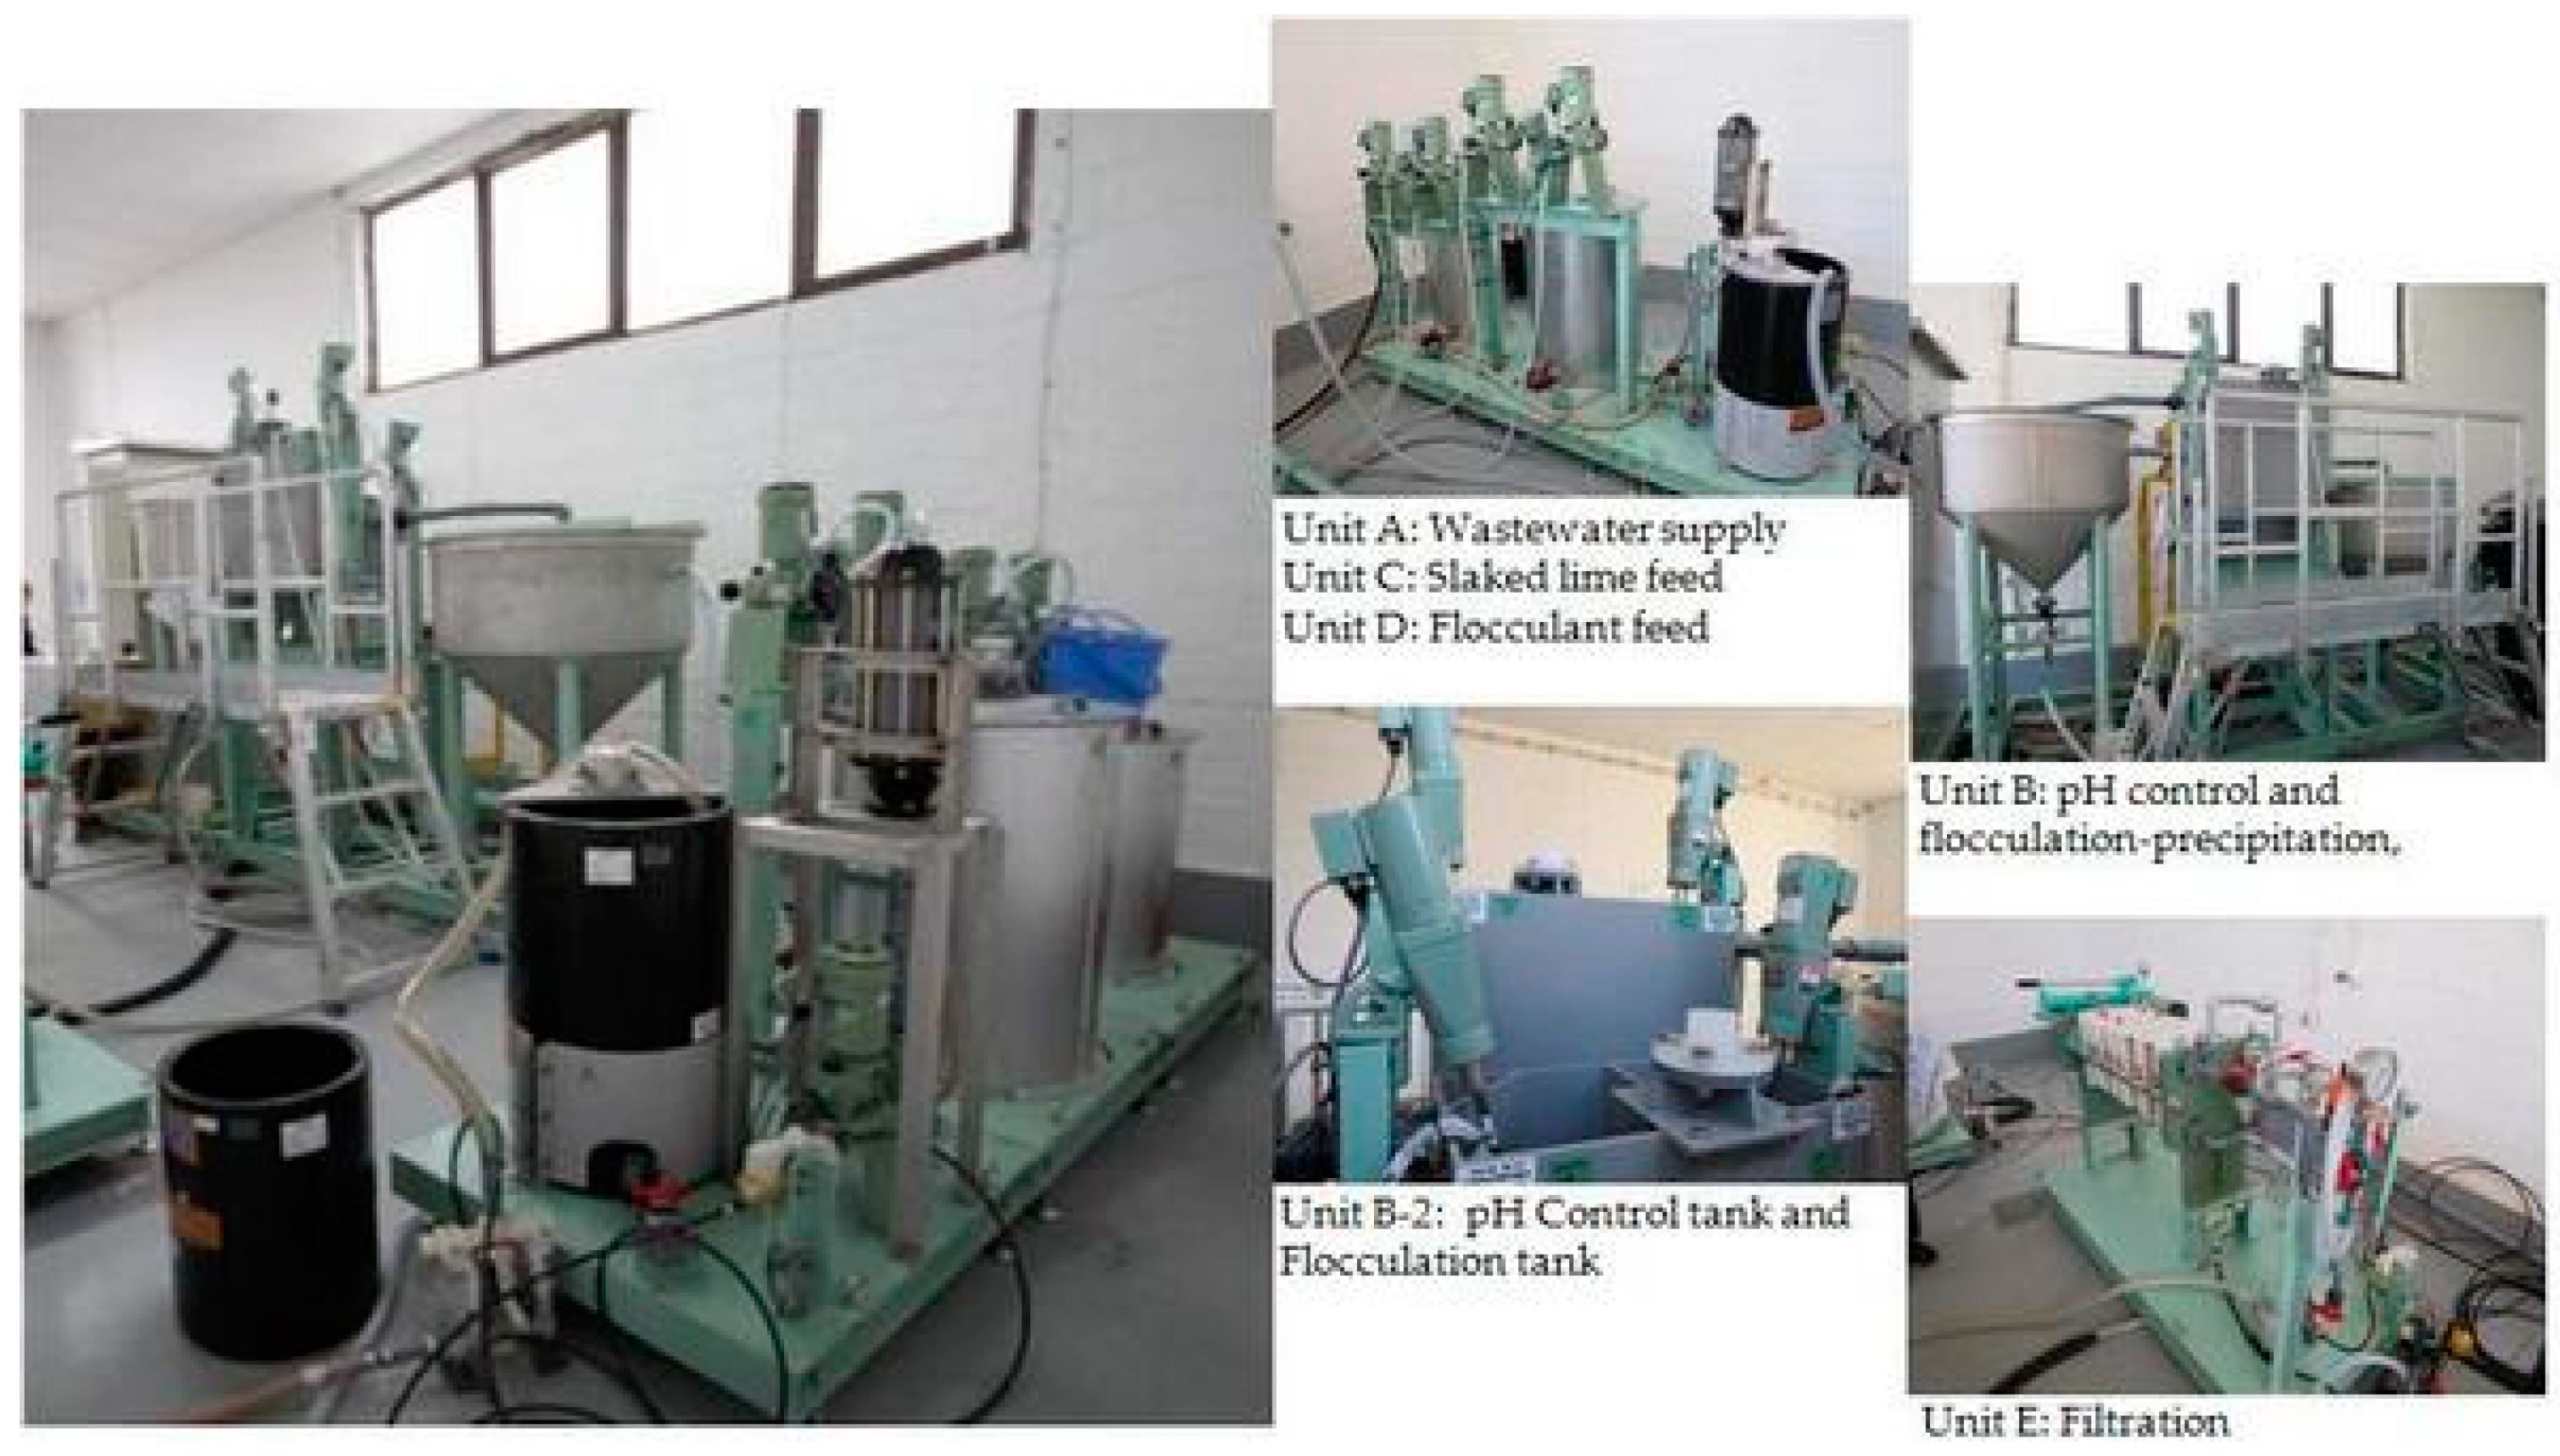
2.2.3. General Description of the Semi Industrial Plant for Two-Step Neutralization Treatment
2.2.4. Technological Procedure for Neutralization Treatment on Semi Industrial Plant
2.3. Adsorption Method
2.4. Quantitative Analysis of Elements
3. Results and Discussion
3.1. Neutralisation Method
3.1.1. Laboratory Tests
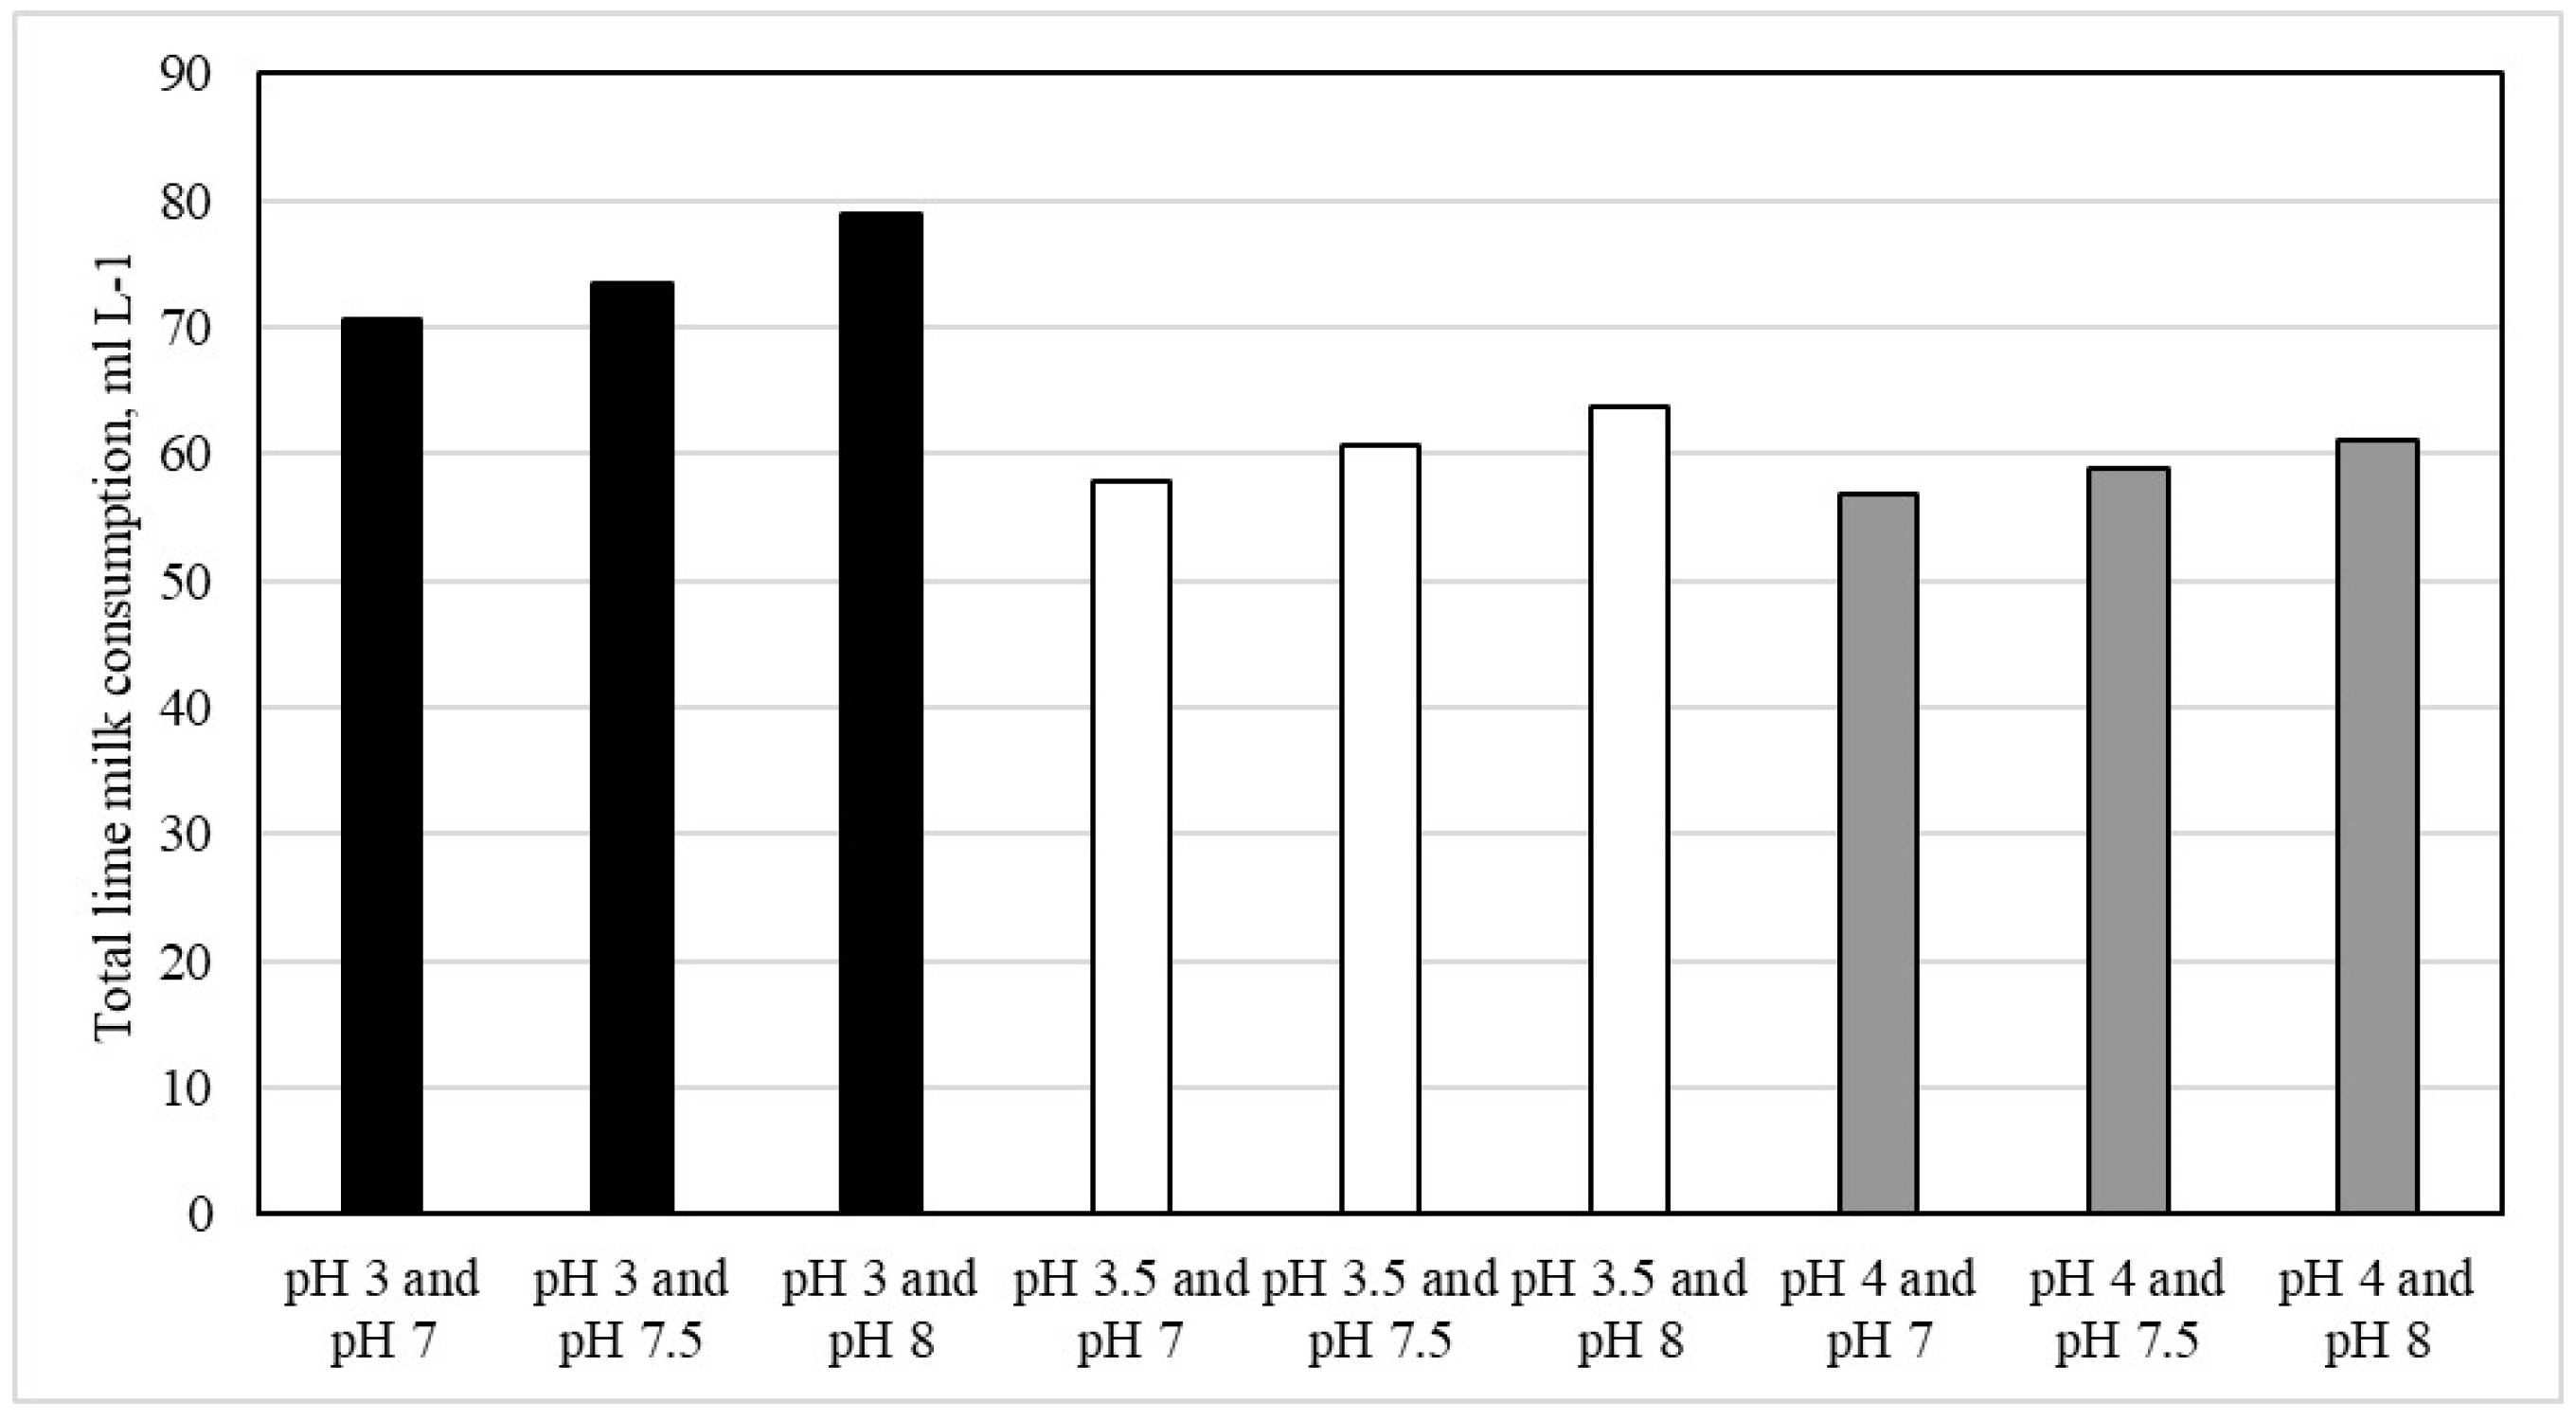
3.1.2. Two-Step Neutralization Test on Semi Industrial Plant
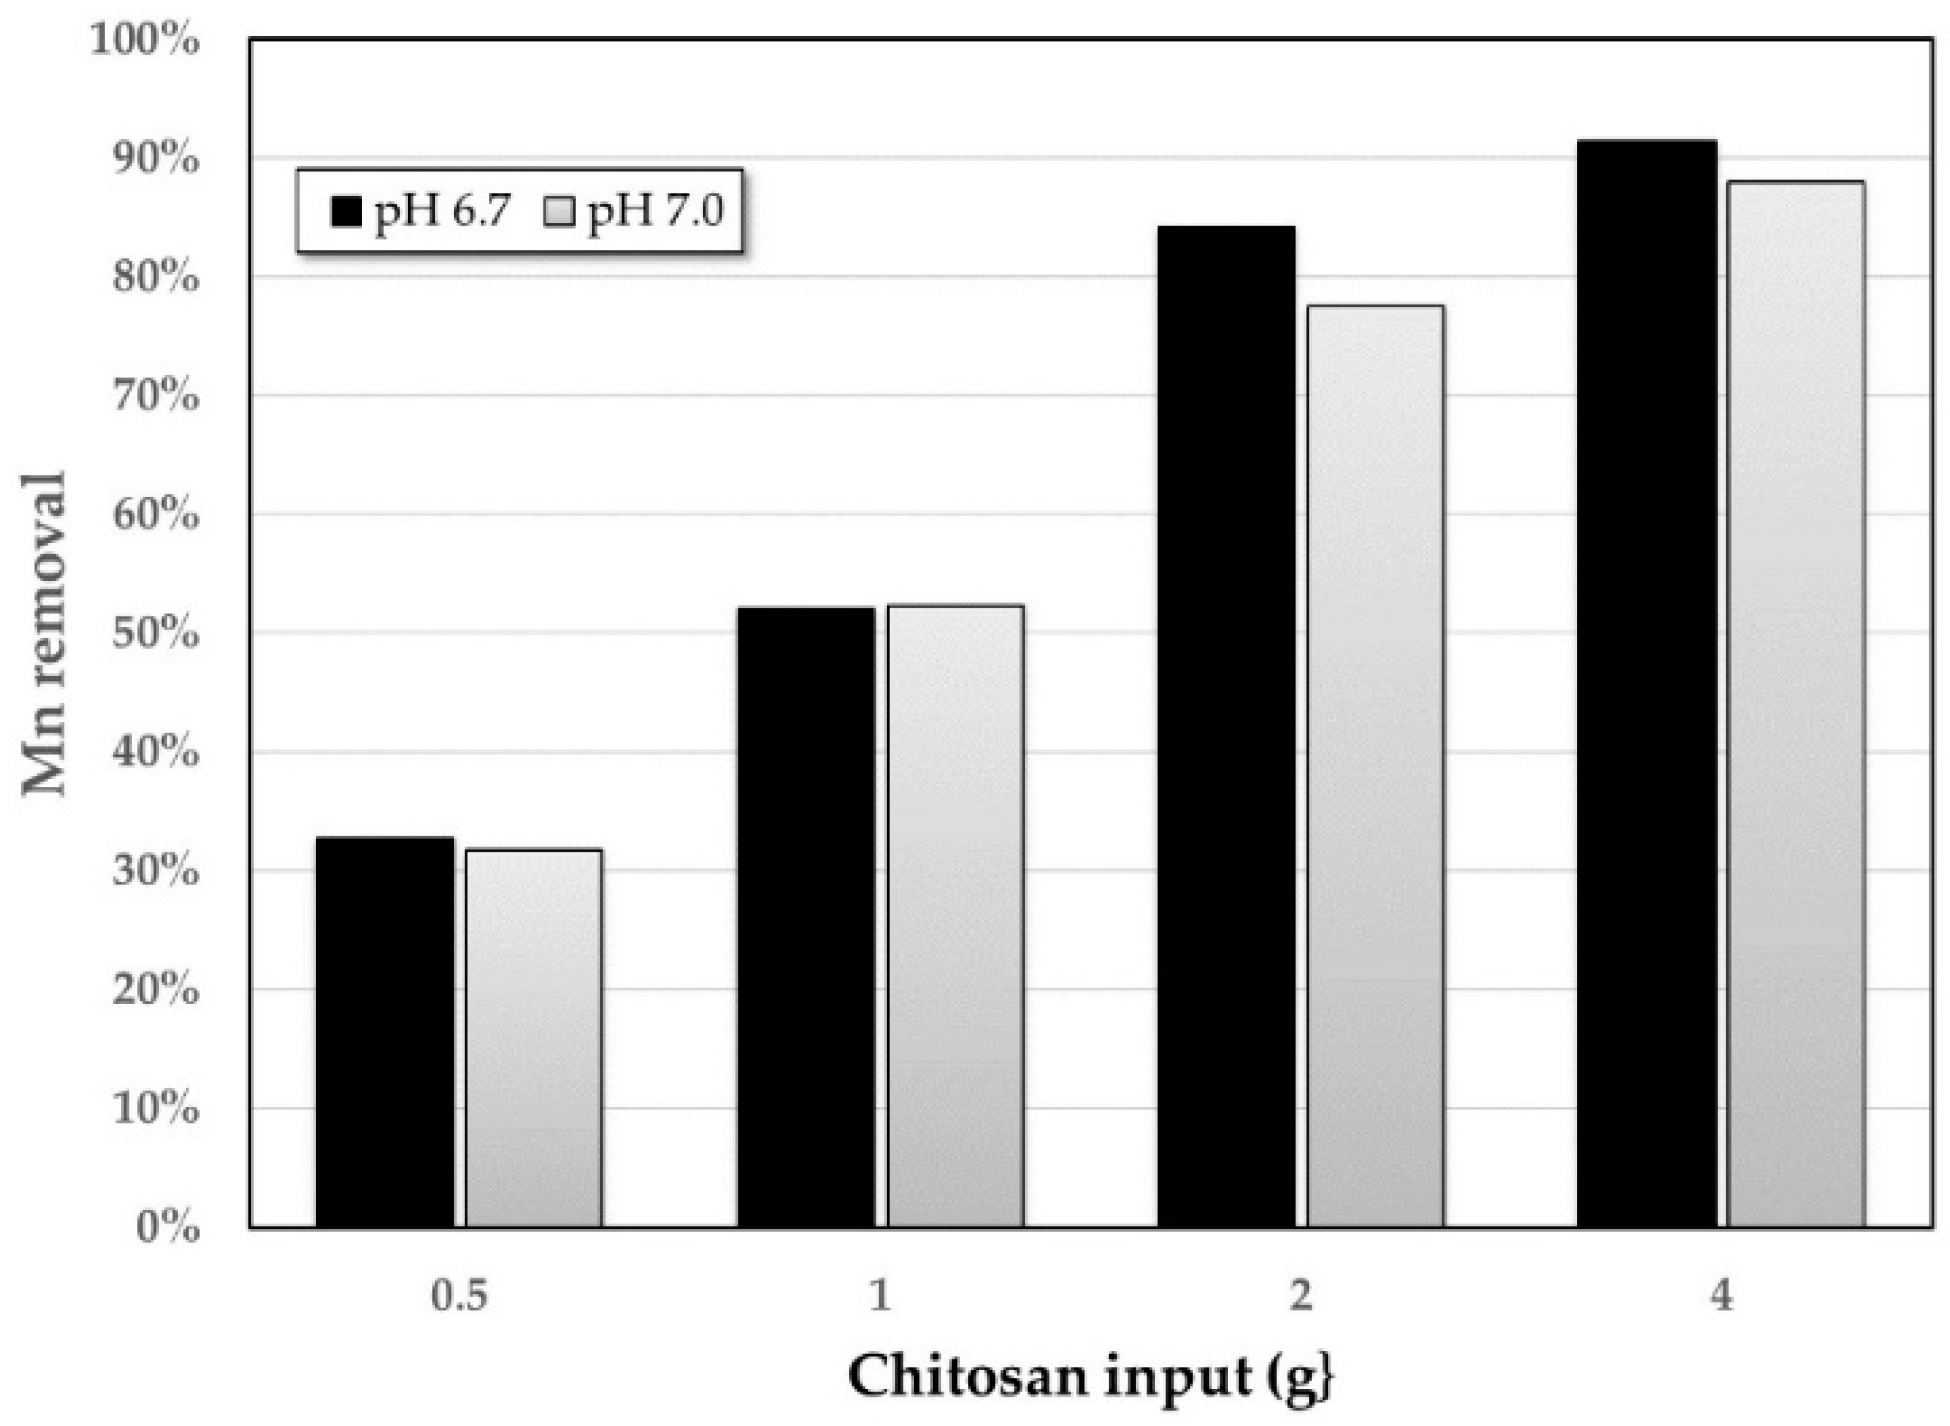
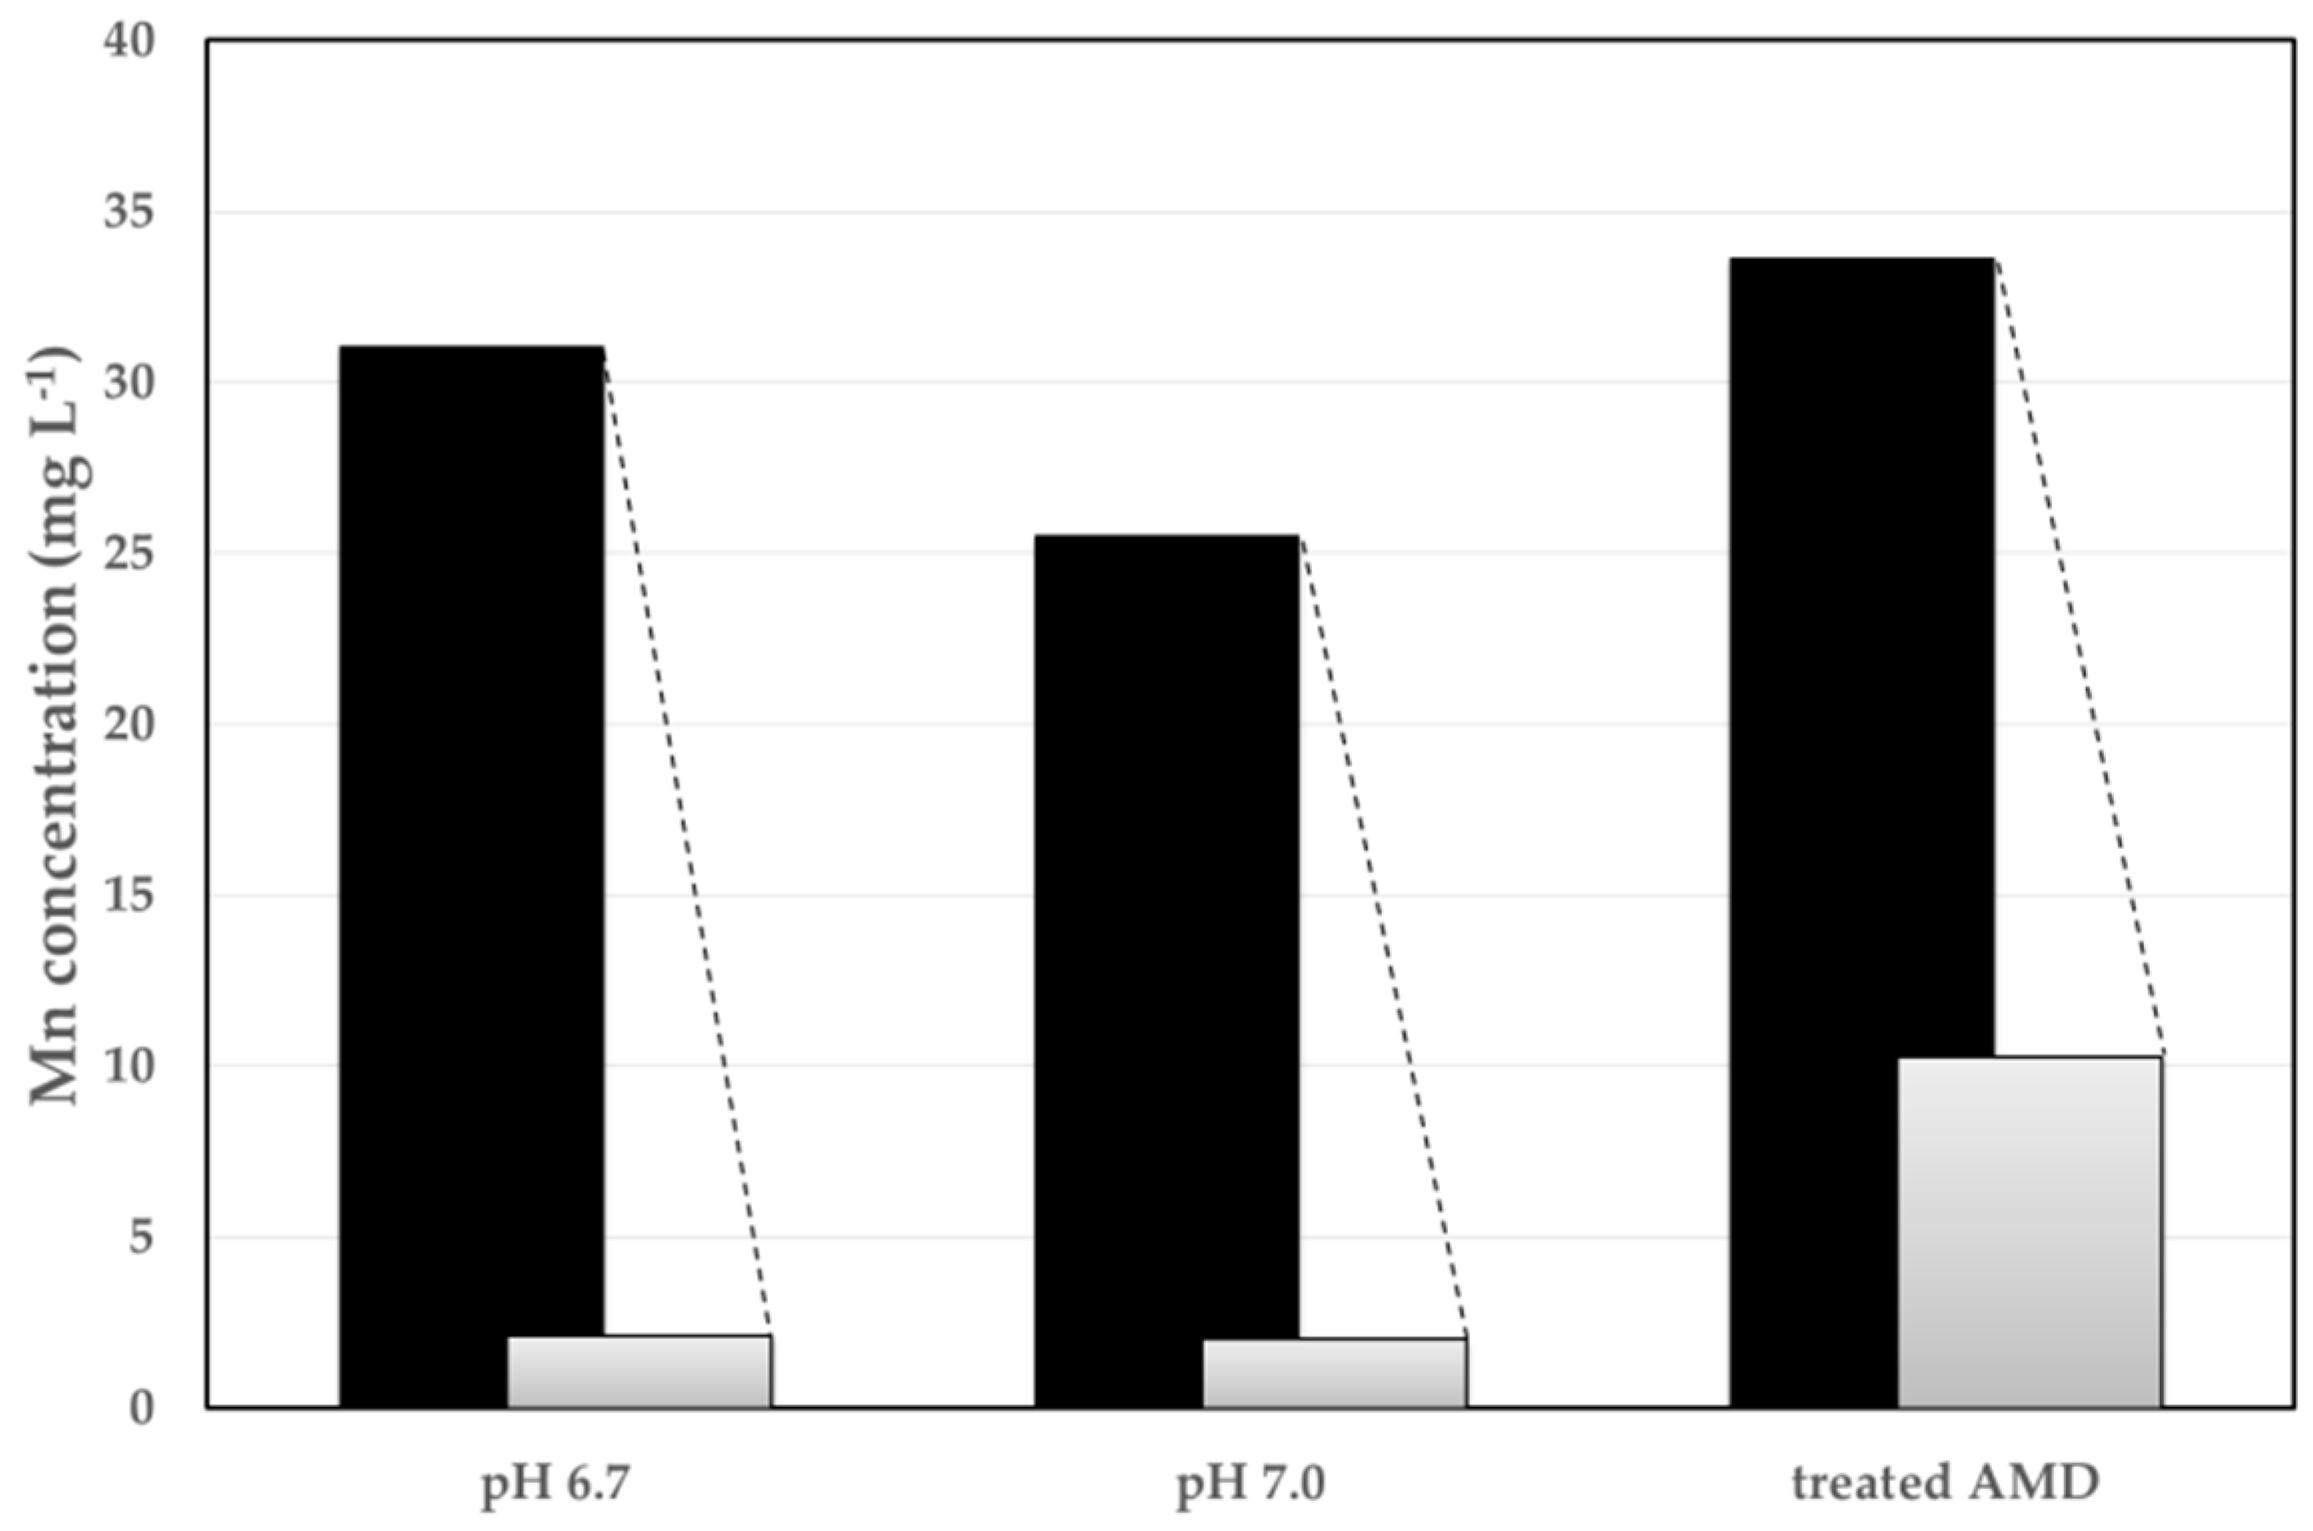
3.2. Adsorption Method
3.3. Characterization of the Obtained Sludge
4. Conclusions
Author Contributions
Funding
Acknowledgments
Conflicts of Interest
References
- Stevanović, Z.; Obradović, L.; Marković, R.; Jonović, R.; Avramović, L.; Bugarin, M.; Stevanovic, J. Mine Waste Water Management in the Bor Municipality in Order to Protect the Bor River Water, Waste Water—Treatment Technologies and Recent Analytical Developments, Fernando Sebastian García Einschlag and Luciano Carlos, IntechOpen. Available online: https://www.intechopen.com/books/waste-water-treatment-technologies-and-recent-analytical-developments/mine-waste-water-management-in-the-bor-municipality-in-order-to-protect-the-bor-river-water (accessed on 12 June 2020). [CrossRef] [Green Version]
- Iakovleva, E.; Mäkilä, E.; Salonen, J.; Sitarz, M.; Wang, S.; Sillanpää, M. Acid mine drainage (AMD) treatment: Neutralization and toxic elements removal with unmodified and modified limestone. Ecol. Eng. 2015, 81, 30–40. [Google Scholar] [CrossRef]
- Charbonier, B. Management of Mining, Quarrying, and Ore-processing Waste in the European Union. 2001. Available online: https://ec.europa.eu/environment/waste/studies/mining/0204finalreportbrgm.pdf (accessed on 15 June 2020).
- Azapagic, A. Developing a framework for sustainable development indicators for the mining and minerals industry. J. Clean Prod. 2004, 12, 639–662. [Google Scholar] [CrossRef]
- ICME; UNEP. Case Studies on Tailings Management; International Council on Metals and the Environment and United Nations Environment Programme, Ottawa, Ontario KIP 6E6 CANADA and 75739 Paris FRANCE: 1998; p. 58. Available online: http://wedocs.unep.org/xmlui/bitstream/handle/20.500.11822/26442/Tailings_management.pdf?sequence=1&isAllowed=y (accessed on 2 June 2020).
- Akcil, A.; Koldas, S. Acid Mine Drainage (AMD): Causes, treatment and case studies. J. Clean Prod. 2004, 14, 1139–1145. [Google Scholar] [CrossRef]
- Dimitrijević, M.D.; Antonijević, M.M.; Dimitrijević, V.L. Oxidation of pyrite: Consequences and significance. Hem. Ind. 2002, 56, 299–316. [Google Scholar] [CrossRef]
- Abraitis, P.K.; Pattrick, R.A.D.; Vaughan, D.J. Variations in the compositional, textural and electrical properties of natural pyrite: A review. Int. J. Miner Process 2004, 74, 41–59. [Google Scholar] [CrossRef]
- Gorgievski, M.; Božić, D.; Stanković, V.; Bogdanović, G. Copper electrowinning from acid mine drainage: A case study from the closed mine “Cerovo”. J. Hazard Mater. 2009, 170, 716–721. [Google Scholar] [CrossRef] [PubMed]
- Hilson, G.; Murck, B. Progress toward pollution prevention and waste minimization in the North American gold mining industry. J. Clean Prod. 2001, 9, 405–415. [Google Scholar] [CrossRef]
- Akinwekomi, V.; Kefeni, K.K.; Maree, J.P.; Msagati, T.A.M. Integrated acid mine drainage treatment using Mg(OH)2 or Mg(HCO3)2 and Ca(OH)2: Implications for separate removal of metals and sulphate. Int. J. Miner Process 2016, 155, 83–90. [Google Scholar] [CrossRef]
- Seo, E.Y.; Cheong, Y.W.; Yim, G.J.; Min, K.W.; Geroni, J.N. Recovery of Fe, Al and Mn in acid coal mine drainage by sequential selective precipitation with control of pH. Catena 2017, 148, 11–16. [Google Scholar] [CrossRef]
- Bailey, S.; Olin, T.J.; Bricka, R.M.; Adrian, D.D. A review of potentially low-cost sorbents for heavy metals. Water Res. 1999, 33, 2469–2479. [Google Scholar] [CrossRef]
- Van Zyl, H.C.; Maree, J.P.; van Niekerk, A.M.; van Tonder, G.J.; Naidoo, C. Collection, treatment and re-use of mine water in the Olifants River Catchment. J. S. Afr. I Min. Metall 2001, 101, 41–46. [Google Scholar]
- Saha, S.; Sinha, A. A review on treatment of acid mine drainage with waste materials: A novel approach. Glob. NEST J. 2018, 20, 512–528. [Google Scholar]
- Ayeche, R.; Hamdaoui, O. Valorization of carbide lime waste, a by-product ofacetylene manufacture, in wastewater treatment. Desalin. Water Treat. 2012, 50, 87–94. [Google Scholar] [CrossRef]
- Ayeche, R. Treatment by coagulation of dairy wastewater with the residual lime of National Algerian Industrial Gases Company (NIGC-Annaba). Energy Procedia 2012, 18, 147–156. [Google Scholar] [CrossRef] [Green Version]
- Rinaudo, M. Chitin and chitosan: Properties and applications. Prog. Polym. Sci. 2006, 31, 603–632. [Google Scholar] [CrossRef]
- Ngaha, W.S.W.; Teonga, L.C.; Hanafiaha, M.A.K.M. Adsorption of dyes and heavy metal ions by chitosan composites: A review. Carbohyd Polym. 2011, 83, 1446–1456. [Google Scholar] [CrossRef]
- Chitosan-Gelatin Hydrogels for Heavy Metal Adsorption and Chitosan-gelatin Hydrogels Manufactured by the Same Method, KR20190027661A. 2017. Available online: https://patents.google.com/patent/KR20190027661A/en (accessed on 5 July 2020).
- Pillai, C.K.S.; Paul, W.; Sharma, C.P. Chitin and chitosan polymers: Chemistry, solubility and fiber formation. Prog. Polym. Sci. 2009, 34, 641–678. [Google Scholar] [CrossRef]
- Malafaya, P.B.; Silva, G.A.; Reis, R.L. Natural-origin polymers as carriers and scaffolds for biomolecules and celldelivery in tissue engineering applications. Adv. Drug Deliv. Rev. 2007, 59, 207–233. [Google Scholar] [CrossRef] [PubMed] [Green Version]
- Benavente, M. Adsorption of Metallic Ions onto Chitosan: Equilibrium and Kinetic Studies, Licentiate Thesis, Royal Institute of Technology, Department of Chemical Engineering and Technology, Division of Transport Phenomena Stockholm, Sweden, May 2008. Available online: http://www.diva-portal.org/smash/get/diva2:13755/FULLTEXT01.pdf (accessed on 12 July 2020).
- REGULATION on Pollutant Limit Values into Surface and Groundwater and Sediment and Deadlines for Their Achievement (“Off. Gazette of the RS”, no. 50/2012). Available online: http://www.pravno-informacionisistem.rs/SlGlasnikPortal/eli/rep/sgrs/vlada/uredba/2012/50/1/reg (accessed on 31 July 2020).


| Month/Year | pH | Element | |||||||
|---|---|---|---|---|---|---|---|---|---|
| Al | Fe | Mg | Mn | S | Zn | Cu | Sr | ||
| Concentration, mg L−1 | |||||||||
| March/2017 | 2.96 | 299.6 | 613.2 | 1279.6 | 91.8 | 3366 | 23.1 | 46.5 | 0.8 |
| June/2017 | 2.94 | 294.7 | 506.9 | 1154.2 | 103.4 | 3203 | 22.6 | 38.3 | 1.3 |
| September/2017 | 2.81 | 209.8 | 322.6 | 893.5 | 90.8 | 2377 | 12.8 | 34.7 | 1.2 |
| December/2017 | 2.80 | 261.5 | 456.3 | 979.1 | 87.3 | 2753 | 19.2 | 40.7 | 1.3 |
| Items | Description |
|---|---|
| Unit A: Wastewater supply | Receiving pump, flow rate: 20 L min−1, used for transport the feed wastewater in the wastewater tank. |
| Wastewater tank, for storage of feed wastewater. | |
| Wastewater pump, flow rate: 2–7 L min−1, used for feed wastewater transport in unit B. | |
| Unit B: pH control and flocculation-precipitation, configured from: Unit B-1, Unit B-2 and Unit B-3 | Unit B-1: Thickener A, volume 410 L, used for solid–liquid separation of the feed water that has been done primary pH control (according to the first set pH value) and flocculation. |
| Unit B-2: pH Control tank A/B (50 L each tank), Flocculation tank A/B, (50 L each tank). This unit is used for the primary pH control (according to the first set pH value), secondary pH control (according to the second set pH value) and flocculation of the feed wastewater. A pH control agitator A/B is used for solution mixing in the pH Control tank A/B. Flocculation agitator A/B is used for solution mixing in the Flocculation tanks. | |
| Unit B-3: Thickener B, volume 410 L, used for the solid-liquid separation of the feed water that has been done the secondary pH control (according to the second set pH value) and flocculation. | |
| Unit E: Filtration | Thickener A and Thickener B of Unit B should be visually checked regularly for slurry buildup, and as it has grown to a substantial level, manually operated valves under the respective thickeners should be opened for discharge of slurry by a slurry pump, flow rate 20 L min−1, to Filter press, capacity 3 L. The filtrate will be discharged by a portable filtrate pump or returned to the wastewater tank depending on the level of its water quality. Filter press will be of a fully automatic type with a pneumatic press function built in. |
| Unit C: Slaked lime feed | Slaked lime and water are to be charged into a Lime slurry tank, volume 250 L, in advance for controlling its concentration to 2.5 mass %. The conditioned lime sludge will be sent automatically, by lime sludge pump A/B, (0.5 L min−1) to pH Control tank A/B according to their respective pH values. |
| Unit D: Flocculant feed | Polymer flocculant and water are charged into the Flocculant tank, (volume 100 L), in advance for controlling its concentration up to 0.5 g L−1. The conditioned flocculant will be sent to the Flocculation tank A/B at a constant feed rate irrespectively of the feed water flow rate by a flocculant pump A/B, flow rate 0.05 L min−1. |
| Compressor | Compressor (370 L min−1) will be used in order to supply the compressed air to filter press and solenoid valves. |
| Control panel | Control panel will be used for control, operation and power supply of equipment |
| Neutralization from pH Start Value of 2.78 | Element | Neutralizer | ||||||
|---|---|---|---|---|---|---|---|---|
| Fe | Mn | Cu | Zn | Cd | Co | Ni | 2.5 Mass % Lime Milk | |
| Concentration, mg L−1 | Consumption, mL L−1 | |||||||
| start | 322.6 | 90.8 | 34.7 | 12.8 | 0.040 | 0.87 | 0.41 | - |
| to pH 3 | 274.2 | 62.9 | 31.6 | 12.2 | 0.041 | 0.86 | 0.42 | 3.5 |
| to pH 3.5 | 12.3 | 62.9 | 31.2 | 12.1 | 0.041 | 0.87 | 0.42 | 20.8 |
| to pH 4 | 1.0 | 62.7 | 31.5 | 12.0 | 0.041 | 0.86 | 0.42 | 25.0 |
| Neutralization from pH 3 | Element | Neutralizer | ||||||
|---|---|---|---|---|---|---|---|---|
| Fe | Mn | Cu | Zn | Cd | Co | Ni | 2.5 Mass % Lime Milk | |
| Concentration, mg L−1 | Consumption, mL L−1 | |||||||
| to pH 7 | 0.14 | 38.2 | 0.06 | 0.44 | 0.012 | 0.28 | 0.15 | 67.2 |
| to pH 7.5 | 0.03 | 28.4 | 0.04 | 0.13 | 0.001 | 0.13 | 0.08 | 70.0 |
| to pH 8 | 0.09 | 20.0 | 0.03 | 0.03 | 0.002 | 0.03 | 0.04 | 75.4 |
| Neutralization from pH 3.5 | Element | Neutralizer | ||||||
| Fe | Mn | Cu | Zn | Cd | Co | Ni | 2.5 mass % lime milk | |
| Concentration, mg L−1 | Consumption, mL L−1 | |||||||
| to pH 7 | 0.02 | 43.0 | 0.06 | 1.04 | 0.022 | 0.41 | 0.24 | 37 |
| to pH 7.5 | 0.02 | 37.2 | 0.03 | 0.27 | 0.013 | 0.20 | 0.12 | 40 |
| to pH 8 | 0.02 | 31.9 | 0.03 | 0.07 | 0.007 | 0.09 | 0.07 | 43 |
| Neutralization from pH 4 | Element | Neutralizer | ||||||
| Fe | Mn | Cu | Zn | Cd | Co | Ni | 2.5 mass % lime milk | |
| Concentration, mg L-1 | Consumption, mL L−1 | |||||||
| to pH 7 | 0.01 | 42.2 | 0.04 | 0.65 | 0.019 | 0.33 | 0.21 | 31.8 |
| to pH 7.5 | 0.01 | 39.8 | 0.05 | 0.22 | 0.015 | 0.23 | 0.14 | 33.8 |
| to pH 8 | 0.01 | 36.8 | 0.03 | 0.11 | 0.010 | 0.16 | 0.10 | 40.3 |
| Sample Location (Test Duration) | Element | |||||||
|---|---|---|---|---|---|---|---|---|
| Fe | Mn | Cu | Zn | Cd | Co | Ni | Ca | |
| Concentration, mg L−1 | ||||||||
| Robule Lake (0 h) | 461.8 | 83.6 | 45.3 | 16.9 | 0.055 | 1.05 | 0.52 | 453 |
| First neutralization step, pH 4 | ||||||||
| Thickener A (1 h) | 16.0 | 66.7 | 35.9 | 15.0 | 0.050 | 0.92 | 0.44 | 797 |
| Thickener A (2 h) | 11.5 | 65.3 | 36.6 | 14.7 | 0.050 | 0.94 | 0.46 | 861 |
| Thickener A (3 h) | 12.5 | 60.5 | 38.1 | 15.0 | 0.051 | 0.97 | 0.47 | 772 |
| Thickener A (4 h) | 7.5 | 64.4 | 37.0 | 15.2 | 0.052 | 0.97 | 0.46 | 783 |
| Thickener A (5 h) | 0.7 | 79.7 | 45.4 | 15.6 | 0.054 | 0.99 | 0.49 | 516 |
| Thickener A (6 h) | 8.3 | 74.2 | 40.3 | 15.0 | 0.050 | 0.91 | 0.43 | 860 |
| Second neutralization step, pH 7 | ||||||||
| Thickener B (3 h) | 0.078 | 25.9 | 0.38 | 0.43 | 0.011 | 0.11 | 0.047 | 1430 |
| Thickener B (4 h) | 0.016 | 25.9 | 0.20 | 0.38 | 0.011 | 0.12 | 0.053 | 1107 |
| Thickener B (5 h) | 0.017 | 27.9 | 0.20 | 0.36 | 0.011 | 0.13 | 0.064 | 1298 |
| Thickener B (6 h) | 0.044 | 29.4 | 0.31 | 0.45 | 0.012 | 0.13 | 0.079 | 1312 |
| Element Mass % | First Neutralization Step (pH Initial–pH 4) | Second Neutralization Step (pH 4–pH 7) |
|---|---|---|
| Al | 2.73 | 7.13 |
| Cu | 0.15 | 1.24 |
| Fe | 33.52 | 0.47 |
| Ca | 3.07 | 11.77 |
| Mg | 0.015 | 2.79 |
| Mn | 0.26 | 1.67 |
| Zn | 0.013 | 0.50 |
| As | 0.0024 | 0.0014 |
| Cd | 0.000018 | 0.00174 |
| Co | 0.000885 | 0.0374 |
| Ni | 0.000651 | 0.0189 |
© 2020 by the authors. Licensee MDPI, Basel, Switzerland. This article is an open access article distributed under the terms and conditions of the Creative Commons Attribution (CC BY) license (http://creativecommons.org/licenses/by/4.0/).
Share and Cite
Markovic, R.; Bessho, M.; Masuda, N.; Stevanovic, Z.; Bozic, D.; Apostolovski Trujic, T.; Gardic, V. New Approach of Metals Removal from Acid Mine Drainage. Appl. Sci. 2020, 10, 5925. https://doi.org/10.3390/app10175925
Markovic R, Bessho M, Masuda N, Stevanovic Z, Bozic D, Apostolovski Trujic T, Gardic V. New Approach of Metals Removal from Acid Mine Drainage. Applied Sciences. 2020; 10(17):5925. https://doi.org/10.3390/app10175925
Chicago/Turabian StyleMarkovic, Radmila, Masahiko Bessho, Nobuyuki Masuda, Zoran Stevanovic, Dragana Bozic, Tatjana Apostolovski Trujic, and Vojka Gardic. 2020. "New Approach of Metals Removal from Acid Mine Drainage" Applied Sciences 10, no. 17: 5925. https://doi.org/10.3390/app10175925
APA StyleMarkovic, R., Bessho, M., Masuda, N., Stevanovic, Z., Bozic, D., Apostolovski Trujic, T., & Gardic, V. (2020). New Approach of Metals Removal from Acid Mine Drainage. Applied Sciences, 10(17), 5925. https://doi.org/10.3390/app10175925