Article

An Experimental and Statistical Study on Rebar Corrosion Considering the Temperature Effect Using Gaussian Process Regression

1
Concrete Laboratory, Department of Civil and Environmental Engineering, Hanyang University, 222, Wangsimni-ro, Seongdong-gu, Seoul 05510, Korea
2
Department of Civil Engineering, Daejin University, 1007, Hoguk-ro, Pocheon-si 11159, Korea
3
GFC R&D Co., Ltd., 155 Jajak-ro, Pocheon-si, Gyeonggi-do 11158, Korea
*
Author to whom correspondence should be addressed.
Appl. Sci. 2020, 10(17), 5937; https://doi.org/10.3390/app10175937
Submission received: 28 July 2020 / Revised: 18 August 2020 / Accepted: 24 August 2020 / Published: 27 August 2020
(This article belongs to the Special Issue Computational and Experimental Assessment in Structural Engineering)

Abstract

:
Temperature is an important factor that affects corrosion potential in rebars. The temperature effect must be removed from the corrosion potential for precise measurement of corrosion rates. To separate the temperature effect from the corrosion potential, in this study rebar specimens were not embedded in concrete but, instead, were placed in an uncontrolled air environment. Gaussian process regression (GPR) was applied to the temperature and the non-corrosion potential data in order to remove the temperature effect from the corrosion potential. The results indicated that the corrosion potential was affected by the temperature. Furthermore, the GPR models of all the experimental cases showed high coefficients of determination (R2 > 0.90) and low root mean square errors (RMSE < 0.08), meaning that these models had high reliability. The fitted GPR models were used to successfully remove the temperature effect from the corrosion potential. This demonstrates that the GPR method can be appropriately used to assess the temperature effect on rebar corrosion.

1. Introduction

Rebar corrosion is a critical deterioration factor that is directly related to the service life of concrete structures. Rebars are protected by the passive film of concrete. However, when chloride (Cl) or sulfate (SO42−) penetrate into concrete, these aggressive materials destroy that passive film [1]. After that film is destroyed, rebars start to corrode. The critical defect is the volume expansion of the rebars which causes the concrete to crack [2]. Therefore, in the past, concrete researchers used an electrochemical method to detect corrosion, while currently the most representative methods are concrete resistivity method, half-cell method, and linear polarization resistance (LPR) method. Half-cell and concrete resistivity methods can produce results with simple measurements, making it possible to quickly determine the corrosion state of the rebar. LPR method needs an expert level of measurement skills and takes a long time to apply because it is affected by many factors such as temperature and relative humidity (RH) [3].
Recently developed corrosion detection methods utilize sensors and ultrasonic pulse velocity (UPV) [4,5,6,7,8,9,10,11,12,13]. The accuracy of detecting rebar corrosion is steadily increasing, but even with the technological progress, continuing research on the environmental factors related to rebar corrosion (e.g., humidity, temperature, impact) is essential [14]. In particular, temperature can readily increase for various reasons, such as seasonal climate change, equipment heat, friction, etc., and can directly affect rebar corrosion. Temperature is a main factor that affects rebar corrosion potential, but it is difficult to isolate or exclude the effect of temperature as most previous experiments had fixed temperature conditions [4,5,8,12,15,16,17].
Accordingly, many studies on the relationship between temperature and rebar corrosion potential are actively being carried out. For example, Pour-Ghaz et al. [18] proposed a regression model for the prediction of corrosion rates with temperature effects. They assumed that temperature affects concrete resistivity and current density, and the results of their study showed a high coefficient of determination, indicating that temperature is an important factor for corrosion potential. However, as they did a traditional linear regression, large deviations in the data had to be accepted. Taking a different approach, Deus et al. [19] studied the relationship between the passive film of stainless steel rebar and various temperature conditions (25, 35, and 45 °C). They also confirmed that temperature is an important factor in corrosion potential because the passive film weakened when the temperature was increased.
Another study by Chen et al. [20] checked the corrosion potential with heated rebar. The heated rebars showed a higher corrosion rate than the control specimen and the heat initiated a reaction between the rebars and unhydrated water. In addition, Lόpez et al. [21] researched the effect of temperature on corrosion behavior with concrete pores and inner humidity of concrete. They found a low corrosion state at dry and high temperature conditions, but a high corrosion state at humid and high temperature conditions. Both of these research groups concluded that temperature is an important factor for corrosion potential.
Statistical analysis is frequently used for assessing corrosion data. Additionally, complex data analysis skills including Bayesian methodology are required. Bayesian method is a fundamental part of machine learning (ML) in the artificial intelligence (AI) field, and is accordingly difficult to approach given its complex theory and calculations. However, corrosion research is increasingly using Bayesian method because enhanced computer performance (supercomputing) makes it possible to do complex calculations in a short time.
In addition, the Gaussian process regression (GPR) method is coming to the fore. Zhang et al. [22] researched the growth of corrosion defects at depth in underground energy pipelines based on an inverse Gaussian process model. They also used Markov Chain Monte Carlo (MCMC) simulation techniques to propose a model for pipeline corrosion management. Liu et al. [23] proposed a hybrid GPR model for predicting the service life of concrete sewers. Comparing their model results and measured field data, they showed that the GPR method could be an efficient way to predict corrosion with parameter updating. In another case, Muthulingam et al. [24] established a model for corrosion processing based on Gaussian method. Their research suggested that the Gaussian model could be an appropriate method for describing rebar corrosion, especially in non-structural damage. Thus, Gaussian method is now widely used in corrosion research; however, although many researchers have studied thermal effects for the corrosion processing and using Gaussian method, there are still few studies on the temperature effect on corrosion potential with Gaussian method.
Therefore, the purpose of this study was to remove the temperature effect from the corrosion potential based on the GPR method. Our experiments were performed in an uncontrolled air environment to capture the temperature effect on the specimen rebars. After the experiments, GPR was used to remove the temperature effect from the corrosion data. For proving the reliability of the derived GPR models, validation was provided by evaluating the coefficient of determination (R2) and the root mean square error (RMSE) values.

2. Experimental and Statistical Methods

Our research schematic process is presented in Figure 1. The experiment data was automatically logged of the potential and temperature for two months with 3 min measuring interval, and the relative humidity was fixed at 65%. After the experiments, noise had to be eliminated from the data to prevent analytical errors. The criteria of noise eliminating were the difference of data which was 3 mV of absolute value. For example, the measured of ith data was −1.5 mV and the measured of i−1th data was −5 mV, the difference of data was 3.5 mV of absolute value. Then the i−1th data was noise. After this work, the data were arranged by diameter class and consisted of temperature, non-corroded potential, and corroded potential. Additionally, the non-corroded specimens were as control of each class. The GPR analysis was performed using the arranged data.

2.1. Preparing the Specimens

In this study, four classes of rebar were used: 9.53, 12.7, 15.9, and 19.1 mm diameter, labeled as D10, D13, D16, and D19, respectively. All specimens were a type of deformed rebar with a yield strength of 400 MPa and the composition of the rebar is summarized in Table 1.
The specimens were cut to a length of 100 mm and are presented in Figure 2. After cutting, the rust was removed to obtain clear data. The specimens were soaked in 99.9% pure ethanol for one day and then dried for 2 h to fully evaporate the ethanol. Then sandpaper with 50–63 μm grit was used to remove the rust. Additionally, the capacity of the power supplier was maximum 150 W and the logging sensitivity was ±0.05%.

2.2. Corrosion Potential

Rebar corrosion experiments are usually performed by burying reinforcements in concrete and measuring the potential [8,11,12,25]. However, the aim of this study was to remove the temperature effect from the corrosion potential. Therefore, all the specimens had to be in an uncontrolled air environment, and the corrosion potential data was collected for two months continuously. The reason for arranging the specimens in an uncontrolled air condition was to get more temperature effect at the temperature variation. Our methodology was similar to that of Xiaotian et al. [13], who studied a nondestructive corrosion detection method and performed their experiments with unembedded rebars. They used UPV method on corroded rebars in open-air conditions and were able to confirm the corrosion rate. Similarly, Du et al. [15] used an optical sensor to monitor the corrosion of steel rebars in an uncontrolled air environment, and they documented the specimen corrosion. The experimental conditions in this study were similar to those two experimental setups, but the temperature was not controlled, and the corrosion speed was slower than in those studies.
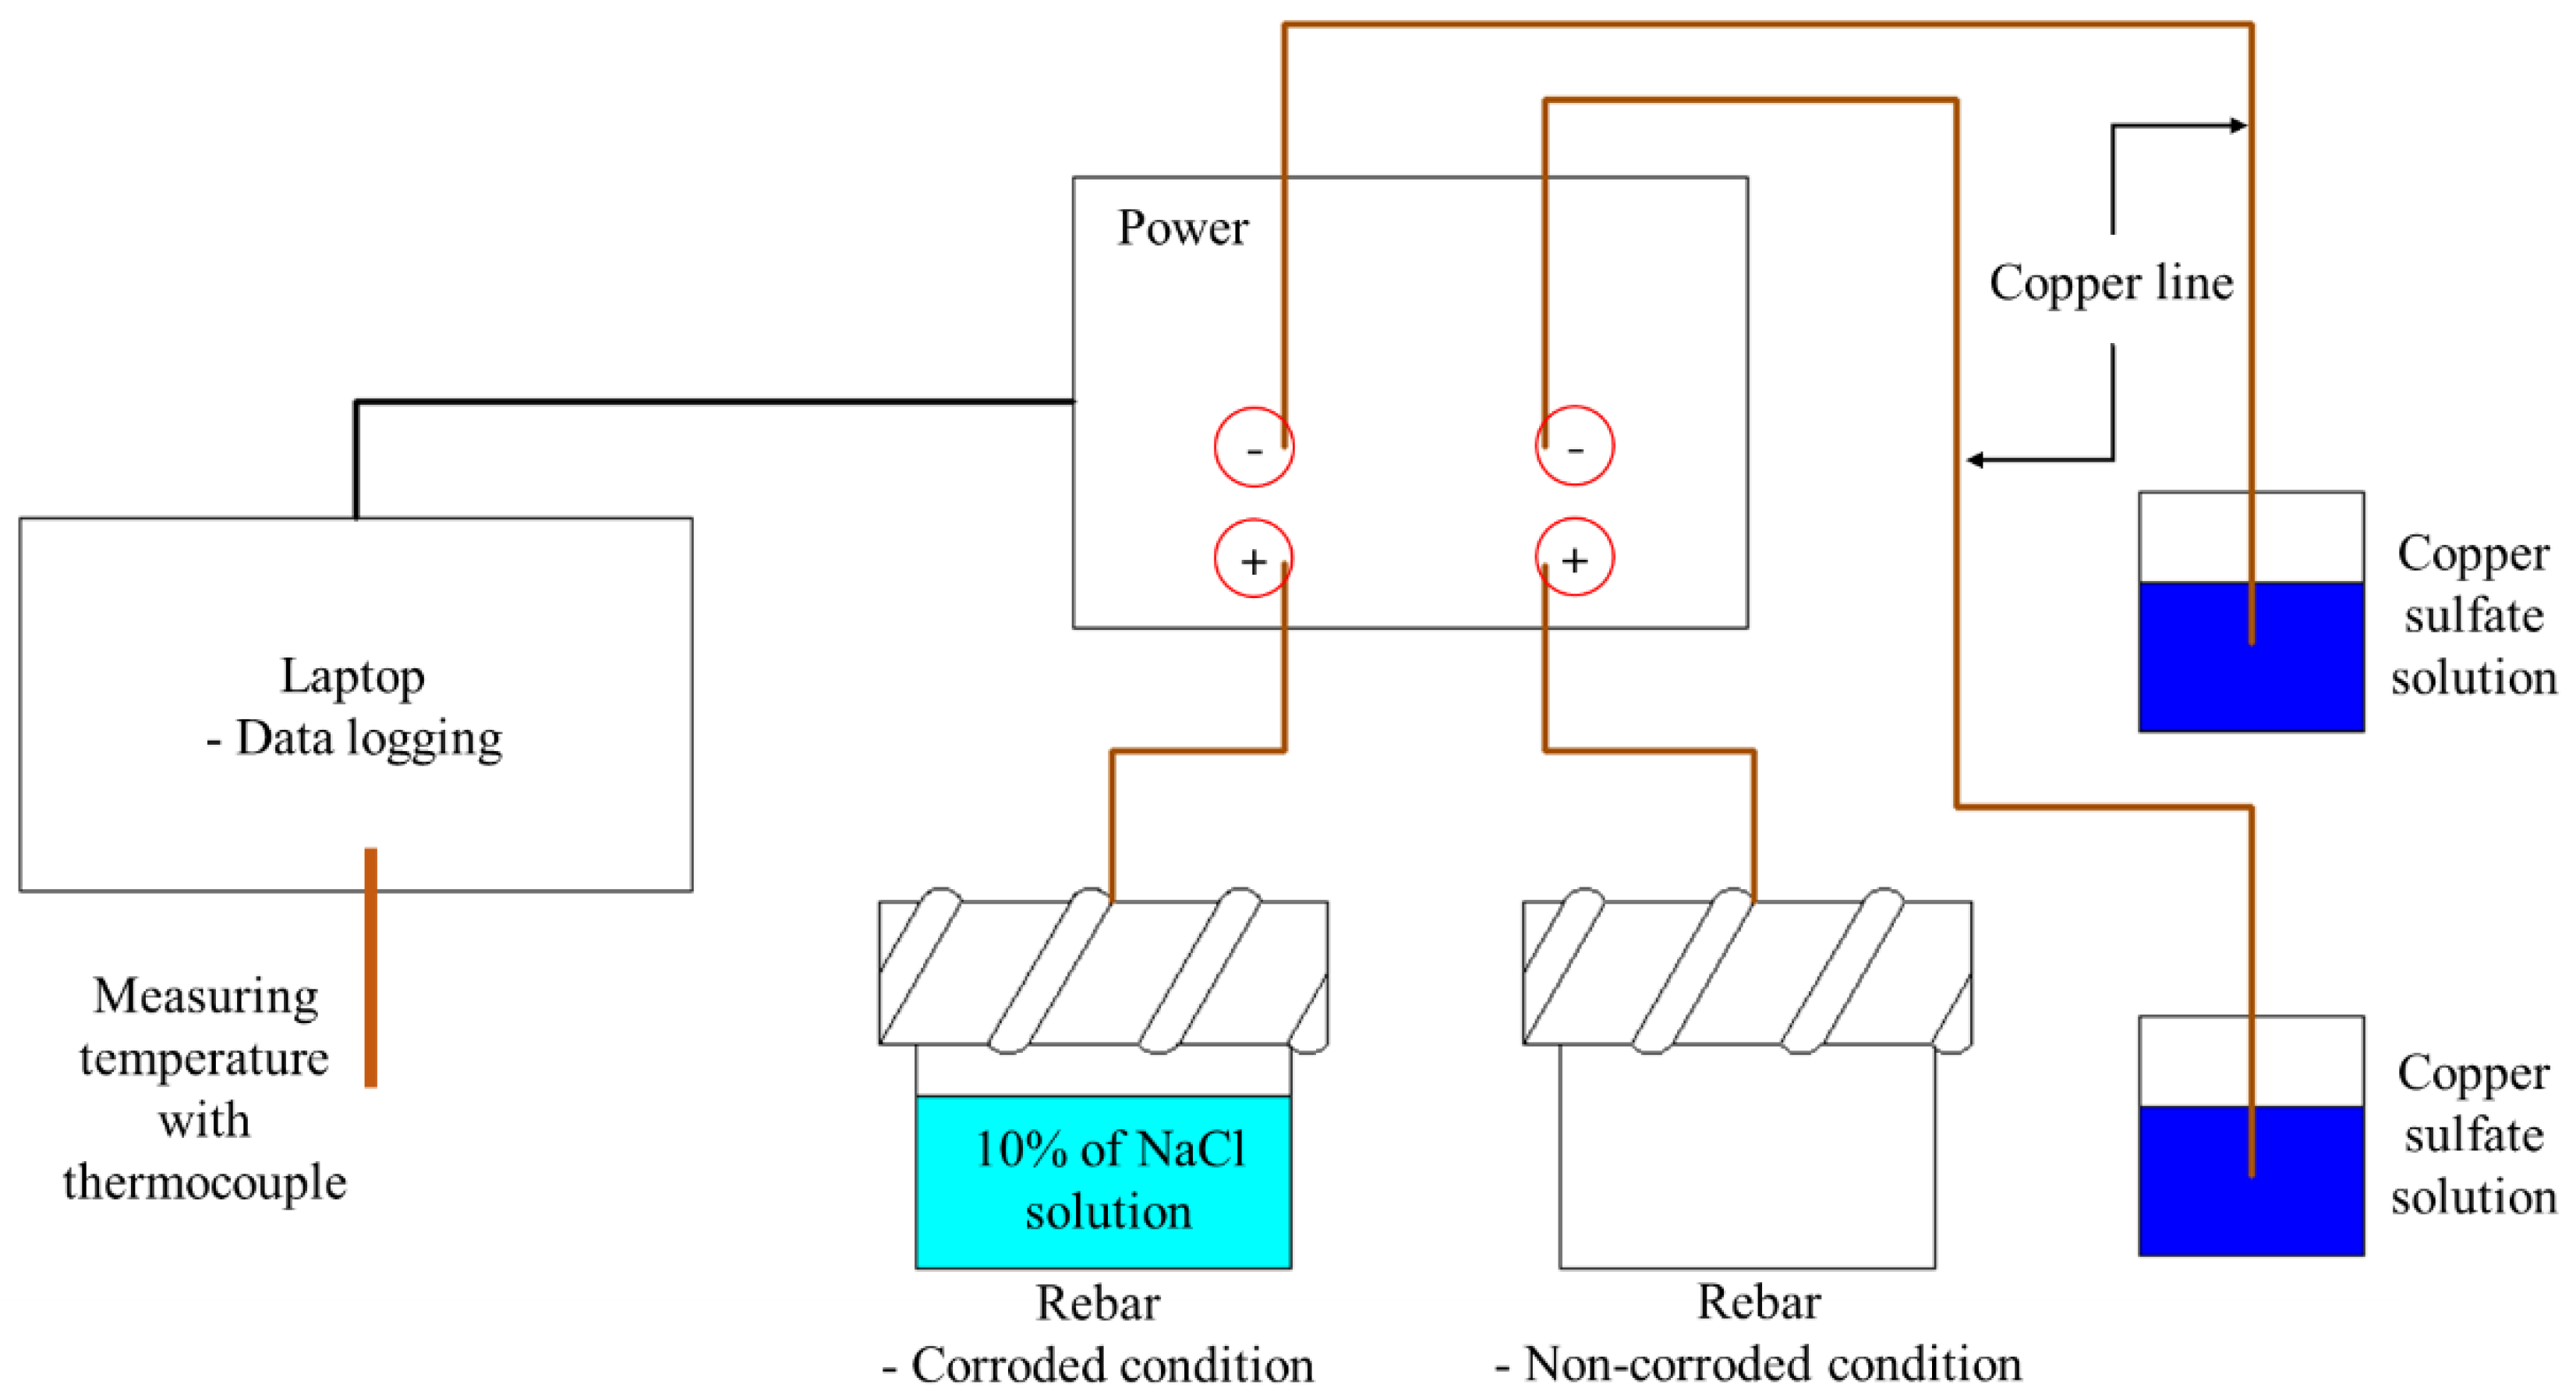
Our experimental setting is presented in Figure 2. Specimens were set as the separate cases of corroding and non-corroding like Figure 2. Measuring interval was set as mentioned before and temperature was also logged simultaneously. The corrosion was triggered by evaporating a 10% NaCl solution so that the corrosion proceeded as slowly as possible; the NaCl purity was 99%. In addition, copper-copper(II) sulfate solution setup was used as an electrode with a copper line (CSE) [16,25].

2.3. Gaussian Process Regression (GPR)

The GPR method is basically based on Bayesian regression (BR), which can incorporate many variables and can more precisely predict than traditional regression. Assuming that the Y = [y1, y2, y3, …, yn]T of size n follows the standard normal distribution, it can be expressed that Y~N(μ, C) where μ is a mean vector and C is a symmetric covariance matrix. These can be expressed as Equations (1) and (2), and, given these conditions, the BR equation is as Equation (3):
μ   =   [ μ 1 ,   μ 2 , , μ n ] T
C   =   [ σ 1 2 σ 1 σ 2 σ 1 σ 2 σ 2 2   σ 1 σ n σ 2 σ n σ 1 σ n             σ n 2   ]
Y i   =   X i β i   +   ε i ,    i   =   1 ,   2 ,   3 , , n
where Yi = [y1, y2, y3, …, yn]T, Xi = [x1, x2, x3, …, xn]T, and εi = [ε1, ε2, ε3, …, εn]T have a relationship. Additionally, βi is a calculated coefficient of each step, the ordinary least squares (OLS) estimation of β, which can be calculated with the rule of β ^ = (XTX)−1XTY. The GPR method also follows this rule but with a difference, and is presented as Equations (4) and (5):
y   =   f ( x )   +   ε
μ ( x )   =   E [ f ( x ) ]
where the f(x) follows the Gaussian process that f(x) ~ GP(μ(x), k(x, x′)), μ(x) is a mean function, and k(x, x′) is a covariance function. The GPR method is usually based on the function process, which is different from BR method. The covariance function has a relationship between the given data and random variables, and this part is used as a kernel [26,27,28]. The most representative kernel is the squared-exponential (SQEXP), which this study also followed. The kernel is as follows:
k ( x , x )   =   E [ { f ( x ) μ ( x ) } { f ( x ) μ ( x ) } ]

2.4. Root Mean Square Error (RMSE)

RMSE is an index to evaluate the precision of a model. This method is used to estimate the difference between the observed and predicted data [29].
R M S E   =   i   =   1 n ( y ˜ i     y i ) 2 n
where y ˜ i is a predicted value at the ith order, y i is an observed value at the ith order, and n is the number of data.

2.5. Coefficient of Determination (R2)

The coefficient of determination is an important index for evaluating the model precision. If the R2 value is >0.8, the regression model is considered to be reliable [30].
R 2   =   i   =   1 n ( y ˜ i     y ¯ ) 2 i   =   1 n ( y i     y ¯ ) 2
where y ¯ i is an average of the observed data.

2.6. Temperature-Potential Index (TPI)

Indexing method is used in many studies because it is relatively simple and can show clear tendencies or characteristics in ratio form. Liberato et al. [31] studied the self-healing performance of concrete with and without mineral mixtures, and the strength recovery and crack closing were indexed. Solomon et al. [32] studied the effect of nut shell ash on the splitting tensile strength of concrete. Similar to the research of Liberato et al., they classified the component index, after which they evaluated the effects of the components in the nut shell ash.
In this paper, similar to those studies that used indexing methods, the temperature-potential index (TPI) was used for removing the temperature effect from the corrosion potential. The TPI is presented as Equation (9):
T P I   =   a b s ( N o n   c o r r o d e d   G P R     T e m p e r a t u r e   G P R A v e r a g e   o f   n o n   c o r r o d e d   p o t e n t i a l )
TPI value was applied to the absolute value in order to prevent errors and it was multiplied by corrosion potential. The non-corroded GPR is a prediction value of the non-corroded potential at the target temperature of each class. The temperature GPR is a prediction value of measured air temperature potential at the target temperature. Additionally, the average of non-corroded potential is the average value of the non-corroded potential of each class at the target temperature.

3. Results and Discussion

3.1. The Corrosion Potential Result

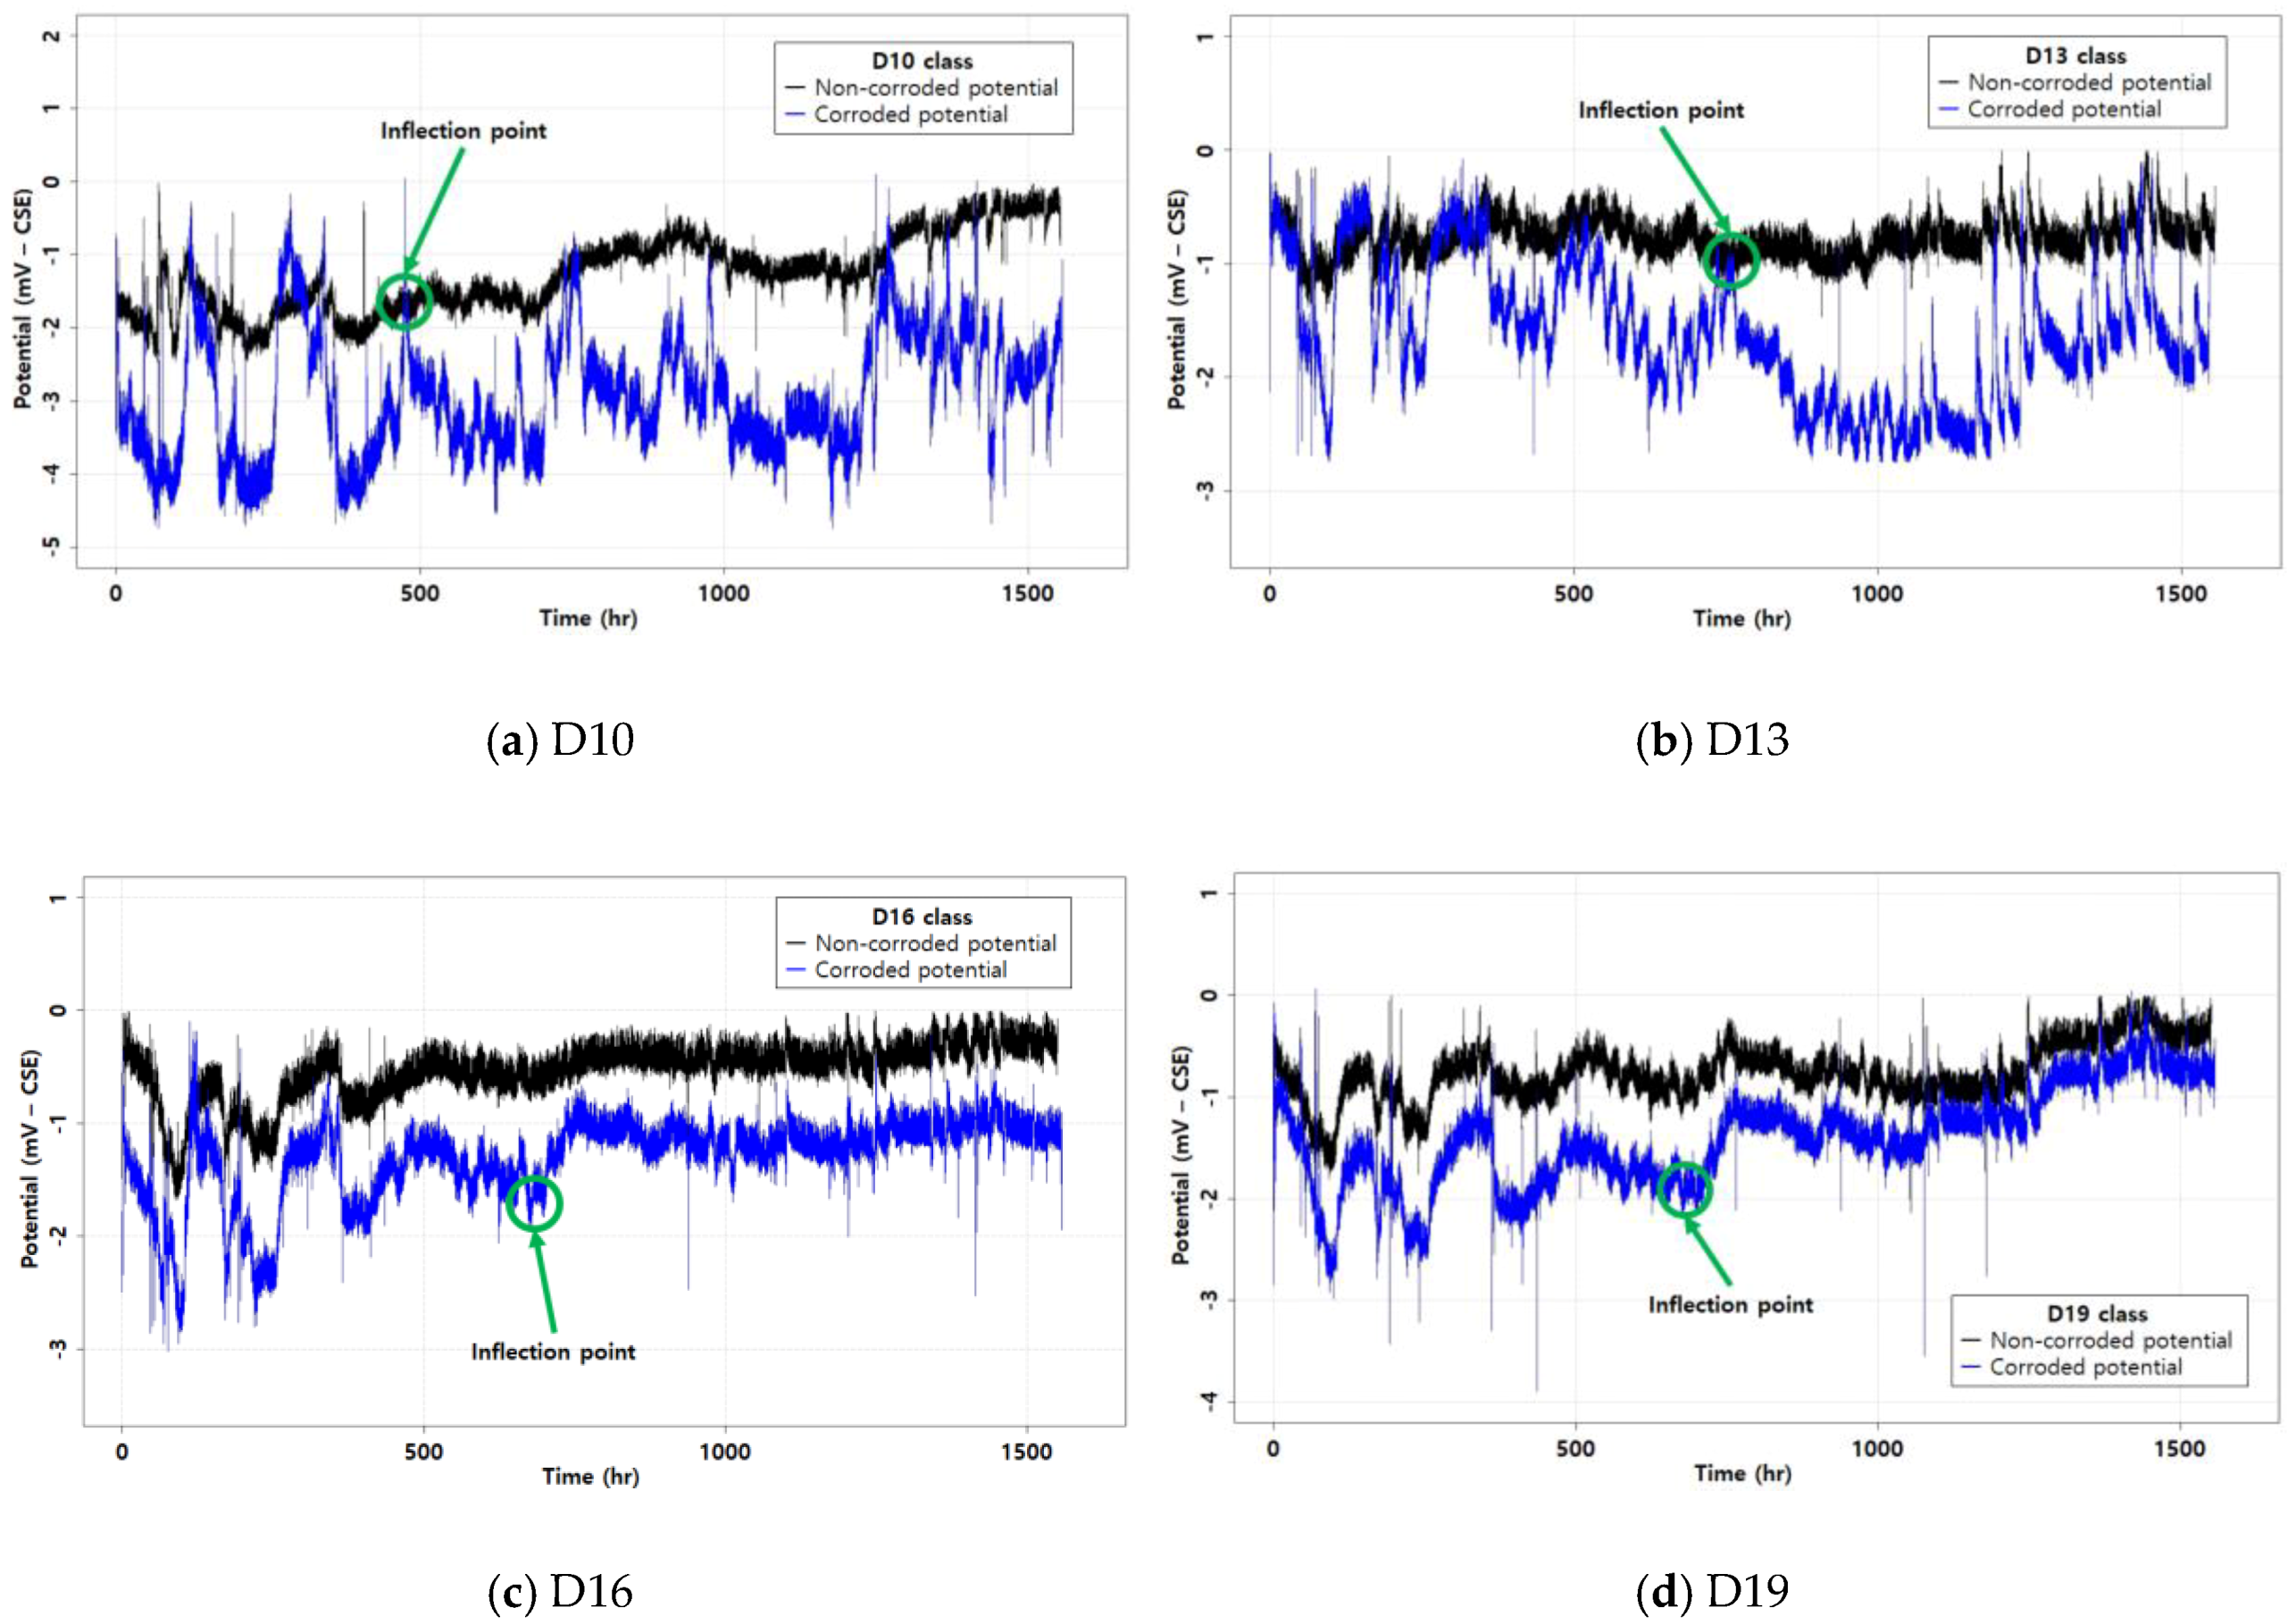
The corrosion potential results are presented in Figure 3. The results showed a relatively smaller potential value than previous studies [16,25,33]. The reason for this is that the corrosion potential uses the principle of the potential difference between embedded rebar in concrete and electrode [34]. The embedded rebar is protected by the passive film from the alkalinity of concrete. Additionally, the alkalinity gives a large difference of the measured potential, and the usual eigenvalue of the potential of rebar is the range of −400 to −700 mV [14]. The specimens of this experiment did not embed in concrete but were only exposed in the air condition. Therefore, the potential of this study came out as a relatively smaller value of potential than other studies because of the absence of alkalinity [16,25,33]. In addition, the case of using only the metal specimens showed small potential [35,36]. Therefore, the results could come out with small values of potentials.
The potentials fluctuated because the specimens were located in an uncontrolled air temperature environment, which affected the specimens in terms of temperature and specimen diameter. The usual results of corrosion potential in a controlled environment show clear linear behavior with few fluctuations [19,33]. Therefore, fluctuations here can be read as a temperature effect.
The behavior of the corrosion potentials was more stable in the D16 and D19 specimens than in D10 and D13, especially after the inflection point. This means that the rebar diameter was also a factor that affected the corrosion potential. The inflection point can be confirmed comparing with the non-corroded and corroded trend (black and blue lines). Usually, the corroded potential followed the trend of non-corroded results. However, the behavior showed an opposite or different trend at a certain point. For example, from Figure 3a, when the non-corroded potential showed an increasing trend but the corroded potential showed a decreasing trend at the inflection point.
Masmoudi et al. [37] showed experimentally that rebars with different diameters have different thermal expansion coefficients. In that study the thermal expansion coefficient was decreased as the diameter increased; hence, the larger specimens were less affected by the temperature because of the thermal coefficient. Therefore, in all of the specimens the temperature effect was evident in the corrosion potential behavior.

3.2. The GPR Result

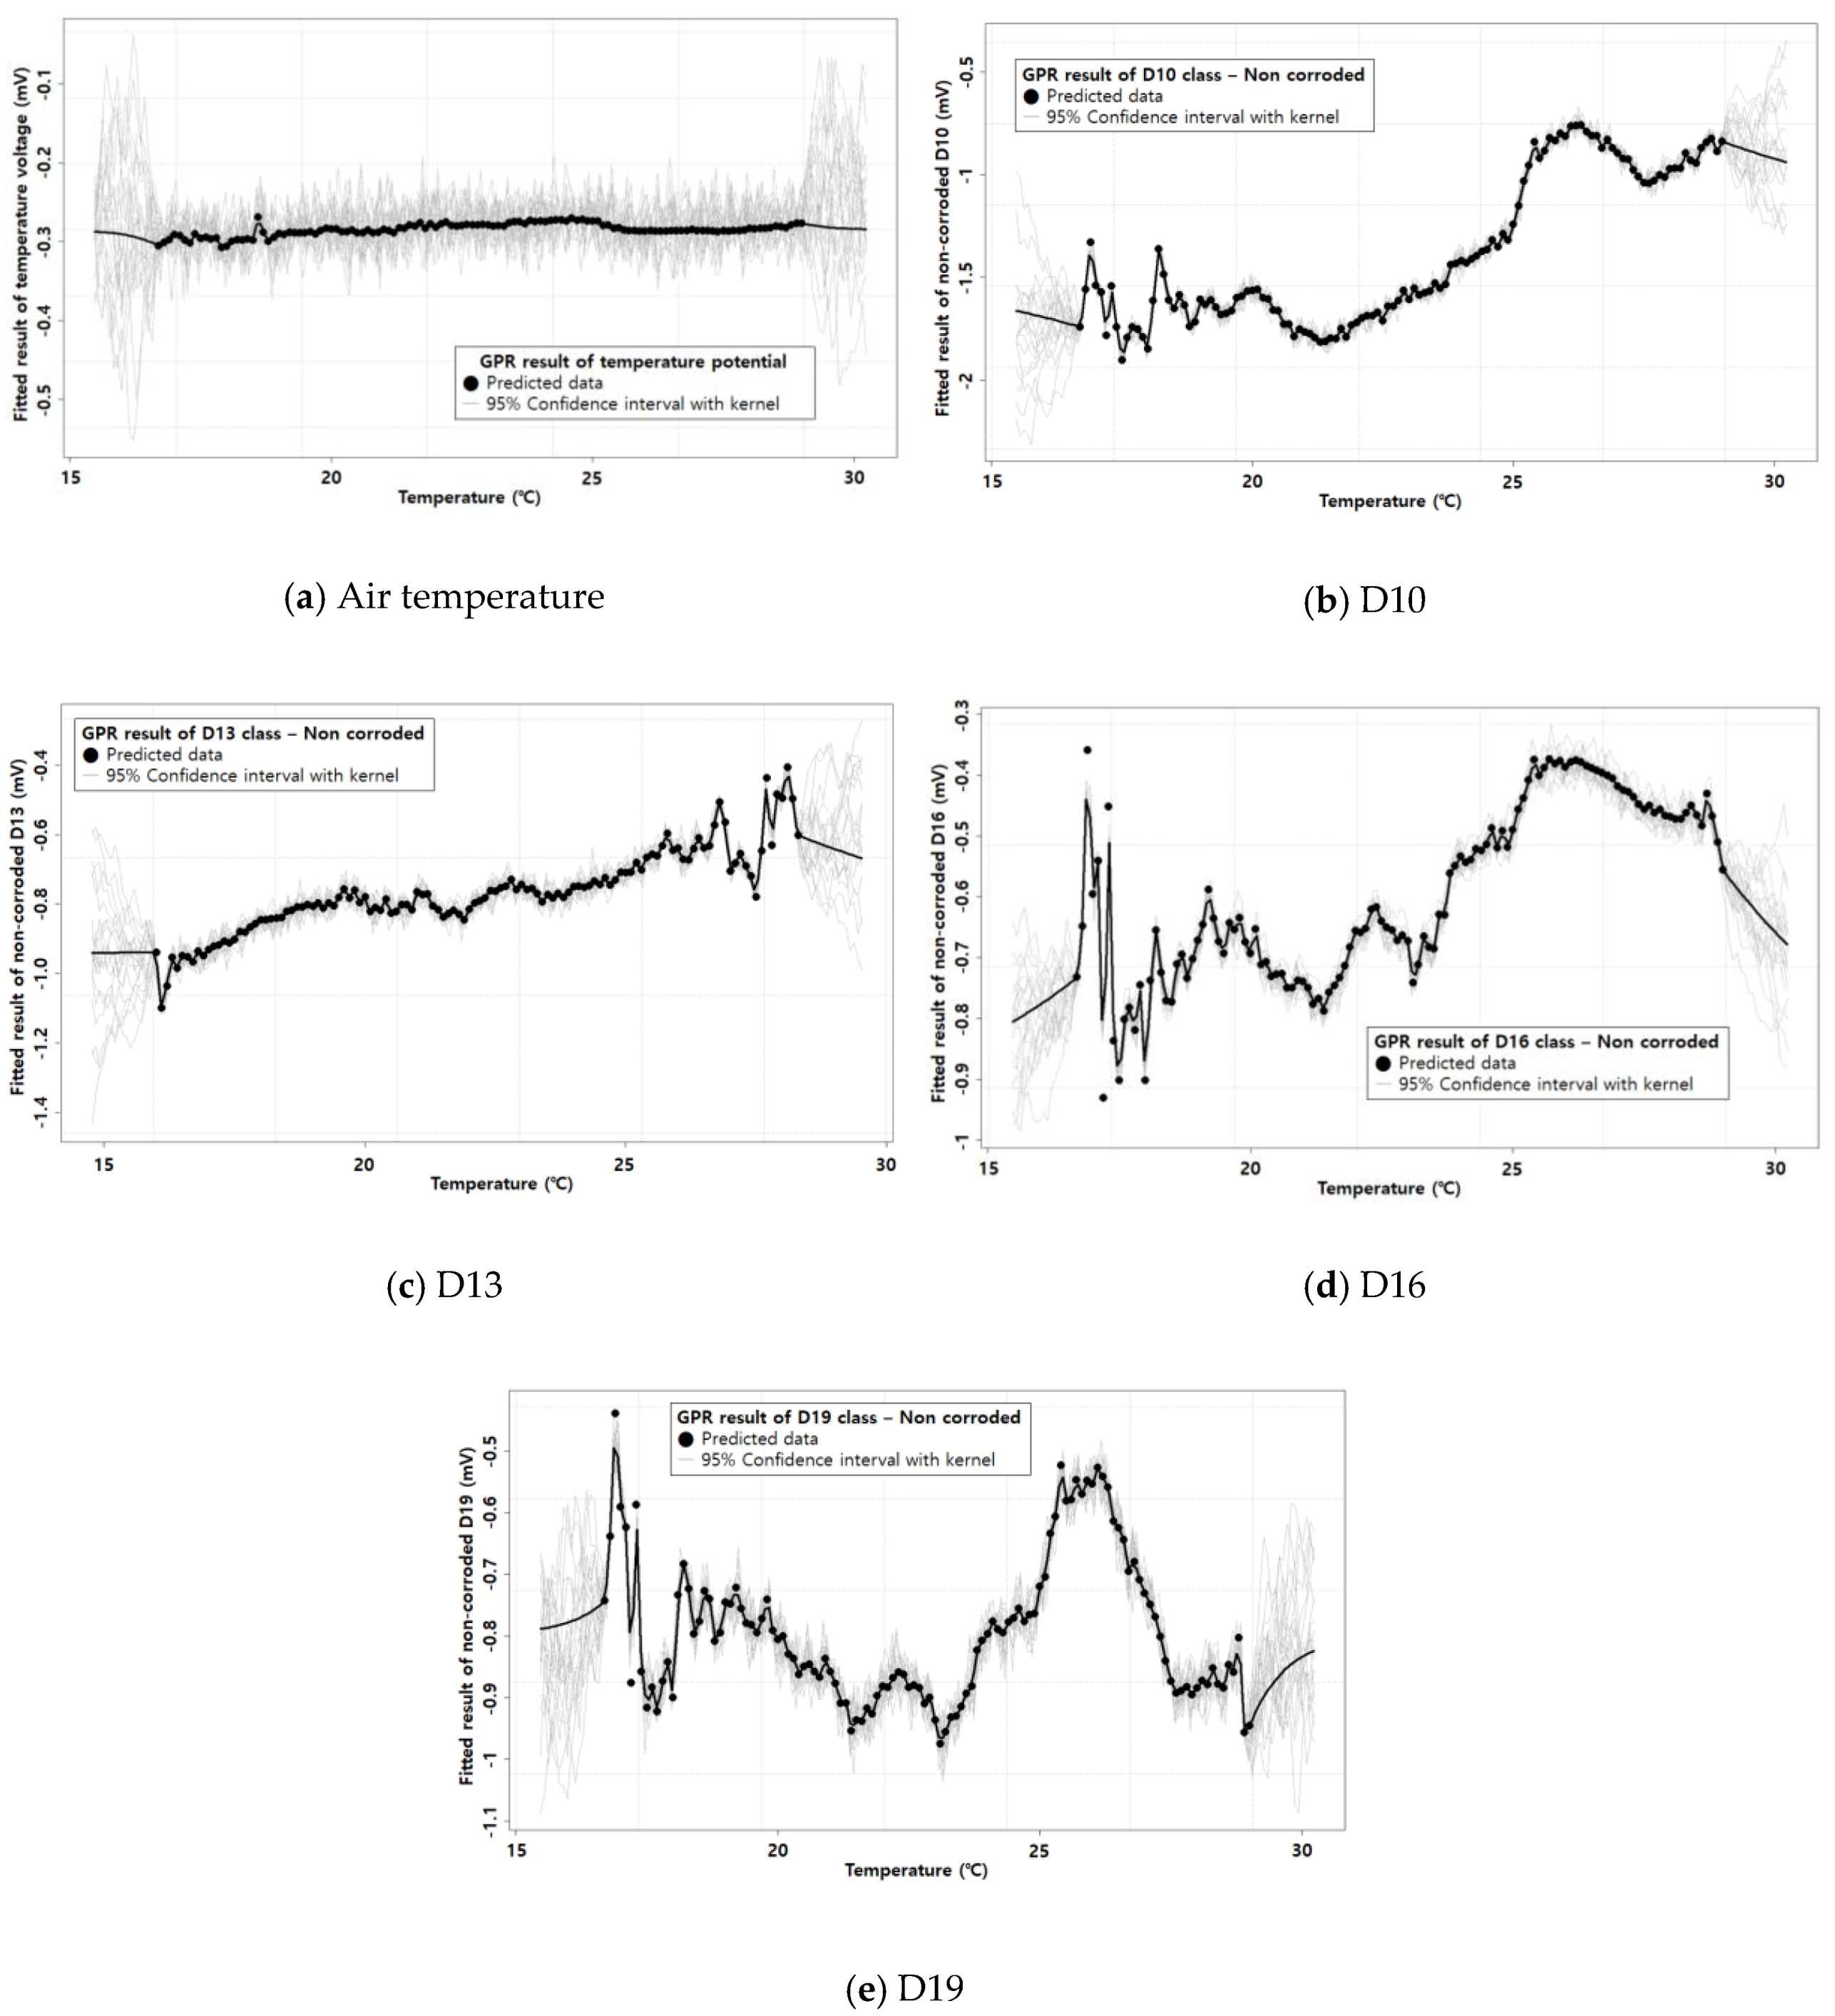
The GPR results are presented in Figure 4. The results of Figure 4 are based on fitting with real data, the fitted lines appeared like Figure 4 when the GPR was applied in real data. The fitted lines indicate the trend of the non-corroded potential data and reflect well the characteristics of the data. The SQEXP kernel is a key function in the GPR, and the 95% confidence intervals in Figure 4 indicate that the kernel worked. Similar works with observational data fitting of the kernel in the applied GPR showed magnificent performance, with high coefficients of determination (above 0.95) [29,38]. The GPR with kernels usually showed the level of ML performance, and these results also showed high agreement with Table 2.
On the basis of these results, the fitting trend flow is presented in Figure 5 and indicates that the GPR results are well fitted. When predicting in the range of temperature, the trend was similar to real data fitting, and the grey areas showed small gaps from the trend line. The grey areas in Figure 5 are the 95% confidence intervals and the dots are the predicted data in the range of the given data [39]. The given data refers to the data used in the GPR fitting. The interval is decreased in the range of the given data and follows the trend line and the predicted data well. However, the interval is widened in the range of ungiven data. Although this is a limitation of the GPR method [26], only the given data was used in this study. Therefore, the fitting trend and intervals are the main elements in the given data we used when evaluating the fitting performance. Hence, the GPR performed well in each case.
For understanding using TPI, Figure 4a indicates how the GPR derives with the real data. Additionally, Figure 5a shows how the GPR fits well with predicted data and 95% confidence interval. When performing the work of removing the temperature effect from corrosion potential, the value of Temperature GPR of TPI is calculated based on this result.

3.3. Removing the Temperature Effect

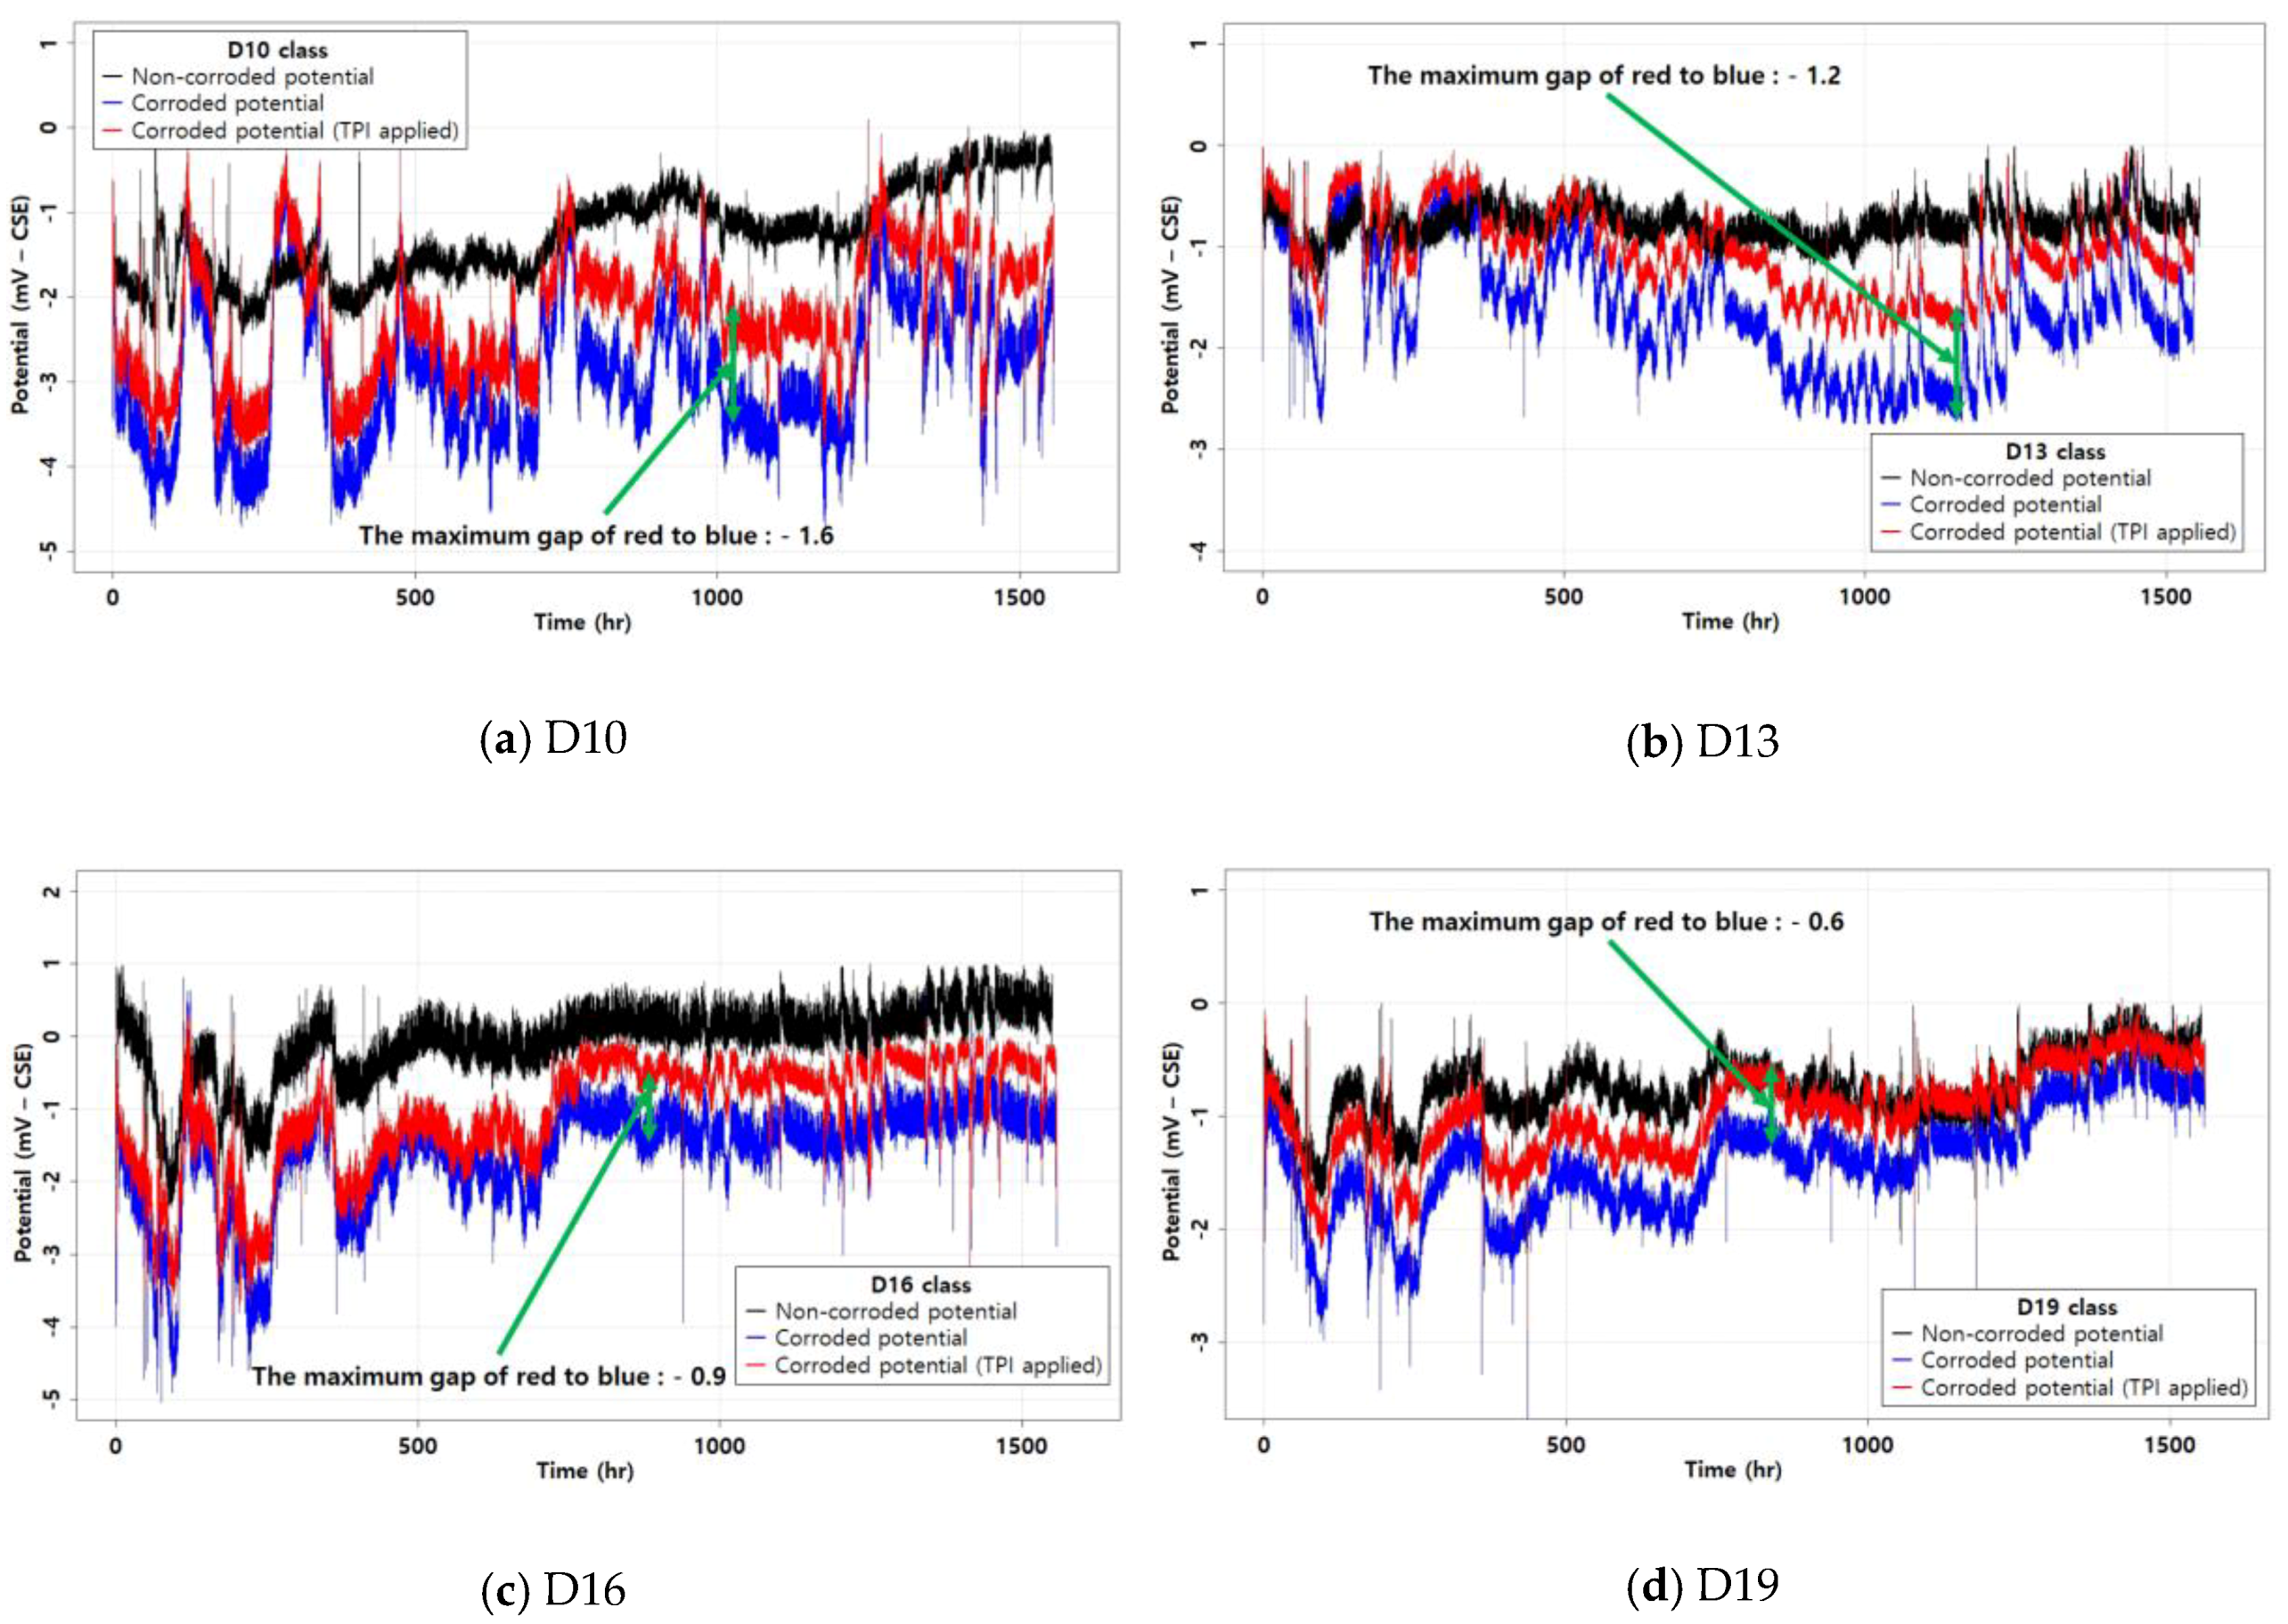
Figure 6 presents the results of removing the temperature effect from the corrosion potential. The red lines in Figure 6 are the results when the TPI was applied. The trend of the corrosion potential was not changed and clearly confirms the behavior of the corrosion potential. After the temperature effect was removed, the diameter effect was clearly confirmed (that the thermal coefficients vary by the diameter of the rebars), as shown in Figure 6. The maximum gap of the red and blue lines shows how much the temperature affected the specimens. The maximum gap was calculated by subtracting each data after the inflection point from the results and found the maximum gap. The maximum gap of red to blue lines increases as the diameter reduces, indicating that the larger specimens were less affected by the temperature because of the thermal effect [37].
Thus, these corrosion potential results reflect the temperature effect. Furthermore, in the case of D19 shown in Figure 6, the corrosion was progressing but at a slower rate than the other specimens. Previous studies indicated that temperature is an important factor in rebar corrosion [14,19], and this study confirmed this with experimental applications of the GPR method. This suggests that GPR could be an appropriate method for analyzing the temperature effect on corrosion potential.

4. Conclusions

In order to remove the temperature effect from the corrosion potential, the GPR method was applied in this study. The corrosion potential was measured within an uncontrolled air temperature environment. The corrosion potential results showed the temperature affected the corrosion potential. Thus, removing the temperature effect from corrosion potential with GPR. The results showed a good performance of GPR. Based on these results, our conclusions are drawn as follows:
  • In the uncontrolled air environment, the corrosion potential was highly sensitive to the environmental conditions. Its fluctuation was evidence of the environmental effects. In particular, because the air temperature was not controlled, the rebars showed that the temperature had an effect on the specimens. In addition, the corrosion potential behavior showed different trends by rebar diameter.
  • It was confirmed that temperature is an important factor for measuring the corrosion potential. This evidence was the behavior of corrosion potential with fluctuation. From these results, temperature has to be considered when measuring the corrosion potential.
  • The GPR with a kernel performed close to the ML with a high R2 value. This confirmed the usability of GPR in corrosion analysis, especially in removing the temperature effect. The derived GPR model was able to produce a reliable R2 and RMSE. Therefore, the GPR method can be appropriate for corrosion analysis considering the temperature effect.

Author Contributions

B.H.W. and J.-S.R. conceived and designed the experiments; B.H.W. and I.K.J. performed the experiments; B.H.W. and J.B.L. analyzed the data; S.S.K. supervised this study; B.H.W. wrote the paper. All authors have read and agreed to the published version of the manuscript.

Funding

This research was funded by the Korea Institute of Energy Technology Evaluation and Planning (KETEP) and the Ministry of Trade, Industry and Energy (MOTIE) of the Republic of Korea (No. 20183010025510).

Conflicts of Interest

The authors declare no conflict of interest.

References

  1. Faroz, S.A.; Pujari, N.N.; Ghosh, S. Reliability of a corroded RC beam based on Bayesian updating of the corrosion model. Eng. Struct. 2016, 126, 457–468. [Google Scholar] [CrossRef]
  2. Chen, D.; Mahadevan, S. Chloride-induced reinforcement corrosion and concrete cracking simulation. Cem. Concr. Compos. 2008, 30, 227–238. [Google Scholar] [CrossRef]
  3. Verma, S.K.; Bhadauria, S.S.; Akhtar, S. Monitoring corrosion of steel bars in reinforced concrete structures. Sci. World J. 2014, 2014, 1–9. [Google Scholar] [CrossRef] [PubMed] [Green Version]
  4. Fan, L.; Tan, X.; Zhang, Q.; Meng, W.; Chen, G.; Bao, Y. Monitoring corrosion of steel bars in reinforced concrete based on helix strains measured from a distributed fiber optic sensor. Eng. Struct. 2020, 204, 110039. [Google Scholar] [CrossRef]
  5. Goyal, A.; Pouya, H.S.; Ganjian, E.; Olubanwo, A.O.; Khorami, M. Predicting the corrosion rate of steel in cathodically protected concrete using potential shift. Constr. Build. Mater. 2019, 194, 344–349. [Google Scholar] [CrossRef]
  6. Joh, S.-H.; Lim, Y.-C.; Ismail, M.; Lee, H.-S. Fundamental Study on Developing Embedded Mini-Sensor for Nondestructive Diagnosis Corrosion of Rebar. J. Korea Inst. Struct. Maint. Insp. 2010, 14, 179–187. [Google Scholar]
  7. Liu, L.; Zheng, D.; Zhou, J.; Yang, J.; Zhang, H. Parameters That Influence Corrosion Detection in Reinforced Concrete Based on Eddy Current Thermography. Adv. Civ. Eng. 2020, 2020, 1–9. [Google Scholar] [CrossRef]
  8. Wang, W.; Lu, C. Time-varying law of rebar corrosion rate in fly ash concrete. J. Hazard. Mater. 2018, 360, 520–528. [Google Scholar] [CrossRef] [PubMed]
  9. Wang, Z.; Yu, J.; Li, G.; Zhang, M.; Leung, C.K. Corrosion behavior of steel rebar embedded in hybrid CNTs-OH/polyvinyl alcohol modified concrete under accelerated chloride attack. Cem. Concr. Compos. 2019, 100, 120–129. [Google Scholar] [CrossRef]
  10. Wasim, M.; Ngo, T.D.; Abid, M. Investigation of long-term corrosion resistance of reinforced concrete structures constructed with various types of concretes in marine and various climate environments. Constr. Build. Mater. 2020, 237, 117701. [Google Scholar] [CrossRef]
  11. Wu, Z.; Yu, H.; Ma, H.; Zhang, J.; Da, B.; Zhu, H. Rebar corrosion in coral aggregate concrete: Determination of chloride threshold by LPR. Corros. Sci. 2020, 163, 108238. [Google Scholar] [CrossRef]
  12. Xu, Q.; Ji, T.; Yang, Z.; Ye, Y. Steel rebar corrosion in artificial reef concrete with sulphoaluminate cement, sea water and marine sand. Constr. Build. Mater. 2019, 227, 116685. [Google Scholar] [CrossRef]
  13. Zou, X.; Schmitt, T.; Perloff, D.; Wu, N.; Yu, T.-Y.; Wang, X. Nondestructive corrosion detection using fiber optic photoacoustic ultrasound generator. Measurement 2015, 62, 74–80. [Google Scholar] [CrossRef]
  14. Jo, G.J. A Study on the Corrosion and Cathodic Protection Monitoring for the Reinforced Concrete Structures with Multi-Functional Sensor. Master’s Thesis, Korea Maritime & Ocean University, Busan, Korea, 2013. [Google Scholar]
  15. Du, C.; Owusu Twumasi, J.; Tang, Q.; Guo, X.; Zhou, J.; Yu, T.; Wang, X. All-optical photoacoustic sensors for steel rebar corrosion monitoring. Sensors 2018, 18, 1353. [Google Scholar] [CrossRef] [PubMed] [Green Version]
  16. Leelalerkiet, V.; Kyung, J.-W.; Ohtsu, M.; Yokota, M. Analysis of half-cell potential measurement for corrosion of reinforced concrete. Constr. Build. Mater. 2004, 18, 155–162. [Google Scholar] [CrossRef]
  17. Roux, S.; Bur, N.; Ferrari, G.; Tribollet, B.; Feugeas, F. Influence of a biopolymer admixture on corrosion behaviour of steel rebars in concrete. Mater. Corros. 2010, 61, 1026–1033. [Google Scholar] [CrossRef]
  18. Pour-Ghaz, M.; Isgor, O.B.; Ghods, P. The effect of temperature on the corrosion of steel in concrete. Part 1: Simulated polarization resistance tests and model development. Corros. Sci. 2009, 51, 415–425. [Google Scholar] [CrossRef]
  19. Deus, J.; Freire, L.; Montemor, M.; Nóvoa, X. The corrosion potential of stainless steel rebars in concrete: Temperature effect. Corros. Sci. 2012, 65, 556–560. [Google Scholar] [CrossRef]
  20. Chen, L.; Su, R.K.L. Effect of high rebar temperature during casting on corrosion in carbonated concrete. Constr. Build. Mater. 2020, 249, 118718. [Google Scholar] [CrossRef]
  21. López, W.; González, J.; Andrade, C. Influence of temperature on the service life of rebars. Cem. Concr. Res. 1993, 23, 1130–1140. [Google Scholar] [CrossRef]
  22. Zhang, S.; Zhou, W.; Qin, H. Inverse Gaussian process-based corrosion growth model for energy pipelines considering the sizing error in inspection data. Corros. Sci. 2013, 73, 309–320. [Google Scholar] [CrossRef]
  23. Liu, Y.; Song, Y.; Keller, J.; Bond, P.; Jiang, G. Prediction of concrete corrosion in sewers with hybrid Gaussian processes regression model. RSC Adv. 2017, 7, 30894–30903. [Google Scholar] [CrossRef] [Green Version]
  24. Muthulingam, S. Space-time Gaussian models for evaluating corrosion-induced damages in reinforcing bars. Sādhanā 2019, 44, 13. [Google Scholar] [CrossRef] [Green Version]
  25. Yodsudjai, W.; Pattarakittam, T. Factors influencing half-cell potential measurement and its relationship with corrosion level. Measurement 2017, 104, 159–168. [Google Scholar] [CrossRef]
  26. Pérez-Cruz, F.; Van Vaerenbergh, S.; Murillo-Fuentes, J.J.; Lázaro-Gredilla, M.; Santamaria, I. Gaussian processes for nonlinear signal processing: An overview of recent advances. IEEE Signal. Process. Mag. 2013, 30, 40–50. [Google Scholar] [CrossRef] [Green Version]
  27. Shi, J.; Wang, B.; Murray-Smith, R.; Titterington, D. Gaussian process functional regression modeling for batch data. Biometrics 2007, 63, 714–723. [Google Scholar] [CrossRef]
  28. Vasudevan, S.; Ramos, F.; Nettleton, E.; Durrant-Whyte, H. Gaussian process modeling of large-scale terrain. J. Field Robot. 2009, 26, 812–840. [Google Scholar] [CrossRef]
  29. Geng, D.; Zhang, H.; Wu, H. Short-Term Wind Speed Prediction Based on Principal Component Analysis and LSTM. Appl. Sci. 2020, 10, 4416. [Google Scholar] [CrossRef]
  30. Song, Y.; Lee, H.; Kim, J.; Park, J.; Park, M. Developing Drought Damage Prediction Equation Considering Economic Indicators and Basic Indicators of Asian Countries. J. Korean Soc. Hazard. Mitig. 2019, 19, 451–461. [Google Scholar] [CrossRef]
  31. Ferrara, L.; Krelani, V.; Carsana, M. A “fracture testing” based approach to assess crack healing of concrete with and without crystalline admixtures. Constr. Build. Mater. 2014, 68, 535–551. [Google Scholar] [CrossRef]
  32. Oyebisi, S.; Igba, T.; Raheem, A.; Olutoge, F. Predicting the splitting tensile strength of concrete incorporating anacardium occidentale nut shell ash using reactivity index concepts and mix design proportions. Case Stud. Constr. Mater. 2020, 19, e00393. [Google Scholar] [CrossRef]
  33. Hussain, R.R. Underwater half-cell corrosion potential bench mark measurements of corroding steel in concrete influenced by a variety of material science and environmental engineering variables. Measurement 2011, 44, 274–280. [Google Scholar] [CrossRef]
  34. Cho, S.-H.; Han, N.; Chung, L. A Study on nondestructive method to measure the corrosion level of reinforcing bar. J. Archit. Inst. Korea 2002, 18, 19–26. [Google Scholar]
  35. Hackerman, N.; Snavely, E. Corrosion Basics: An Introduction; National Association of Corrosion Engineers: Huston, TX, USA, 1984. [Google Scholar]
  36. Caines, S.; Khan, F.; Zhang, Y.; Shirokoff, J. Simplified electrochemical potential noise method to predict corrosion and corrosion rate. J. Loss Prev. Process. Ind. 2017, 47, 72–84. [Google Scholar] [CrossRef]
  37. Masmoudi, R.; Zaidi, A.; Gérard, P. Transverse thermal expansion of FRP bars embedded in concrete. J. Compos. Constr. 2005, 9, 377–387. [Google Scholar] [CrossRef]
  38. Darab, C.; Turcu, A.; Beleiu, H.G.; Pavel, S.; Birou, I.; Micu, D.D.; Ungureanu, S.; Cirstea, S.D. Hybrid Load Forecasting Using Gaussian Process Regression and Novel Residual Prediction. Appl. Sci. 2020, 10, 4588. [Google Scholar] [CrossRef]
  39. Qi, A.; Kang, W.; Zhang, G.; Lei, H. Coal seam thickness prediction based on transition probability of structural elements. Appl. Sci. 2019, 9, 1144. [Google Scholar] [CrossRef] [Green Version]
Figure 1. Research process of removing the temperature effect.
Applsci 10 05937 g001
Figure 2. Experimental setting to measure corrosion potential.
Applsci 10 05937 g002
Figure 3. The corrosion potential results: (a) D10; (b) D13; (c) D16; (d) D19.
Applsci 10 05937 g003
Figure 4. The fitting results: (a) air temperature; (b) D10; (c) D13; (d) D16; (e) D19.
Applsci 10 05937 g004
Figure 5. The fitting trend flow of GPR: (a) air temperature; (b) D10; (c) D13; (d) D16; (e) D19.
Applsci 10 05937 g005
Figure 6. The results of removing the temperature effect: (a) D10; (b) D13; (c) D16; (d) D19.
Applsci 10 05937 g006
Table 1. The composition of the rebar.
FeCSiMnCuNiCr
98.220.310.291.090.020.040.03
Table 2. The Gaussian process regression (GPR) fitting results.
Case β ^ Coefficients of Determination (R2)Root Mean Square Error (RMSE)
Air temperature−5.3850.990.00366
D10−4.4150.970.0570
D13−5.4470.970.0657
D16−5.0480.950.0394
D19−4.6390.960.0502