1. Introduction
In recent years, seismic activities have sharply increased around the world [
1]. The increase in the strength and number of seismic activities requires predicting the seismic performance of structures to ensure their stability during earthquakes [
2,
3,
4]. The seismic performance of a structure depends on the characteristics of ground motion and the structural elements of the structure. Single-degree-of-freedom (SDOF) structures have a relatively small number of factors to account for in the response of the structures in an earthquake [
5]. On the other hand, the seismic response of multi-degree-of-freedom (MDOF) structures, which are composed of various structural elements, cannot be easily evaluated. This is because MDOF structures are not dominated by a specific factor in seismic analysis [
6,
7]. Furthermore, the nonlinear behavior of materials and components, which would occur under an earthquake load, makes predicting the seismic response of MDOF structures more difficult [
8]. The seismic response of a structure is also affected by the characteristics of ground motion [
9,
10]. Therefore, for bridges composed of various structural components, such as piers, bearings, and girders, this study examined the effects of ground motion and aspect ratio on the seismic performance of a bridge structure.
Ground motions can be divided into near-fault and far-fault ground motions, depending on the distance from the epicenter and the characteristics of each ground motion. Recent studies have analyzed the effects of near-fault ground motion on architectural and civil structures, such as nuclear power plants, dams, bridges, and buildings [
11,
12,
13,
14]. Near-fault ground motion generally shows strong and narrow-band pulses for a short period in spectral accelerations [
15,
16,
17]. Therefore, structures with a short period of vibration are mostly affected by near-fault ground motion [
18,
19]. On the other hand, far-fault ground motion, which has long-period characteristics and relatively small response pulses as it travels over long distances, influences structures with a long natural period [
20,
21]. Therefore, this study evaluated the effects of near-fault and far-fault ground motions on the seismic performance of bridge structures. In particular, near-fault ground motions were selected to have the characteristics of forward directivity and fling step. A total of 14 ground motions were involved in the study (i.e., seven seismic waves for each ground motion based on recent ground activities).
In addition to seismic ground motions, the seismic behavior of bridge structures is significantly affected by the height of the bridge [
22]. That is, the bridge column is one of the most vulnerable parts of a bridge when subjected to ground motion, which requires accurate modeling and seismic analysis [
23]. The height of a pier can be defined as the aspect ratio of the pier, which is the ratio of the length of the pier to the diameter of the cross section. In the design process of a bridge, shear and flexural failures are strongly dependent on the aspect ratio of the pier. In general, as the aspect ratio increases, the failure of a bridge changes from shear to bending mode. The seismic performance of the entire bridge can also be affected by the aspect ratio of the pier [
24]. Some recent studies [
25,
26] analyzed the effect of the aspect ratio of a pier on the seismic response of a bridge and showed that the displacement and shear force of the pier increased with an increasing aspect ratio but decreased after a certain aspect ratio. Studies on seismic response with respect to aspect ratio in a bridge system are still limited. Therefore, various aspect ratios of piers were considered to investigate the seismic behavior of a structural bridge system under near-fault and far-fault ground motions. The bridge considered in the study is a prestressed concrete (PSC) I-type bridge. Numerical modeling was performed using detailed drawings of a real bridge. The analysis accounted for nonlinear materials and the behavior of the bridge.
2. Near-Fault and Far-Fault Ground Motions
2.1. Collection of Ground Motions
This study collected actual near-fault and far-fault ground motions from the NGA-West2 (Next Generation Attenuation-West2) database of the PEER Center (Pacific Earthquake Engineering Research Center) and KIK-net (Kiban Kyoshin network) for the nonlinear dynamic analysis of bridges [
27,
28].
Table 1 and
Table 2 summarize the information on a total of seven near-fault and far-fault ground motions, respectively, to use the actual ground motions. Near-fault and far-fault ground motions were basically classified according to the distance from the epicenter: less than 10 km for the near-fault ground motion and 90 km or more for the far-fault ground motion [
29,
30]. When selecting the ground motions, the magnitude and shear wave velocity were based on the ground and rock conditions of the target site of this study. Therefore, the ground motions measured at the station were defined to have a magnitude ranging from around 5 to 8 M and a shear wave velocity higher than 600 m/s. In particular, near-fault ground motions were selected by accounting for forward-directivity and fling-step characteristics that can cause severe damage to structures [
31].
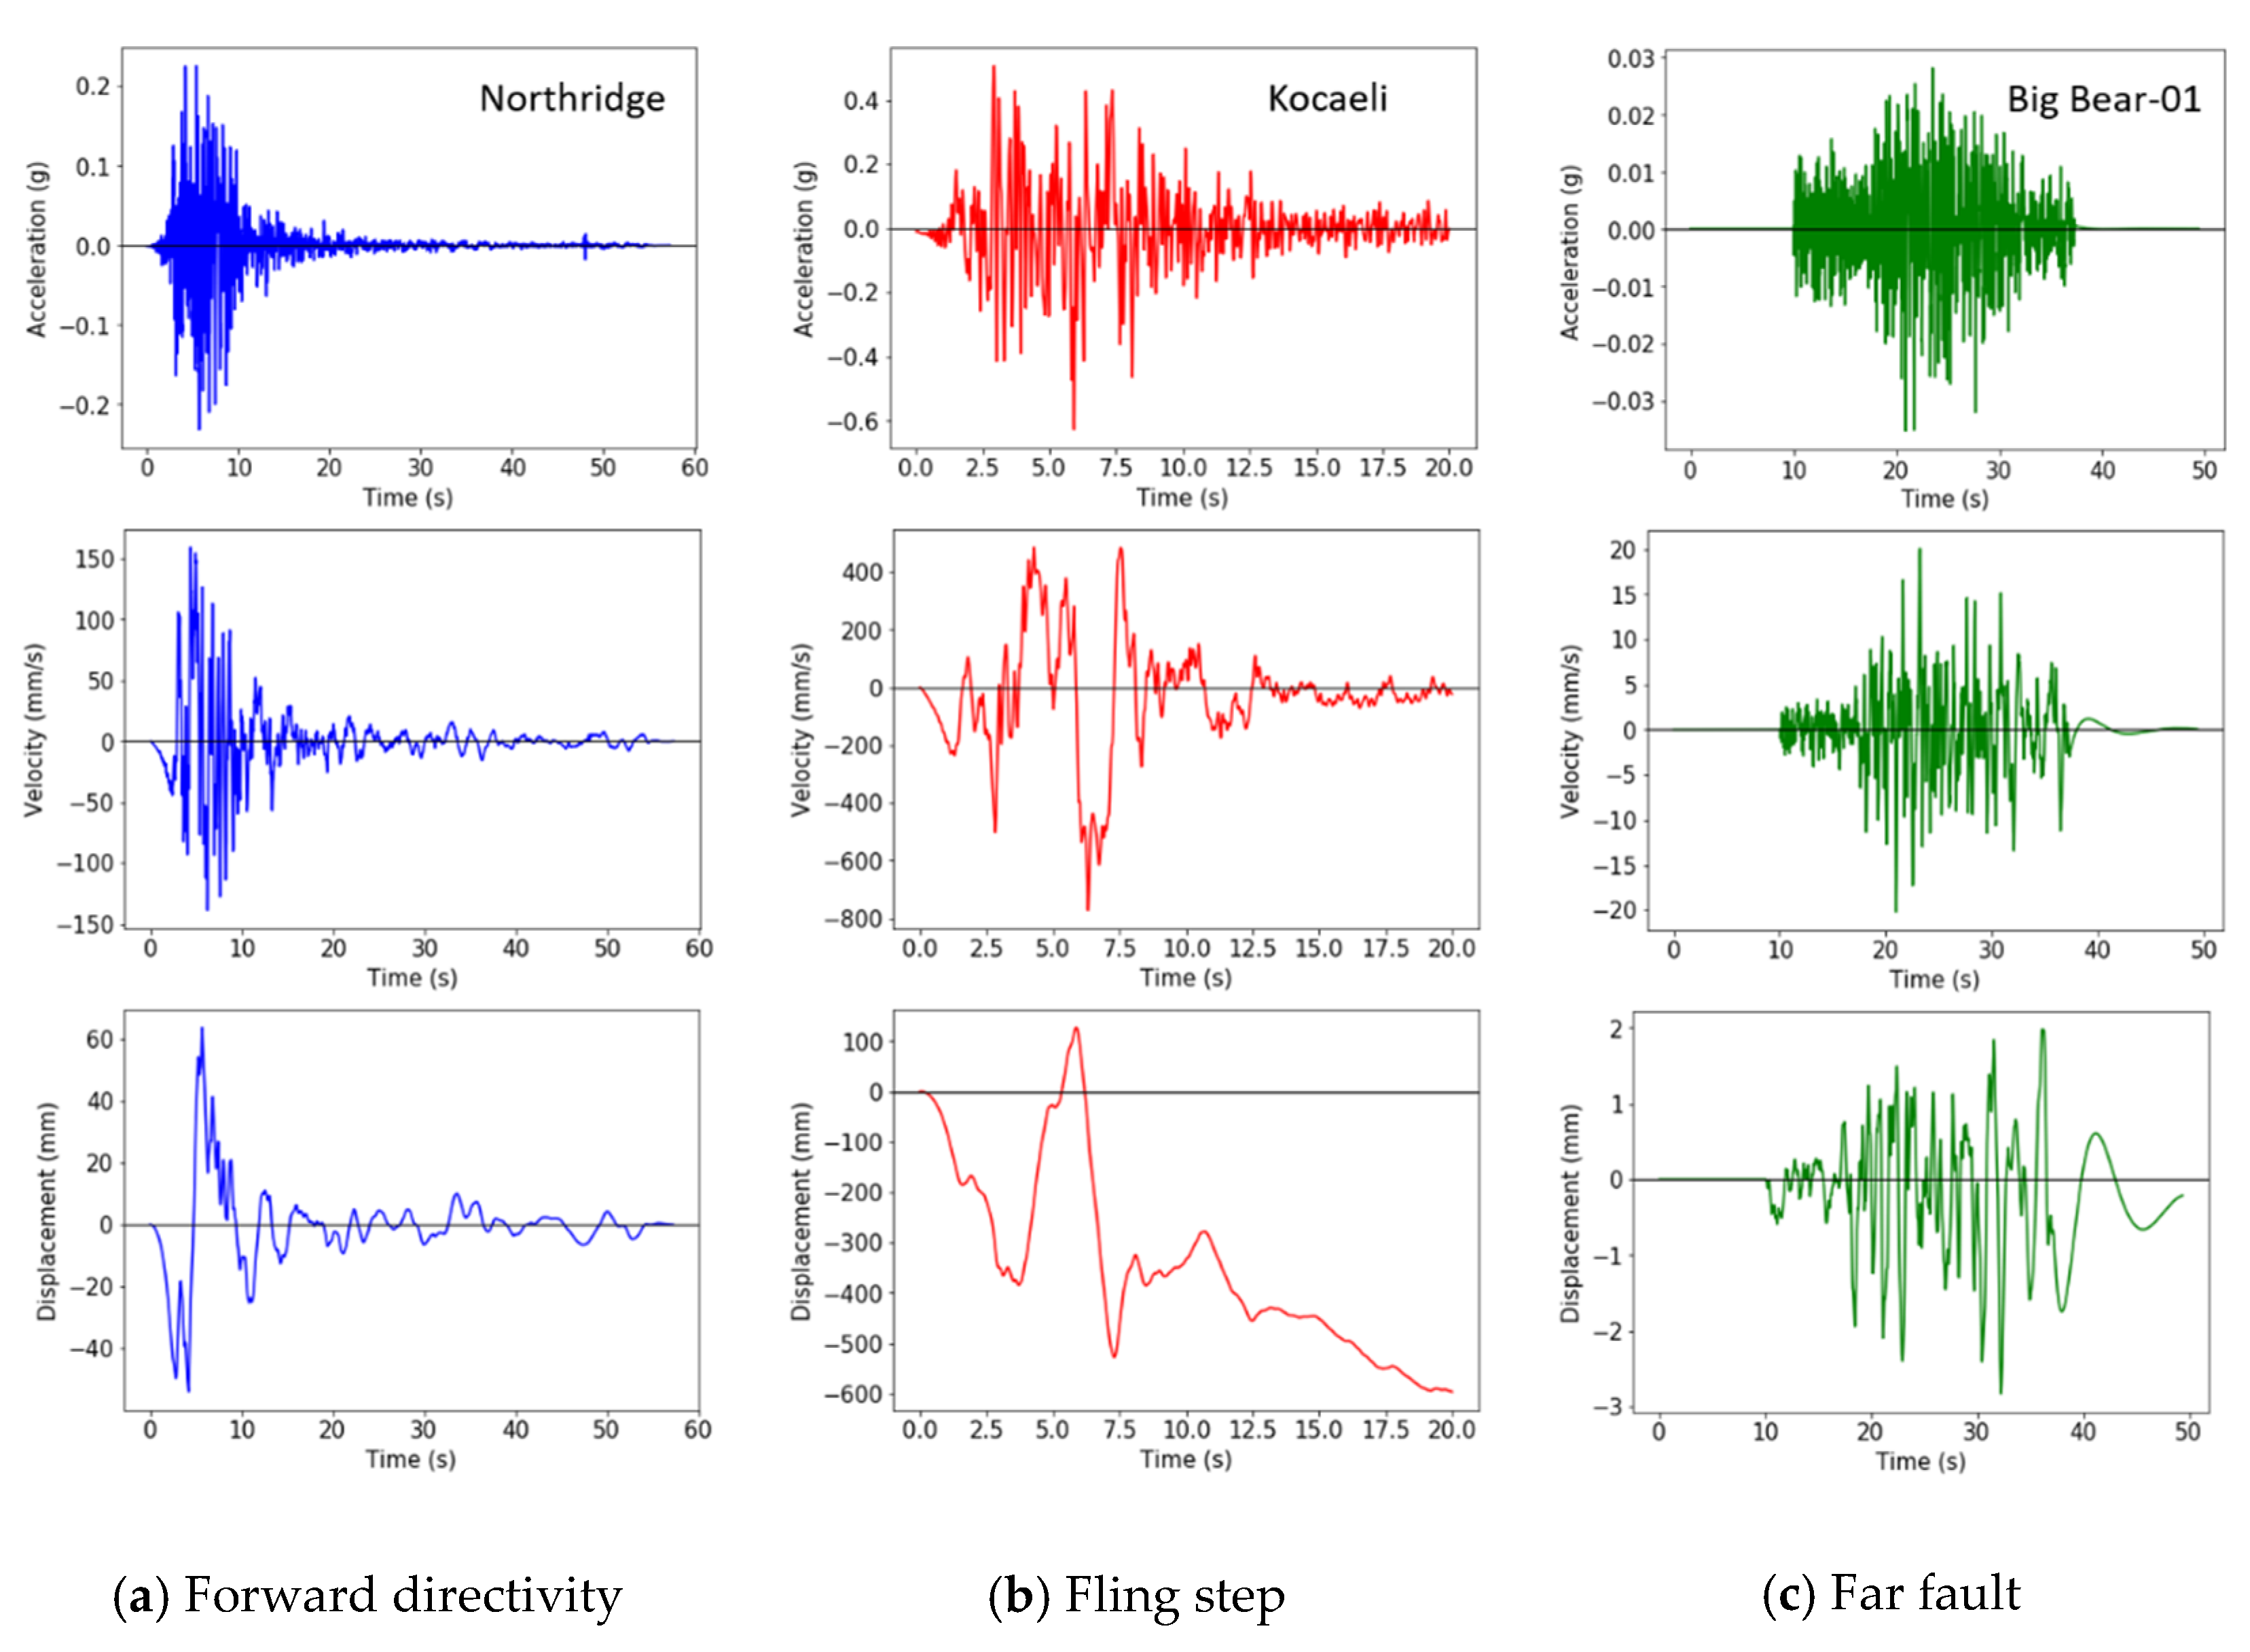
The forward-directivity effect is generated by the velocity of a fault rupture, which is similar to the velocity of shear wave propagation. Forward directivity produces ground motion with a short duration and large amplitude. Fling step occurs due to permanent deformation of the ground induced by the structural transformation of the fault rupture during seismic activity. The fling-step effect generates a large velocity amplitude on one side, which shows monotonic behavior in the displacement time history [
32].
Figure 1 shows the recorded time histories of the near-fault and far-fault ground motions. Compared with the far-fault ground motion, the near-fault ground motion with forward directivity shows a high amplitude up to approximately 150 m/s in a short duration, as shown in
Figure 1a. The fling-step ground motion produces a maximum displacement of approximately 600 mm and a permanent displacement movement to the negative side of the displacement time history, as shown in
Figure 1b.
2.2. Ground Motions with Soil Conditions
The selected ground motions were revised to match the design response spectrum in the entire period. In this study, spectrum matching was performed for a period of 0.02 to 10 s using the algorithm of Alatik and Abrahamson [
33]. Ground response analysis was then performed according to the site condition of a target bridge to revise the ground motions. The local site condition is essential in the seismic response of a structure.
Table 3 lists the site classifications specified in several main design standards: EC 8 (Eurocode 8) [
34], UBC 97 (Uniform Building Code) [
35], KDS (Korean Design Standard) [
36], and RPA 99/2003 (Regles Parasismiques Algeriennes) [
37]. Eurocode 8 and UBC 97 define the site classifications based on the shear wave velocity averaged at a bedrock depth of 30 m (V
s30). KDS and RPA 99/2003 use the shear wave velocity (V
s) in the range of bedrock depths (H) from 10 to 20 m to define the site classifications.
The target site of this study is a shallow and hard ground area with a bedrock depth of approximately 17 m and a shear wave velocity higher than 260 m/s. The Eurocode 8 and UBC 97 standards classify the target site as soil type C and RPA 99/2003 as S3. According to KDS, which accounts for both the bedrock depth and shear wave velocity, the target site was included in the S2 type. Based on the site conditions defined from the shear wave velocity of the actual ground, nonlinear ground response analysis was performed to generate near-fault and far-fault artificial ground motions [
38,
39,
40]. The dynamic properties of the soil used in the ground response analysis involved the unit weight, plasticity index, and shear wave velocity. The property values were determined by the shear wave velocity corresponding to the site classification.
Figure 2 shows the response spectrum obtained from the nonlinear ground response analysis according to the amplification of ground motions. The near-fault ground motions included a relatively low-frequency range compared with the far-fault ground motions, but no significant differences were found. The peak values of the response spectrum were approximately 5 to 15 Hz in the near-fault ground motions and 10 to 20 Hz in the far-fault ground motions. The acceleration of the ground motions was rapidly reduced to maintain an almost constant value with increasing frequency after the peak value.
3. Configuration and Numerical Modeling of the Bridge
3.1. Bridge Configuration and Design
This study selected a constructed PSC bridge widely used in the practical field.
Figure 3 and
Figure 4 show the side view of a 5-span PSC I-girder bridge and the detailed cross section of the bridge and columns, respectively. The bridge column is supported by the pile foundation, and the superstructure of the bridge is supported by a rubber bearing installed on the columns.
The span length of the bridge was designed to be 30 m, and thus the total length of the bridge was 150 m. The abutment at both ends of the bridge was 8 m in height. All the piers of the bridge were 10 m long with a circular cross section that was 2.3 m in diameter. Longitudinal reinforcement of the pier was designed by a total of 105 D13 rebars installed in the two lines, as shown in
Figure 4. A transverse stirrup was installed using D16 rebars at an interval of 300 mm. According to the structural drawing, the concrete compressive strengths of the superstructure and pier were designed to be 27 MPa and 24 MPa, respectively. The yield strength of the longitudinal and transverse reinforcements was 300 MPa.
3.2. Numerical Modeling for the Bridge
Nonlinear numerical simulation of the bridge was carried out using the OpenSees program [
41]. The superstructure was expected to be within the elastic range due to earthquakes and was modeled using elastic elements. The pier of the bridge system, which is the main structural element that resists an earthquake load, was composed of reinforced concrete with longitudinal and transverse steel bars. Therefore, nonlinear fiber elements were used to account for the cracking of concrete and the yielding of bars. The rubber bearing was used to model an elastic-perfectly-plastic behavior using spring elements to consider the inelasticity of the bearing material. The pile foundation was modeled as a fixed boundary condition at the bottom of the piers.
Figure 5 presents the numerical modeling of the bridge components used in the study.
The height of the pier varied from 5 to 25 m to examine the effects of the aspect ratio of the pier. The ratio of the longitudinal reinforcement was set to 1.17% based on the value designed in the actual bridge. The unconfined and confined concrete material properties were designed using the model proposed by Mander et al. [
42]. The steel material was designed according to the bilinear model proposed by Menegotto et al. [
43] in the tension and compression, and the effect of low-cycle fatigue and bucking of rebars was not considered in the study.
Figure 6 shows the stress–strain curves of concrete and steel.
4. Nonlinear Static Analysis
To evaluate the seismic behavior of the bridge, pushover analysis, or nonlinear static analysis, was first performed to assess the capacity of the pier. The bottom of the pier, in which a plastic hinge could occur due to ground motion, was subdivided into fine elements. The yield and ultimate displacement capacities were then derived from the shear force and displacement curve obtained from the pushover analysis for each pier.
In general, the yield displacement of a pier can be determined using either the equivalent energy or effective stiffness approximation method [
44,
45,
46]. The equivalent energy approximation method generates a bilinear energy capacity curve from the shear force and displacement relationship and then determines the intersection of the bilinear curve, at which the energy capacity becomes equal at each part of the bilinear curve, as the yield displacement of the pier. The effective stiffness approximation method defines the yield displacement using the bilinear force and displacement curve obtained using the initial and post-yielding stiffness. The initial stiffness is defined as 0.6 times the effective yield load. The yield displacement is defined by intersecting the lines of the initial stiffness and ultimate load, which balance the area of the force and displacement before and after the yield point.
In this study, the effective stiffness approximation method was used to obtain the yield displacement of the piers. The ultimate displacement is usually defined at a point where a 15% reduction in the force capacity occurs in the force–displacement relationship. When the force reduction was insufficient, a 15% decrease in stress in the critical section of a pier was used to define the ultimate displacement using the strain corresponding to the stress reduction.
Table 4 lists the yield and ultimate displacements for each pier according to the pushover analysis results. The yield and ultimate displacements increased, and the shear force decreased with increasing height of the pier. The increase in the yield displacement could be mainly attributed to the decrease in the initial stiffness of the pier. The increase in the ultimate displacement was due to the increase in the corresponding displacement to the constant stress–strain relationship of the material.
5. Modal Analysis of Bridge
Modal analysis was performed to analyze the natural frequencies and mode shapes of the bridge.
Figure 7 shows the mode shapes of the bridge obtained from the modal analysis. The first and second modes appeared in the bending shapes in the transverse direction, and the third mode appeared when bending in the vertical direction. The natural frequency tends to decrease with increasing pier height, as shown in
Figure 8. In the first and second modes, the natural frequencies of the bridge significantly decreased with increasing height to 15 m. At a pier height higher than 15 m, little change in the natural frequency was found. The natural frequency of the third mode was almost constant, irrespective of the increase in the pier height. This indicates that the natural frequencies of the first and second modes of the bridge were largely affected by the change in structural configuration, but those of the third mode were not observed.
6. Seismic Response Characteristics by Nonlinear Dynamic Analyses
6.1. Displacement and Moment of the Bridge
Nonlinear dynamic analysis was performed to analyze the variations in the displacement and moment of a bridge with a height of 10 m.
Figure 9 shows the variations in the lateral displacements at the top of each pier due to an earthquake. Displacements in piers located inside the bridge were approximately 1.4 times as large as those in piers at both ends of the bridge. The variations in the displacement of a bridge were evaluated according to the aspect ratio of the bridge and ground motion based on the displacements at the top of the inside piers.
Figure 10 shows the variations in the moments along the length of the pier. Similar to the discussion on the displacement, the moments at the inside piers were approximately 1.5 times as large as those at the outside piers. The maximum moment occurred at the bottom of the piers and was approximately 18 times larger than the moments at the top of the piers. Therefore, the effects of the change in the aspect ratio and ground motion on the moment of the bridge were analyzed using the moment at the bottom of the pier.
6.2. Analysis of Maximum Displacement
This study evaluated the effects of the bridge height on the maximum displacement of the bridge and the displacement spectrum of the ground motion.
Figure 11 and
Figure 12 show the relationship of the maximum displacement and displacement spectrum according to the height of a bridge for near-fault and far-fault ground motions, respectively. The displacement of the bridge due to earthquakes showed a similar tendency of an increase or decrease with the displacement spectrum as the aspect ratio of the bridge increased. In particular, for a 5 m high bridge, little difference was found between the maximum displacement and displacement response. This indicates that when the height of a bridge is low, the type of ground motion dominates the seismic behavior of the bridge. As the height of a bridge increased, however, the maximum displacement became larger than the spectral response. This is because a real bridge composed of various structural and non-structural elements has a much larger mass and higher complexity than the structure assumed in spectral analysis.
The maximum displacement was also compared with the yield displacement capacity of the bridge obtained from the nonlinear static analysis of the pier. When subjected to near-fault ground motion with a forward-directivity characteristic, the bridge with a low height of 5 m exhibited a maximum displacement of 17.72 mm, which was approximately 80.6% of the yield displacement capacity of 22.0 mm. For bridges higher than 5 m, the maximum displacements were within 67.4% of the yield displacement. On the other hand, the maximum displacement of the bridge under the fling-step near-fault ground motions reached up to approximately 154.3% of the yield displacement capacity for the 5 m high bridge. The results of the study show that the maximum displacement response of the bridge due to the near-fault ground motion with the fling-step effect was close to or larger than the yield displacement capacity but lower than the ultimate displacement capacity.
The far-fault ground motion produced relatively lower displacements than the near-fault ground motion. The maximum displacement of a 10 m high bridge, which showed the highest value among the bridges, was 19.79 mm, which is approximately 22.5% of the yield displacement capacity. For other heights, the maximum lateral displacement was within 17.2% of the yield displacement. In general, the bridge showed more significant displacement when subjected to the near-fault ground motion. However, the far-fault ground motion EQ3_FF with a very low PGA (Peak Ground Acceleration) of 0.08 g generated the highest maximum displacement of 67 mm for the bridge with a height of 20 m. This is because the bridge and EQ3_FF were similarly in the low-frequency range. These results indicate that the displacement response of a bridge is affected by the frequency characteristics of both the ground motion and structural system.
6.3. Analysis of Maximum Moment
Figure 13 shows the variation in the maximum moment as the height of the bridge increases. The maximum moment was more significant when the bridge was subjected to near-fault ground motion than when subjected to far-fault ground motion. In particular, as discussed regarding the maximum displacement, near-fault ground motion with the flip-step effect showed a maximum moment larger than those with the forward-directivity effect. A maximum moment of approximately 26,600 kN·m occurred when the bridge with a height of 5 m was subjected to the EQ7_NF near-fault ground motion with the fling-step effect. For high, tall bridges, the fling-step near-fault ground motion also produced relatively high values of the maximum moment ranging from approximately 17,500 to 25,000 kN·m. On the other hand, when the bridge was subjected to far-fault ground motion, the largest maximum moment was approximately 7600 kN·m at the bridge with a height of 20 m. The maximum moment of a bridge subjected to the forward-directional ground motion tended to decrease with increasing bridge height. That is, in the case of far-fault ground motion and near-fault ground motion with the fling-step effect, the decreasing trend of the maximum moment with increasing bridge height was indistinct. Furthermore, the ground motion with the fling-step effect remained a high maximum moment, barely affected by the bridge height.
For a bridge, the maximum moment could have a relationship with the maximum displacement. However, considering the changes in structural configuration and ground motion, the moment is barely related to the displacement response of the structure alone. Therefore, this study proposed the non-dimensional dynamic response ratio (
DR), which is defined as the ratio of the maximum dynamic response and the yield displacement of a bridge, to accurately analyze the tendency of the maximum moment occurring in a bridge according to the change in bridge height:
where
is the maximum displacement response of a bridge for each ground motion, and
is the yield displacement of a pier with different heights, as defined in
Section 6.1.
Figure 14 presents a scatter plot of the maximum moment and
DR for all the bridges under both the near-fault and far-fault ground motions. When subjected to far-fault ground motions, the bridges showed the maximum moment within approximately 25% of the
DR. In the case of near-fault ground motions with forward directivity, the maximum moment reached as much as approximately 80% of the
DR. In particular, some near-fault ground motions with the fling-step effect were shown to be larger than 80% of the
DR. A
DR higher than 100% means that the displacement response exceeds the yield displacement capacity of the bridge, resulting in the yielding of the bridge under an earthquake. The maximum moment tends to increase as the
DR increases, but the rate of increase in the maximum moment decreases when the
DR exceeds approximately 80%. According to a regression analysis, curve fitting showed a very good relationship between the maximum moment and the
DR with a correlation coefficient (R-value) of 0.99. The
DR proposed in this study showed a very good estimation of the maximum moment of a bridge, which was difficult to predict using only the maximum displacement response.
6.4. Analysis of the Variations of the Natural Frequency
This study also evaluated the changes in the natural frequency of bridges before and after ground motions. The natural frequency of the bridge tended to decrease in some ground motions but did not change in other ground motions. The decrease in the natural frequency was larger at near-fault motions than at far-fault ground motions. Forward-directional near-fault ground motion decreased the natural frequency by approximately 32.8%. For near-fault ground motions with the fling-step effect, the decrease in the natural frequency of the bridge ranged from approximately 9.6 to 41.0%. The far-fault ground motion showed a minimal decrease in the natural frequency of approximately 3.4 to 5.3% only when an EQ3_FF earthquake occurred. Therefore, the proposed DR was used to assess the relationship between the characteristics of ground motion and the decrease in the natural frequency of the bridge.
Figure 15 plots the reduction of the natural frequency in terms of
DR. Both the near-fault and far-fault ground motions showed no decrease in the natural frequency when the
DR of the bridge was less than 12.5%. Therefore, this study investigated the relationship between the
DR and the decrease in the natural frequency for a
DR larger than 12.5%. Linear regression analysis showed that the decrease in the natural frequency was associated with the increase in the
DR, as shown in
Figure 15. Compared with the far-fault ground motion, the near-fault ground motion with forward-directivity and fling-step pulses significantly increased the DR and reduced the natural frequency. The linear regression line shows a relatively larger dispersion in the near-fault ground motion than in the far-fault ground motion, as shown in
Figure 15. The rate of decrease in the natural frequency due to the far-fault ground motions was similar to that due to the near-fault ground motions. The rate of decrease in the natural frequency was approximately 2.25% for the near-fault ground motions and 2.54% for the far-fault ground motions as the
DR increased.
7. Conclusions
This study examined the effects of the aspect ratios of a bridge and the characteristics of ground motion on the seismic response of a bridge. For this, nonlinear static analysis, or pushover analysis, was first performed to derive the shear force and displacement relationship of piers and evaluate the yield and ultimate displacement capacities. The yield displacement was determined using the effective stiffness approximation method, and the ultimate displacement was determined from a strain value corresponding to a 15% decrease in stress in the critical section of the pier. The initial stiffness of the pier decreased with a decreasing aspect ratio, which resulted in a decrease in the yield displacement capacity and an increase in the maximum shear force capacity. The ultimate displacement, determined from a constant strain of the confined concrete, increased with an increasing aspect ratio of the pier.
The maximum displacement of the bridge was compared with the displacement spectrum according to the bridge height and ground motion. As the aspect ratio of the pier increased, the tendency of an increase or decrease in the maximum displacement of the bridge was similar to that of the displacement spectrum. This indicates that the displacement response would be affected mainly by the characteristics of ground motion. However, the rate of increase or decrease in the displacement response was larger than that of the response spectrum. Some differences between the maximum displacement and displacement spectrum could be attributed to the effects of the aspect ratio of the bridge.
Compared with the displacement capacity of the bridge, far-fault ground motion produced the maximum displacement within approximately 22.5% of the yield displacement capacity. On the other hand, when subjected to near-fault ground motion with the forward-directional pulse, the maximum displacement response was within 80.6% of the yield displacement capacity. Fling-step near-fault ground motion significantly increased the maximum displacement of the bridge, which was close to or larger than the yield displacement capacity.
For the maximum moment response of the bridge, this study proposed the dynamic response ratio (DR), which is defined as the ratio of the maximum displacement to the yield displacement capacity. The maximum moment of the bridge tends to increase as the DR increases, but the rate of increase in the maximum moment decreases when the DR exceeds approximately 80%. Regression curve fitting showed a good relationship between the proposed DR and the maximum moment of a bridge. The maximum moment under far-fault ground motion occurred within 25% of the DR. Near-fault ground motion with forward directivity produced the maximum moment at approximately 80% of the DR. In the fling-step ground motion condition, the maximum moment reached as much as approximately 160% of the DR.
This study also investigated the changes in the natural frequency of bridges caused by ground motions. The post-earthquake natural frequency of the bridge decreased only in some ground motions. Therefore, the proposed DR was employed to analyze the decrease in the natural frequency of the bridge and the characteristics of ground motion. Compared with the far-fault ground motion, the near-fault ground motion showed a greater decrease in the natural frequency with the increase in the DR. The rate of decrease in the natural frequency with an increasing DR was similar in near-fault and far-fault ground motions.
Author Contributions
J.-H.L. and H.A. planned this study; H.A. performed the modeling; J.-H.L., S.S., and H.A. analyzed the data; and J.-H.L. and H.A. wrote and revised the paper. All authors have read and agreed to the published version of the manuscript.
Funding
This research was funded by the Ministry of Land, Infrastructure and Transport of the Korean government, grant number 20SCIP-B146946-03.
Acknowledgments
The authors are thankful for the financial support through a research grant (20SCIP-B146946-03) from the Smart Civil Infrastructure Research Program funded by the Ministry of Land, Infrastructure, and Transport of the Korean government.
Conflicts of Interest
The authors declare no conflict of interest.
References
- Ellsworth, W.L.; Llenos, A.L.; McGarr, A.F.; Michael, A.J.; Rubinstein, J.L.; Mueller, C.S.; Petersen, M.D.; Calais, E. Increasing seismicity in the U. S. midcontinent: Implications for earthquake hazard. Lead. Edge 2015, 34, 618–626. [Google Scholar] [CrossRef] [Green Version]
- Wen, Y.K.; Collins, K.R.; Han, S.W.; Elwood, K.J. Dual-level designs of buildings under seismic loads. Struct. Saf. 1996, 18, 195–224. [Google Scholar] [CrossRef]
- Lee, L.H.; Lee, H.H.; Han, S.W. Method of selecting design earthquake ground motions for tall buildings. Struct. Des. Tall Build. 2000, 9, 201–213. [Google Scholar] [CrossRef]
- Han, S.W.; Seok, S.W. Efficient procedure for selecting and scaling ground motions for response history analysis. J. Struct. Eng. 2014, 140, 06013004. [Google Scholar] [CrossRef]
- Chopra, A.K.; Chintanapakdee, C. Comparing response of SDF systems to near-fault and far-fault earthquake motions in the context of spectral regions. Earthq. Eng. Struct. Dyn. 2001, 30, 1769–1789. [Google Scholar] [CrossRef]
- Riddell, R.; Newmark, N.M. Statistical Analysis of the Response of Nonlinear Systems Subjected to Earthquake; University of Illinois Engineering Experiment Station, College of Engineering, University of Illinois at Urbana-Champaign: Champaign, IL, USA, 1979. [Google Scholar]
- Vidic, T.; Fajfar, P.; Fischinger, M. Consistent inelastic design spectra: Strength and displacement. Earthq. Eng. Struct. Dyn. 1994, 23, 507–521. [Google Scholar] [CrossRef]
- Jalali, R.S.; Bahari Jokandan, M.; Trifunac, M.D. Earthquake response of a three-span, simply supported bridge to near-field pulse and permanent-displacement step. Soil Dyn. Earthq. Eng. 2012, 43, 380–397. [Google Scholar] [CrossRef]
- Kabir, M.R.; Billah, A.H.M.M.; Alam, M.S. Seismic fragility assessment of a multi-span RC bridge in Bangladesh considering near-fault, far-field and long duration ground motions. Structures 2019, 19, 333–348. [Google Scholar] [CrossRef]
- Ma, H.B.; Zhuo, W.D.; Lavorato, D.; Nuti, C.; Fiorentino, G.; Gu, Y.; Briseghella, B. Probabilistic Seismic Response Analysis on Continuous Bridges Under Near-Fault Ground Motions. Iran. J. Sci. Technol. Trans. Civ. Eng. 2019, 43, 491–500. [Google Scholar] [CrossRef]
- Zeinoddini, M.; Ahmadpour, F.; Matin Nikoo, H. Seismic assessment of gravity quay-wall structures, subjected to near-fault ground excitations. In Procedia Engineering; Elsevier: Amsterdam, The Netherlands, 2011; Volume 14, pp. 3221–3228. [Google Scholar]
- Katsimpini, P.; Konstandakopoulou, F.; Papagiannopoulos, G.; Pnevmatikos, N.; Hatzigeorgiou, G. Seismic performance of steel structure-foundation systems designed according to eurocode 8 provisions: The case of near-fault seismic motions. Buildings 2020, 10, 63. [Google Scholar] [CrossRef] [Green Version]
- Sharbatdar, M.K.; Hoseini Vaez, S.R.; Ghodrati Amiri, G.; Naderpour, H. Seismic response of base-isolated structures with LRB and FPS under near fault ground motions. Procedia Eng. 2011, 14, 3245–3251. [Google Scholar] [CrossRef] [Green Version]
- Han, S.W.; Jee, H.W. A Numerical Model for Simulating Ground Motions for the Korean Peninsula. Appl. Sci. 2020, 10, 1254. [Google Scholar] [CrossRef] [Green Version]
- Baker, J.W. Quantitative Classification of Near-Fault Ground Motions Using Wavelet Analysis. Bull. Seismol. Soc. Am. 2007, 97, 1486–1501. [Google Scholar] [CrossRef]
- Mazza, F.; Vulcano, A. Nonlinear Response of RC Framed Buildings with Isolation and Supplemental Damping at the Base Subjected to Near-Fault Earthquakes. J. Earthq. Eng. 2009, 13, 690–715. [Google Scholar] [CrossRef]
- Mazza, F. Nonlinear Dynamic Response of RC Buildings with Different Base Isolation Systems Subjected to Horizontal and Vertical Components of Near-Fault Ground Motions. Open Constr. Build. Technol. J. 2012, 6, 373–383. [Google Scholar] [CrossRef] [Green Version]
- Yalcin, O.F.; Dicleli, M. Effect of the high frequency components of near-fault ground motions on the response of linear and nonlinear SDOF systems: A moving average filtering approach. Soil Dyn. Earthq. Eng. 2020, 129, 105922. [Google Scholar] [CrossRef]
- Du, K.; Cheng, F.; Bai, J.; Jin, S. Seismic performance quantification of buckling-restrained braced RC frame structures under near-fault ground motions. Eng. Struct. 2020, 211, 110447. [Google Scholar] [CrossRef]
- Adanur, S.; Altunişik, A.C.; Bayraktar, A.; Akköse, M. Comparison of near-fault and far-fault ground motion effects on geometrically nonlinear earthquake behavior of suspension bridges. Nat. Hazards 2012, 64, 593–614. [Google Scholar] [CrossRef]
- Cavdar, Ö. Probabilistic sensitivity analysis of two suspension bridges in Istanbul, Turkey to near- and far-fault ground motion. Nat. Hazards Earth Syst. Sci. 2012, 12, 459–473. [Google Scholar] [CrossRef]
- Mander, J.; Waheed, S.; Chaudhary, M.; Chen, S.S. Seismic Performance of Shear-Critical Reinforced Concrete Bridge Piers; State University of New York: Buffalo, NY, USA, 1993. [Google Scholar]
- Stone, W.C.; Cheok, G.S. Inelastic Behavior of Full-Scale Bridge Columns Subjected to Cyclic Loading; National Institute of Standards and Technology: Gaithersburg, MD, USA, 1988. [Google Scholar] [CrossRef]
- Phan, V.; Saiidi, M.S.; Anderson, J.; Ghasemi, H. Near-Fault Ground Motion Effects on Reinforced Concrete Bridge Columns. J. Struct. Eng. 2007, 133, 982–989. [Google Scholar] [CrossRef]
- Barcley, L.; Kowalsky, M. Seismic Performance of Circular Concrete Columns Reinforced with High-Strength Steel. J. Struct. Eng. 2020, 146, 04019198. [Google Scholar] [CrossRef]
- Aoki, T.; Susantha, K.A.S. Seismic Performance of Rectangular-Shaped Steel Piers under Cyclic Loading. J. Struct. Eng. 2005, 131, 240–249. [Google Scholar] [CrossRef]
- Pacific Earthquake Engineering Research Center. Available online: https://peer.berkeley.edu/ (accessed on 21 July 2020).
- Kinoshita, S. Kyoshin Net (K-NET). Seismol. Res. Lett. 1998, 69, 309–332. [Google Scholar] [CrossRef]
- Gioncu, V.; Mazzolani, F. Ductility of Seismic-Resistant Steel Structures; CRC Press: Boca Raton, FL, USA, 2003. [Google Scholar] [CrossRef]
- Stewart, J.P.; Chiou, S.J.; Bray, J.D.; Graves, R.W.; Somerville, P.G.; Abrahamson, N.A. Ground motion evaluation procedures for performance-based design. Soil Dyn. Earthq. Eng. 2002. [Google Scholar] [CrossRef]
- Yadav, K.K.; Gupta, V.K. Near-fault fling-step ground motions: Characteristics and simulation. Soil Dyn. Earthq. Eng. 2017, 101, 90–104. [Google Scholar] [CrossRef]
- Bhagat, S.; Wijeyewickrema, A.C.; Subedi, N. Influence of Near-Fault Ground Motions with Fling-Step and Forward-Directivity Characteristics on Seismic Response of Base-Isolated Buildings. J. Earthq. Eng. 2018, 1–20. [Google Scholar] [CrossRef]
- Alatik, L.; Abrahamson, N. An improved method for nonstationary spectral matching. Earthq. Spectra 2010. [Google Scholar] [CrossRef] [Green Version]
- Code, P. Eurocode 8: Design of structures for earthquake resistance-part 1: General rules, seismic actions and rules for buildings. In Brussels European Commission Standard; CEN: Brussels, Belgium, 2005. [Google Scholar]
- UBC-97. In Uniform Building Code-Volume 2; International Conference of Building Officials: Whittier, CA, USA, 1997.
- KDS. In Seismic Design Code; Ministry of the Interior and Safety: Seoul, Korea, 2017.
- Code, A.S. Algerian Earthquake Resistant Regulations; Ministry of Town planning and Construction: Algiers, Algeria, 1988. [Google Scholar]
- L’Heureux, J.S.; Long, M. Relationship between shear-wave velocity and geotechnical parameters for Norwegian clays. J. Geotech. Geoenviron. Eng. 2017. [Google Scholar] [CrossRef] [Green Version]
- Nguyen, V.Q.; Aaqib, M.; Nguyen, D.D.; Luat, N.V.; Park, D. A site-specific response analysis: A case study in Hanoi, Vietnam. Appl. Sci. 2020, 10, 3972. [Google Scholar] [CrossRef]
- Hashash, Y.; Musgrove, M.; Harmon, J.; Ilhan, O.; Groholski, D.; Phillips, C.; Park, D. DEEPSOIL 7.0, User Manual; University of Illinois at Urbana-Champaign: Springfield, IL, USA, 2017. [Google Scholar]
- Mazzoni, S.; Mckenna, F.; Scott, M.H.; Fenves, G.L. OpenSees Command Language Manual, Open System for Earthquake Engineering Simulation (OpenSees). 2006. Available online: http://opensees.berkeley.edu/OpenSees/manuals/usermanual/OpenSeesCommandLanguageManualJune2006.pdf (accessed on 19 October 2018).
- Mander, J.B.; Priestley, M.J.; Park, R. Theoretical stress-strain model for confined concrete. J. Struct. Eng. 1988. [Google Scholar] [CrossRef] [Green Version]
- Menegotto, M.; Pinto, P.E. Method of Analysis for Cyclically Loaded Reinforced Concrete Plane Frames Including Changes in Geometry and Non-elastic Behavior of Elements Under Combined Normal Force and Bending. In Proceedings of the IABSE Symposium on the Resistance and Ultimate Deformability of Structures Acted on by Well-Defined Repeated Loads; ACmPress: Lisbon, Portugal, 1973. [Google Scholar]
- ATC-40. In Seismic Evaluation and Retrofit of Concrete Buildings; Applied Technology Council: Redwood City, CA, USA, 1996.
- Priestley, M.J.N.; Seible, F.; Calvi, G.M. Seismic Design and Retrofit of Bridges; John Wiley & Sons, Inc.: Hoboken, NJ, USA, 1996; ISBN 9780470172858. [Google Scholar]
- Federal Emergency Management Agency. Improvement of Nonlinear Static Seismic Analysis Procedures; FEMA: Washington, DC, USA, 2005.
Figure 1.
Typical time histories of the near-fault ground motion with forward-directivity and fling-step effects and the far-fault ground motion: (a) Near-fault ground motion with forward directivity; (b) near-fault ground motion with fling step; (c) far-fault ground motion
Figure 1.
Typical time histories of the near-fault ground motion with forward-directivity and fling-step effects and the far-fault ground motion: (a) Near-fault ground motion with forward directivity; (b) near-fault ground motion with fling step; (c) far-fault ground motion
Figure 2.
Spectral accelerations obtained from site response analyses for seven ground motions defined at the near and far faults: (a) Spectral accelerations for near-fault ground motions; (b) spectral accelerations for far-fault ground motions
Figure 2.
Spectral accelerations obtained from site response analyses for seven ground motions defined at the near and far faults: (a) Spectral accelerations for near-fault ground motions; (b) spectral accelerations for far-fault ground motions
Figure 3.
Side layout of the bridge.
Figure 3.
Side layout of the bridge.
Figure 4.
Cross section of the bridge and pier.
Figure 4.
Cross section of the bridge and pier.
Figure 5.
Numerical modeling of the bridge.
Figure 5.
Numerical modeling of the bridge.
Figure 6.
Stress–strain curves for the inelastic material model: (a) Mander et al. (1988) model; (b) Menegotto and Pinto (1973) model.
Figure 6.
Stress–strain curves for the inelastic material model: (a) Mander et al. (1988) model; (b) Menegotto and Pinto (1973) model.
Figure 7.
Mode shapes of the bridge: (a) 1st mode; (b) 2nd mode; (c) 3rd mode shapes
Figure 7.
Mode shapes of the bridge: (a) 1st mode; (b) 2nd mode; (c) 3rd mode shapes
Figure 8.
Change in the natural frequencies of the bridge with increasing height of the pier.
Figure 8.
Change in the natural frequencies of the bridge with increasing height of the pier.
Figure 9.
Lateral displacement time histories at the top of each pier.
Figure 9.
Lateral displacement time histories at the top of each pier.
Figure 10.
Variation in the moment along the length of a pier.
Figure 10.
Variation in the moment along the length of a pier.
Figure 11.
Relationship of the displacement spectrum (Sd) and maximum lateral displacement with the pier height for near-fault ground motions: (a) Displacement spectrum at near-fault ground motion; (b) maximum displacement at near-fault ground motion.
Figure 11.
Relationship of the displacement spectrum (Sd) and maximum lateral displacement with the pier height for near-fault ground motions: (a) Displacement spectrum at near-fault ground motion; (b) maximum displacement at near-fault ground motion.
Figure 12.
Relationship of the displacement spectrum (Sd) and maximum lateral displacement with the pier height for far-fault ground motions: (a) Displacement spectrum at far-fault ground motion; (b) maximum displacement at far-fault ground motion
Figure 12.
Relationship of the displacement spectrum (Sd) and maximum lateral displacement with the pier height for far-fault ground motions: (a) Displacement spectrum at far-fault ground motion; (b) maximum displacement at far-fault ground motion
Figure 13.
Maximum moment with increasing bridge height: (a) Maximum moment under near-fault ground motion; (b) Maximum moment under far-fault ground motion.
Figure 13.
Maximum moment with increasing bridge height: (a) Maximum moment under near-fault ground motion; (b) Maximum moment under far-fault ground motion.
Figure 14.
Relationship between the maximum moment and the dynamic response ratio (DR).
Figure 14.
Relationship between the maximum moment and the dynamic response ratio (DR).
Figure 15.
Relationship between the decrease in the natural frequency and the dynamic response ratio (DR): (a,b) The decrease in the natural frequency and the dynamic response ratio at each ground motions.
Figure 15.
Relationship between the decrease in the natural frequency and the dynamic response ratio (DR): (a,b) The decrease in the natural frequency and the dynamic response ratio at each ground motions.
Table 1.
List of near-fault ground motions.
Table 1.
List of near-fault ground motions.
| Name | Country | Year | Magnitude (M) | Distance (km) | PGA (g) | Mean Period (s) | Vs30 (m/s) | Type of Effect |
|---|
| Gyeongju | Korea | 2016 | 5.8 | 9.1 | 0.41 | 0.15 | 610 | FD |
| Pohang | Korea | 2017 | 5.4 | 9.5 | 0.27 | 0.48 | 750 | FD |
| Northridge | America | 1994 | 6.69 | 5.92 | 0.43 | 0.15 | 628.99 | FD |
| Sierra Madre | America | 1991 | 5.61 | 10.36 | 0.28 | 0.25 | 680.37 | FD |
| Chi-Chi | Taiwan | 2016 | 7.62 | 11.48 | 0.44 | 0.18 | 665.2 | FS |
| Loma Prieta | America | 1989 | 6.93 | 12.69 | 0.26 | 0.49 | 671.77 | FS |
| Kocaeli | Turkey | 1999 | 7.4 | 3.2 | 0.63 | 0.26 | 691.34 | FS |
Table 2.
List of far-fault ground motions.
Table 2.
List of far-fault ground motions.
| Name | Country | Year | Magnitude (M) | Distance (km) | PGA (g) | Mean Period (s) | Vs30 (m/s) |
|---|
| EHMH01010324 | Japan | 2001 | 6.4 | 119 | 0.098 | 0.12 | 743 |
| Big Bear-01 | America | 1992 | 6.46 | 95.94 | 0.035 | 0.44 | 624.01 |
| Chi-Chi | Taiwan | 1999 | 7.62 | 109.27 | 0.080 | 0.97 | 856.38 |
| Hector Mine | America | 1999 | 7.13 | 96.91 | 0.033 | 0.62 | 642.83 |
| Denali | America | 2002 | 7.9 | 239.52 | 0.0094 | 0.96 | 708.02 |
| Tottori | Japan | 2000 | 6.61 | 101.82 | 0.078 | 0.15 | 677.44 |
| Niigata | Japan | 2004 | 6.63 | 100.45 | 0.031 | 0.11 | 849.01 |
Table 3.
Soil types specified in EC 8 (Eurocode 8), UBC 97 (Uniform Building Code), KDS (Korean Design Standard), and RPA 99/2003 (Regles Parasismiques Algeriennes).
Table 3.
Soil types specified in EC 8 (Eurocode 8), UBC 97 (Uniform Building Code), KDS (Korean Design Standard), and RPA 99/2003 (Regles Parasismiques Algeriennes).
| Eurocode 8 | UBC 97 | KDS | RPA 99/2003 |
|---|
| Soil type A: Vs30 ≥ 800 m/s | Soil type A: Vs30 ≥ 1500 m/s | S1: H < 1 m | S1: Vs > 800 m/s |
| Soil type B: 360 ≤ Vs30 < 800 m/s | Soil type B: 760 ≤ Vs30 < 1500 m/s | S2: 1 ≤ H ≤ 20 m Vs ≥ 260 m/s | S2: 400 ≤ Vs < 800 m/s |
| Soil type C: 180 ≤ Vs30 < 360 m/s | Soil type C: 360 ≤ Vs30 < 760 m/s | S3: 1 ≤ H≤20 m Vs < 260 m/s | S3: 200 ≤ Vs < 400 m/s |
| Soil type D: Vs30 ≤ 180 m/s | Soil type D: 180 ≤ Vs30 < 360 m/s | S4: H > 20 m Vs ≥ 180 m/s | S4: 100 ≤ Vs < 200 m/s |
| Soil type E: A soil profile consisting of a surface alluvium layer with Vs30 values of class C or D and thickness varying between about 5 and 20 m, underlain by stiffer material with Vs30 > 800 m/s | Soil type E: Vs30 < 180 m/s | S5: H > 20 m Vs < 180 m/s | |
| Soil type F: Soils requiring site-specific evaluation | S6: Soils requiring site-specific evaluation |
Table 4.
Summary of the yield and ultimate displacements and the shear force for the piers of a bridge.
Table 4.
Summary of the yield and ultimate displacements and the shear force for the piers of a bridge.
| Pier Height (m) | Yield Displ. (, mm) | Ultimate Displ. (, mm) | Max Shear Force (, kN) |
|---|
| 5 | 22 | 91 | 7200 |
| 10 | 88 | 215 | 3600 |
| 15 | 193 | 367 | 2400 |
| 20 | 361 | 548 | 1800 |
| 25 | 563 | 720 | 1420 |
© 2020 by the authors. Licensee MDPI, Basel, Switzerland. This article is an open access article distributed under the terms and conditions of the Creative Commons Attribution (CC BY) license (http://creativecommons.org/licenses/by/4.0/).


