1. Introduction
More than 150 years ago Henry Clifton Sorby [
1] used optical microscopy for the characterization of rocks and minerals. He developed the basic techniques of petrography, using the polarizing microscope to study the structure of rock thin sections. In the early twentieth century Murdoch [
2] started to use measurements of ore mineral reflectance combined with microchemical techniques for mineral identification.
Presently, the mineralogy of commercial raw materials, such as iron ore, can be determined from X-ray diffraction (XRD) analysis, but for subsequent processing purposes it is also important to understand the actual abundance of each mineral, association/liberation characteristics, dimensional characteristics of particles and mineral grains, surface roughness, porosity and density, the presence of different textures, the reciprocal position of mineral grains, and other morphological and morphometric characteristics. For these purposes, imaging techniques such as scanning electron microscopy [
3,
4,
5,
6], Raman spectroscopy [
7] and optical image analysis (OIA) [
8,
9,
10,
11,
12] are used. Generally, these methods can segment different minerals, but identification of different morphologies of the same mineral requires the further application of textural/structural segmentation.
The standard method for mineral segmentation in OIA is thresholding [
13], where minerals are segmented by their color and brightness. An example of hematite thresholding in crushed iron ore sinter is given in
Figure 1. Segmentation of hematite, which is the brightest mineral in the digital image, is actually performed using three color channels, but for simplicity, only the red channel reflectivity histogram used to determine the selected phase is shown. The reflectivity range of hematite corresponds to the last peak in the histogram.
Figure 1b shows a partially successful attempt to automatically identify hematite. In this example, the hematite areas with relatively lower reflectance are not identified, and from the reflectivity histogram it is evident that the hematite peak is only partially covered by the range between the lower and the upper limits, or thresholds. Only the image pixels with red channel reflectivity within those thresholds are identified as hematite in this example. However when the whole of the last peak in the reflectivity histogram is thresholded, the hematite becomes fully segmented (
Figure 1c). The use of multispectral image acquisition systems based on narrow bandwidth (e.g., 10 nm) interference filters show more efficient segmentation of minerals compared to colour imaging using tristimulus (red, green, blue) filters [
14,
15,
16,
17].
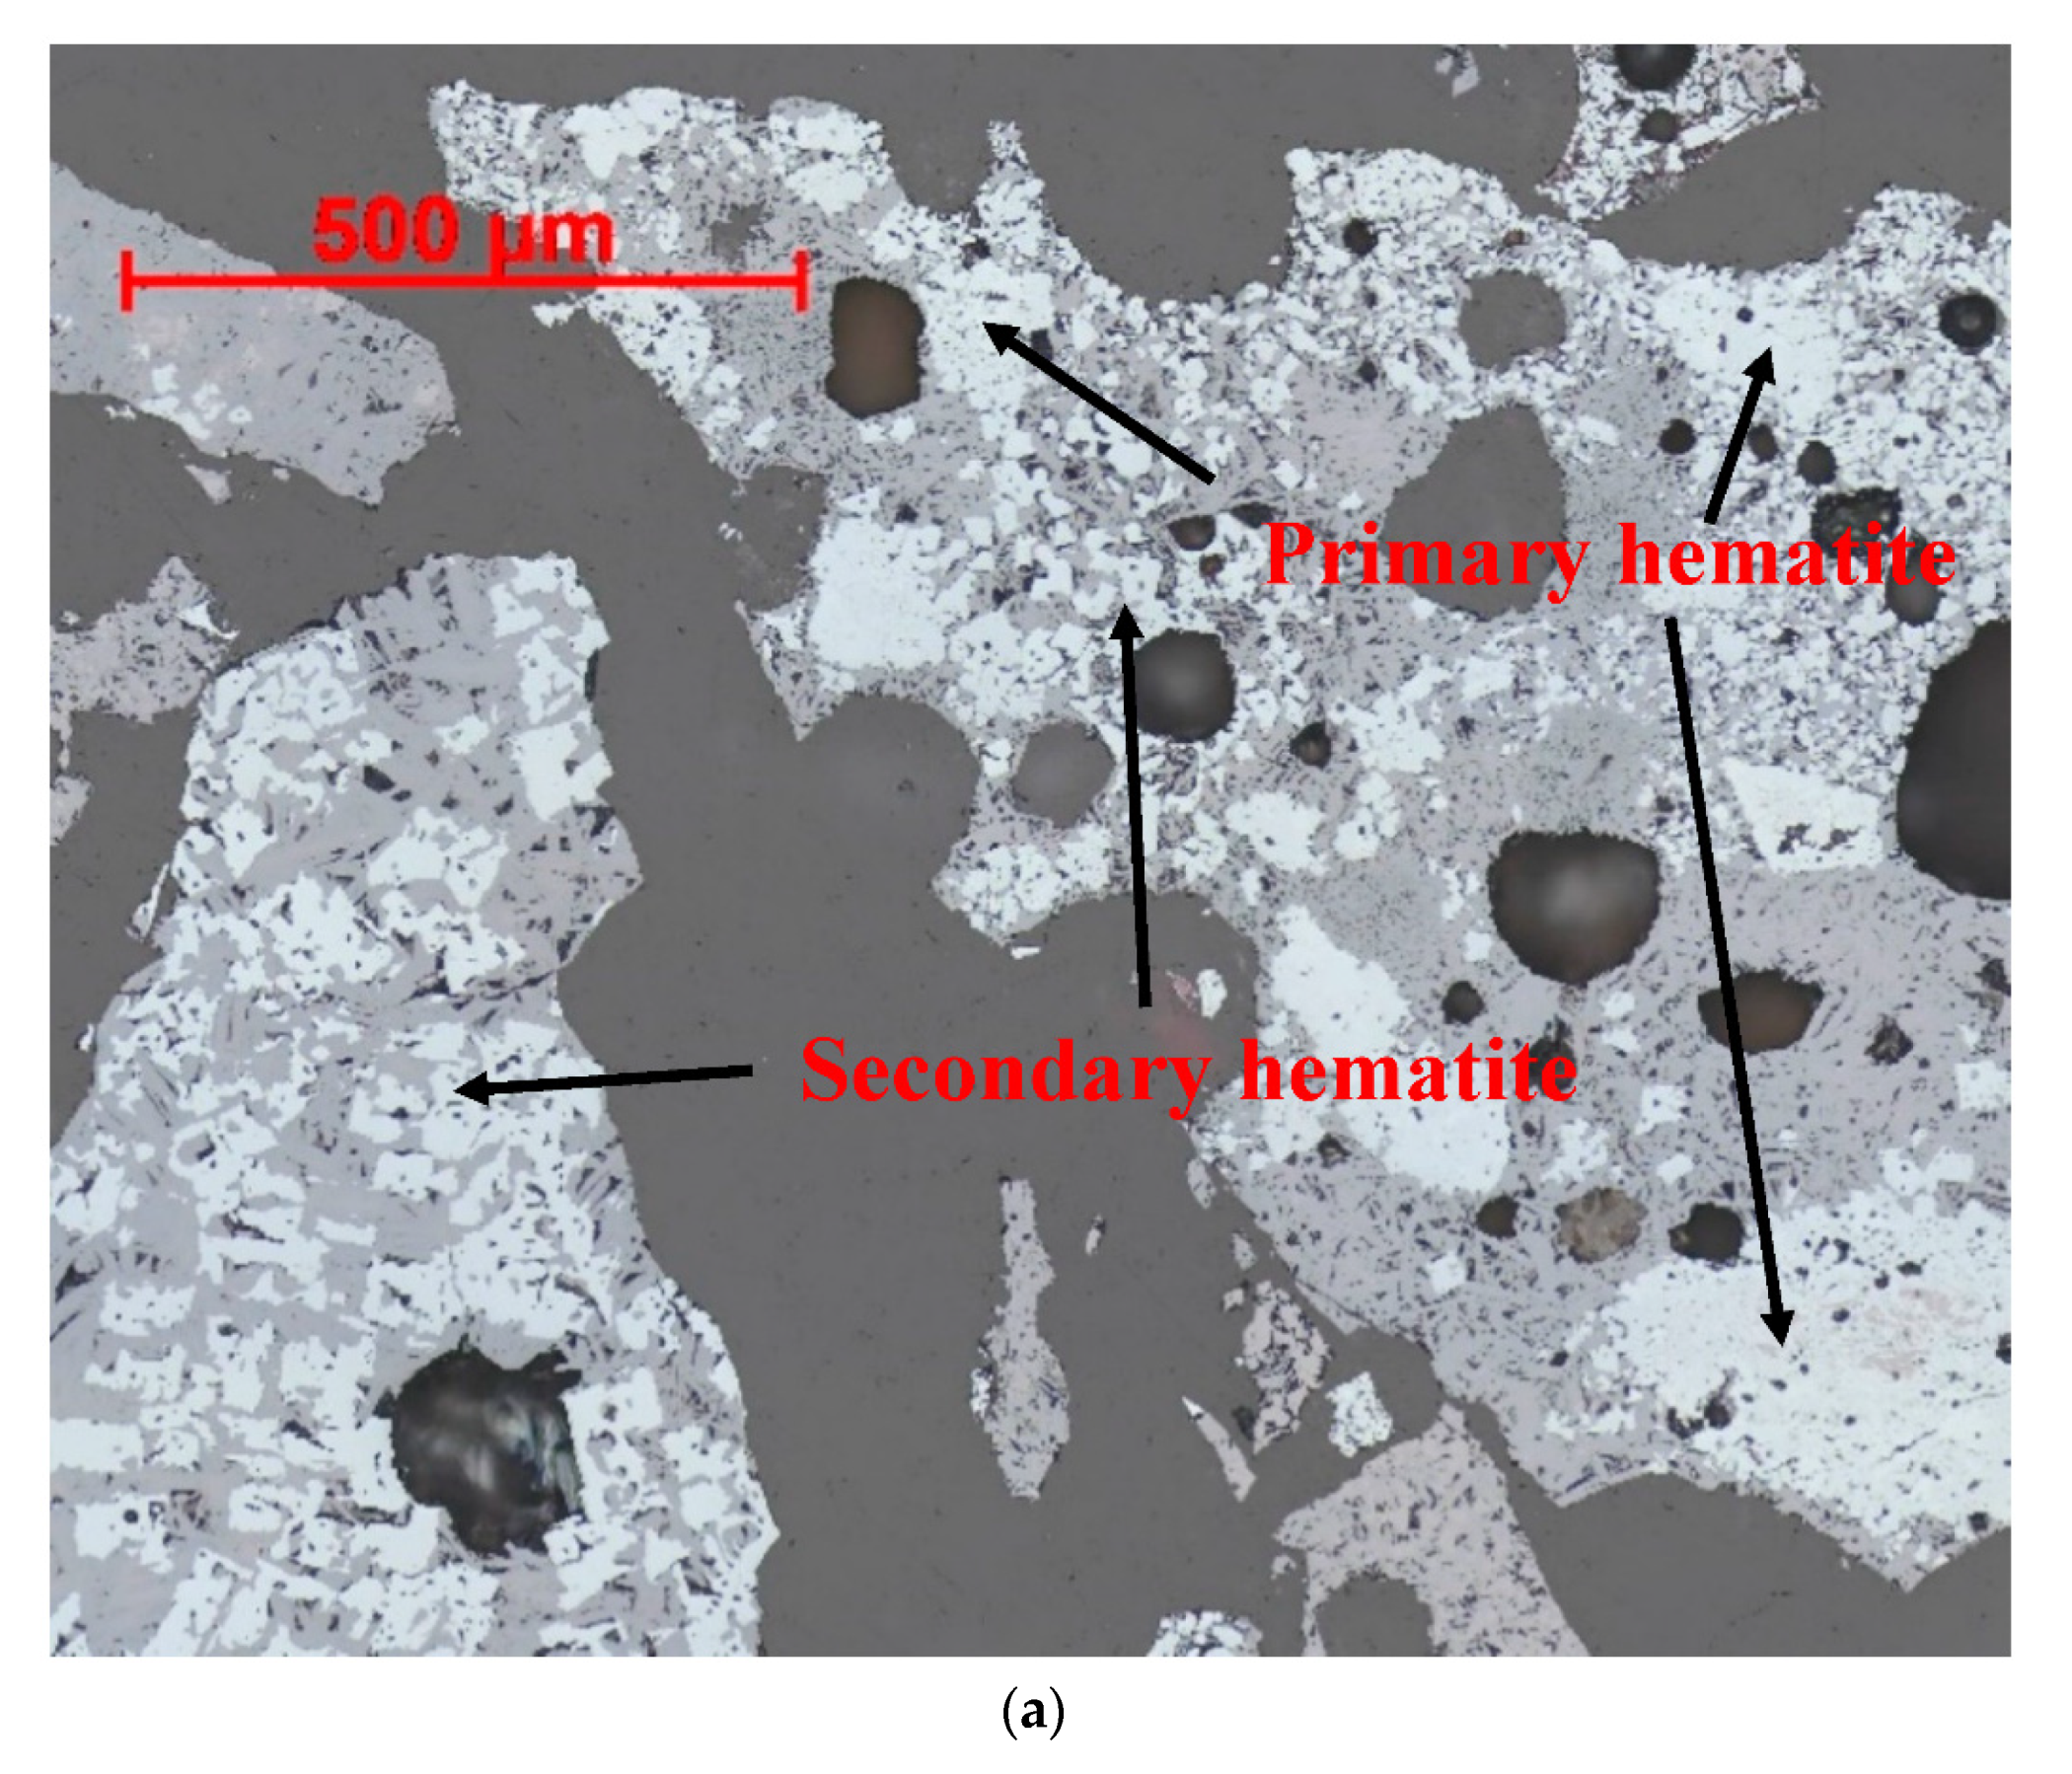
For sinter characterization it is very important to segment the primary, or unreacted, hematite remaining after the sintering process, from the secondary hematite which precipitated from the sinter melt during cooling. The sinter particle at the left hand side of
Figure 1a has only secondary hematite present, whereas the particle to the right contains both phases. The large hematite grain indicated by an arrow in the bottom-right corner of the image is a good example of primary hematite.
Figure 1b clearly shows that, after partial thresholding, the amounts of both types of hematite were underestimated, which means that thresholding alone is unable to segment one type of hematite from another. The size of hematite grains also cannot be reliably used for segmentation. While primary hematite grains are generally large, it is clear that some of the secondary hematite grains in the particle to the left are larger than some of the primary hematite grains in the particle to the right.
For coke characterization it is important to segment Inert Maceral Derived Components (IMDC) and Reacted Maceral Derived components (RMDC) [
18,
19]. However, they also cannot be segmented by simple thresholding as discussed in the section on coke characterization.
In order to quantify coke phases that are difficult to segment automatically, as well as certain sinter phases such as primary and secondary hematite discussed above, the traditional approach employs manual point counting by a trained petrographer. The problem with this approach, apart from it being labor intensive and thus expensive, is that it can be very subjective. It is even possible for an individual petrographer to report different results for the same sample if re-analyzed after a significant time.
Automated optical image analysis reduces the subjectivity and makes the characterization more consistent. The approach adopted during OIA to segment phases with similar reflectivity would be analogous to what petrographers employ during manual point counting—i.e., segmentation by structure/texture.
CSIRO’s Carbon Steel Futures group developed the optical image analysis software Mineral4/Recognition4 for optical image analysis of major ironmaking feedstock materials such as ores (iron ore in particular) including lump and fine ores, sinters, pellets and briquettes, coal, coke etc. [
9,
10]. It can comprehensively characterize phase abundances, porosity, liberation/association, texture, and other sample characteristics. The first and the most important step during characterization is the correct identification of phases (see [
14]). Even if a multi-thresholding [
20] approach is used, it will not necessarily allow for the acceptable segmentation of phases when their reflectivities overlap. To achieve this, a textural identification module was developed for the software, allowing the segmentation of phases which have the same or significantly overlapping reflectivity, but different morphology. To characterize a particular material, an “analysis profile” is developed, which records individual parameter settings and adjustments made during different stages of image analysis. The textural identification unit is a subset of the mineral/phase identification stage. It is engaged when necessary and can perform differently for different materials/phases according to the profile settings.
This article demonstrates algorithms developed for textural segmentation of different ironmaking feedstock materials performed by the textural identification module in Mineral4/Recognition4. These algorithms are based on well-established image analysis procedures such as binary Erosion, Dilation, size-based noise reduction (Scrapping) etc. [
21]. Similar approaches can also be used for image analysis of any other materials within a very wide range of possible OIA applications.
2. Textural Segmentation in OIA of Coke
Metallurgical coke is one of the major components of the blast furnace load, and its qualities, such as strength, abrasion resistance and reactivity, which are strongly dependent on coke structure/texture, are critical for stable blast furnace operation. OIA enables an improved understanding of the relationships between coke quality, parent coal blend composition and coke structure/texture. This allows for the improvement and optimization of the processes involved in coke production, such as parent coal blending, sizing, coking, etc.
In this section we essentially discuss coke “structure”, defining it as the spatial distribution of porosity and the coke matrix, which consists of different coked/reacted macerals. In many disciplines within mineral processing, the term “texture” means approximately the same as “structure”. However, when applied to coke characterization, “texture” is understood to mean the spatial distribution of different isotropic and anisotropic carbon types within the coke, typically determined during optical imaging by differences in bi-reflectance [
18,
19].
During coking of parent coal blends, some macerals, such as different types of vitrinite, are significantly fluidized and thus subject to a stronger reaction. The parts of the coke matrix resulting from such reactions are called Reacted Maceral Derived Components (RMDC). The non-reacted or significantly less reacted types of macerals (inerts) form Inert Maceral Derived Components (IMDC). One of the major tasks during the characterization of coke structure is to determine the relative amounts of carbonaceous materials with different degrees of reaction. The relative abundance and corresponding size distributions of these coke phases show strong significant correlations with different coke strength indices and parent coal blend composition [
18]. For example, a study by Donskoi et al. [
18] confirmed the earlier findings of Kubota et al. [
22] that 1.5 mm is the critical size for IMDC affecting coke strength.
Mineral4 segments and comprehensively characterizes three different phases in coke matrix: unreacted IMDC, partially reacted IMDC and RMDC.
Figure 2a shows an image obtained using a narrow bandwidth (±5 nm) green filter (λ = 546 nm) of coke made from medium rank coal. In the image, the unreacted areas (unreacted IMDC), slightly reacted areas (partially reacted IMDC), and the very porous network connecting them together (RMDC) are clearly evident. The results of automated segmentation of these structural components are given in
Figure 2b. It is clear that unreacted IMDC grains can have different structures; some are quite dense, showing almost no porosity, whereas others are quite porous. This complicates the task of properly identifying them by structure. Standard segmentation by thresholding is also of limited use here. While the coke matrix as a whole can be reliably thresholded to distinguish it from porosity, there is no critical difference in reflectivity between IMDC and RMDC.
Mineral4 Textural Identification uses three different methods to identify various areas of unreacted IMDC and then combines the results into one unreacted IMDC map. These three methods are bulk identification of IMDC, porous IMDC identification and identification of “washed out” IMDC. Similar methodology is used for identification of the partially reacted IMDC. The remainder of the coke matrix is then considered to be RMDC. It is important to highlight that the understanding of RMDC structure as the one consisting of thin walls and large pores is applied in some IMDC identification methods to exclude areas that are “not IMDC”. Generally, for successful structural segmentation, a knowledge of the individual features of all phases is critical.
2.1. Bulk IMDC Textural Identification
“Bulk identification” of IMDC is based on the discrimination of a large nucleus of unreacted, non-porous IMDC surrounded by RMDC or partially reacted IMDC. The algorithm is presented in
Figure 3. Initially a binary map of the coke matrix is obtained by thresholding (
Figure 3a). Next, this map is dilated to remove the finest porosity (up to 5–7 µm) within different parts of the coke matrix (
Figure 3b). In the next step, a strong erosion is applied with the purpose of removing all parts of the coke matrix where porosity is still present (
Figure 3c). The majority of the removed matrix is supposed to be porous RMDC or partially reacted IMDC. However, IMDC areas with larger internal pores, as well as IMDC boundaries, may also be affected. Some dilation is applied to re-connect pieces of non-porous IMDC in the following step, in case they were broken apart by erosion because of large internal pores or cracks (
Figure 3d). Further down objects smaller than a certain size, which are typically the remnants of coagulated RMDC, are scrapped, after which extra dilation is applied to fully compensate for the previous erosion, thus reconstructing the IMDC grain areas (
Figure 3e). When the original coke matrix (
Figure 3a) is masked with that map, the result is the full map of non-porous or very finely porous IMDC (
Figure 3f). Comparison of IMDC identified in
Figure 3f with the unreacted IMDC present in
Figure 2b, however, shows that, for instance, the large piece of IMDC in the top-right corner is almost lost. The reason is that this IMDC grain is noticeably more porous compared to those identified by the “bulk identification” method. To identify such IMDC areas the porous IMDC identification method must be used.
2.2. Porous IMDC Textural Identification
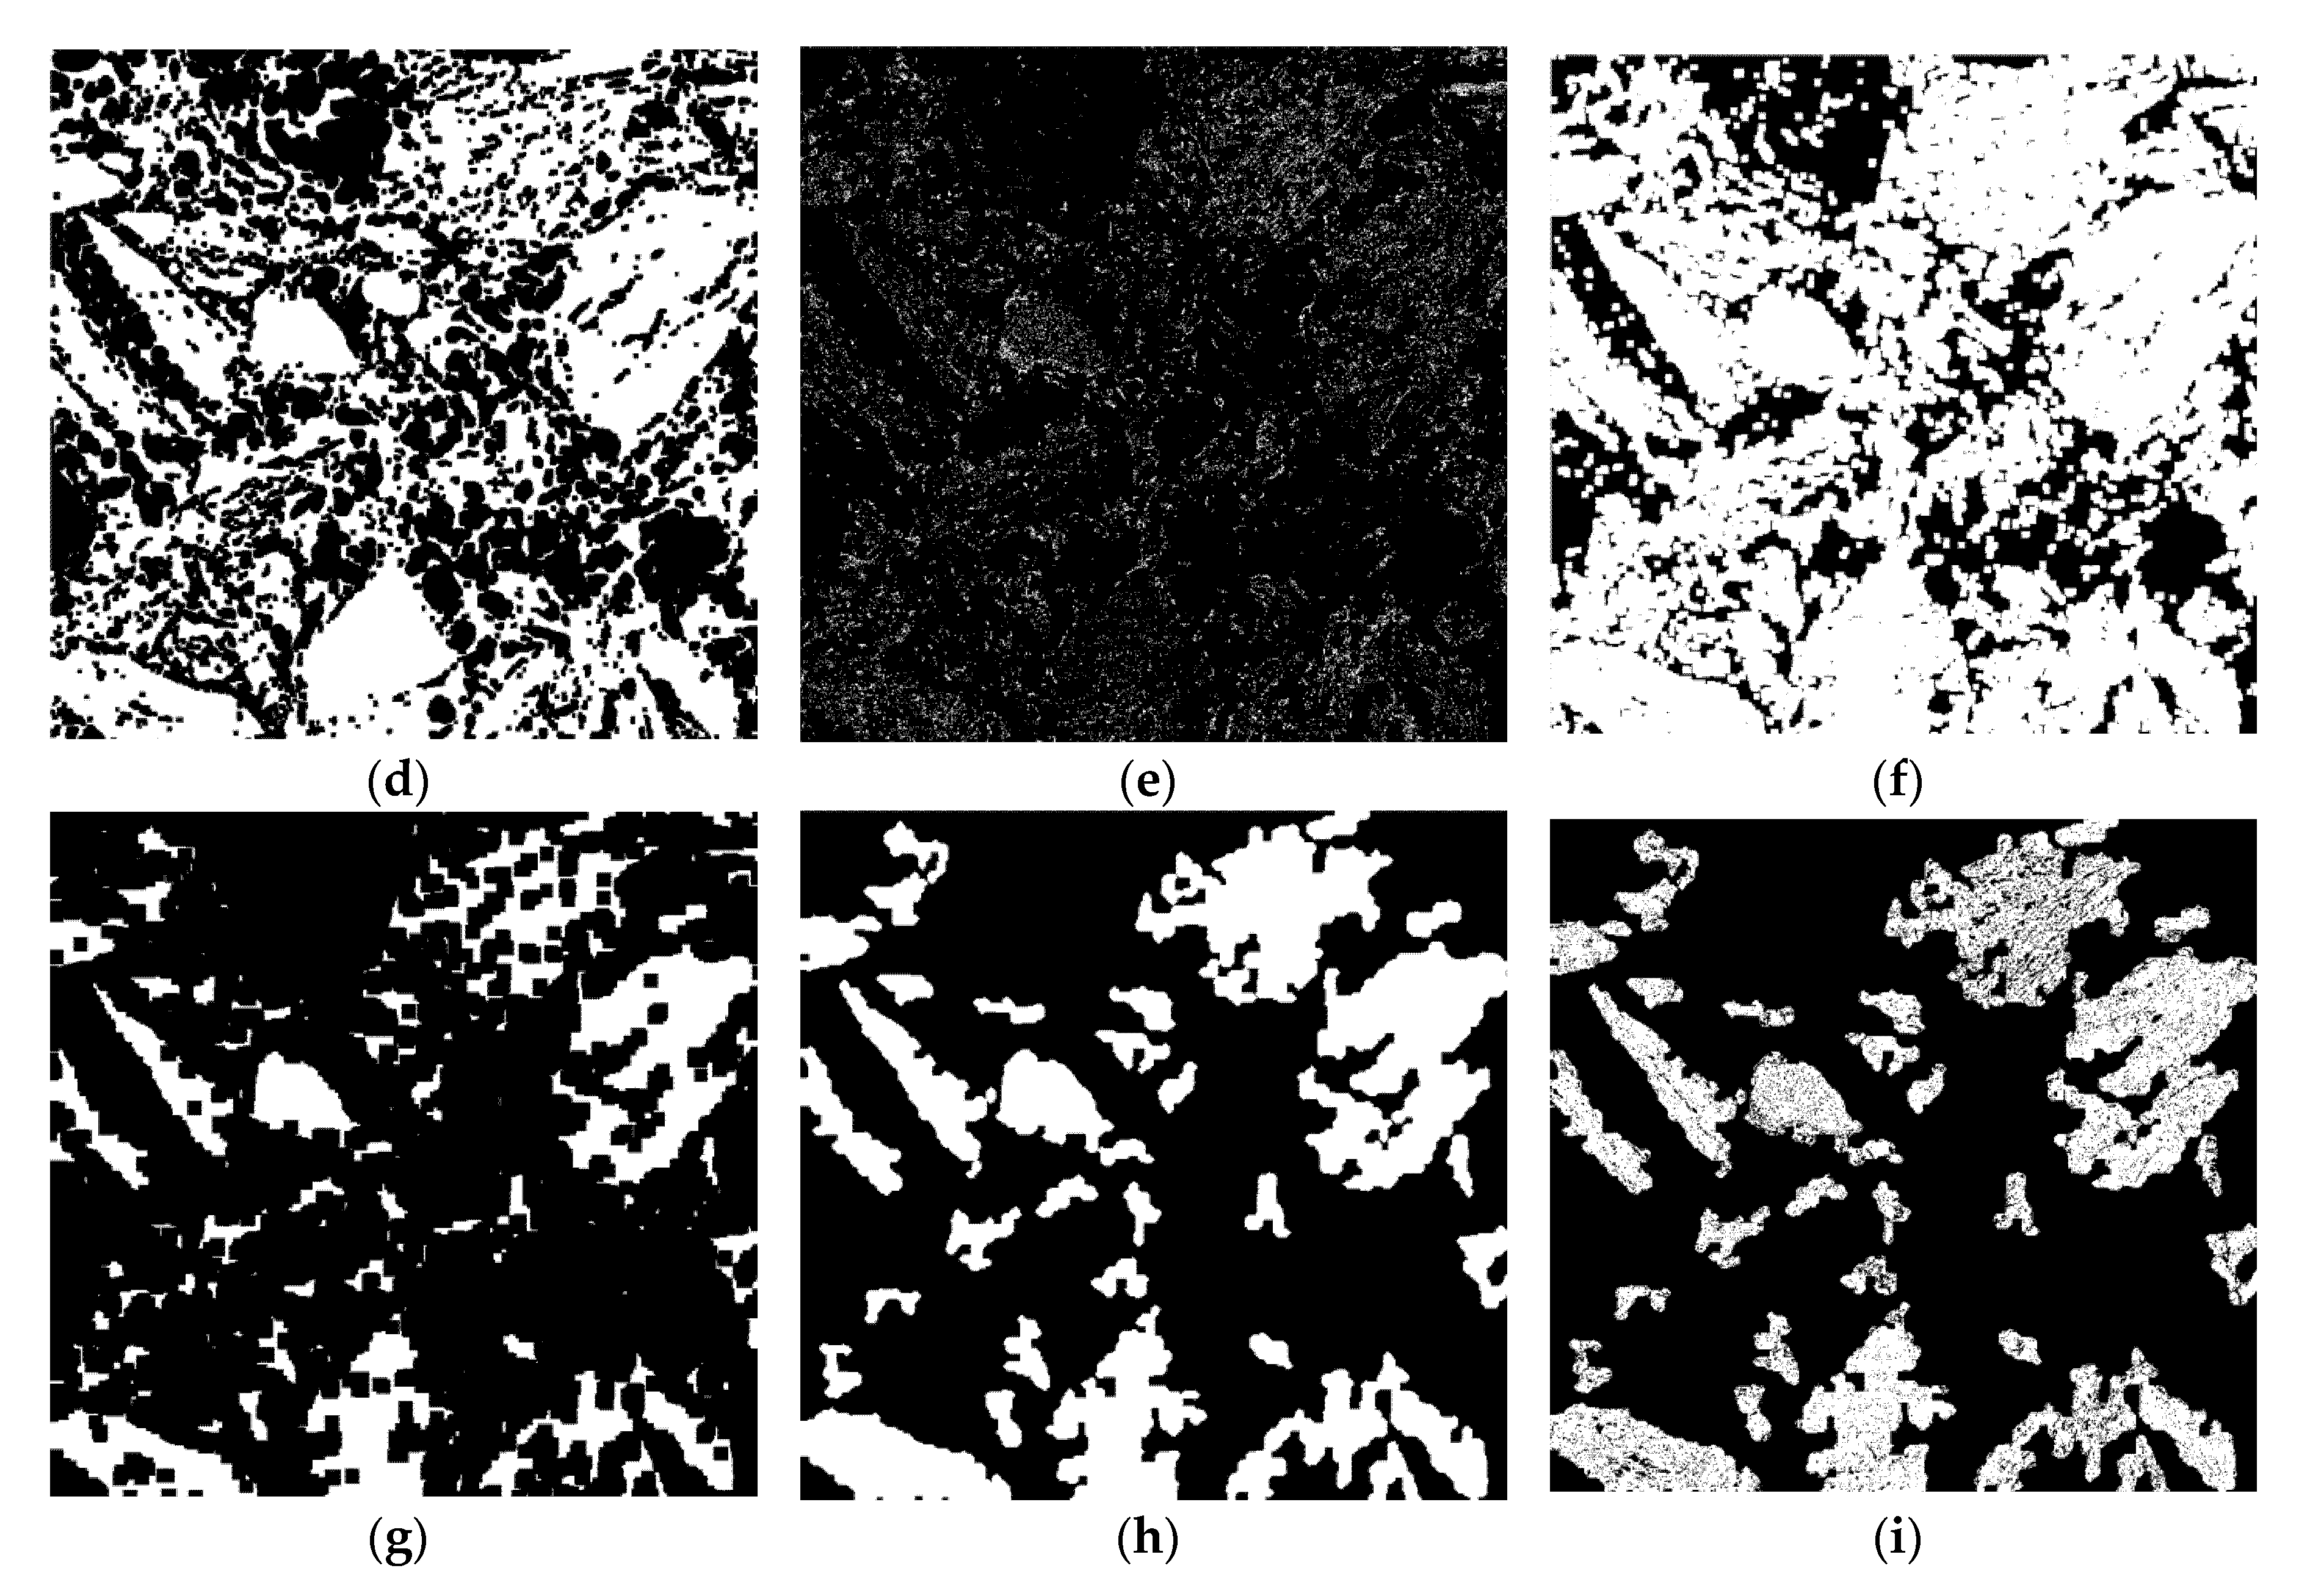
Even though the method is called “porous IMDC identification”, the porosity of such IMDC is still smaller in size than typical porosity present in the reacted or partially reacted part of the coke matrix. To identify porous IMDC, a binary map of coke porosity, which is essentially the inverted map of the coke matrix (
Figure 3a), is created (
Figure 4a). Further, all fine porosity (less than 10 µm thickness) is scrapped (
Figure 4b) and the resulting map is dilated (
Figure 4c). In the next step, this map, representing areas where large pores are predominant, is inverted (
Figure 4d) and subtracted from the original map of the whole porosity (
Figure 4e). These operations allow clusters of fine porosity, which typically represent IMDC areas, to be identified. Such areas can be solidified by strong dilation (
Figure 4f). However, this map also contains significant amounts of RMDC, which too can have fine porosity. Strong erosion is then applied to remove possible RMDC areas still associated with large pores (
Figure 4g). After subsequent dilation, compensating for such erosion, filling holes and scrapping of small objects with size less than identifiable porous IMDC (
Figure 4h) the resulting map is then used to mask the map of the coke matrix (
Figure 3a) and obtain a map of porous IMDC (
Figure 4i). After a last scrapping of small objects this map is considered final. It is evident that some non-porous IMDC areas are not included in this map, for example, parts of the IMDC grain in the lower central part of the image. It is also clear that porous IMDC identification is capable of segmenting IMDC areas much smaller in size than bulk IMDC identification, even when they are fully surrounded by RMDC (see
Figure 2). Small non-porous pieces of IMDC cannot be reliably distinguished from RMDC by analyzing the coke matrix or simple thresholding, but for more precise studies, textural/bi-reflectance characterization can be used [
19].
2.3. “Washed out” IMDC Textural Identification
In the majority of cases, the IMDC identification methods described above work quite well. However, in certain cokes, some IMDC areas are quite dark in appearance, even darker than epoxy, and cannot be thresholded as a part of the coke matrix. In these cases an extra identification method is needed (
Figure 5). Several explanations can be offered for such appearance of IMDC. One possibility is that such IMDC may have very fine porosity which is not impregnated by epoxy during block preparation. Alternatively, some of these areas may have a very weak structure and so are destroyed, plucked out and/or “washed out” (the general term used to call these areas) during the polishing of the block surface. The rest of the coke matrix is brighter than epoxy, so these dark areas are not included when coke matrix is segmented.
For segmentation of “washed out” IMDC, thresholding of areas with reflectivity higher than that of porosity but lower than epoxy is performed (
Figure 6a,b). Next, moderate dilation is performed (
Figure 6c) to preserve the washed out IMDC areas during following strong erosion (
Figure 6d). After dilation, compensating for that strong erosion, filling holes and scrapping of undersized objects (
Figure 6e), the areas of washed out IMDC are determined. Masking those areas with the combination of the map in
Figure 6a and the coke matrix gives the actual map of washed out IMDC (see
Figure 2b and
Figure 6f).
There exists a possibility that the described method may also identify dark minerals with reflectivity between that of porosity and epoxy. If such minerals are known to be sufficiently present in the sample as relatively large grains, they should be identified texturally prior to IMDC identification in the workflow. If that cannot be achieved, a decision should be made about whether the “washed out” identification method should be included in the whole IMDC identification procedure. For the coke shown in
Figure 5, it was in fact critically important to include such identification due to the significant presence of “washed out” areas.
2.4. Textural Segmentation of Partially Reacted IMDC
Partially reacted IMDC (PR IMDC) areas segmented by porous IMDC identification should have porosity smaller in size than that of RMDC, but higher than unreacted IMDC. This is the main criterion used to identify them. The algorithms used for segmentation are the same as for bulk and porous IMDC identification, but the processing parameters are slightly adjusted to segment the correct areas. The result of bulk IMDC identification with increased dilation, erosion and scrap parameters applied for PR IMDC segmentation to the image from
Figure 2 is given in
Figure 7a. The result of porous IMDC identification with similarly increased parameters is provided in
Figure 7b.
Figure 7c shows the preliminary PR IMDC area identification obtained by combining the two identifications described above and subsequent removal of areas already identified as non-reacted IMDC. Along with the correct PR IMC identification,
Figure 7c also includes some relatively thin and small RMDC areas attached to non-reacted IMDC. These areas can be removed by scrapping, leaving only the valid PR IMDC identified (see
Figure 2 and
Figure 7d).
3. Textural Segmentation in OIA of Iron Ore Sinter
Together with coke, iron ore sinter is the one of the major blast furnace loads. It can constitute up to 70–85% of the total ferrous burden fed to the blast furnace and its quality is also very important for stable blast furnace operation. The quality of sinter (e.g., its strength and reducibility) mainly depends on its petrology and texture, which in turn are determined by the initial ore blend, the fluxes added to the blend, and the sintering conditions. To optimize sinter quality and productivity the relationships between the initial sinter mix, sintering conditions and sinter structure, petrology and porosity must be understood [
23,
24,
25,
26].
One of the important characteristics of iron ore sinter is the quantity of primary and secondary hematite, which can provide insights into the presence of large grains of hematite in the initial iron ore blend, the degree of reaction and sintering conditions. The two types of hematite have very similar, or the same, mineral chemistry and reflectivity, so they cannot be segmented by standard scanning electron microscopy or optical image analysis methods. However, they have different morphology and phase associations which can be discriminated by OIA. Primary hematite generally does not contain inclusions of melt-precipitated phases and often preserves the morphology of the original ore particle. Secondary hematite, which mostly precipitates during cooling from the sinter melt, has crystals fully surrounded by, and/or including, other melt-precipitated sinter phases, such as Silico-Ferrites of Calcium and Aluminium (SFCA), undifferentiated glass, and larnite (di-calcium silicate). The presence or absence of these spatially associated phases is the key feature used by Mineral4 for textural segmentation of the two types of hematite.
As a starting point for OIA processing, a map of all hematite in the sinter image is obtained by standard thresholding (
Figure 1a,c and
Figure 8a). A combined map of all phases which are typically associated with secondary hematite, such as SFCA, glass and larnite, is also prepared (
Figure 8b). This second map is scrapped of its finest elements (to exclude the effect of imaging artefacts) and then strongly dilated to create a map of areas associated with the melt-precipitated phases (
Figure 8c). Next, these areas are removed from the overall map of hematite. After additional scrap, removing undersized regions, only the areas of primary hematite are left in the map (
Figure 8d). More dilation follows to compensate for loss during strong dilation of SFCA/glass areas (
Figure 8e). Finally the map is masked with the original hematite map (
Figure 8f) and fine/undersized objects are removed from it. The resulting identification of primary and, by exclusion, secondary hematite is shown in
Figure 9.
Figure 9 demonstrates the false color map of all sinter phases identified by Mineral4 software during automated image analysis of the crushed sinter shown in
Figure 1a. Note that the large grain of primary hematite in the bottom right corner includes some remnant kenomagnetite. Magnetite may still be present in stable ore nuclei remaining after sintering, not just as one of melt-precipitated sinter phases. Therefore, it is not included as part of the melt-precipitated phases in the map (
Figure 8b). It is still clear that the majority of magnetite present in
Figure 9 is melt-precipitated.
The other pertinent textural segmentation by OIA shown in
Figure 9 is that of two types of SFCA: microporous platy SFCA-I (light green) and prismatic/dense SFCA (olive). These two phases have the same reflectivity but different morphology. SFCA-I has slightly higher iron contents which may be determined by SEM methods [
27,
28]. However, in OIA sinter characterization, textural identification is required for segmentation of different SFCA types. As SFCA-I often has fine porosity evident between adjacent plates, this can be utilized for the textural segmentation. The actual algorithm is very similar to that utilized for porous IMDC identification described above.
4. Textural Segmentation in OIA of Iron Ore
Many authors have demonstrated the importance of iron ore textural characterisation [
29,
30,
31,
32,
33,
34,
35,
36] for the optimization of downstream processing performance. Donskoi et al. [
23,
24] showed that the presence of textural information for parent iron ore blend allows a significant improvement in modelling of iron ore sinter quality. It also provides better modelling and deeper understanding of beneficiation processes [
34,
35,
37].
Quantitative mineral characterization, sometimes including identification of different morphologies of the same mineral, is required to correctly texturally classify iron ores.
Figure 10a shows an image of iron ore consisting of two hematite types: microplaty hematite (thin, long plates) and martite. To better understand the reactivity of such an ore, its behavior during pelletising, granulation and sintering, it is important to know the abundances of both types of hematite. Textural segmentation in this particular example can be fairly simple, e.g., initial erosion removing the fine structure of microplaty hematite, followed by compensating dilation restoring the martite grains (similar to the steps in bulk IMDC identification shown in
Figure 3c,d.
Textural identification may also be of significant help during mineral segmentation in complex cases.
Figure 11a shows part of a particle that mainly consists of siliceous goethite with some inclusions of hematite (the brighter grains) and porosity. The area in the top-left corner of the image is epoxy. Segmentation of this siliceous goethite with usual thresholding is problematic because it is rather dark, such that the reflectivity of the epoxy is within the same range as the reflectivity of the goethite.
Figure 12a shows an attempted segmentation of the epoxy, which corresponds to the tall narrow peak on the reflectivity histogram (
Figure 12b). During this segmentation, significant areas inside the goethite particle were also selected. The reason is that the part of the histogram corresponding to goethite is the relatively wider but lower elevation on which the epoxy peak is based. Obviously, if goethite thresholding is attempted, the whole epoxy area will be selected as well (
Figure 12c). To properly segment goethite from epoxy, Mineral4 used multi-thresholding [
20] with textural identification. Initially, the area of goethite with reflectivity less than that of epoxy is thresholded (
Figure 12d,e). The resulting map is subjected to dilation and erosion (
Figure 12f) solidifying the map (this combined image analysis operation is known as Closing), but still some goethite areas remain unselected. Next, the area of goethite with reflectivity higher than epoxy is thresholded (
Figure 12g,h) and the same dilation and erosion combination is applied (
Figure 12i). The two maps are then combined. After previously identified maps of hematite (corresponding to the small elevation in the right part of the reflectivity histogram), vitreous goethite and porosity are removed, the remaining map gives the final siliceous goethite identification (
Figure 11b) which would not be possible to obtain without textural identification.
5. Conclusions
Optical image analysis characterization for all ironmaking feedstock materials needs to be of the highest quality if it is to be used to better predict downstream processing performance. Mineral and textural characterization of iron ore allows for the improved prediction of downstream processes such as beneficiation and sintering. The complex petrology of iron ore sinter also needs to be accurately characterized for sinter quality optimization. Finally, structural/textural characterization of coke is needed to best understand the connection between coke structure/texture, parent coal blend composition and final coke quality.
CSIRO optical image analysis package Mineral4/Recognition4 allows for the high-quality segmentation of phases in different materials using multi-thresholding and textural identification. In particular, it is capable of segmenting phases with the same reflectivity, but different morphology.
During coke characterization, Mineral4 successfully segments the two types of IMDC, unreacted and partially reacted, and RMDC. Segmentation of unreacted IMDC uses three comprehensive textural identification methods: bulk identification of IMDC, porous IMDC identification and identification of “washed out” IMDC, and finally combines them in one map. A similar approach, based on two methods, is used for partially reacted IMDC segmentation.
For sinter characterization, textural identification in Mineral4 allows for the segmentation of primary and secondary hematite, based on association of secondary hematite with certain other melt-precipitated phases. It also allows for the segmentation of SFCA-I from SFCA, by taking into account the micro-porous structure of the former.
In iron ore characterization, textural identification enables the segmentation of different morphologies of hematite, such as microplaty hematite and martite. Used in combination with multi-thresholding it can reliably segment dark siliceous goethite with reflectivity overlapping with that of epoxy.
This article provides detailed descriptions of textural identification algorithms utilized by Mineral4 for ironmaking-related characterization. These and similar algorithms can also be applied in other image analysis tasks where morphological segmentation is required.

