Article

Extended Dual-Focus Microscopy for Ratiometric-Based 3D Movement Tracking

1
Data Science Research Division, Information Technology Center, The University of Tokyo, Hongo 7-3-1, Bunkyo-ku, Tokyo 113-8656, Japan
2
Department of Physics, Graduate School of Science, The University of Tokyo, Hongo 7-3-1, Bunkyo-ku, Tokyo 113-0033, Japan
*
Author to whom correspondence should be addressed.
Appl. Sci. 2020, 10(18), 6243; https://doi.org/10.3390/app10186243
Submission received: 5 August 2020 / Revised: 26 August 2020 / Accepted: 1 September 2020 / Published: 8 September 2020
(This article belongs to the Section Applied Biosciences and Bioengineering)

Abstract

:
Imaging the three-dimensional movement of small organelles in living cells can provide key information for the dynamics of drug delivery and virus transmission in biomedical disciplines. To stably monitor such intracellular motion using microscope, long depth of field along optical axis and accurate three-dimensional tracking are simultaneously required. In the present work, we suggest an extended dual-focus optics microscopy system by combining a bifocal plane imaging scheme and objective lens oscillation, which enables accurate localization for a long axial range. The proposed system exploits high-resolution functionality by concatenating partial calibration result acquired each axial imaging level, maintaining the practical advantages of ratiometric method.

Graphical Abstract

1. Introduction

Intracellular imaging is one of the most important techniques in biomedical optics, and offers immediate visual information on the specific positions and movements of subcellular organelles [1,2]. In a practical imaging microscopy system for a living cell, a fully stable, single focal plane or simultaneous imaging at multiple focal planes are frequently required, depending on the movement range of the intracellular organelle of interest. For example, an imaging of the comparably slow motion of a cell requires only a single image plane with fine stability [3]. However, to track a target organelle traveling a long axial range, such as in the case of endocytosis where a vesicle navigates from the cell membrane to the nucleus periphery, multiple images taken at different focal planes are demanded for acquiring the accurate geometric information, in order not to miss or misconceive the actual dynamics of the target organelle. This is because an organelle in the cytoplasmic area can be transported by cytoskeletal networks in three dimensions [4,5], which refers that the conventional imaging system with a single focal plane cannot chase the fast-changing axial position of the organelle of interest, once it leaves the focal plane. Figure 1 illustrates the multifocal imaging concept and the three-dimensional movement of an intracellular organelle.
Therefore, three-dimensional localization imaging techniques have been developed with a wide range of techniques to acquire biological information, as Zhou et al. summarized recently [6]. For example, engineered point-spread function (PSF) methods and multifocal plane microscopy are the representative methods for localization of intracellular particle in three dimensions. These advances in imaging microscopy have led to the faster and more accurate detection and tracking. Particularly, multifocal plane imaging acquires the position information of the target from multiple image planes by splitting the optical paths, which can extend the range of detection as installing additional lenses and cameras [7,8]. Although the developed techniques have enabled us to localize the target of interest in the imaging microscopy with high precision and speed, those methods might be often accompanied by burdens such as complex computations and preparation of additional instruments which can hinder the direct adaptation to the practical system.
Bifocal plane imaging microscopy, also known as dual-focus optics, is the simplest type of multifocal plane imaging method that minimizes the above concerns [9,10,11]. In dual-focus optics, two focal planes at different axial positions can be imaged on a single camera image sensor, and the intensity information detected from each image can be exploited to extract the three dimensional coordinates of the target organelle [11,12,13]. The major disadvantage of the dual-focus optics is that the axial detectable range is limited by the number of the image planes and the fixed distance between the two focal planes. In addition, because of the nonlinear profile of the calibration curve fit utilized for axial position detection, the localization accuracy is non-uniform for the entire convertible region [14].
Here, we propose an extended dual-focus imaging microscopy system by combining the conventional bifocal plane imaging method and an objective lens oscillation system, to achieve longer trackable range with high detection accuracy, offering a detailed method for detection resolution calculation and the determination of convertible range in calibration: First, the axial localization reliability of the dual-focus optics with ratiometric method is examined with simulation. In the simulation, the distance between the two focal planes and the differences in the axial positions of the consecutive objective lenses are determined. Second, considering the concept of conversion resolution for the calibration curve, a practical guide for building an extended dual-focal imaging system is suggested, which employs the objective lens oscillation by a piezo actuator. Third, an application to an actual intracellular tracking task is reported, in which the three dimensional trajectory of an endosome in a living cell is obtained by detecting its axial position using the proposed method.
The proposed system conceptually transforms the conventional space-division multifocal plane method into a new time-division scheme, as an extended form of the bifocal plane method. The extended dual-focus optics developed in this work preserves the advantages of the ratiometric method by suppressing the imaging intensity loss, thereby simultaneously overcoming the limitation imposed by the resolution problem. Furthermore, the proposed method can be easily adopted into an existing imaging system and customized according to the desired accuracy range and the exploration depth, because of its wide adaptability and expandability.

2. Methods

2.1. Extended Dual-Focus Optics Configuration

A diagram showing the overall combination of the bifocal plane imaging system and lens oscillation scheme proposed in this study is as demonstrated in Figure 2. Based on the dual-focus optics scheme [11], the camera image sensor can simultaneously collect the images acquired from two optical paths having slightly different focal lengths, at a certain imaging position determined by the axial position of the objective lens. Here, ϵ is the difference in positions of image planes established by adjusting the relay lens position. Furthermore, the distance between two adjacent imaging positions, d, can be set and adjusted by tuning the amplitude of the piezo actuator that accommodates the objective lens, which is driven by an input voltage. At first glance, it seems to be advantageous to set the imaging positions broadly as possible along the axial direction to cover the entire range of the cell.
However, there exists a trade-off between the position detection resolution and the imaging range. First of all, because the axial position of the moving organelle is computed based on the intensity ratio acquired from the pair of the focal planes, the separation between focal planes, ϵ , should be determined considering the target organelle size and the calculation accuracy in the range of calibration [11]. In addition, in the case where ϵ d , not only does the probability of missing or misconceiving the target organelle between the nearest imaging positions significantly increase, but also the resolution of axial position calculation cannot be improved upon the combined imaging scheme. Therefore, investigation on the value of ϵ and design of the distance d are prerequisites for an efficient and accurate imaging. First, ϵ should be determined so as to yield fine resolution for detection of the target particle position. Then, the distance between the adjacent imaging positions which is determined by the objective lens oscillation step, d, can be designed to vertically concatenate the axial range evaluated based on ϵ .

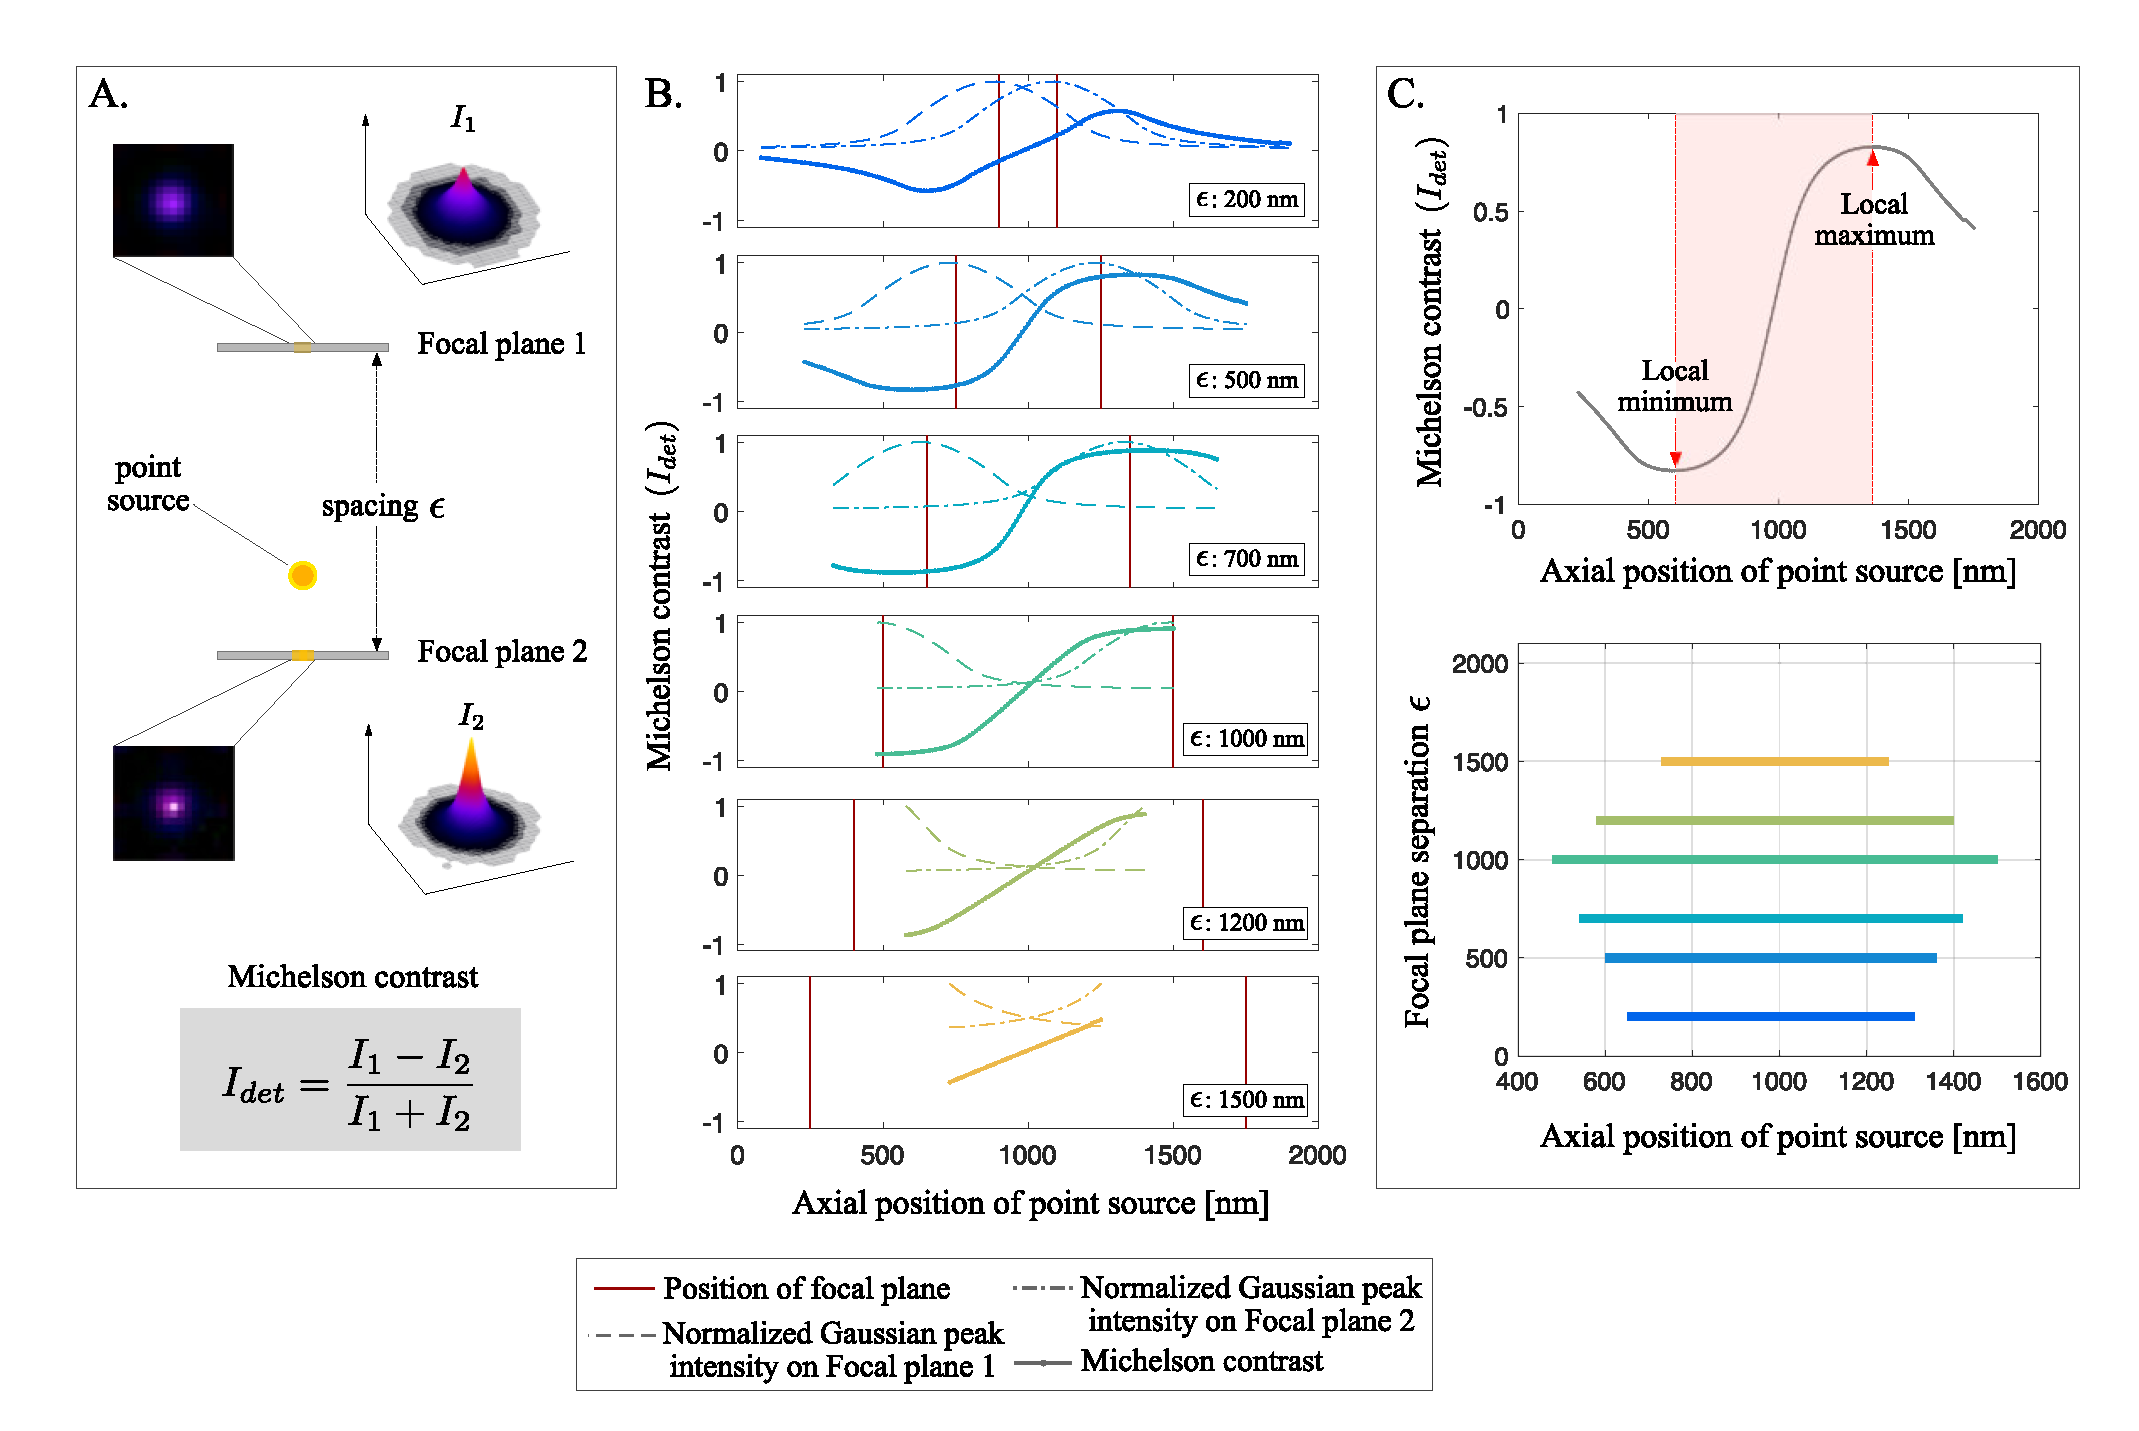
2.2. Simulation for Determining the Focal Plane Separation

To determine ϵ , microscopy simulation was conducted based on Gibson–Lanni point spread function model [15] for a virtual fluorescent particle using Microscope Simulator [16]. To mimic the actual endocytic vesicle, fluorescent particle size of 100 nm in diameter was chosen [17]. Figure 3 illustrates the simulation process and shows results for varying ϵ . Because ratiometric method frequently utilizes the Michelson contrast, which can be expressed as ( I m a x I m i n ) / ( I m a x + I m i n ) where I m a x and I m i n respectively represent the highest and lowest luminance, for localizing the point source [11,12,18], Michelson contrast was calculated for varying ϵ . Computation of Michelson contrast can be described as shown in Figure 3A, where I 1 and I 2 represent the Gaussian peak intensities of the images from each focal plane [19]. For simplicity, we hereafter refer to the Michelson contrast as I d e t , as an intensity determinant acquired from the intensities I 1 and I 2 . For an identical target, ϵ was varied from 200 nm to 1500 nm. The Michelson contrast curves drawn for each ϵ are as shown in Figure 3B. As these curves play roles as lookup tables for point source localization, the trackable range should be determined as the distance between the local minimum and maximum, where I d e t monotonously increases along the axial position of the target point source. As shown in Figure 3C, the longest trackable range was obtained for ϵ = 1000 nm. This result also corresponds to the accuracy calculation previously conducted by Velmurugan et al. [14], who proved that the ratiometric method for multifocal plane microscopy yields high-accuracy axial localization within a relatively short range, where the target particle is located between the two focal planes.

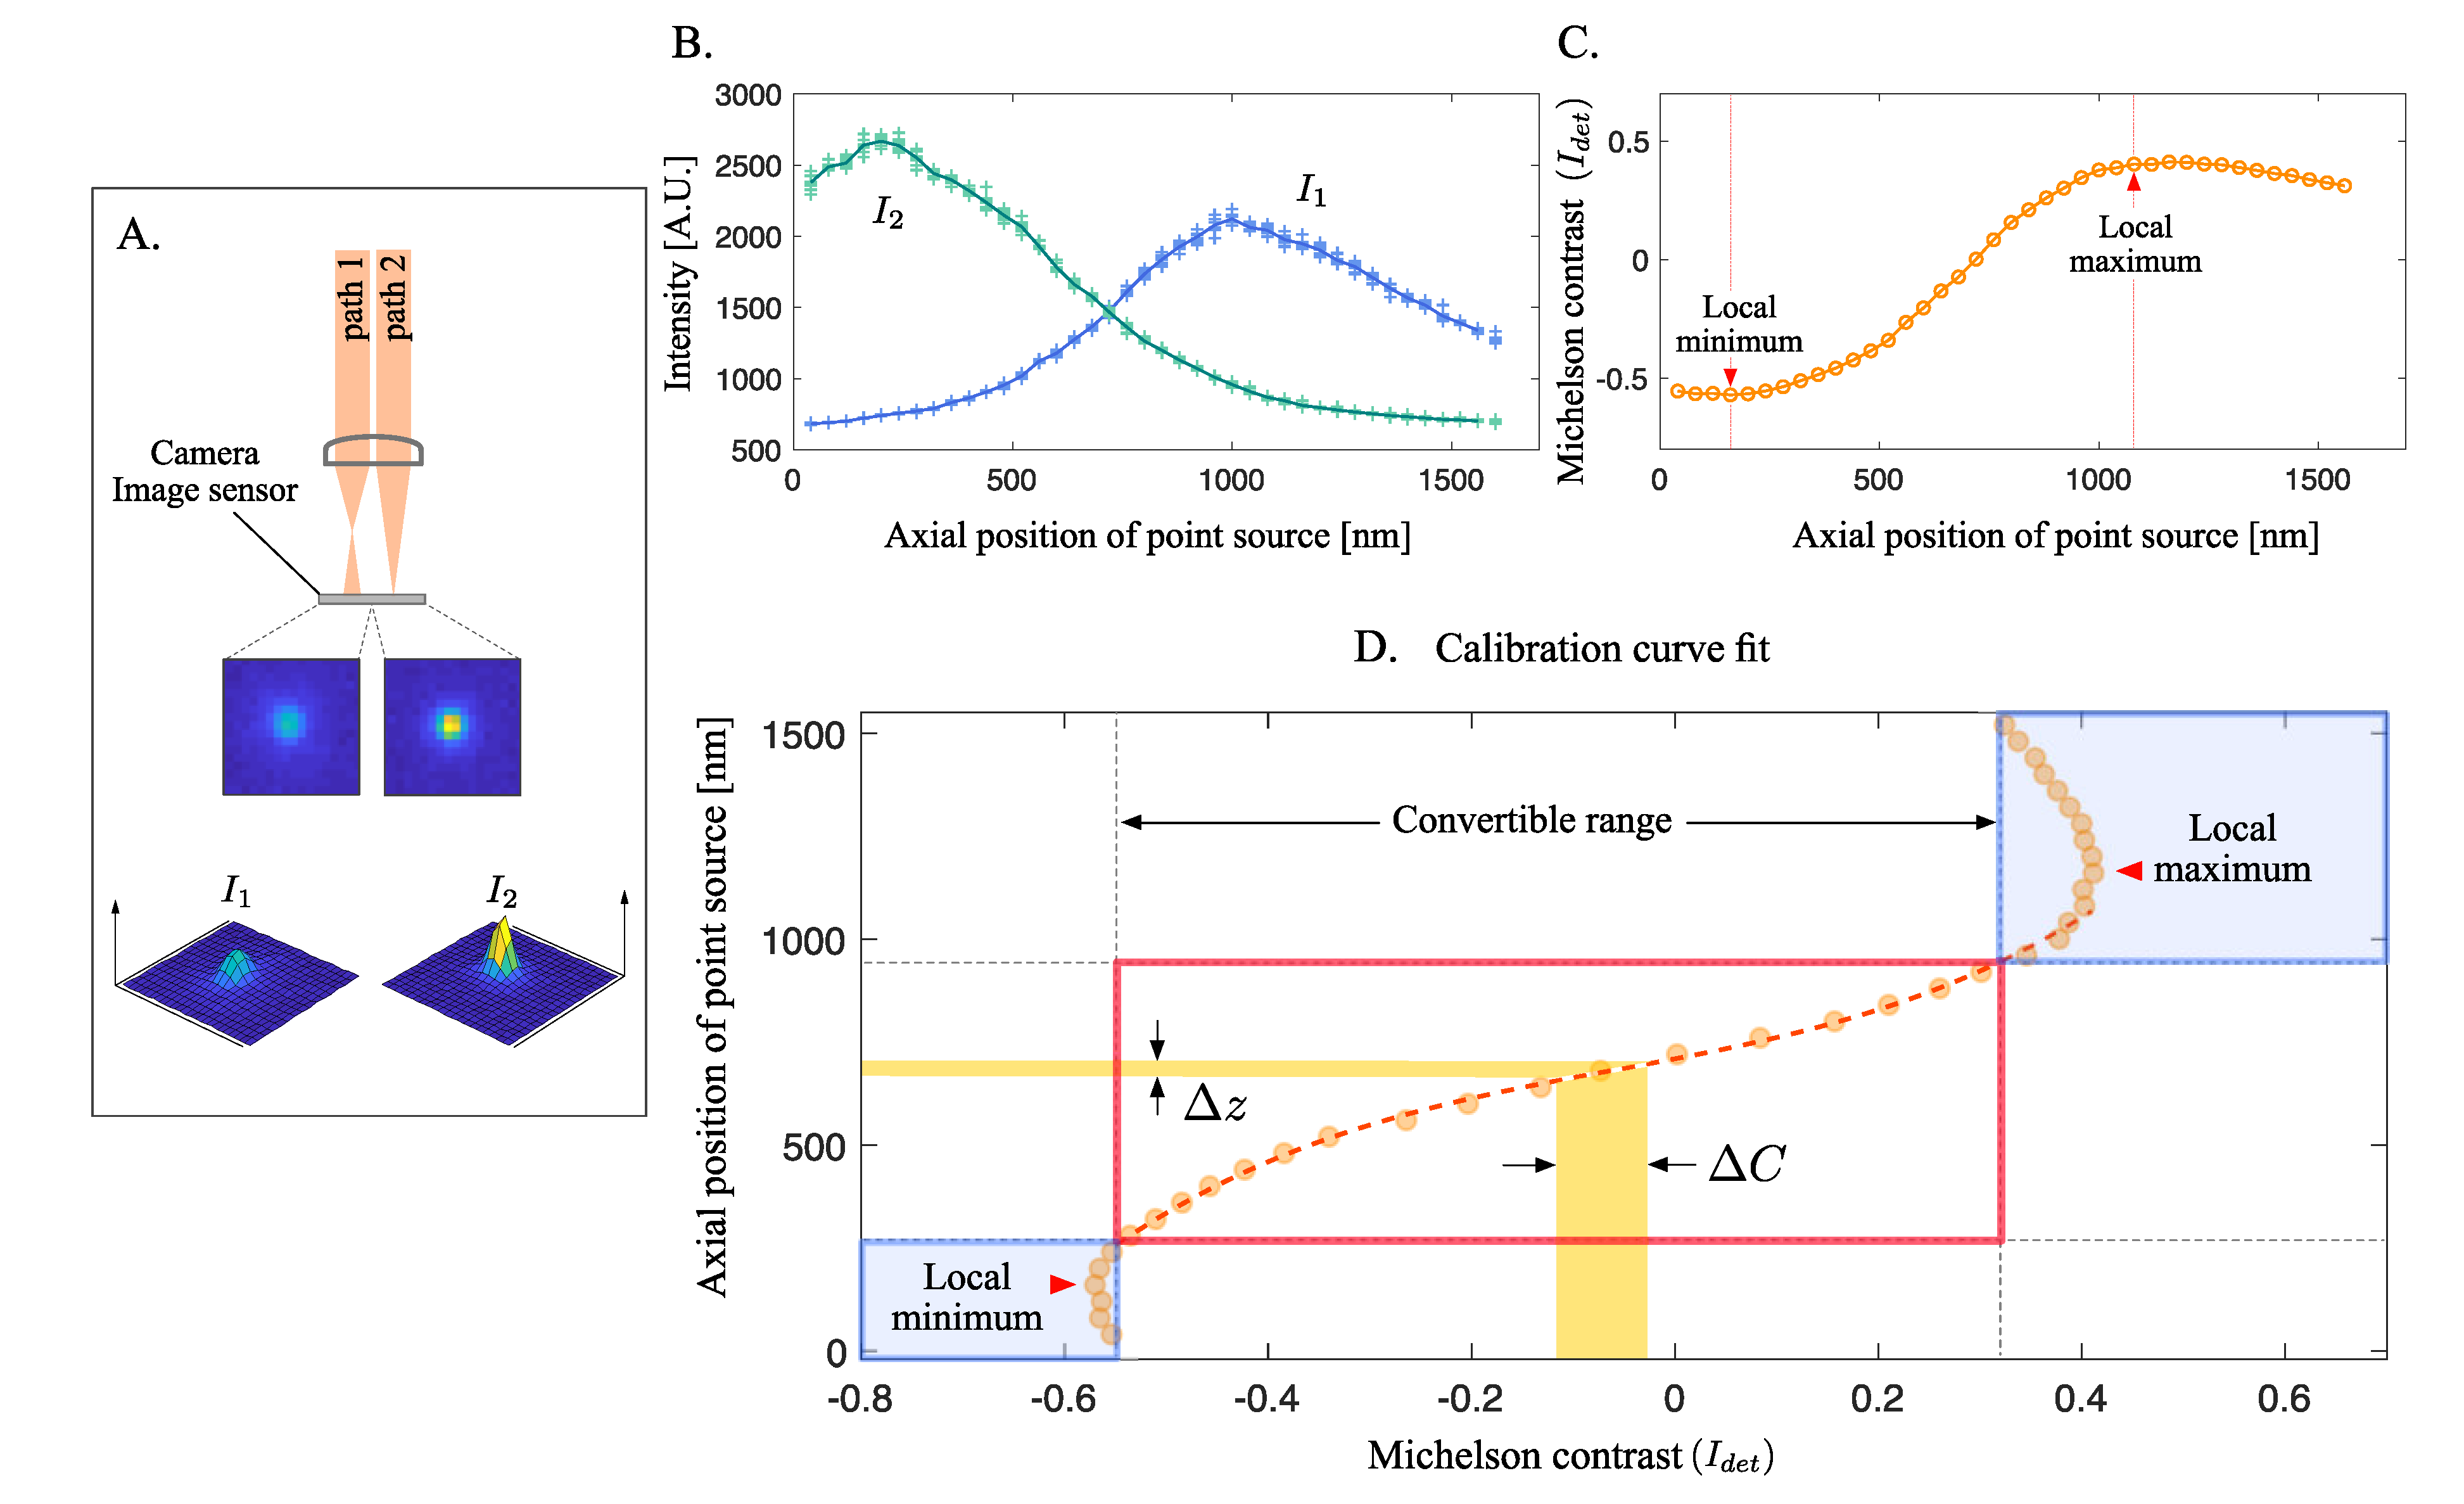
2.3. Refinement on Calibration Curve

Practically speaking, however, this is not the end of the story about trackable range. In fact, the calibration for dual-focus optics should be conducted in a smaller range than the trackable range shown in Figure 3C. This is due to the I d e t values existing outside the local minimum and local maximum. Since the lookup table for the ratiometric method localizes the axial position of the target point source using I d e t value by inverting a graph such as that shown in Figure 3B, identical I d e t value that redirects to multiple axial positions of the point source implies the failure of the calibration.
Figure 4 describes the actual experiment results obtained using the dual-focus optics, for an experiment conducted using 100 nm-diameter beads (Thermo Fisher Scientific, Waltham, MA, USA). As shown in Figure 4A, two different optical paths that were adjusted to have different focal lengths generated two images with different intensity profiles. The changes in I 1 and I 2 in response to the point source axial position could be obtained in a similar manner to the simulation results, as shown in Figure 4B,C. The calibration curve, which acts as the lookup table for the ratiometric method, could be prepared by inverting the I d e t graph over axial position of the point source, as shown in Figure 4D. For example, if the graph shown in Figure 4C is expressed as z = f ( I d e t ) where z represents the axial coordinate and f indicates the function mapping I d e t to z, the calibration curve illustrated in Figure 4D can be described as I d e t = f 1 ( z ) .
The reason why the entire region between the local minimum and maximum of I d e t cannot be directly utilized as a calibration curve is apparent from Figure 4D. The inverse plot of the z I d e t curve does not monotonously change in all sections. When the I d e t value is either too small or too large, a single value cannot determine a specific axial position. For example, a value of 0.4 for I d e t simultaneously corresponds to two different z values, i.e., approximately 1000 nm and 1300 nm. Since I d e t in the blue-colored areas fits to multiple axial positions, the practically convertible range in calibration curve should exclude such areas, to achieve proper functionality. Therefore, the calibration curve should be defined within the convertible range, where a single I d e t value corresponds to one point-source axial position only, as indicated by the red box in Figure 4D.

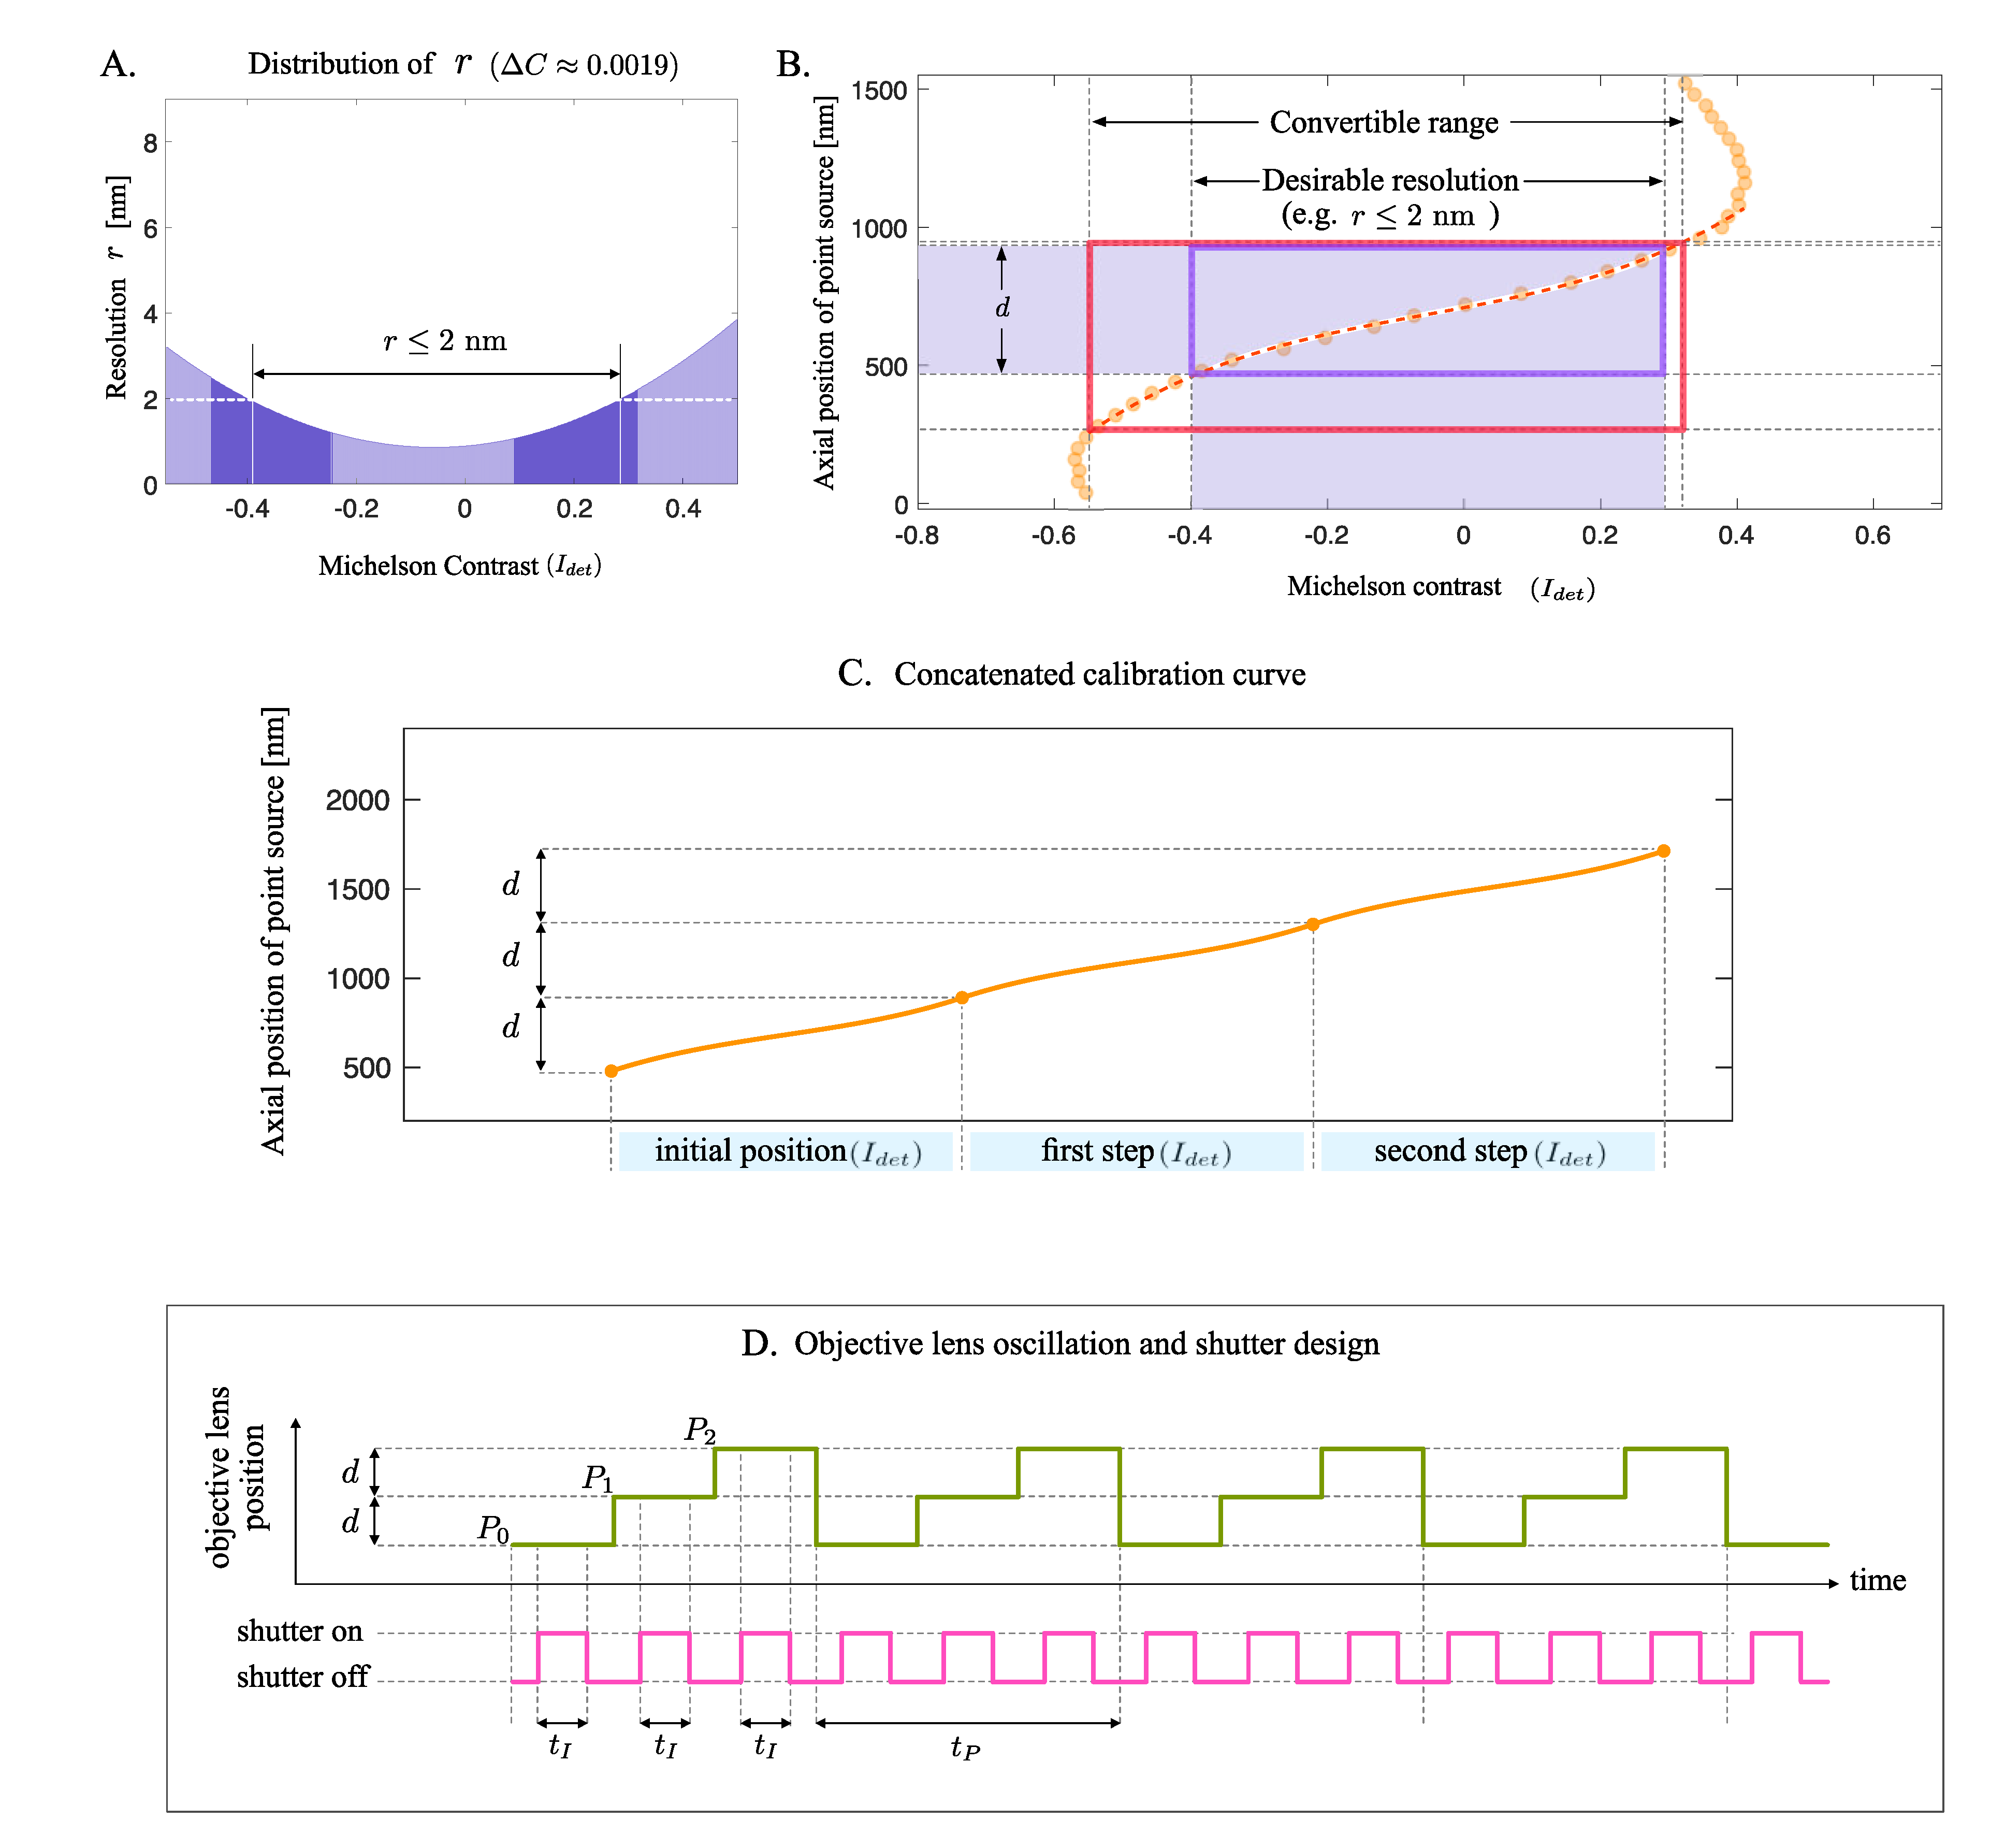
2.4. Calibration Resolution Concept

Although it is now clear that the calibration curve for the ratiometric method can be prepared as a functioning lookup table within the convertible range as described in the previous section, the entire region in the convertible range does not guarantee uniform level of detection errors. This stems from the nature of the polynomial fit for the calibration curve, where a small change in the axial position of the point source z is not proportional to the change in I d e t . As shown by the yellow rectangles in Figure 4D, the identical intervals of Δ C were not always converted to identically sized Δ z , along with the local third-order polynomial fit (the dashed line indicates an R-squared value of 0.9985).
In order to investigate the accuracy distribution in the convertible range of the calibration curve, we can define the resolution of the plot, r, as Δ z for the identical Δ C , as shown in Equation (1).
r = Δ z = g ( I d e t , Δ C )
where g represents the function mapping Δ C to Δ z defined by the acquired calibration curve, which essentially changes according to the value of I d e t . The r distribution in the convertible range is closely related to the differential of the calibration plot. For instance, as shown in Figure 4D, a relatively large change in Δ C near the position where I d e t was between −0.2 and 0 returned a small change in Δ z , especially compared to the other areas in the convertible range. Smaller change in Δ z represented low value of r, which refers to the robustness in the conversion accuracy. Therefore, users could further refine the convertible range of the calibration curve to acquire finer accuracy in the conversion calculation, based on the size of the error allowable for their specific particle tracking task.
One more fact we needed to consider when calculating the resolution r is that the value Δ C largely depended on the measurement precision of I d e t in the calibration curve, which could be theoretically estimated from the image resolution achieved for the two different focal planes. For example, if the image was taken with 8-bit resolution, the resolution of the I d e t value was approximately 1 2 9 , as a reciprocal of the possible maximum value of the denominator value, 2 8 + 2 8 , in the I d e t equation. Similarly, 14-bit images produced approximately 1 2 15 precision from a technical perspective.

2.5. Imaging Position Step Determination

Using the concept of calibration resolution r, it was possible to further refine the convertible range, according to the desired scale of detection accuracy. For simplicity, provided that the image resolution acquired from the experiment was 8-bit ( Δ C 0.0019 ), the distribution of r with respect to the entire convertible area was as shown in Figure 5A. As expected from the shape of the calibration curve shown in in Figure 4D, the resolution r had a smaller value near 0, and it increased with increasing absolute value of I d e t . Therefore, according to the scale of the desirable resolution, users could adjust the actual convertible range of the calibration curve. For instance, if the detection error size should be smaller than 2 nm, the convertible range of the lookup table must be reduced to the I d e t value range of approximately −0.4 and 0.3, as illustrated by the violet box in Figure 5B. Therefore, only within the final convertible range of I d e t reflecting the desirable scale of calibration resolution determined the accurate axial position of the target point source, which led to the definition of practically detectable range of d.
Since the distance d that spans the detectable region with desirable accuracy could now be determined, it was possible to extend the depth of the imaging range by oscillating the objective lens. For example, as shown in Figure 5C, the lookup table for dual-focus optics could be drawn to span the axial range of 3d, where 2 nm of detection resolution was guaranteed, by concatenating three calibration curves. In this case, the objective lens, the initial axial position of which was located at P 0 , oscillated as following a two-stage step function with the amplitude of d, as shown in Figure 5D.

3. Results

To apply the focal plane spacing parameter ϵ and the imaging position step parameter d acquired in previous section to a practical dual-focus imaging system, a vesicle tracking experiment was conducted using a living cell. As a representative case of vesicle movement involving travel along a relatively long axial range, a vesicle internalizing into the cytoplasmic area from the bottom of the cellular membrane was selected and tracked.

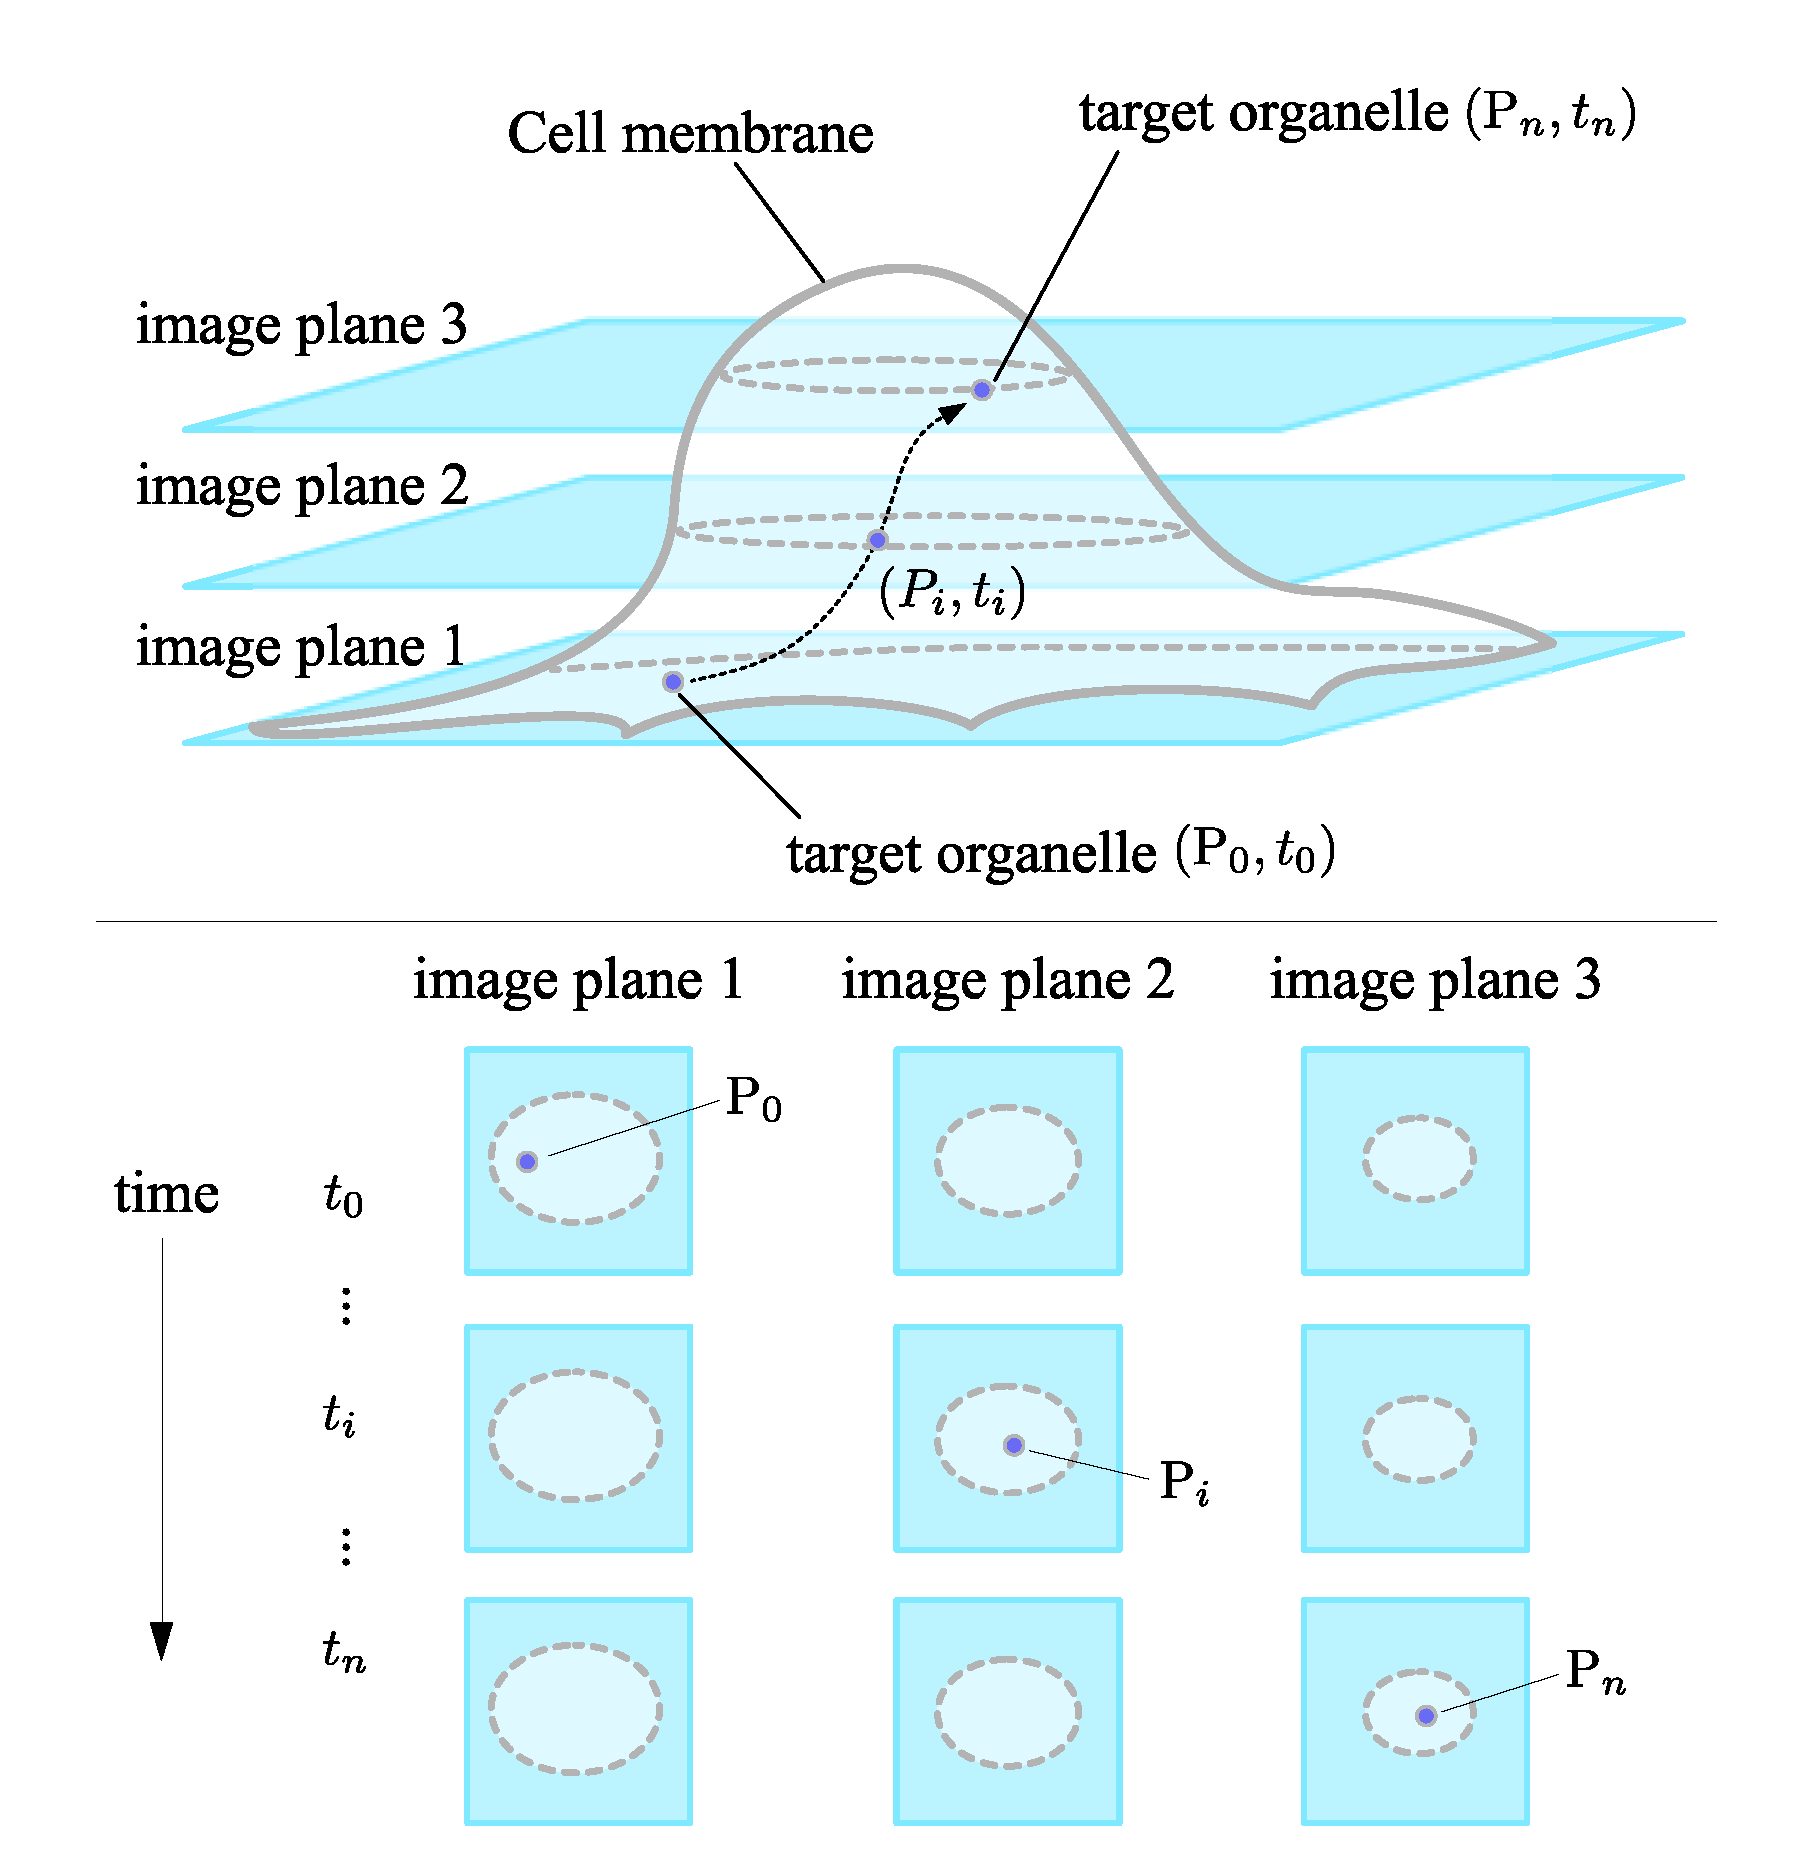
3.1. Vesicle Tracking in Living Cell

In the experiment, a KPL-4 human breast cancer cell line [20], which was kindly provided by Dr. Kurebayashi (Kawasaki Medical School, Kurashiki, Japan), was utilized. To label the endocytic vesicle, 4 nM of carboxylate-functionalized quantum dots (Thermo Fisher Scientific, Inc., Massachusetts, United States), which are frequently exploited as a living-cell biomarkers [21,22,23,24], were added to cells. The cells were then incubated at 37 °C with 5% of CO 2 for 10 min. After the incubation, the cells were washed once with Phosphate-Buffered Saline (PBS) solution and immediately subjected to fluorescent imaging using microscope (IX70, Olympus, Tokyo, Japan) with 60× of oil-immersion objective lens (Olympus PlanApo, NA 1.42). The conditions of 37 °C and 5% of CO 2 were maintained using a heat chamber (TOKAI HIT Co., Ltd., Japan). The images were captured by the dual-focus optics [10], with the focal spacing parameter ϵ , by adjusting the focal length of either optical path before collected by an electric multiplying charge coupled device (EMCCD) camera image sensor (Andor iXon 885, 1004×1002, 14-bit, Belfast, Northern Ireland). Since 1 μ m was the most appropriate value as focal spacing parameter from the simulation result, ϵ was set to 1 μ m in the imaging experiment.

3.2. Extension of Trackable Axial Range

To extend the imaging axial range, the objective lens was required to oscillate in vertical direction. To achieve this, the objective lens used in the imaging was mounted on a piezo actuator (FL201V-C, THK Precision Co., Ltd., Tokyo, Japan), the oscillation of which was programmed using a Power Lab system (ADI Instruments, Sydney, Australia). Since the imaging position step, d, was determined to be 500 nm for a desired calibration resolution of ≤2 nm, as shown in the previous section, the objective lens oscillation amplitude was set to 500 nm. With this amplitude, the piezo actuator was designed to move according to a two-stage step function, as shown in Figure 5D. The frequency of the shutter controlling the incident laser was adjusted to only collect the light when the objective lens was stable at the desired positions. Considering the response time between the piezo input and sensor monitor, the frequency of imaging (1/ t P ), was set to 10 Hz, and the shutter exposure time t I was set to 15 ms.

3.3. Imaging of Endocytic Vesicle

Based on the presented objective lens oscillation system for dual-focus optics with the determined ϵ and d, a vesicle internalized from the bottom cellular membrane to the cytoplasmic area was successfully tracked, as shown in Figure 6. As described in Figure 6A, the target vesicle was firstly detected near the lowest focal plane, P 0 , and had traveled quickly along axial direction at 8 s. At that moment, although the vesicle could be simultaneously detected when the objective lens was at P 0 and at P 1 , the I d e t calculated at the first step P 1 was adopted to compute the axial position. This is because the I d e t evaluated at P 0 deviated from the range of desirable accuracy, as shown in Figure 6B. Between 8 s and 11 s, the axial position of the target vesicle was stably trackable using the images taken at P 1 , with an error range smaller than 2 nm. After approximately 11 s, the vesicle could be more accurately detected utilizing the images taken at the imaging position P 2 . The trajectory of the vesicle movement reconstructed in three dimensions was as shown in Figure 6C. The z coordinates of the target vesicle were collected by concatenating the three data sets of axial positions, the I d e t values of which were within the range of the desirable accuracy. Therefore, the vesicle trajectory acquired in this example can be considered to be highly accurate, in terms of the lookup table conversion error in the ratiometric method. Note also that tracking using a conventional dual-focus optics is likely to fail after 8 s, when I d e t begins to stray from the designated accuracy range.

4. Discussion

The three-dimensional position of intracellular organelles in living cells contains crucial information to understand biological system, such as the interaction between the vesicles and cytoskeletal network [25,26]. Since the depth of living cell is larger than the axial region that conventional biplane microscopy can usually cover, extension of trackable range with fine detection resolution is required, in the case where users adopt biplane imaging method for the simplicity of the system. In the present work, we extended the depth of trackable range of bifocal microscopy by combining the ratiometric method of dual-focus optics and objective lens oscillation. For appropriate application of the suggested method, the aspects that users should consider are the speed of the piezo actuator on which the objective lens is mounted, which determines the imaging frequency, and the speed of the target particle. Vesicles are mostly transported by cytoskeletons; the speeds of an endocytic vesicle on microtubules by dynein and on actin filaments by myosin VI in vivo are 1 μ m /s and less than 60 nm/s, respectively [27,28,29,30,31,32]; Therefore, an imaging frequency of approximately 10 Hz or higher can prevent users from misinterpreting or missing the target vesicle in the cell.
One of the major benefits of the extended dual-focus imaging method is that the advantages of robustness in detection performance of ratiometric method is preserved. As the conventional dual-focus optics features simplicity in calculation with no computation load unlike those encountered in parametric methods, the proposed method also exploits this simplicity, by directly implementing the process of conventional dual-focus optics scheme.
Additionally, extending the axial range by oscillating the objective lens does not cause additional intensity loss, which is inevitable in many multiplane imaging systems, because of splitting optical paths and introducing relay lenses [33]. Since the intensity issue is critical for vesicle tracking tasks in the field of live cell imaging, in which the intensities of the biomarkers attached to the target particle are not always captured with sufficient photons [34,35], conserving the quantity of photons in each image plane makes the suggested method promising for various live cell imaging conditions. Therefore, with the proposed method, it is expected that small vesicles which are not detectable in other multiplane imaging systems can be captured and tracked. Hence, a large dataset of vesicle trajectories in a single cell could be constructed, for further analysis using, for example, a machine learning approach [36].
Furthermore, the expandability can be considered to be another merit of the proposed method. Although we presented an example of a vesicle that traveled along an axial range of approximately from 0 μ m to 2 μ m in axial range as an example case, it is possible to expand the trackable range, simply by adding more steps in the objective lens oscillation. Since the desired detection accuracy range on the calibration curve can be determined based on the suggested concept of conversion resolution, users can easily customize the extended dual-focus imaging method according to their required depth and desirable localization accuracy.

5. Conclusions

In this work, we suggested an extended dual-focus imaging microscopy system that combines the ratiometric method of dual-focus optics approach and the objective lens oscillation. The main concept of this proposed method is simply that a pair of biplane images are recorded multiple times in accordance with the axial movement of the objective lens. Our work can be interpreted as the first attempt to clarify and overcome the limitation of conventional biplane method with the detailed analysis of detection resolution and range. As a result, we showed an improved ratiometric-based dual-focus imaging system covering longer axial range with fine resolution simultaneously. To best utilize the robustness in detection of the ratiometric method, the distance between two focal planes employed at the same time and the amplitude of the objective lens oscillation were determined as the prerequisite parameters for construction of the imaging system. To do this, the focal spacing was determined from a point source microscope simulation, so as to secure the largest range for the calibration between the intensity ratios and axial position. Further, the objective lens amplitude was estimated as the modified axial range of the calibration curve, which can be regulated by the user according to the desired detection error. As a representative application of the imaging experiment using the proposed method, an endocytic vesicle in KPL-4 human breast cancer cell labeled by quantum dot was successfully tracked for a long axial range.
As a future work, based on the suggested imaging method, we plan to collect a large dataset of endocytic vesicle movements, so as to analyze the pattern of long-range endocytosis in conjunction with the movement characteristics of the motor proteins.

Author Contributions

Conceptualization, S.L., H.K., and H.H.; methodology, H.K.; software, S.L. and H.K.; formal analysis, S.L. and H.K.; investigation, S.L., H.K., and H.H.; data curation, S.L.; writing—original draft preparation, S.L.; writing—review and editing, S.L., H.K., and H.H.; visualization, S.L.; supervision, H.H. All authors have read and agreed to the published version of the manuscript.

Funding

This research was funded by Grants-in-Aid for Research Activity start-up (19K23717) and Grant-in-Aid for Early-Career Scientists (20K15753) from Japan Society for the Promotion of Science.

Conflicts of Interest

The authors declare no conflict of interest.

References

  1. Boulaiz, H.; Alvarez, P.J.; Ramirez, A.; Marchal, J.A.; Prados, J.; Rodríguez-Serrano, F.; Perán, M.; Melguizo, C.; Aranega, A. Nanomedicine: Application areas and development prospects. Int. J. Mol. Sci. 2011, 12, 3303–3321. [Google Scholar] [CrossRef] [Green Version]
  2. Ray, A.; Mitra, A.K. Nanotechnology in Intracellular Trafficking, Imaging, and Delivery of Therapeutic Agents. In Emerging Nanotechnologies for Diagnostics, Drug Delivery and Medical Devices; Elsevier: Amsterdam, The Netherlands, 2017; pp. 169–188. [Google Scholar]
  3. Lee, S.; Kim, H.; Higuchi, H. Focus stabilization by axial position feedback in biomedical imaging microscopy. In Proceedings of the Sensors Applications Symposium (SAS), IEEE, Seoul, Korea, 12–14 March 2018; pp. 1–6. [Google Scholar]
  4. Ando, D.; Korabel, N.; Huang, K.C.; Gopinathan, A. Cytoskeletal network morphology regulates intracellular transport dynamics. Biophys. J. 2015, 109, 1574–1582. [Google Scholar] [CrossRef] [PubMed] [Green Version]
  5. Bálint, Š.; Vilanova, I.V.; Álvarez, Á.S.; Lakadamyali, M. Correlative live-cell and superresolution microscopy reveals cargo transport dynamics at microtubule intersections. Proc. Natl. Acad. Sci. USA 2013, 110, 3375–3380. [Google Scholar] [CrossRef] [PubMed] [Green Version]
  6. Zhou, Y.; Handley, M.; Carles, G.; Harvey, A.R. Advances in 3D single particle localization microscopy. APL Photonics 2019, 4, 060901. [Google Scholar] [CrossRef] [Green Version]
  7. Prabhat, P.; Ram, S.; Ward, E.S.; Ober, R.J. Simultaneous imaging of different focal planes in fluorescence microscopy for the study of cellular dynamics in three dimensions. IEEE Trans. Nanobiosci. 2004, 3, 237–242. [Google Scholar] [CrossRef] [PubMed] [Green Version]
  8. Dehmelt, L.; Bastiaens, P.I. Spatial organization of intracellular communication: Insights from imaging. Nat. Rev. Mol. Cell Biol. 2010, 11, 440. [Google Scholar] [CrossRef]
  9. Deschout, H.; Zanacchi, F.C.; Mlodzianoski, M.; Diaspro, A.; Bewersdorf, J.; Hess, S.T.; Braeckmans, K. Precisely and accurately localizing single emitters in fluorescence microscopy. Nat. Methods 2014, 11, 253. [Google Scholar] [CrossRef]
  10. Toprak, E.; Balci, H.; Blehm, B.H.; Selvin, P.R. Three-dimensional particle tracking via bifocal imaging. Nano Lett. 2007, 7, 2043–2045. [Google Scholar] [CrossRef] [Green Version]
  11. Watanabe, T.M.; Sato, T.; Gonda, K.; Higuchi, H. Three-dimensional nanometry of vesicle transport in living cells using dual-focus imaging optics. Biochem. Biophys. Res. Commun. 2007, 359, 1–7. [Google Scholar] [CrossRef]
  12. Lee, S.; Kim, H.; Higuchi, H. Numerical method for vesicle movement analysis in a complex cytoskeleton network. Opt. Express 2018, 26, 16236–16249. [Google Scholar] [CrossRef]
  13. Lee, S.; Higuchi, H. 3D rotational motion of an endocytic vesicle on a complex microtubule network in a living cell. Biomed. Opt. Express 2019, 10, 6611–6624. [Google Scholar] [CrossRef] [PubMed]
  14. Velmurugan, R.; Chao, J.; Ram, S.; Ward, E.S.; Ober, R.J. Intensity-based axial localization approaches for multifocal plane microscopy. Opt. Express 2017, 25, 3394–3410. [Google Scholar] [CrossRef] [PubMed] [Green Version]
  15. Kirshner, H.; Aguet, F.; Sage, D.; Unser, M. 3-D PSF fitting for fluorescence microscopy: Implementation and localization application. J. Microsc. 2013, 249, 13–25. [Google Scholar] [CrossRef] [PubMed] [Green Version]
  16. Quammen, C.W.; Richardson, A.C.; Haase, J.; Harrison, B.D.; Taylor, R.M.; Bloom, K.S. FluoroSim: A visual problem-solving environment for fluorescence microscopy. In Eurographics Workshop on Visual Computing for Biomedicine; NIH Public Access: Bethesda, MD, USA, 2008; Volume 2008, p. 151. [Google Scholar]
  17. Kruth, H.S.; Jones, N.L.; Huang, W.; Zhao, B.; Ishii, I.; Chang, J.; Combs, C.A.; Malide, D.; Zhang, W.Y. Macropinocytosis is the endocytic pathway that mediates macrophage foam cell formation with native low density lipoprotein. J. Biol. Chem. 2005, 280, 2352–2360. [Google Scholar] [CrossRef] [PubMed] [Green Version]
  18. Franke, C.; Sauer, M.; van de Linde, S. Photometry unlocks 3D information from 2D localization microscopy data. Nat. Methods 2017, 14, 41. [Google Scholar] [CrossRef] [Green Version]
  19. Michelson, A.A. Studies in Optics; Courier Corporation: North Chelmsford, MA, USA, 1995. [Google Scholar]
  20. Kurebayashi, J.; Otsuki, T.; Tang, C.; Kurosumi, M.; Yamamoto, S.; Tanaka, K.; Mochizuki, M.; Nakamura, H.; Soono, H. Isolation and characterization of a new human breast cancer cell line, KPL-4, expressing the Erb B family receptors and interleukin-6. Br. J. Cancer 1999, 79, 707. [Google Scholar] [CrossRef] [Green Version]
  21. Zhang, L.W.; Monteiro-Riviere, N.A. Mechanisms of quantum dot nanoparticle cellular uptake. Toxicol. Sci. 2009, 110, 138–155. [Google Scholar] [CrossRef] [Green Version]
  22. Xiao, Y.; Forry, S.P.; Gao, X.; Holbrook, R.D.; Telford, W.G.; Tona, A. Dynamics and mechanisms of quantum dot nanoparticle cellular uptake. J. Nanobiotechnol. 2010, 8, 13. [Google Scholar] [CrossRef] [Green Version]
  23. Ong, L.C.; Ang, L.Y.; Alonso, S.; Zhang, Y. Bacterial imaging with photostable upconversion fluorescent nanoparticles. Biomaterials 2014, 35, 2987–2998. [Google Scholar] [CrossRef]
  24. Park, Y.I.; Lee, K.T.; Suh, Y.D.; Hyeon, T. Upconverting nanoparticles: A versatile platform for wide-field two-photon microscopy and multi-modal in vivo imaging. Chem. Soc. Rev. 2015, 44, 1302–1317. [Google Scholar] [CrossRef]
  25. Bergman, J.P.; Bovyn, M.J.; Doval, F.F.; Sharma, A.; Gudheti, M.V.; Gross, S.P.; Allard, J.F.; Vershinin, M.D. Cargo navigation across 3D microtubule intersections. Proc. Natl. Acad. Sci. USA 2018, 115, 537–542. [Google Scholar] [CrossRef] [PubMed] [Green Version]
  26. Verdeny-Vilanova, I.; Wehnekamp, F.; Mohan, N.; Álvarez, Á.S.; Borbely, J.S.; Otterstrom, J.J.; Lamb, D.C.; Lakadamyali, M. 3D motion of vesicles along microtubules helps them to circumvent obstacles in cells. J. Cell Sci. 2017, 130, 1904–1916. [Google Scholar] [CrossRef] [PubMed] [Green Version]
  27. Ross, J.L.; Ali, M.Y.; Warshaw, D.M. Cargo transport: Molecular motors navigate a complex cytoskeleton. Curr. Opin. Cell Biol. 2008, 20, 41–47. [Google Scholar] [CrossRef] [PubMed] [Green Version]
  28. Granger, E.; McNee, G.; Allan, V.; Woodman, P. The role of the cytoskeleton and molecular motors in endosomal dynamics. In Seminars in Cell & Developmental Biology; Elsevier: Amsterdam, The Netherlands, 2014; Volume 31, pp. 20–29. [Google Scholar]
  29. Zajac, A.L.; Goldman, Y.E.; Holzbaur, E.L.; Ostap, E.M. Local cytoskeletal and organelle interactions impact molecular-motor-driven early endosomal trafficking. Curr. Biol. 2013, 23, 1173–1180. [Google Scholar] [CrossRef] [Green Version]
  30. Masters, T.A.; Buss, F. Filopodia formation and endosome clustering induced by mutant plus-end–directed myosin VI. Proc. Natl. Acad. Sci. USA 2017, 114, 1595–1600. [Google Scholar] [CrossRef] [Green Version]
  31. Milo, R.; Phillips, R. Cell Biology by The Numbers; Garland Science: New York, NY, USA, 2016. [Google Scholar]
  32. Tumbarello, D.A.; Kendrick-Jones, J.; Buss, F. Myosin VI and its cargo adaptors–linking endocytosis and autophagy. J. Cell Sci. 2013, 126, 2561–2570. [Google Scholar] [CrossRef] [Green Version]
  33. von Diezmann, A.; Shechtman, Y.; Moerner, W. Three-dimensional localization of single molecules for super-resolution imaging and single-particle tracking. Chem. Rev. 2017, 117, 7244–7275. [Google Scholar] [CrossRef]
  34. Fischer, R.S.; Wu, Y.; Kanchanawong, P.; Shroff, H.; Waterman, C.M. Microscopy in 3D: A biologist’s toolbox. Trends Cell Biol. 2011, 21, 682–691. [Google Scholar] [CrossRef] [Green Version]
  35. Magidson, V.; Khodjakov, A. Circumventing photodamage in live-cell microscopy. In Methods in Cell Biology; Elsevier: Amsterdam, The Netherlands, 2013; Volume 114, pp. 545–560. [Google Scholar]
  36. Lee, S.; Kim, H.; Ishikawa, M.; Higuchi, H. 3D Nanoscale Tracking Data Analysis for Intracellular Organelle Movement using Machine Learning Approach. In Proceedings of the 2019 International Conference on Artificial Intelligence in Information and Communication (ICAIIC), IEEE, Okinawa, Japan, 11–13 February 2019; pp. 181–184. [Google Scholar]
Figure 1. Sample movement of an intracellular organelle in three dimensions. In a conventional imaging microscopy system in which a single image plane is exploited, the accurate position information on the target organelle can be lost when it leaves the image plane. For example, the position of target organelle, P i at t i and P n at t n can hardly be imaged with image plane 1. P 0 , P i and P n indicate the position information at time t 0 , t i and t n , respectively.
Applsci 10 06243 g001
Figure 2. Overall concept of combined dual-focus optics with objective lens oscillation. (A) Schematics of optical path and objective lens-mounted piezo actuator system. For dual-focus optics in fluorescence microscopy, light reflected from the labeled organelle in the sample cell is divided by two optical paths having different focal lengths, adjusted by the position of relay lenses [11]. The difference in focal length created by the lens position determines the distance ϵ . The distance d is determined by the axial position of objective lens, the step size of which can be controlled by an external controller; (B) Cell images taken at each imaging positions for ϵ = d = 1.0 μ m .
Applsci 10 06243 g002
Figure 3. Simulation for evaluating the trackable range of point source (100 nm-diameter) with respect to various ϵ values. (A) Concept of the ϵ spacing between two focal planes. The Michelson contrast ( I d e t ) is utilized for the ratiometric method, by comparing the Gaussian peak of the intensity distribution on each focal plane; (B) I d e t calculated with various ϵ , changed from 200 nm to 1500 nm; (C) Trackable range can be determined based on the distance between local minimum and local maximum.
Applsci 10 06243 g003
Figure 4. Convertible range of calibration curve acquired by Michelson contrast in dual-focus optics. (A) Acquisition of Gaussian peak intensities, I 1 and I 2 , from the images of point source on two different focal planes; (B) Changes in I 1 and I 2 during experiment; (C) I d e t for each target axial position; (D) Calibration curve between I d e t and axial coordinate z position as an inverse plot of (C). The convertible range of the calibration curve is restricted by the area in which the I d e t value corresponds to only a single z-position value in the inverse plot (indicated by the red box), which excludes the blue-colored areas where I d e t can have multiple possible axial positions. The dashed line indicates a third-order polynomial fit. Δ z can express the resolution in the calibration curve when the image resolution is given as Δ C in Equation (1).
Applsci 10 06243 g004
Figure 5. (A) Distribution of calibration resolution r upon I d e t in the convertible range, for 8-bit resolution images; (B) final trackable range determined by user-defined range of calibration resolution r; (C) completed concatenated calibration curve for two-step objective lens oscillation; (D) practical imaging plan for extension of dual-focus optics trackable range. P 0 , P 1 , and P 2 indicate the position of objective lens for two-step oscillation; t I indicates the imaging time where the shutter in front of the camera sensor is open (the shutter exposure time); t P denotes the total time consumed by a single scan, which corresponds to the time interval between the same axial position of the objective lens.
Applsci 10 06243 g005
Figure 6. (A) Quantum-dot-labeled vesicle on each focal plane at three different positions of the objective lens. ROI size of each image is 17× 17 pixels. The image sets enclosed within the orange boxes were analyzed to evaluate axial position of the vesicle. Here, h 1 and h 2 represent the positions of the two focal planes according to the axial position of the objective lens: P 0 , P 1 , or P 2 ; (B) Concatenated axial positions of the vesicle over time. Only the I d e t range, which had a detection error smaller than 2 nm, was chosen to evaluate the axial position of the vesicle; (C) Vesicle trajectory reconstructed in three dimensions.
Applsci 10 06243 g006

