Abstract
This study proposes model formulae for predicting the strength of concrete by analyzing the relationships between the results of nondestructive testing (NDT) methods and the compressive strength of concrete specimens at the hardened stage. Further, NDT of concrete molds and mock-up specimens was conducted using NDT methods (rebound hammer, ultrasonic pulse velocity). The water/cement (W/C) ratios were set to 0.48, 0.41, and 0.33 to achieve concrete strengths within the compressive strength range of 24–60 MPa. The evaluation parameters included the fresh concrete properties, compressive strength (mold and core), temperature history, maturity, rebound value, and ultrasonic pulse velocity. Evaluation results indicated that the reliability of existing models, based on the rebound and ultrasonic pulse velocity, is significantly low on high-strength concrete of 40 MPa or higher, and cannot satisfy the ±20% error range. Consequently, this study proposes a regression equation of the concrete strength based on the experimental rebound and ultrasonic pulse velocity values in a 24–60 MPa range, which offers satisfactory reliability.
1. Introduction
The use of concrete facilitates the construction of buildings and structures that can withstand high compressive loads. The strength of concrete can be attributed to the formation of hydrates (i.e., solid products formed from the reaction between water and cement) that gradually fills the porosity of the material. Furthermore, the compressive strength of concrete is typically evaluated via the destructive testing of cylinder molds that are collected in the field in accordance with the relevant criteria of each country [1,2,3,4,5,6].
The strength of concrete is significantly affected by various environmental factors such as the surrounding climate, temperature, and humidity. Furthermore, during construction, various quality issues may arise, owing to factors such as temperature variation, poor compaction, and careless construction. In consideration of such problems, researchers have generally recommended measuring the compressive strength of concrete by conducting destructive tests on the concrete cores that have been extracted from structures for a more precise diagnosis [7,8,9]. The extraction of concrete cores is a useful approach for accurately estimating the compressive strength; however, this approach may lead to problems such as structural instability and the subsequent repair method.
Thus, several approaches have been developed for structural maintenance through nondestructive tests (NDT) [10,11,12,13]. Such test methods aim to evaluate the structural integrity without the need for destructive tests and primarily evaluate the surface hardness of concrete and the dangers of internal cracking. Furthermore, various studies have been conducted to nondestructively estimate the compressive strength of concrete [14,15,16,17].
Although many NDT methods are used to estimate the compressive strength of concrete, tests measuring the rebound value and ultrasonic pulse velocity are mainly used when considering the portability of equipment and ease of use. In addition, the rebound and ultrasonic methods are economical. The method based on the rebound value is referred to as an impact method, while the ultrasonic pulse velocity method is a nonimpact method.
In the context of the application of these two methods, Kazemi et al. proposed a strength estimation formula based on the rebound value [18,19,20,21,22,23], and further studies also reported improved precision in strength estimation through analytical methods [24,25,26,27]. Alwash et al. derived the relationship between the compressive strength and ultrasonic pulse velocity [28,29,30], and Phoon et al. proposed modifications considering the influence of various materials such as cement and aggregate [31,32,33,34,35].
These research results are very frequently applied to diagnose structures, as they form the basis of the building criteria laid down by the USA, Europe, Japan, and other countries; however, their reliability is still questionable. In addition, the design strengths of concrete have increased with the corresponding increase in the height of buildings, which has led to the use of various admixtures to improve the concrete strength. Therefore, the accuracy of nondestructive inspection as it relates to the assessment of concrete strength needs to improve.
In most cases, the existing NDT estimation formula is set as the result of a small mold measured in a laboratory. In the case of an actual structure, it is necessary to clearly examine the relationship thereto because it may be different from the environmental conditions of the laboratory.
Against this backdrop, herein, we propose two models for the compressive-strength estimation of concrete within a compressive-strength range of 24–60 MPa by using the rebound value and ultrasonic pulse velocity. To this end, we prepared cylinder molds and mock-up members and subjected them to NDT. In addition, we conducted destructive tests to examine the correlation with the compressive strength based on the measured values.
2. Experimental Procedure
2.1. Materials
Table 1 shows the physical properties of the used materials. The cement used was ASTM type I ordinary Portland cement (OPC, Yeongwol, Ssangyong Cement Industrial, Korea). This cement has a density of 3150 kg/m3 and a fineness of 320 m2/kg. Table 2 shows the chemical compositions of the cement used.

Table 1.
Physical properties of materials used in study.
Table 2.
Chemical composition of used cement.
Figure 1 shows the gradation sieve analysis curves of the aggregates. Washed sea sand was used as the fine aggregate (fineness modulus: 2.90, density of 2590 kg/m3, and absorption of 1.00%).
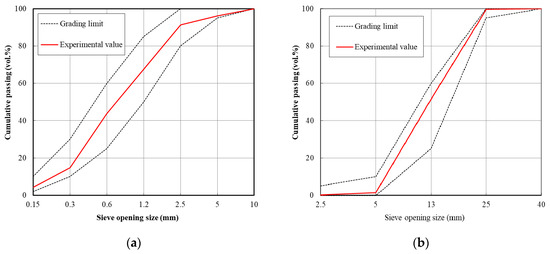
Figure 1.
Gradation sieve analysis curves of aggregates used: (a) fine aggregates; (b) coarse aggregates.
For the coarse aggregate, crushed granite aggregate was used, with a size of 25 mm, density of 2600 kg/m3, and absorption of 0.90%. To improve the workability of concrete, a polycarboxylate (PC)-based superplasticizer with retarder was used as the chemical admixture.
2.2. Experimental Design and Mix Proportions
Table 3 shows the experimental design in this study. The water/cement (W/C) ratios of concrete were set to 0.48, 0.41, and 0.33 to cover ordinary to high strengths. As for the curing of the concrete specimens, the cylinder molds were subjected to curing in room temperature of 20 ± 2 °C, humidity of 60 ± 5% for one day and subsequently water-cured. The mock-up specimens were subjected to air-curing in the outdoors.
Table 3.
Experimental design.
As for the properties on fresh concrete, the slump (mm) and air content (%) were measured immediately after mixing and after 60 min. Measurement after 60 min was performed to ensure workability in the field. In addition, a thermocouple(Ø1.6 × 3000 mm sheath + 0.65 mm2 × 1000 mm thermo shield wire, JOOSHIN, Korea) was embedded in the middle of each mock-up specimen to measure the temperature history (°C). Based on the measurement value, the maturity of concrete (D∙D) was calculated. As for the properties of hardened concrete, the compressive strength (MPa), rebound value (R), and ultrasonic pulse velocity (km/s) were evaluated to analyze their relation. The compressive strength was evaluated using the ø100 mm × 200 mm onsite-fabricated specimens and the core specimens extracted from the mock-up members.
Table 4 shows the mix proportions of concrete. To set the compressive strength of concrete in the 24–60 MPa range when the unit water content in the concrete mixes was 165 kg/m3, the cement content per unit volume was set to 340 kg/m3, 400 kg/m3, and 500 kg/m3. The slump of concrete was set to ensure workability in 180 ± 25 mm and the air content was set to 4.5 ± 1.5%.
Table 4.
Mixing proportions of concrete.
2.3. Experimental Methods
2.3.1. Casting and Curing of Concrete Specimens
For the compressive-strength specimens of concrete, we used cylinder molds with dimensions of ø100 mm × 200 mm. Figure 2 shows the formwork for fabricating the mock-up specimens and thermocouple installation for the testing of the mock-up specimens. In the case of the mock-up specimens used for core compressive strength and NDT, concrete construction was performed after fabricating a formwork with dimensions of 1000 mm (W) × 1000 mm (H) × 200 mm (T).
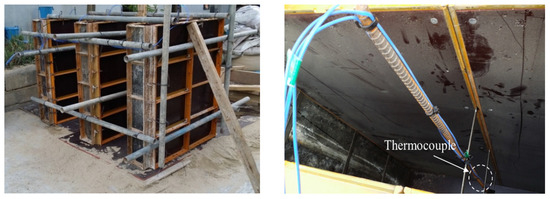
Figure 2.
Formwork and thermocouple installation for concrete mock-up testing.
As for the curing of the concrete specimens, the cylinder molds with dimensions of ø100 mm × 200 mm were demolded on day 1 and subjected to water-curing at 20 ± 2 °C until their respective ages for measurement, i.e., 3, 5, 7, 14, 21, and 28 days. The mock-up specimens were subjected to air-curing.
2.3.2. Fresh and Hardened Properties of Concrete
Table 5 shows the test methods applied for estimating the fresh and hardened properties of concrete. The slump was evaluated with ASTM C143 [36], and the air content was measured with ASTM C231 [37]. The compressive strength of concrete was evaluated using the average value of three specimens with ASTM C873 [38] and ASTM C39 [39].
Table 5.
Test methods for estimating fresh and hardened properties of concrete.
2.3.3. Temperature History and Maturity of Concrete
For temperature history of the concrete, we embedded a K-type thermocouple in the middle of each mock-up specimen, and the temperature change was measured every 10 min. The maturity of concrete was calculated based on the temperature history of concrete, which was measured with ASTM C1074 [40], using Equation (1).
where M(t) is the temperature–time factor at age t, degree days, ∆t is the time interval, days or hours, Ta is the average concrete temperature during time interval, ∆t, °C, and T0 is the datum temperature, °C.
2.3.4. Rebound Test and Ultrasonic Pulse Velocity Estimation of Concrete Specimens
Table 6 shows the test methods applied for the NDT of concrete. As a nondestructive test to estimate the compressive strength of concrete, the rebound was conducted with ASTM C805 [41]. After measuring 20 points of the specimen at each age, the average value was calculated.
Table 6.
Test methods for nondestructive testing (NDT) of concrete.
The ultrasonic pulse velocity of concrete was evaluated in accordance with ASTM C597 [42]. The equipment used was a portable ultrasonic tester (PUNDIT). The ultrasonic pulse velocity of concrete was calculated as per Equation (2).
where Vp represents the ultrasonic pulse velocity (km/s), L the distance traveled by the pulse (km), and Δt the transit time (s).
Vp = L/Δt
3. Results and Discussion
3.1. Fresh and Hardened Properties of Concrete
Table 7 shows the fresh properties of concrete. We note that the slump and air content of concrete lie within the target ranges of 180 ± 25 mm and 4.5 ± 1.5%, respectively. These parameters also met their target ranges after 60 min, decreasing only slightly.
Table 7.
Fresh properties of concrete.
Figure 3 shows the compressive strength of the concrete according to age. At the age of 28 days, the compressive strength of concrete exceeded 30 MPa for WC 48, 40 MPa for WC 41, and 60 MPa for WC 33, thereby achieving the planned range from ordinary to high strengths.
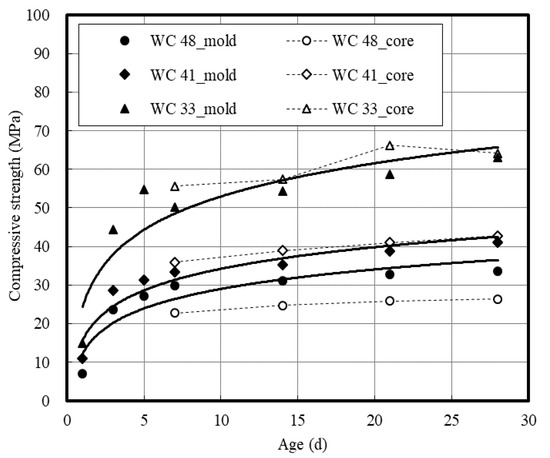
Figure 3.
Compressive strength of concrete specimens according to age.
Figure 4 shows the compressive strength relation between the cylinder molds and the core specimens. Compressive strengths of the core specimens were higher than those of the cylinder molds, except for WC 41, and were very similar for WC 33. The difference between molded and core samples was only significant for WC 48.
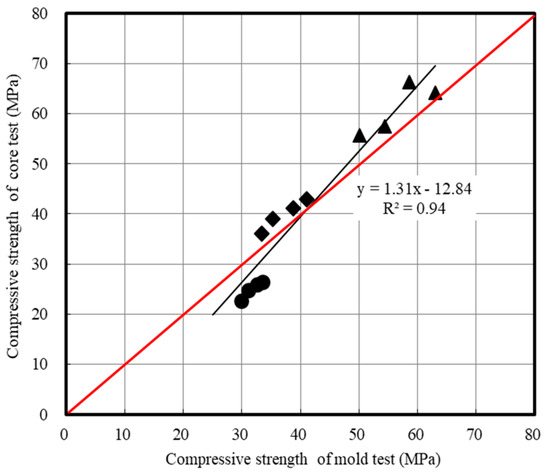
Figure 4.
Compressive strength relation between cylinder molds and core specimens.
3.2. Temperature History and Maturity of Concrete
Figure 5 shows the temperature history of concrete. We note that the temperature of concrete sharply increased in the early ages (<3 days) owing to the hydration reaction of cement, but subsequent variations were observed around room temperature. This result was expected because there is more cement per volume in a formulation with low W/C, and thus more cement to hydrate (and heat to release) per volume. Specimen WC 33 (14.5 h including 1.5 h of casting time, 48.4 °C) exhibited the highest temperature, followed by WC 41 (12 h including 3 h of casting time, 44.5 °C), and WC 48 (10 h including 6 h of casting time, 41.6 °C).
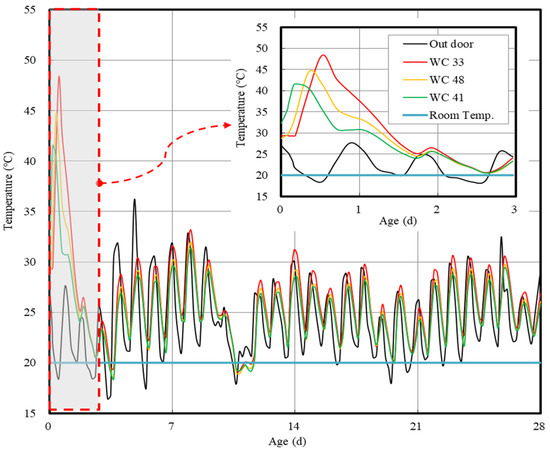
Figure 5.
Temperature history of concrete specimens, 50 mm from concrete surface.
Figure 6 shows the maturity of the concrete specimens. Here, we note that the difference in maturity due to the difference in the initial temperature history can affect the development of the concrete strength. This also can be confirmed by the observed clear tendency in the correlation between the strengths of the cylinder molds and the core specimens.
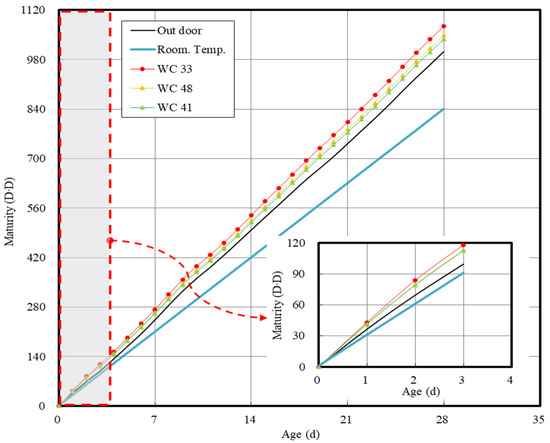
Figure 6.
Maturity result of concrete.
3.3. Results of NDT of Concrete
Figure 7 shows the rebound values of the mock-up members according to age. The rebound values of all the specimens showed a tendency to increase as the age increased. For the WC 48 and WC 41 concrete specimens, the rebound values increased by less than 10 as the age increased; however, the rebound values of all specimens showed a tendency to converge after 21 days of age. In the case of the WC 33 concrete specimen, the rebound value significantly increased until day 28.
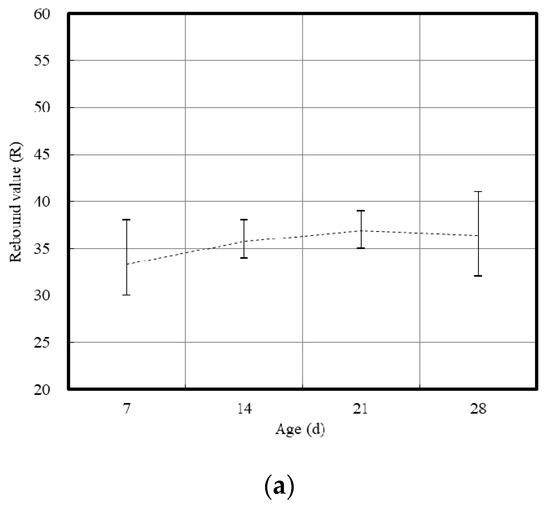
Figure 7.
Rebound value of mock-up members with age: (a) WC 48; (b) WC 41; (c) WC 33.
Figure 8 shows the ultrasonic pulse velocities of the concrete specimens according to age. The cylinder molds and core specimens exhibited a large difference between their ultrasonic pulse velocities, and the difference showed a tendency to decrease as the concrete strength increased. In addition, the ultrasonic pulse velocity increased until the interval of 7–14 days, but converged in a manner similar to that of the rebound value after 14 days. The cylinder mold specimens exhibited higher ultrasonic pulse velocities than the core specimens. This result can be attributed to the stable hydration reaction and the subsequent soundness of the internal structure caused by water-curing [43].
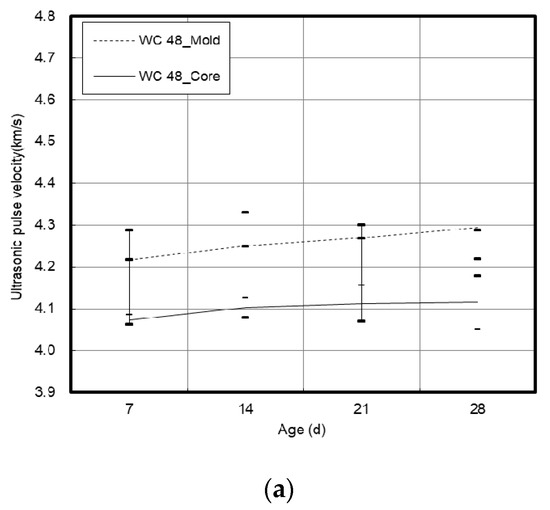
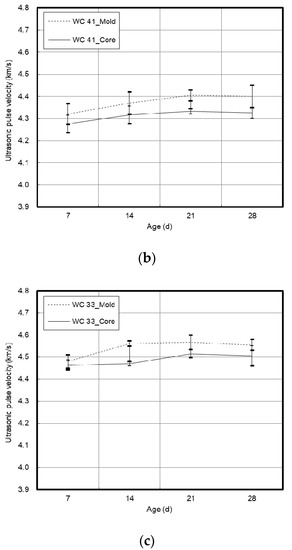
Figure 8.
Ultrasonic pulse velocity of concrete specimen with age: (a) WC 48; (b) WC 41; (c) WC 33.
3.4. Discussion on Regression Equation of Concrete Strength Based on NDT
Figure 9 shows the relation between the rebound value and ultrasonic pulse velocity of concrete. The rebound value and ultrasonic pulse velocity exhibited a nonlinear relation. The rebound value showed a tendency to significantly increase as the ultrasonic pulse velocity exceeded 4.2 km/s, which corresponds to core compressive strengths of 35 MPa or higher.
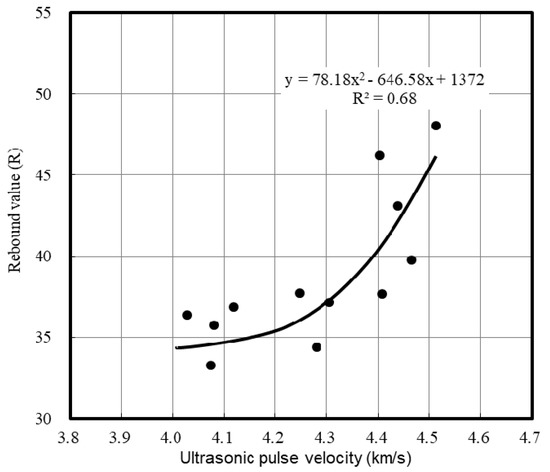
Figure 9.
Relation between rebound value and ultrasonic pulse velocity of concrete.
Figure 10 shows the relation between core and cylinder molds on ultrasonic pulse velocity. As mentioned above, the cylinder molds exhibited higher ultrasonic pulse velocities than the core specimens.
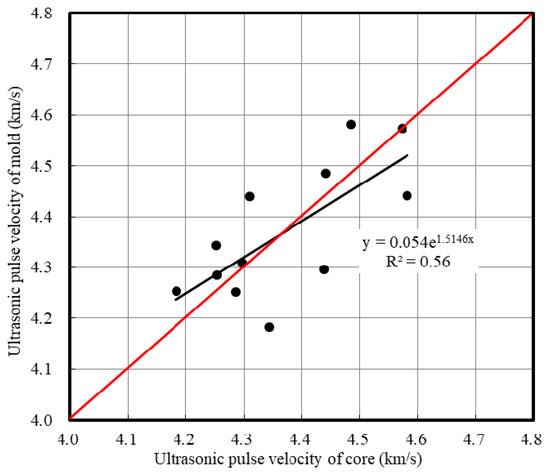
Figure 10.
Relation between core and cylinder molds of ultrasonic pulse velocity.
In this study, we found large differences in the ultrasonic pulse velocity depending on the rebound value and curing method. This result implies that the reliability of NDT may significantly vary depending on the surface condition and internal structure of the specimen undergoing testing [33,44]. In this context, Elvery et al. have reported the effects of the surface hardening of concrete and the temperature on the ultrasonic pulse velocity with the curing method [45,46]. Furthermore, factors such as the amount of aggregate and the aggregate–cement paste interface condition may also affect the ultrasonic pulse velocity [32,33]. Considering that the correlation between the rebound value and the ultrasonic pulse velocity is not high (R2 = 0.68) within the scope of this study, we proposed a regression equation for each NDT method.
Figure 11 compares the various regression equation of the compressive strength of concrete based on the rebound value. Although many studies have been conducted on the rebound value, no satisfactory results have been reported with regard to its reliability. Meanwhile, the US Army Laboratory and JASS 5 [8] proposed a model to estimate the compressive strength of concrete using the rebound value by comparing with the experiment results.
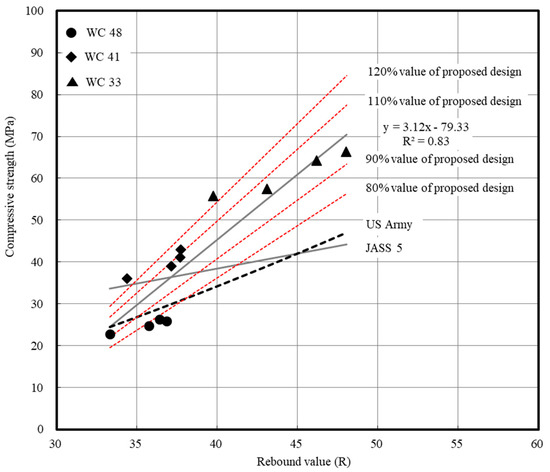
Figure 11.
Regression equation of compressive strength of concrete based on rebound value.
The proposed regression equation of previous studies can meet the ±20% error range for compressive strengths of <40 MPa, but the model reliability significantly drops for higher compressive strengths over 40 MPa. In the region of high-strength concrete of 40 MPa or more, the value by the existing estimation formula was confirmed to be a value less than 70% compared to the actual compressive strength, and the tendency was confirmed to increase with increasing strength.
Therefore, a regression equation that can predict up to a range of high-strength concrete of 40 MPa or more should be considered. Next, we proposed a regression equation of the compressive strength of concrete as per the experimental rebound values using Equation (5).
where F R, etm denotes the estimated compressive strength according to the rebound value (MPa) and R the rebound value.
US Army: F R, etm = (0.0932R2 + 8R − 120.6)/10.2
JASS 5: F R, etm = (7.3R + 100)/10.2
Proposed regression equation based on this study: F R, etm = 3.12R − 79.33
Figure 12 compares the regression equation of the compressive strength of concrete as per the ultrasonic pulse velocity. The model results include those of studies by JASS 5 [8], Pyszniak [47], Turgut [48], and Kheder [49]. It is confirmed that the existing compressive strength models based on the ultrasonic pulse velocity have low reliability, beyond the error range of ± 20%, similar to the case of the analysis results based on the rebound value. When the existing estimation formula is used, it is confirmed that the difference between the compressive strength value and the measured value increases based on the ultrasonic speed of 4.1 km/s. In addition, in the range of concrete compressive strength of 40 MPa or more, the tendency gradually increases, and it is confirmed that the value is less than 70% at 60 MPa.
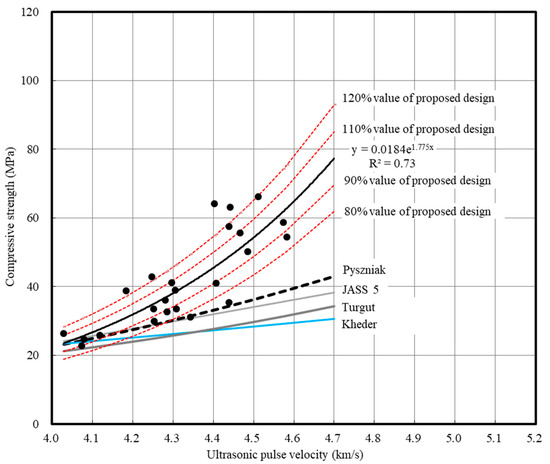
Figure 12.
Regression equation of compressive strength of concrete by ultrasonic pulse velocity.
Consequently, we proposed a regression equation of the compressive strength of concrete based on the ultrasonic pulse velocity for strengths of 40 MPa or higher, as per Equation (10).
where F R, etm denotes the estimated compressive strength according to the ultrasonic pulse velocity (MPa) and Vp the ultrasonic pulse velocity (km/s).
AIJ: F U, etm = (215Vp − 620)/10.2
Pyszniak: F U, etm = (92.5Vp2 − 508Vp + 782)/10.2
Kheder: F U, etm = 0.000012∙(1000Vp)1.7447
Turgut: F U, etm = 1.19e0.715 Vp
Proposed regression equation: F U, etm = 0.0184e1.78·Vp
The regression equation proposed in this study can ensure reliability in estimating strengths close to the measured strengths for concrete specimens in the strength range of 24–60 MPa. However, the models may have limitations, because our study utilized concrete mixes containing only cement; the model reliability can decline depending on the material properties used and the curing method. Therefore, it is necessary to acquire experimental data considering influence factors, such as aggregate and mineral admixture and the curing condition, to improve the reliability of the proposed compressive strength regression equation based on NDT.
4. Conclusions
In this study, we performed regression on the experimental concrete strength values obtained from rebound and ultrasonic methods. The results of this study are summarized as follows:
- (1)
- Overall, the core specimens exhibited higher compressive strengths than the cylinder mold specimens. As the W/C decreased, the maturity of concrete increased, thereby resulting in an increase in the maximum temperature history. Owing to the difference in maturity, the strengths of the core specimens were 5–10% higher than those of the cylinder molds, caused by differences in the initial temperature history.
- (2)
- The ultrasonic pulse velocity and rebound value increased until 7–14 days of age, but converged in a manner similar to that of the rebound value after 14 days. This appears to be due to the surface conditions and soundness of the internal structure.
- (3)
- The relationship between the rebound value and ultrasonic pulse velocity shows a parabolic correlation, but it is a low correlation of R2 = 0.68, and the difference is found to be larger with increasing compressive strength of concrete.
- (4)
- When the existing regression equations were compared and examined, we found that their values were within the ±20% error range for strengths <40 MPa, but their reliability significantly decreased for higher strengths over 40 MPa. Therefore, this study proposed a regression equation that can converge 40 MPa or more of experimental data, and has a reliability of ±20% error range in the range of 24–65 MPa compared with a previous study.
This study proposed a regression equation for the compressive strength of concrete based on experimental rebound values and ultrasonic pulse velocities in the concrete strength range of 24 to 60 MPa. It is expected that the proposed regression equation can estimate strengths close to the measured strengths within the scope of high-strength concrete.
There are some limitations to this study: because we used concrete mixes based only on cement, factors such as the use of various admixtures, aggregate types, and curing conditions were not considered. Thus, it is necessary to acquire additional relevant data in future studies.
Author Contributions
T.L., J.L., and H.C. equally contributed to the research conceptualization and all investigations performed under its purview. Resource procurement was handled by T.L. and J.L. The original draft of the manuscript was prepared by T.L. and J.L., whereas the final draft was reviewed and edited by T.L., J.L., and H.C. All authors have read and agreed to the published version of the manuscript.
Funding
This work was supported by the National Research Foundation of Korea (NRF) grant funded by the Korea government (MSIT) (No. NRF-2018R1A5A1025137).
Conflicts of Interest
The authors declare no conflict of interest. The funders had no role in the design of the study; in the collection, analyses, or interpretation of data; in the writing of the manuscript; or in the decision to publish the results.
References
- Lee, T.; Lee, J.; Kim, Y. Effects of admixtures and accelerators on the development of concrete strength for horizontal form removal upon curing at 10 °C. Constr. Build. Mater. 2020, 237, 117652. [Google Scholar] [CrossRef]
- Lee, J.; Lee, T. Influences of chemical composition and fineness on the development of concrete strength by curing conditions. Materials 2019, 12, 4061. [Google Scholar] [CrossRef] [PubMed]
- Lee, J.; Lee, T. Effects of high CaO fly ash and sulfate activator as a finer binder for cementless grouting material. Materials 2019, 12, 3664. [Google Scholar] [CrossRef] [PubMed]
- Guide to Formwork for Concrete; ACI: Farmington Hills, MI, USA, 2005; ACI 347-04.
- Ceb-Fip Model Code 1990: Design Code; Telford: London, UK, 1993.
- Execution of Concrete Structures; BSI: London, UK, 2010; BS EN 13670:2009.
- Korea Architectural Standard Specification; Architectural Institute of Korea: Seoul, Korea, 2009; KASS 5.
- Japanese Architectural Standard Specification Reinforced Concrete Work; Architectural Institute of Japan: Tokyo, Japan, 2009; JASS 5.
- Building Code Requirements for Structural Concrete; American Concrete Institute: Farmington Hills, MI, USA, 1999; ACI 318-99.
- Nondestructive Test Methods of Evaluation of Concrete in Structures; ACI Committee: Farmington Hills, MI, USA, 1998; ACI 228.2R-98.
- Solís-Carcaño, R.; Moreno, E. Evaluation of concrete made with crushed limestone aggregate based on ultrasonic pulse velocity. Constr. Build. Mater. 2008, 22, 1225–1231. [Google Scholar] [CrossRef]
- Price, W.F.; Haynes, J.P. In-situ strength testing of high strength concrete. Mag. Concr. Res. 1996, 48, 189–197. [Google Scholar] [CrossRef]
- Galan, A. Estimate of concrete strength by ultrasonic pulse velocity and damping constant. ACI J. 1967, 64, 678–684. [Google Scholar]
- Facaoaru, I. Non-destructive testing. Comparison between recommendations existing in some East European countries concerning the determination of concrete strength by surface hardness methods. Mater. Struct. 1976, 9, 207–210. [Google Scholar]
- Testing Concrete in Structures; BSI: Part 2: Nondestructive testing—Determination of rebound number, March 2013; EN 12504-2; Part 3: Determination of pull-out force, June 2005; EN 12504-3; Part 4: Determination of ultrasonic pulse velocity, May 2005; BSI: London, UK, 2005; EN 12504-4; ISSN 0335-3931.
- Breysse, D.; Balayssac, J.P. Strength assessment in reinforced concrete structures: From research to improved practices. Constr. Build. Mater. 2018, 182, 1–9. [Google Scholar] [CrossRef]
- Alwash, M.; Sbartai, Z.M.; Breysse, D. Nondestructive assessment of both mean strength and variability of concrete: A new bi-objective approach. Constr. Build. Mater. 2016, 113, 880–889. [Google Scholar] [CrossRef]
- Kazemi, M.; Madandoust, R.; Brito, J.D. Compressive strength assessment of recycled aggregate concrete using Schmidt rebound hammer and core testing. Constr. Build. Mater. 2019, 224, 630–638. [Google Scholar] [CrossRef]
- Bungey, J.H.; Millard, S.G.; Grantham, M.G. Testing of Concrete in Structures, 4th ed.; Taylor & Francis: London, UK, 2006; p. 352. [Google Scholar]
- In-Place Methods to Estimate Concrete Strength; ACI Committee: Farmington Hills, MI, USA, 2003; ACI 228.1R-03.
- Kolek, J. An appreciation of the Schmidt rebound hammer. Mag. Concr. Res. 1958, 10, 27–36. [Google Scholar] [CrossRef]
- Victor, D.J. Evaluation of hardened field concrete with rebound hammer. ACI Mater. J. 1963, 37, 407–411. [Google Scholar]
- Greene, G.W. Test hammer provides new method of evaluating hardened concrete. ACI J. Proc. 1954, 51, 249–256. [Google Scholar]
- Alwash, M.; Breysse, D.; Sbartaï, Z.M.; Szilágyi, K.; Borosnyói, A. Factors affecting the reliability of assessing the concrete strength by rebound hammer and cores. Constr. Build. Mater. 2017, 140, 354–363. [Google Scholar] [CrossRef]
- Qasrawi, H. Concrete strength by combined nondestructive methods simply and reliably predicted. Cem. Concr. Res. 2000, 30, 739–746. [Google Scholar] [CrossRef]
- Szilágyi, K.; Borosnyói, A.; Zsigovics, I. Extensive statistical analysis of the variability of concrete rebound hardness based on a large database of 60 years experience. Constr. Build. Mater. 2014, 53, 333–347. [Google Scholar] [CrossRef]
- Pereira, N.; Romao, X. Assessment of the concrete strength in existing buildings using finite population approach. Constr. Build. Mater. 2016, 110, 106–116. [Google Scholar] [CrossRef]
- Pereira, N.; Romao, X. Material strength safety factors for the seismic safety assessment of existing RC buildings. Constr. Build. Mater. 2016, 119, 319–328. [Google Scholar] [CrossRef]
- Masi, A.; Chiauzzi, L. An experimental study on the within-member variability of in situ concrete strength in RC building structures. Constr. Build. Mater. 2013, 47, 951–961. [Google Scholar] [CrossRef]
- Stewart, M.G. Workmanship and its influence on probabilistic models of concrete compressive strength. ACI Mater. J. 1995, 92, 361–372. [Google Scholar]
- Phoon, K.K.; Wee, T.H.; Loi, C.S. Development of statistical quality assurance criterion for concrete using ultrasonic pulse velocity method. ACI Mater. J. 1999, 96, 568–573. [Google Scholar]
- Ben-Zeitun, A.E. Use of pulse velocity to predict compressive strength of concrete. Int. J. Cem. Compos. Lightweight Concr. 1986, 8, 51–59. [Google Scholar] [CrossRef]
- Trtnik, G.; Kavcic, F.; Turk, G. Prediction of concrete strength using ultrasonic pulse velocity and artificial neural networks. Ultrasonics 2009, 49, 53–60. [Google Scholar] [CrossRef] [PubMed]
- Popovics, S.; Rose, J.L.; Popovics, J.S. The behavior of ultrasonic pulses in concrete. Cem. Concr. Res. 1990, 20, 259–270. [Google Scholar] [CrossRef]
- Lin, Y.; Kuo, S.; Hsiao, C.; Lai, C. Investigation of pulse velocity-strength relationship of hardened concrete. ACI Mater. J. 2007, 104, 344–350. [Google Scholar]
- Standard Test Method for Slump of Hydraulic-Cement Concrete, American Society of Testing and Materials; ASTM: West Conshohocken, PA, USA, 2015; ASTM C143/C143M; pp. 1–4.
- Standard Test Method for Air Content of Freshly Mixed Concrete by the Pressure Method; ASTM: West Conshohocken, PA, USA, 2017; ASTM C231/C231M.
- Standard Test Method for Compressive Strength of Concrete Cylinders Cast in Place in Cylindrical Molds; ASTM: West Conshohocken, PA, USA, 2015; ASTM C873/C873M.
- Standard Test Method for Compressive Strength of Cylindrical Concrete Specimens; ASTM: West Conshohocken, PA, USA, 2018; ASTM C39/C39M.
- Standard Practice for Estimating Concrete Strength by the Maturity Method; ASTM: West Conshohocken, PA, USA, 2019; ASTM C1074; pp. 1–10.
- Standard Test Method for Rebound Number of Hardened Concrete; ASTM: West Conshohocken, PA, USA, 2014; ASTM C805/C805M; pp. 1–4.
- Standard Test Method for Pulse Velocity through Concrete; ASTM: West Conshohocken, PA, USA, 2016; ASTM C597-16; pp. 1–4.
- Matias, K.; Karim, H. Determination of initial degree of hydration for improvement of early-age properties of concrete using ultrasonic wave propagation. Cem. Concr. Compos. 2006, 28, 299–306. [Google Scholar]
- Philippidis, T.P.; Aggelis, D.G. Experimental study of wave dispersion and attenuation in concrete. Ultrasonics 2005, 43, 584–595. [Google Scholar] [CrossRef]
- Elvery, R.H.; Ibrahim, L.A.M. Ultrasonic assessment of concrete strength at early ages. Mag. Concr. Res. 1976, 28, 181–190. [Google Scholar] [CrossRef]
- Velay-Lizancos, M.; Martinez-Lage, I.; Azenha, M.; Vázquez-Burgo, P. Influence of temperature in the evolution of compressive strength and in its correlations with UPV in eco-concretes with recycled materials. Constr. Build. Mater. 2016, 124, 276–286. [Google Scholar] [CrossRef]
- Pyzsniak, J. Method of concrete strength control in prefabricated slabs by ultrasound. Build. Sci. 1968, 2, 331–335. [Google Scholar] [CrossRef]
- Turgut, P. Evaluation of the ultrasonic pulse velocity data coming on the field. In Proceedings of the Fourth International Conference on NDE in Relation to Structural Integrity for Nuclear and Pressurised Components, London, UK, 6–8 December 2004. [Google Scholar]
- Kheder, G.F. Two stage procedure for assessment of in situ concrete strength using combined non-destructive testing. Mater. Struct. 1999, 32, 410–417. [Google Scholar] [CrossRef]


© 2020 by the authors. Licensee MDPI, Basel, Switzerland. This article is an open access article distributed under the terms and conditions of the Creative Commons Attribution (CC BY) license (http://creativecommons.org/licenses/by/4.0/).