Featured Application
Use of high-resolution molecular markers for studying genetic diversity of soybean pods.
Abstract
In soybeans (Glycine max L.), the time required to attain maturity is a quantitative trait controlled by multiple genes and quantitative trait loci (QTL), which enable soybean cultivars to adapt to various regions with diverse day lengths. In this study, depending on the days to maturity, 100 soybean varieties were classified into eight maturity groups numbered from 0 to VII. The maturity groups were further sorted into three maturity ecotypes: early, middle, and late maturity. The analysis of 55,589 soybean genes revealed a total of 1147 related to the growth and development of soybean pods, including 211 genes with simple sequence repeats (SSRs). We further identified 42 SSR markers that amplified over two alleles in three different ecotypes, including six genes that were up- or downregulated in pods of more than one ecotype. The agglomerative hierarchical tree constructed for the newly identified SSR markers had three clusters. Clusters B-I, B-II, and B-III were found to be strongly related with the early, middle, and late maturity ecotypes, respectively. Therefore, the newly identified set of SSR markers can serve as an effective high-resolution tool for the genotyping and QTL mapping of soybean pod maturity.
1. Introduction
The soybean (Glycine max L.) is a major legume crop that is widely grown for its edible bean. The reproductive period of the soybean has different stages (R1 to R8), from flowering to maturity, and is important in determining the yield, seed quality, and tolerance to various environmental stresses [1]. The time for attaining maturity is a quantitative trait in soybeans that is controlled by multiple genes and quantitative trait loci (QTL), which enable soybean cultivars to adapt to various regions with diverse day lengths [2,3].
Based on adaptability, soybean varieties are categorized into different maturity groupings (MGs), which facilitate the identification of the optimally adapted soybean cultivar for a particular region, as well as the most suitable time for sowing in that region. Scott and Aldrich [4] delineated the hypothetically optimum MG zones across the United States based on photoperiod sensitivity. The MGs range from MG 000, for the extremely early-maturing varieties, to MG 10, for the latest-maturing varieties [5]. Recently, Mourtzinis and Conley [6] re-delineated the optimum MG zones across the United States using the yield data from 2005 to 2015. Ha et al. [7] described a maturity grouping (MG 0 to MG VII) system for 100 Korean soybean cultivars, according to days to maturity (DTM), based on data obtained in 2005–2006 from Miryang, Korea. Lee et al. [8] used a maturity ecotype based on DTM to evaluate the effects of the growth period and cumulative temperature on the flowering, maturity, and yield of Korean soybean varieties at Suwon.
Information on soybean maturity, including genetic diversity, maturity locus, and maturity group and ecotype, have been used for the development and breeding of new varieties adapted to a given MG zone [9,10]. Moreover, such information can help breeders and genetic researchers to predict combinations that can produce the best offspring. However, to incorporate the maturity trait into breeding programs, QTLs or genetic markers capable of determining the DTM must first be identified. Among the various genetic markers, simple sequence repeats (SSRs) are better suited to analyzing genetic diversity and marker-assisted selection than other types of molecular markers [11,12]. However, certain previously developed SSR markers were often found to be less polymorphic and failed to produce the expected PCR products [13,14,15]. Furthermore, these molecular markers can differ in their stability, amplification product quality, and equality of amplification loci, while providing less information regarding the genes of interest [16]. These disadvantages limit the use and accuracy of SSR markers for genotyping or breeding programs [16]. In 2001, Macaulay et al. [17] developed a highly informative genotyping set of SSRs for genetic studies of barley that was not limited by these drawbacks. Therefore, we conducted this study to similarly develop SSR markers with high resolution, as well as improved efficiency, precision, and reliability for the genetic study of the soybean pod maturity trait.
2. Materials and Methods
2.1. Experimental Field Tests
We conducted experimental field tests at Suwon (37°16′N, 127°01′E), Republic of Korea, in 2017 and 2018 to investigate the DTM of the 100 soybean varieties (Table 1). The experimental plots were completely randomized, with three replicates. The soybean seeds were sown on Jun 12, 2017, and Jun 14, 2018, in 4 m (row length) and 70 cm (row width) plots with 15 cm spacing in the experimental fields, which were treated with a basic granular fertilizer N–P2O5–K2O (30–30–34 kg/ha) before sowing. This design allowed for 27 plants per row, with 4 rows per replicate of each variety. The DTM of the soybeans was defined as the number of days from sowing to full maturity (when 95% of the pods reached a mature pod color, stage R8).

Table 1.
Classification of 100 soybean varieties by maturity group and ecotype according to their days to maturity.
2.2. Analysis and Selection of Genes
We downloaded the annotated information of all genes of the soybean cultivar ‘Williams 82′ from the SoyBase database [18]. The information included (1) the Arabidopsis thaliana (AT) protein (TAIR10) IDs matched via the BLASTP of Gmax2.0 primary proteins; (2) the Biological Processes, Molecular Functions, and Cellular Components assigned to each Gmax2.0 primary protein using the Gene Ontology (GO) terms associated with the Top TAIR10 BLASTP Hit; (3) the EuKaryotic Orthologous Groups (KOG) of the primary proteins described and assigned by The KOG Browser [19]; (4) the Protein Families (PF) of the studied proteins described and assigned by the Pfam [20]; (5) the PANTHER (PTHR) of the primary proteins described and assigned by The PANTHER (protein annotation through evolutionary relationship) classification system [21]; (6) the first versions of the Soybean Metabolic Pathway (SoyCyc) of the primary proteins described and assigned using the Soybean Metabolic Pathway Database [22]; (7) the seventh versions of the Soybean Metabolic Pathway (SoyCyc7) of the primary proteins described and assigned using PMN: Plant Metabolic Network [23]; and (8) the soycyc_enzymes of the Soybean Metabolic Pathway (SoyCyc7-rxn) for the primary proteins determined after downloading from the TAIR database [24].
We analyzed the SSRs in gene sequences using GRAMENE’s SSR tools [25] and then selected genes that harbored more than five repeats of SSR motifs. The markers were manually designed to amplify specific SSR regions, using the following parameters: a primer size ranging from 18 to 28, with 23 as the optimum; a product size ranging from 80 to 500 bp; an annealing temperature ranging from 48 to 60 °C, with an optimum of 56 °C; a GC content ranging from 45% to 55%, with 50% as the optimum. To select markers capable of detecting genetic diversity, we amplified alleles from three different maturity ecotypes (Figure 1) using the developed SSR markers; these included early (MG I, EM: OT89-05), middle (MG IV, MM: IT213198), and late (MG VI, LM: IT213177) maturity ecotypes.
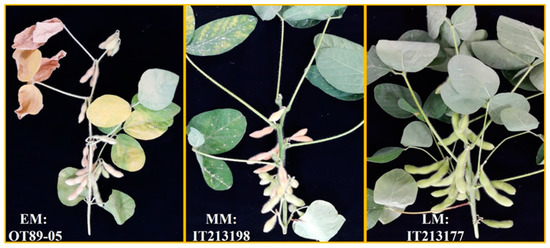
Figure 1.
Three different soybean maturity ecotype varieties: early maturity (EM) ecotype, OT89-05; middle maturity (MM) ecotype, IT213198; late maturity (LM) ecotype, IT213177.
2.3. Analysis of Genetic Polymorphisms
Genomic DNA was extracted from the young leaves of 100 varieties using the DNeasy Plant Mini Kit (Qiagen, Hilden, Germany) according to the manufacturer’s protocol. The PCR amplification mixture contained 10 ng of template DNA, 0.2 μmol L−1 of each forward and reverse primer, and the 5x GoTaq DNA polymerase master mix (Promega, USA) in a final volume of 20 μL. The reactions were performed in the Applied Biosystems ProFlex PCR system (Thermo Fisher Scientific, Waltham, MA, USA) with the following conditions: 94 °C for 2 min, followed by 35 cycles at 94 °C for 1 min, the specific annealing temperature for each primer pair (Table S1) for 1 min, extension at 72 °C for 1 min, and a final elongation step at 72 °C for 5 min.
The alleles amplified by each SSR marker were confirmed on 1% (w/v) agarose gels and by capillary electrophoresis using the QIAxcel Advanced system (Qiagen). The measure of the allelic diversity at a given locus and the polymorphism information content (PIC) of each SSR marker was calculated using the formula reported by Botstein et al. as presented in Equation (1) [26]:
where Pj is the frequency of the j-th allele of the marker.
2.4. Profiling of Gene Expression
We conducted the expression profiling of genes harboring the selected SSRs using tissues (leaf, stem, and pod) of the three maturity ecotypes to further select genes closely associated with the growth and development of the soybean pod. For profiling gene expression according to reproductive stages, soybean plants of three distinct stages, based on maturity ecotypes, were collected from stages R6 (full seed, LM ecotype) to R8 (EM ecotype), as shown in Figure 1. The leaves, stems, and pods were then simultaneously collected. The tissue samples were immediately placed in liquid nitrogen and stored at −80 °C. All the samples were collected with three biological replicates. We also manually designed primers, to profile the expression of the genes, using the following parameters: a primer size ranging from 20 to 25, with 23 as the optimum; a product size ranging from 80 to 300 bp; an annealing temperature ranging from 52 to 58 °C, with an optimum of 56 °C; a GC content ranging from 45% to 55%, with 50% as the optimum. For use as a template in reverse transcription–quantitative polymerase chain reaction (RT-qPCR)-based expression profiling, cDNA was synthesized from the total RNA of each tissue of the three ecotypes using the High-Capacity cDNA Reverse Transcription Kit (Thermo Fisher Scientific). RT-qPCR was performed after 2 min at 95 °C for polymerase activation, and cycling between 95 °C (15 s) and the respective annealing temperature (15 s) for each primer pair (Table S2), followed by 40 cycles using the QuantStudio 5 Real-Time PCR System (Thermo Fisher Scientific) and the QuantiNova SYBR Green RT-PCR kit (Qiagen). The RT-qPCR products were subjected to melt-curve analysis (60–95 °C). Two reference genes were also used, TUB4 (Glyma.03G124400.1) and UKN2 (Glyma.06G038500.1), to improve the accuracy of normalization for expression profiling. For relative expression profiling, we modified the formula reported by Livak and Schmittgen [27]: for the normalization (ΔCq) of the quantification cycle (Cq) values for each gene using TUB4, ΔCq = Cq (a target sample) − Cq (TUB4); the ΔΔCq calculation was based on the ΔCq of UKN2, so ΔΔCq = ΔCq (a target sample) − ΔCq (UKN2); the relative expression ratio (R) = (2−ΔΔCq of the target sample)/(mean of 2−ΔΔCq of all samples).
2.5. Agglomerative Clustering
The presence and absence of alleles amplified by each SSR marker were expressed as a nucleotide code. For example, the presence and absence of one of the alleles amplified from each variety were denoted by the nucleotide codes A and T, and those from the other allele, by G and C. The sequences were then aligned using the multiple sequence alignment software ClustalX [28] and BioEdit 7.2 [29]. To assess the clustering resolution of the selected markers, we used an agglomerative clustering Neighbor-Joining Method [30]. Clustering was visualized using MEGA version 4.0 [31]. We selected a set of six SSR markers (Table 2), which were positively associated with the QTLs of pod maturity listed in the SoyBase database [18], to assess the resolution of the newly developed markers.
Table 2.
Simple sequence repeat (SSR) markers (loci) positively associated with quantitative trait loci (QTLs) of soybean pod maturity in the SoyBase database.
2.6. Statistical Analysis
Analysis of variance (ANOVA) was performed with R version 3.6.1, based on the package agricolae, using three biological replicates and three technical replicates. Multiple comparisons for the gene expression profiling and DTM determination of varieties were performed with Duncan’s multiple range test and least significance difference (LSD), respectively. p < 0.05 was considered significant.
3. Results
3.1. Maturity Grouping
The DTM of the 100 varieties varied extensively, from 79 to 117 days. The shortest DTM among the varieties was that of OT89-06 (79 days), while the longest was that of ‘Pungsannamul’ (117 days). We classified the 100 varieties into eight MGs (0–VII) according to their DTM, with a 5-day range for each MG. The groups were Group 0, ≤79 DTM; Group I, 80–84 DTM; Group II, 85–89 DTM; Group III, 90–94 DTM; Group IV, 95–99 DTM; Group V, 100–104 DTM; Group VI, 105–109 DTM; and Group VII, ≥ 110 DTM (Table 1). All the MGs were further classified into three maturity ecotypes: early (EM), middle (MM), and late maturity (LM). The EM ecotype consisted of MG 0 to II (30 varieties); the MM ecotype consisted of MG III and IV (36 varieties); and the LM ecotype comprised MG V to VII (34 varieties; Table 1).
3.2. Development and Selection of SSR Markers
A total of 55,589 genes were downloaded from the SoyBase database; among them, 49,638 were annotated. We analyzed the gene annotations and identified 1147 genes related to the growth and development of soybean pods; these were classified into four groups: flower, hormone synthesis, seed, and senescence (Table 3). There were 168, 372, 490, and 117 genes in the flower, hormone synthesis, seed, and senescence categories, respectively. The genes related to senescence were excluded from further categorization, while the remaining 1030 genes were re-sorted into 12 sub-groups: enzyme, pollen, and time control in the flower group; abscisic acid (ABA), auxin/indole acetic acid (AUX/IAA), ethylene, gibberellic acid (GA), and jasmonic acid (JA) in the hormone synthesis group; and embryo, metabolite, maturation, and storage protein in the seed group. The largest sub-group was seed-embryo, with 279 genes; conversely, seed maturation included only five genes (Table 3).
Table 3.
Functional classification of genes related to pod maturity.
The analysis of the SSR regions in the 1147 genes revealed 211 genes with SSR regions. Hence, 211 SSR markers were then developed for amplifying these regions of the genes (Table S1). We then investigated the polymorphism of 211 SSR markers on the three maturity ecotypes and found 42 SSR markers that amplified over two alleles (Figure 2).
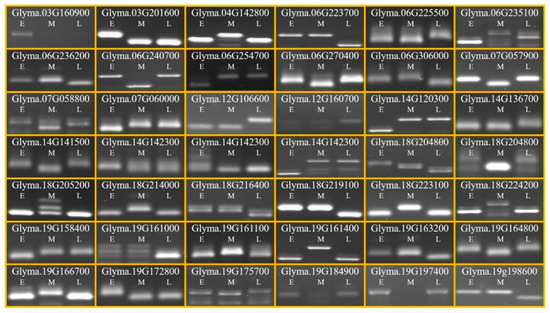
Figure 2.
PCR amplification products for three different soybean maturity ecotype varieties using 42 SSR markers. E, early maturity ecotype OT89-05; M, middle maturity ecotype IT213198; L, late maturity ecotype IT213177.
Among the genes corresponding to the 42 SSR markers, 18 were either upregulated (relative expression ≥ 2.0) or downregulated (≤ 0.5) in more than one tissue of the three ecotypes (Table 3). Of these, six genes—Glyma.03g160900.1, Glyma.03g201600.1, Glyma.07g057900.3, Glyma.19g158400.1, Glyma.19g164800.1, and Glyma.19g198600.1—were regulated in the pods of more than one ecotype (Figure 3). For the advanced stage (R6 to R8), five of the genes were downregulated in pods, while Glyma.19g198600.1 was upregulated (Figure 3).
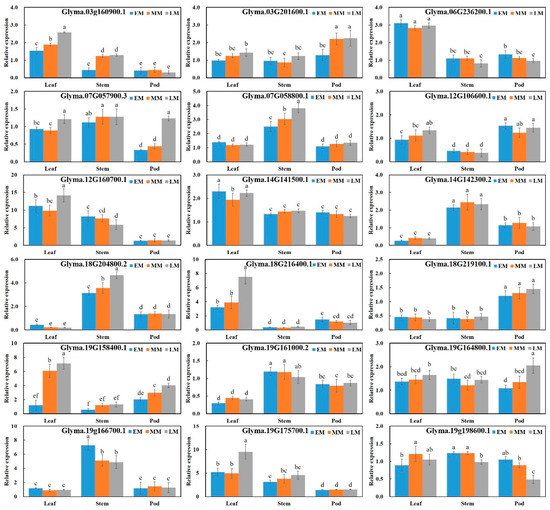
Figure 3.
Expression profiling of genes selected for analyzing genetic polymorphisms of the three soybean ecotypes: EM, early maturity ecotype OT89-05; MM, middle maturity ecotype IT213198; LM, late maturity ecotype IT213177. Different letters above the error bars indicate significant differences at p ≤ 0.05 according to Duncan’s multiple range test.
Additionally, we investigated the transcriptional products of the six genes to analyze the effects of the SSRs on their translation. Most of the SSRs, except Glyma.19g164800.1, were predicted to lie within the 5′- or 3′-untranslated regions (UTRs) of the associated genes (Figure 4). The SSR motif (GAA) of Glyma.19g164800.1, encoding glutamic acid, was repeated 12 times in the protein-coding sequence (CDS) of the gene and resided between two cupin_1 domains (Figure 4). Even when some, or all, of the SSR sequences were deleted in the CDS of this gene, the modified CDSs were aligned with a soybean glycinin subunit G7 (GY7), using the same parameters. To further probe the positions of the SSRs with respect to the domain organization of the gene, we used ab initio prediction and found that the GY7-matched signal peptide of Glyma.19g164800.1 ranged from 29 to 91 bp (total, 63 bp), translating into 21 amino acids. Moreover, deleting the SSRs did not disrupt the sequences of the cupin_1 domains (Figure 4). We then selected the SSR markers derived from the six selected genes for analyzing genetic polymorphisms (Table 4) that were up- or downregulated in the pods of the three ecotype varieties.
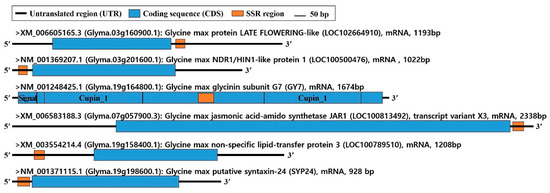
Figure 4.
Predicted schematic diagrams of the transcripts selected for analyzing expression profiling in three different soybean ecotypes.
Table 4.
SSR markers selected for analyzing genetic polymorphisms and the gene expression profiles of three different soybean ecotypes.
3.3. Analysis of Relationship Using the SSR Markers
The number of alleles amplified by the selected markers varied from one to five, with each showing a PIC value > 0.5 (Table 5). However, the SSR markers identified in this study exhibited PIC values lower than those of the previously established markers [26,27,28,29,30,31] (Table 5), although the sizes of the alleles amplified by the previous and new SSR markers were similar (Table 5).
Table 5.
Polymorphism of SSR markers developed in previous and present studies.
The tree generated for the previously established six SSR markers [26,27,28,29,30,31] had three large agglomerative clusters, with clusters A-I, A-II, and A-III comprising 45, 31, and 24 varieties, respectively. Although the EM ecotype in cluster A-I and the MM ecotype in clusters A-II and A-III were the largest ecotypes, their distribution was under 50% in each cluster (Figure 5a). Another tree that was constructed based on the six newly developed SSR markers also had three clusters: B-I, B-II, and B-III, which included 31, 34, and 35 varieties, respectively. In cluster B-I, 18 (58.1%) varieties belonged to the EM ecotype, while 24 (70.6%) varieties in cluster B-II and 25 (71.4%) varieties in cluster B-III belonged to the MM and LM ecotypes, respectively (Figure 5b).
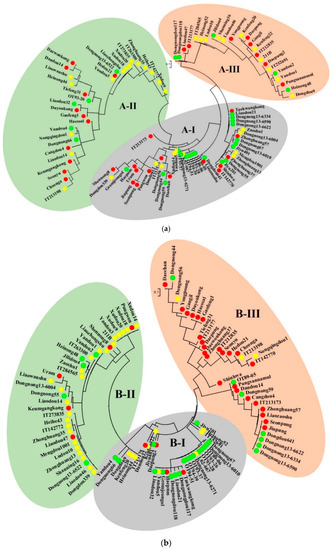
Figure 5.
Agglomerative clustering trees constructed using the (a) previously established and (b) newly developed SSR markers. In each cluster, the green circle represents the EM ecotype, the yellow circle represents the MM ecotype, and the red circle represents the LM ecotype.
4. Discussion
4.1. Large-Scale Genic SSR Marker Development in the Soybean
Geneticists have identified major genes and QTLs controlling pod maturity [32,33,34,35,36,37,38] to examine the genetic characteristics of soybeans. The SSR marker, a type of effective genetic marker with various applications, is one of the most widely used molecular markers for plant genotyping due to its high polymorphism [39]. Although many soybean SSR markers have been used for genotyping [40,41,42] and QTL mapping [32,33,34,35,36,37], some of the existing methods for SSR genotyping exhibit low sensitivity, accuracy, and efficiency, yet have high costs [15]. To overcome these disadvantages of SSR markers, over 1000 genic SSR markers have been developed for soybean genetic research [43,44]. Genic SSR markers are used as an effective tool to identify genetic resources, since SSRs are located in transcribed genes that are annotated with putative functions based on biological information and homology search [45], and as a selection tool for specific traits in breeding populations of diverse crops [46,47,48,49]. As shown in Supplementary Table S1, we developed 211 genic SSR markers. Among the 211 SSR repeat motifs, tri-nucleotide repeats (TNRs) were found to be the most abundant, accounting for 75.4% (159), followed by di-nucleotide repeats (DNRs) at 16.6%, and tetra-nucleotide repeats (TtNRs) at 8.0%. Meanwhile, repeats longer than five nucleotides were not found. These results were similar to previously published data, with TNRs reported as the most frequent (54–78%), followed by DNRs (17.1–40.4%) and TtNRs (3–6%) among cereal species [50].
4.2. Expression Profiling Shows That Six Genes Were Linked to the Growth and Development of the Soybean Pod
To develop genic SSR markers associated with the pod maturity of soybeans, we preferentially selected six genes found to be regulated in the soybean pod. LATE FLOWERING (LATE) encodes a C2H2-type zinc-finger transcriptional regulator that acts as a floral repressor and regulates the expression of genes that control flowering in the leaf vasculature of Arabidopsis [51]. Glyma.03g160900.1, annotated as a LATE, showed the highest expression levels in the leaves of LM ecotypes; however, it was decreased in the pods of all three ecotypes.
Late embryogenesis abundant protein (LEA, PFAM:PF03168) genes are upregulated in maturing seeds and vegetative tissues by salinity, dehydration, cold or freezing stress, and ABA treatment [52,53,54]. Glyma.03g201600.1 and Glyma.19g198600.1 were annotated as LEAs. The expression of Glyma.03g201600.1 was increased in the pods of the MM and LM ecotypes, whereas that of Glyma.19g198600.1, encoding syntaxin-24 (SYP24), decreased only in the pods of the LM ecotype. These results demonstrate that although different isoforms belong to the same gene family in soybeans, the genes are differentially regulated with stage advancement [55] and by tissue [56]. The cupin_1 domain represents the conserved barrel domain of the cupin superfamily, which contains 11S and 7S plant seed storage proteins. Plant seed storage proteins are the major nitrogen sources for the developing plant [57]. A glycinin subunit Gy7, which has two cupin_1 domains, has been reported as upregulated in soybean pods during seed maturation [58]. Our results, however, showed that Glyma.19G164800.1, the corresponding gene of Gy7, was upregulated in the pod of only the LM variety. Non-specific lipid transfer protein (nsLTP) genes, including Glyma.19g158400.1, have been isolated and characterized extensively in soybeans [59]. These genes reportedly play important roles in plant growth and development, including seed development [60]. Glyma.19g158400.1 was upregulated in the pods of all three ecotypes, although the highest expression was observed in the pods of the LM ecotype, indicating that the gene is downregulated with stage advancement.
Moreover, JA is a key player in the control of senescence [61]. In Arabidopsis, JA is associated with the timing of senescence processes in both somatic tissues and reproductive organs [62,63]. We found that Glyma.07g057900.3, which encodes a jasmonic acid-amido synthetase (JAR1), was downregulated in the pods of the EM and MM ecotypes. Taken together, these results imply that all six genes are related to the growth and development of soybean pods. From these results, we predicted that the newly developed SSR markers derived from the six genes could serve for the high-resolution detection and characterization of genetic diversity based on the DTM of soybean varieties.
4.3. Allelic Variations for the New SSR Markers Are Sufficient for Generating a Cluster and Distinguishing the Soybean Varieties by Ecotype Group
Several studies have reported that the 5′-UTR of a gene influences the efficiency of translation by regulating its secondary structure [64,65,66], suggesting that it plays an important role in expression regulation. The 5′- and 3′-UTRs can also regulate mRNA stability [67,68]. Out of the six SSR markers described in this study, five were predicted to lie within the 5′- or 3′-UTR. The sixth SSR, Glyma.19g164800.1, was predicted to be in the CDS regions. Moreover, our preliminary SSR deletion results indicate that the molecular markers do not affect the signal peptide or the main domains on the CDS of this gene. However, further studies are required to establish whether the SSRs affect the mRNA stability and regulation of gene expression.
Genic SSR markers have been reported to not only be less polymorphic than non-genic markers [69] but to also have 3.5 alleles per locus, with a higher PIC of 0.824 among the mulberry species [70]. Similarly, previous studies reported that the genic SSR markers for jute (2.7 alleles and a PIC of 0.34) [71] and flax (2.3 alleles and a PIC of 0.35) [72] show high polymorphism and are expected to be of use for the characterization of germplasm, as well as for variety identification and marker-assisted breeding. Therefore, although the average number of alleles and PIC values of the six newly developed genic SSR markers were low (3.1 alleles and a PIC of 0.61) compared to those of the previously established six SSR markers (3.8 alleles and a PIC of 0.70), the allelic variations exhibited by the new SSR markers were sufficient for generating clustering and distinguishing the soybean varieties by ecotype group. Finally, these alleles can serve as a marker for the characterization of populations, varieties, and germplasm, as previously reported in wheat [73], jatropha [74], and oil palm [75].
4.4. Agglomerative Clustering Shows That the Six New Genic SSR Markers Can Serve for the Genotyping and Fine QTL Mapping of Soybean Pod Maturity
We used agglomerative hierarchical clustering, a common bottom-up clustering method that uses the neighbor-joining method, for creating the phylogenetic trees [30]. This method provides a snapshot of the data that can facilitate more detailed analysis, while rapidly producing well-scaled informative networks for several hundred taxa [76]. The agglomerative clusters constructed for the six new genic SSR markers showed a strong relationship with each maturity ecotype. The EM, MM, and LM ecotypes were found to be dominant in the B-I, B-II, and B-III clusters, respectively. However, our results showed that the new set of six SSR markers based on the maturity of the soybean pod had high sensitivity for detecting genetic diversity. Thus, the six new SSR markers can serve as effective and high-resolution tools for the genotyping and fine QTL mapping of soybean pod maturity.
5. Conclusions
There is increasing demand for the development of new and sensitive molecular markers for the genetic characterization of crops. High-resolution markers are basic and powerful tools for the identification of target genes or loci that are highly associated with crucial agronomic traits. These markers can also serve as a guide for the genetic improvement of crop varieties in breeding programs. In this study, we demonstrate an efficient approach for designing SSR markers that detect genes associated with specific traits with improved accuracy compared to previously reported markers. The method reported here could prove valuable in designing high-resolution markers for the genetic improvement of crops.
Supplementary Materials
The following are available online at https://www.mdpi.com/2076-3417/10/18/6363/s1. Table S1: Development of SSR markers using the genes related to the growth and development of the soybean pod. Table S2: Primers used in qRT-PCR for profiling the expression of genes related to the growth and development of the soybean pod.
Author Contributions
Conceptualization, M.R.P.; data curation, M.R.P. and I.L.; formal analysis, M.R.P. and I.L.; investigation, M.R.P., I.L., M.-J.S., and H.-T.Y.; methodology, M.R.P.; software, M.R.P. and I.L.; supervision, M.R.P.; validation, M.-J.S. and H.-T.Y.; visualization, M.R.P. and I.L.; writing—original draft, M.R.P.; writing—review and editing, M.R.P. and I.L. All authors have read and agreed to the published version of the manuscript.
Funding
This study was funded by the Rural Development Administration (RDA, Republic of Korea), grant number PJ012548032020.
Conflicts of Interest
The authors declare no conflict of interest.
References
- Xu, M.; Xu, Z.; Liu, B.; Kong, F.; Tsubokura, Y.; Watanabe, S. Genetic variation in four maturity genes affects photoperiod insensitivity and PHYA-regulated post-flowering responses of soybean. BMC Plant Biol. 2013, 13, 91. [Google Scholar] [CrossRef] [PubMed]
- Watanabe, S.; Harada, K.; Abe, J. Genetic and molecular bases of photoperiod responses of flowering in soybean. Breed. Sci. 2012, 61, 531–543. [Google Scholar] [CrossRef] [PubMed]
- Cao, D.; Takeshima, R.; Zhao, C.; Liu, B.; Abe, J.; Kong, F. Molecular mechanisms of flowering under long days and stem growth habit in soybean. J. Exp. Bot. 2017, 68, 1873–1884. [Google Scholar] [CrossRef]
- Scott, W.O.; Aldrich, S.R. Modern Soybean Production, 1st ed.; S & A Publ. Inc.: Champaign, IL, USA, 1970. [Google Scholar]
- Boerma, H.R.; Specht, J.E. (Eds.) Soybeans: Improvement, Production, and Uses, 3rd ed.; ASA, CSSA, and SSSA: Madison, WI, USA, 2004. [Google Scholar]
- Mourtzinis, S.; Conley, S.P. Delineating soybean maturity groups across the US. Agron. J. 2017, 109, 1–7. [Google Scholar] [CrossRef]
- Ha, T.J.; Lim, S.G.; Shin, S.H.; Choi, K.J.; Baek, I.Y.; Lee, S.C.; Park, K.Y.; Shin, S.O. Maturity Grouping of Korean Soybean Cultivars and Character Relationships According to the Planting Date. Korean J. Crop Sci. 2009, 54, 104–118. [Google Scholar]
- Lee, J.E.; Jung, G.H.; Kim, S.K.; Kim, M.T.; Shin, S.H.; Jeon, W.T. Effects of Growth Period and Cumulative Temperature on Flowering, Ripening and Yield of Soybean by Sowing Times. Korean J. Crop Sci. 2019, 64, 406–413. [Google Scholar]
- Sun, F.; Xu, M.; Park, C.; Dwiyanti, M.S.; Nagano, A.J.; Zhu, J.; Watanabe, S.; Kong, F.; Liu, B.; Yamada, T.; et al. Characterization and quantitative trait locus mapping of late-flowering from a Thai soybean cultivar introduced into a photoperiod-insensitive genetic background. PLoS ONE 2019, 14, e0226116. [Google Scholar] [CrossRef]
- Jia, H.; Jiang, B.; Wu, C.; Lu, W.; Hou, W.; Sun, S.; Yan, H.; Han, T. Maturity group classification and maturity locus genotyping of early-maturing soybean varieties from high-latitude cold regions. PLoS ONE 2014, 9, e94139. [Google Scholar] [CrossRef]
- Thiel, T.; Michalek, W.; Varshney, R.K.; Graner, A. Exploiting EST databases for the development and characterization of gene-derived SSR-markers in barley (Hordeum vulgare L.). Theor. Appl. Genet. 2003, 106, 411–422. [Google Scholar] [CrossRef]
- Jiang, D.; Zhong, G.Y.; Hong, Q.B. Analysis of microsatellites in citrus unigenes. Acta Genet. Sin. 2006, 33, 345–353. [Google Scholar] [CrossRef]
- Gao, P.; Ma, H.; Luan, F.; Song, H. DNA fingerprinting of Chinese melon provides evidentiary support of seed quality appraisal. PLoS ONE 2012, 7, e52431. [Google Scholar] [CrossRef] [PubMed]
- Hu, J.; Wang, P.; Su, Y.; Wang, R.; Li, Q.; Sun, K. Microsatellite diversity, population structure, and core collection formation in melon germplasm. Plant Mol. Biol. Rep. 2014, 33, 439–447. [Google Scholar] [CrossRef]
- Li, L.; Fang, Z.; Zhou, J.; Chen, H.; Hu, Z.; Gao, L.; Chen, L.; Ren, S.; Ma, H.; Lu, L.; et al. An accurate and efficient method for large-scale SSR genotyping and applications. Nucleic Acids Res. 2017, 45, e88. [Google Scholar] [CrossRef] [PubMed]
- Miah, G.; Rafii, M.Y.; Ismail, M.R.; Puteh, A.B.; Rahim, H.A.; Islam, K.; Latif, M.A. A review of microsatellite markers and their applications in rice breeding programs to improve blast disease resistance. Int. J. Mol. Sci. 2013, 14, 22499–22528. [Google Scholar] [CrossRef]
- Macaulay, M.; Ramsay, L.; Powell, W.; Waugh, R. A representative, highly informative “genotyping set” of barley SSRs. Theor. Appl. Genet. 2001, 102, 801–809. [Google Scholar] [CrossRef]
- SoyBase.org. Available online: https://www.soybase.org/ (accessed on 12 July 2017).
- JGI Genome Portal Tutorial. Available online: https://mycocosm.jgi.doe.gov/Tutorial/tutorial/kog.html (accessed on 12 July 2017).
- Pfam. Available online: https://pfam.xfam.org/search#tabview=tab1 (accessed on 12 July 2017).
- PANTHER—Gene List Analysis. Available online: http://www.pantherdb.org/ (accessed on 12 July 2017).
- SoyCyc Database. Available online: https://soycyc.soybase.org/ (accessed on 12 July 2017).
- SoyCyc 7.0. Plant Metabolic Network. Available online: https://www.plantcyc.org/databases/soycyc/7.0 (accessed on 12 July 2017).
- Available online: https://www.arabidopsis.org/download_files/Pathways/BLAST_sets/soycyc_enzymes.fasta (accessed on 12 July 2017).
- Temnykh, S.; DeClerck, G.; Lukashova, A.; Lipovich, L.; Cartinhour, S.; McCouch, S. Computational and experimental analysis of microsatellites in rice (Oryza sativa L.): Frequency, length variation, transposon associations, and genetic marker potential. Genome Res. 2001, 11, 1441–1452. [Google Scholar] [CrossRef]
- Botstein, D.; White, R.L.; Skolnick, M.; Davis, R.W. Construction of a genetic linkage map in man using restriction fragment length polymorphisms. Am. J. Hum. Genet. 1980, 32, 314–331. [Google Scholar]
- Livak, K.J.; Schmittgen, T.D. Analysis of relative gene expression data using realtime quantitative PCR and the 2ΔΔC(T) Method. Methods 2001, 25, 402–408. [Google Scholar] [CrossRef]
- Larkin, M.A.; Blackshields, G.; Brown, N.P.; Chenna, R.; McGettigan, P.A.; McWilliam, H.; Valentin, F.; Wallace, I.M.; Wilm, A.; Lopez, R.; et al. Clustal W and Clustal X version 2.0. Bioinformatics 2007, 23, 2947–2948. [Google Scholar] [CrossRef]
- Hall, T.A. BioEdit: A user-friendly biological sequence alignment editor and analysis program for Windows 95/98/NT. Nucleic Acids Symp. Ser. 1999, 41, 95–98. [Google Scholar] [CrossRef]
- Saitou, N.; Nei, M. The neighbor-joining method: A new method for reconstructing phylogenetic trees. Mol. Biol. Evol. 1987, 4, 406–425. [Google Scholar] [CrossRef]
- Tamura, K.; Dudley, J.; Nei, V.; Kumar, S. MEGA4: Molecular Evolutionary Genetics Analysis (MEGA) software version 4.0. Mol. Biol. Evol. 2007, 24, 1596–1599. [Google Scholar] [CrossRef] [PubMed]
- Mansur, L.M.; Orf, J.H.; Chase, K.; Jarvik, T.; Cregan, P.B.; Lark, K.G. Genetic mapping of agronomic traits using recombinant inbred lines of soybean. Crop Sci. 1996, 36, 1327–1336. [Google Scholar] [CrossRef]
- Orf, J.H.; Chase, K.; Jarvik, T.; Mansur, L.M.; Cregan, P.B.; Adler, F.R.; Lark, K.G. Genetics of soybean agronomic traits: I. Comparison of three related recombinant inbred populations. Crop Sci. 1999, 39, 1642–1651. [Google Scholar] [CrossRef]
- Specht, J.E.; Chase, K.; Macrander, M.; Graef, G.L.; Chung, J.; Markwell, J.P.; Germann, M.; Orf, J.H.; Lark, K.G. Soybean response to water: A QTL analysis of drought tolerance. Crop Sci. 2001, 41, 493–509. [Google Scholar] [CrossRef]
- Wang, D.; Graef, G.L.; Procopiuk, A.M.; Diers, B.W. Identification of putative QTL that underlie yield in interspecific soybean backcross populations. Theor. Appl. Genet. 2004, 108, 458–467. [Google Scholar] [CrossRef]
- Li, W.; Zheng, D.H.; Van, K.; Lee, S.H. QTL Mapping for major agronomic traits across two years in soybean (Glycine max L. Merr.). J. Crop Sci. Biot. 2008, 11, 171–190. [Google Scholar]
- Panthee, D.R.; Pantalone, V.R.; Saxton, A.M.; West, D.R.; Sams, C.E. Quantitative trait loci for agronomic traits in soybean. Plant Breed. 2007, 126, 51–57. [Google Scholar] [CrossRef]
- Watanabe, S.; Hideshima, R.; Xia, Z.J.; Tsubokura, Y.; Sato, S.; Nakamoto, Y.; Yamanaka, N.; Takahashi, R.; Ishimoto, M.; Anai, T.; et al. Map-based cloning of the gene associated with the soybean maturity locus E3. Genetics 2009, 182, 1251–1262. [Google Scholar] [CrossRef]
- Mason, A.S. SSR genotyping. Methods Mol. Biol. 2015, 1245, 77–89. [Google Scholar] [CrossRef]
- Akkaya, M.G.; Bhawat, A.; Cregan, P.B. Length polymorphisms of simple sequence repeat DNA in soybean. Genetics 1992, 132, 1131–1139. [Google Scholar]
- Song, Q.J.; Quigley, C.V.; Nelson, R.L.; Carter, T.E.; Boerma, H.R.; Strachan, J.R.; Cregan, P.B. A selected set of trinucleotide simple sequence repeat markers for soybean cultivar identification. Plant Var. Seeds 1999, 12, 207–220. [Google Scholar]
- Narvel, J.M.; Fehr, W.R.; Chu, W.S.; Grant, D.; Shoemaker, R.C. Simple sequence repeat diversity among soybean plant introductions and elite genotypes. Crop Sci. 2000, 40, 1452–1458. [Google Scholar] [CrossRef]
- Song, Q.J.; Marek, L.F.; Shoemaker, R.C.; Lark, K.G.; Concibido, V.C.; Delannay, X.; Specht, J.E.; Cregan, P.B. A new integrated genetic linkage map of the soybean. Theor. Appl. Genet. 2004, 109, 122–128. [Google Scholar] [CrossRef] [PubMed]
- Hisano, H.; Sato, S.; Isobe, S.; Sasamoto, S.; Wada, T.; Matsuno, A.; Fujishiro, T.; Yamada, M.; Nakayama, S.; Nakamura, Y.; et al. Characterization of the soybean genome using EST-derived microsatellite markers. DNA Res. 2007, 14, 271–281. [Google Scholar] [CrossRef] [PubMed]
- Varshney, R.K.; Graner, A.; Sorrells, M.E. Genic microsatellite markers in plants: Features and applications. Trends Biotechnol. 2005, 23, 48–55. [Google Scholar] [CrossRef] [PubMed]
- Yi, G.; Lee, J.M.; Lee, S.; Choi, D.; Kim, B.D. Exploitation of pepper EST–SSRs and an SSR-based linkage map. Theor. Appl. Genet. 2006, 114, 113–130. [Google Scholar] [CrossRef]
- Simko, I. Development of EST–SSR markers for the study of population structure in lettuce (Lactuca sativa L.). J. Hered. 2009, 100, 256–262. [Google Scholar] [CrossRef]
- Izzah, N.K.; Lee, J.; Jayakodi, M.; Perumal, S.; Jin, M.; Park, B.S.; Ahn, K.; Yang, T.J. Transcriptome sequencing of two parental lines of cabbage (Brassica oleracea L. var. capitata L.) and construction of an EST-based genetic map. BMC Genom. 2014, 15, 149. [Google Scholar] [CrossRef]
- Dillon, N.L.; Innes, D.J.; Bally, I.S.; Wright, C.L.; Devitt, L.C.; Dietzgen, R.G. Expressed sequence tag-simple sequence repeat (EST–SSR) marker resources for diversity analysis of mango (Mangifera indica L.). Diversity 2014, 6, 72–87. [Google Scholar] [CrossRef]
- Varshney, R.K.; Thiel, T.; Stein, N.; Langridge, P.; Graner, A. In Silico analysis on frequency and distribution of microsatellites in ESTs of some cereal species. Cell. Mol. Biol. Lett. 2002, 7, 537–546. [Google Scholar] [PubMed]
- Weingartner, M.; Subert, C.; Sauer, N. LATE, a C2H2 zinc-finger protein that acts as floral repressor. Plant J. 2011, 68, 681–692. [Google Scholar] [CrossRef]
- Close, T.J. Dehydrins: Emergence of a biochemical role of a family of plant dehydration proteins. Physiol. Plant. 1996, 97, 795–803. [Google Scholar] [CrossRef]
- Close, T.J. Dehydrins: A commonalty in the response of plants to dehydration and low temperature. Physiol. Plant. 1997, 100, 291–296. [Google Scholar] [CrossRef]
- Campbell, S.A.; Close, T.J. Dehydrins: Genes, proteins, and associations with phenotypic traits. New Phytol. 1997, 137, 611–674. [Google Scholar] [CrossRef]
- Teixeira, R.N.; Ligterink, W.; França-Neto, J.B.; Hilhorst, H.W.; da Silva, E.A. Gene expression profiling of the green seed problem in soybean. BMC Plant Biol. 2016, 16, 37. [Google Scholar] [CrossRef]
- Gu, Y.; Li, W.; Jiang, H.; Wang, Y.; Gao, H.; Liu, M.; Chen, Q.; Lai, Y.; He, C. Differential expression of a WRKY gene between wild and cultivated soybeans correlates to seed size. J. Exp. Bot. 2017, 68, 2717–2729. [Google Scholar] [CrossRef]
- Dunwell, J.M.; Purvis, A.; Khuri, S. Cupins: The most functionally diverse protein superfamily? Phytochemistry 2004, 65, 7–17. [Google Scholar] [CrossRef]
- Song, B.; An, L.; Han, Y.; Gao, H.; Ren, H.; Zhao, X.; Wei, X.; Krishnan, H.B.; Liu, S. Transcriptome profile of near-isogenic soybean lines for β-conglycinin α-subunit deficiency during seed maturation. PLoS ONE 2016, 11, e0159723. [Google Scholar] [CrossRef]
- Wang, L.; Yu, S.; Tong, C.; Zhao, Y.; Liu, Y.; Song, C.; Zhang, Y.; Zhang, X.; Wang, Y.; Hua, W.; et al. Genome sequencing of the high oil crop sesame provides insight into oil biosynthesis. Genome Biol. 2014, 15, 2014–2015. [Google Scholar] [CrossRef]
- Liu, F.; Zhang, X.; Lu, C.; Zeng, X.; Li, Y.; Fu, D.; Wu, G. Non-specific lipid transfer proteins in plants: Presenting new advances and an integrated functional analysis. J. Exp. Bot. 2015, 66, 5663–5681. [Google Scholar] [CrossRef] [PubMed]
- Kim, J.; Chang, C.; Tucker, M.L. To grow old: Regulatory role of ethylene and jasmonic acid in senescence. Front. Plant Sci. 2015, 6, 20. [Google Scholar] [CrossRef] [PubMed]
- He, Y.; Fukushige, H.; Hildebrand, D.F.; Gan, S. Evidence supporting a role of jasmonic acid in Arabidopsis leaf senescence. Plant Physiol. 2002, 128, 8761–8884. [Google Scholar] [CrossRef] [PubMed]
- Danisman, S.; van der Wal, F.; Dhondt, S.; Waites, R.; de Folter, S.; Bimbo, A.; van Dijk, A.D.; Muino, J.M.; Cutri, L.; Dornelas, M.C.; et al. Arabidopsis class I and class II TCP transcription factors regulate jasmonic acid metabolism and leaf development antagonistically. Plant Physiol. 2012, 159, 1511–1523. [Google Scholar] [CrossRef]
- Fütterer, J.; Hohn, T. Translation in plants—Rules and exceptions. Plant Mol. Biol. 1996, 32, 159–189. [Google Scholar] [CrossRef]
- Gallie, D.R. Translational control of cellular and viral mRNAs. Plant Mol. Biol. 1996, 32, 145–158. [Google Scholar] [CrossRef]
- Gray, N.K.; Wickens, M. Control of translation initiation in animals. Annu. Rev. Cell Dev. Biol. 1998, 14, 399–458. [Google Scholar] [CrossRef]
- Gutiérrez, R.A.; MacIntosh, G.C.; Green, P.J. Current perspectives on mRNA stability in plants: Multiple levels and mechanisms of control. Trends Plant Sci. 1999, 4, 429–438. [Google Scholar] [CrossRef]
- McClure, B.A.; Guilfoyle, T. Rapid redistribution of auxin-regulated RNAs during gravitropism. Science 1989, 243, 91–93. [Google Scholar] [CrossRef]
- Portis, E.; Portis, F.; Valente, L.; Moglia, A.; Barchi, L.; Lanteri, S.; Acquadro, A. A genome-wide survey of the microsatellite content of the globe artichoke genome and the development of a web-based database. PLoS ONE 2016, 11, e0162841. [Google Scholar] [CrossRef]
- Mathi Thumilan, B.; Sajeevan, R.S.; Biradar, J.; Madhuri, T.; Nataraja, N.K.; Sreeman, S.M. Development and characterization of genic SSR markers from indian mulberry transcriptome and their transferability to related species of Moraceae. PLoS ONE 2016, 11, e0162909. [Google Scholar] [CrossRef] [PubMed]
- Saha, D.; Rana, R.S.; Chakraborty, S.; Datta, S.; Kumar, A.A.; Chakraborty, A.K.; Karmakar, P.G. Development of a set of SSR markers for genetic polymorphism detection and interspecific hybrid jute breeding. Crop J. 2017, 5, 416–429. [Google Scholar] [CrossRef]
- Cloutier, S.; Niu, Z.; Datla, R.; Duguid, S. Development and analysis of EST-SSRs for flax (Linum usitatissimum L.). Theor. Appl. Genet. 2009, 119, 53–63. [Google Scholar] [CrossRef] [PubMed]
- Leigh, F.; Lea, V.; Law, J.; Wolters, P.; Powell, W.; Donini, P. Assessment of EST-and genomic microsatellite markers for variety discrimination and genetic diversity studies in wheat. Euphytica 2003, 133, 359–366. [Google Scholar] [CrossRef]
- Wen, M.F.; Wang, H.Y.; Xia, Z.Q.; Zou, M.L.; Lu, C.; Wang, W.Q. Development of EST-SSR and genomic-SSR markers to assess genetic diversity in Jatropha curcas L. BMC Res. Notes 2010, 3, 42. [Google Scholar] [CrossRef]
- Ting, N.C.; Zaki, N.M.; Rosli, R.; Low, E.T.; Ithnin, M.; Cheah, S.C.; Tan, S.G.; Singh, R. SSR mining in oil palm EST database: Application in oil palm germplasm diversity studies. J. Genet. 2010, 89, 135–145. [Google Scholar] [CrossRef]
- Bryant, D.; Moulton, V. Neighbor Net: An agglomerative algorithm for the construction of planar phylogenetic networks. Mol. Biol. Evol. 2004, 21, 255–265. [Google Scholar] [CrossRef]


© 2020 by the authors. Licensee MDPI, Basel, Switzerland. This article is an open access article distributed under the terms and conditions of the Creative Commons Attribution (CC BY) license (http://creativecommons.org/licenses/by/4.0/).