OpenGDC: Unifying, Modeling, Integrating Cancer Genomic Data and Clinical Metadata

 ,
,  ,
,  , , , and
Abstract
:1. Background
2. Methods
2.1. The Genomic Data Format
- FPKM, the number of Fragments Per Kilobase of transcript per Million mapped reads;
- FPKM-UQ, the Upper Quartile normalized FPKM value;
- counts, the number of reads aligned to each gene, calculated by HT-Seq.
2.2. Metadata Format
2.3. Metadata Extraction And Composition
- the BCR Biospecimen and Clinical Supplements,
- the information retrieved through the GDC APIs,
- additional manually curated attributes computed within our standardization pipelines.
- verify mappings on the official GDC GitHub repository available at https://github.com/NCI-GDC/gdcdatamodel/tree/develop/gdcdatamodel/xml_mappings, specifying which fields from the BCR Supplements correspond to the GDC API fields: when redundant, keep the second ones;
- when a field from the BCR Biospecimen Supplement is redundant w.r.t. a field of the BCR Clinical Supplement, keep the first one;
- when a field belonging to the case group is redundant w.r.t. a case__.project group field, keep the first one;
- when a field belonging to the analytes group is redundant w.r.t. a analytes__aliquots group field, keep the second one.
3. Results
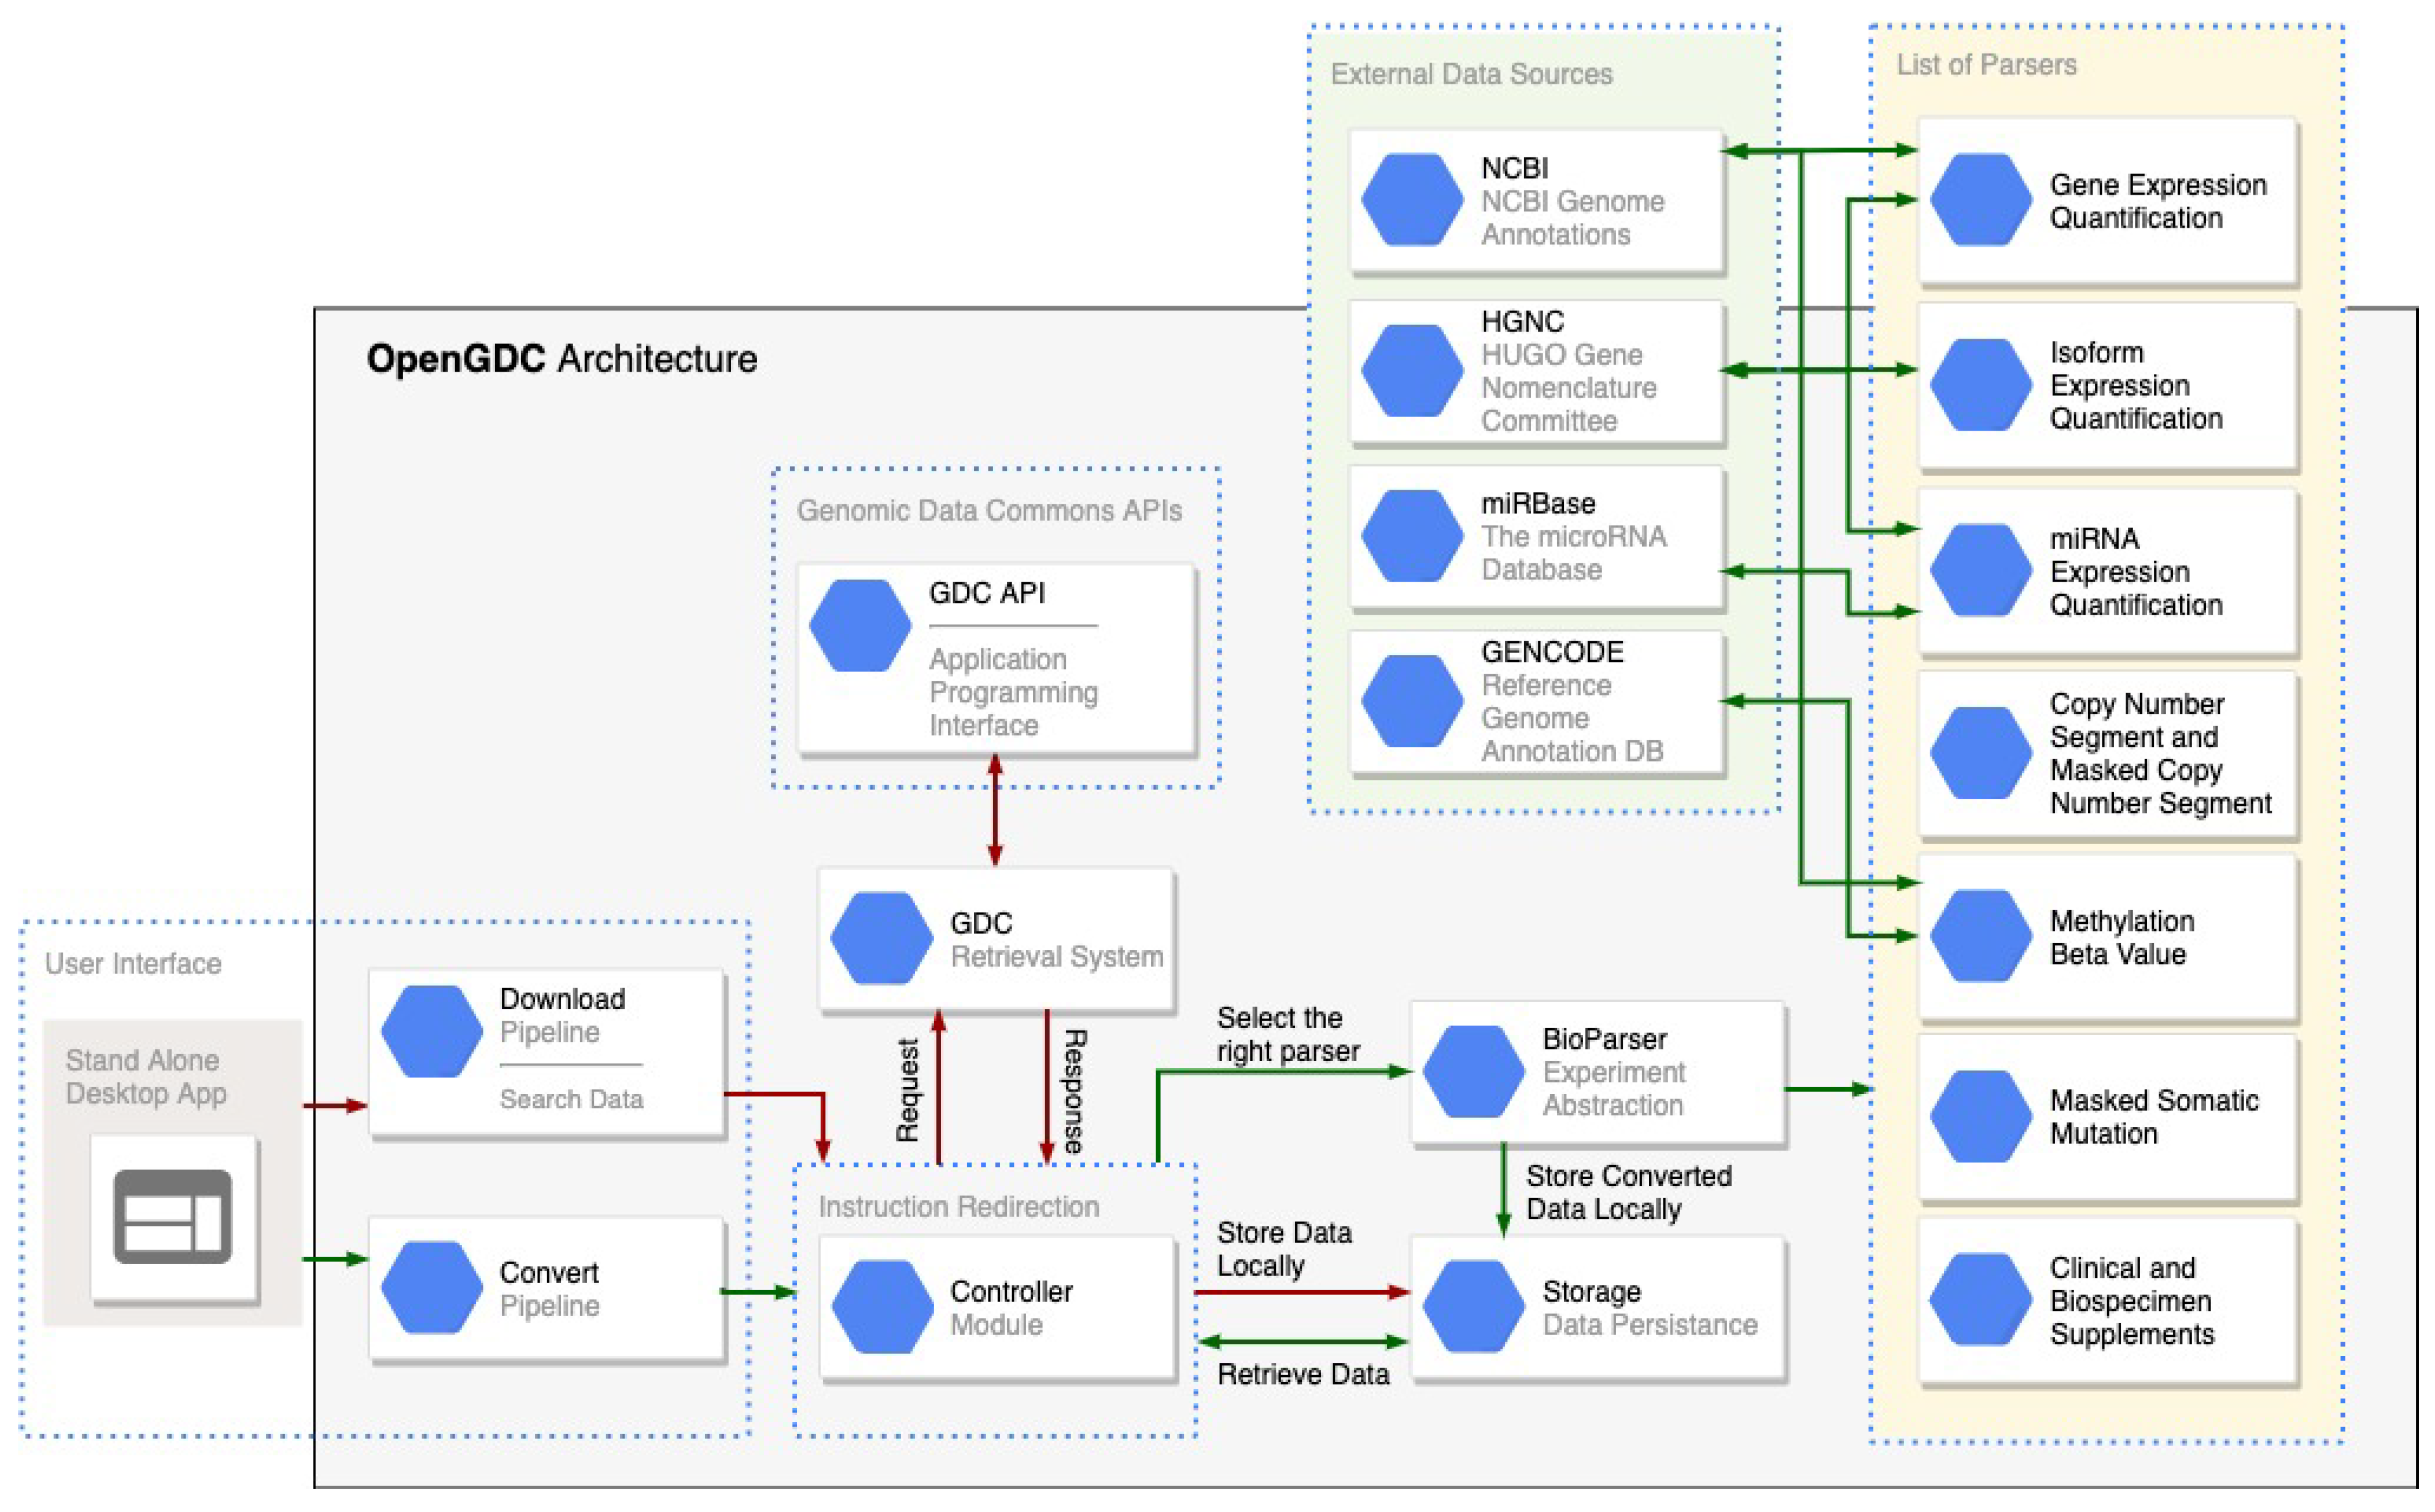
3.1. Opengdc Software Architecture
- -
- Controller: it redirects the user instructions to the correct software module and initializes an instance of the software able to download and/or convert the GDC data;
- -
- Data Download: it manages the process of search and retrieval of the public GDC data, taking advantage of the GDC APIs;
- -
- Data Standardization: it allows to easily convert and standardize data according to a specific data type. The process is facilitated by the ad-hoc class BioParser, which provides an abstract representation for all GDC data types; this class can be extended to support new data types in case of future extensions of the GDC repository.
3.2. Interacting with the GDC Public Apis
- cases: to find all files related to a specific case (i.e., sample donor);
- files: to find all files with specific characteristics such as the file name, MD5 checksum and data format;
- data: to download GDC data files.
3.3. Data Repository
4. Use Case Examples
4.1. Use Case 1: for Kidney Cancers, Find Mutations and Their Number in Each Exon

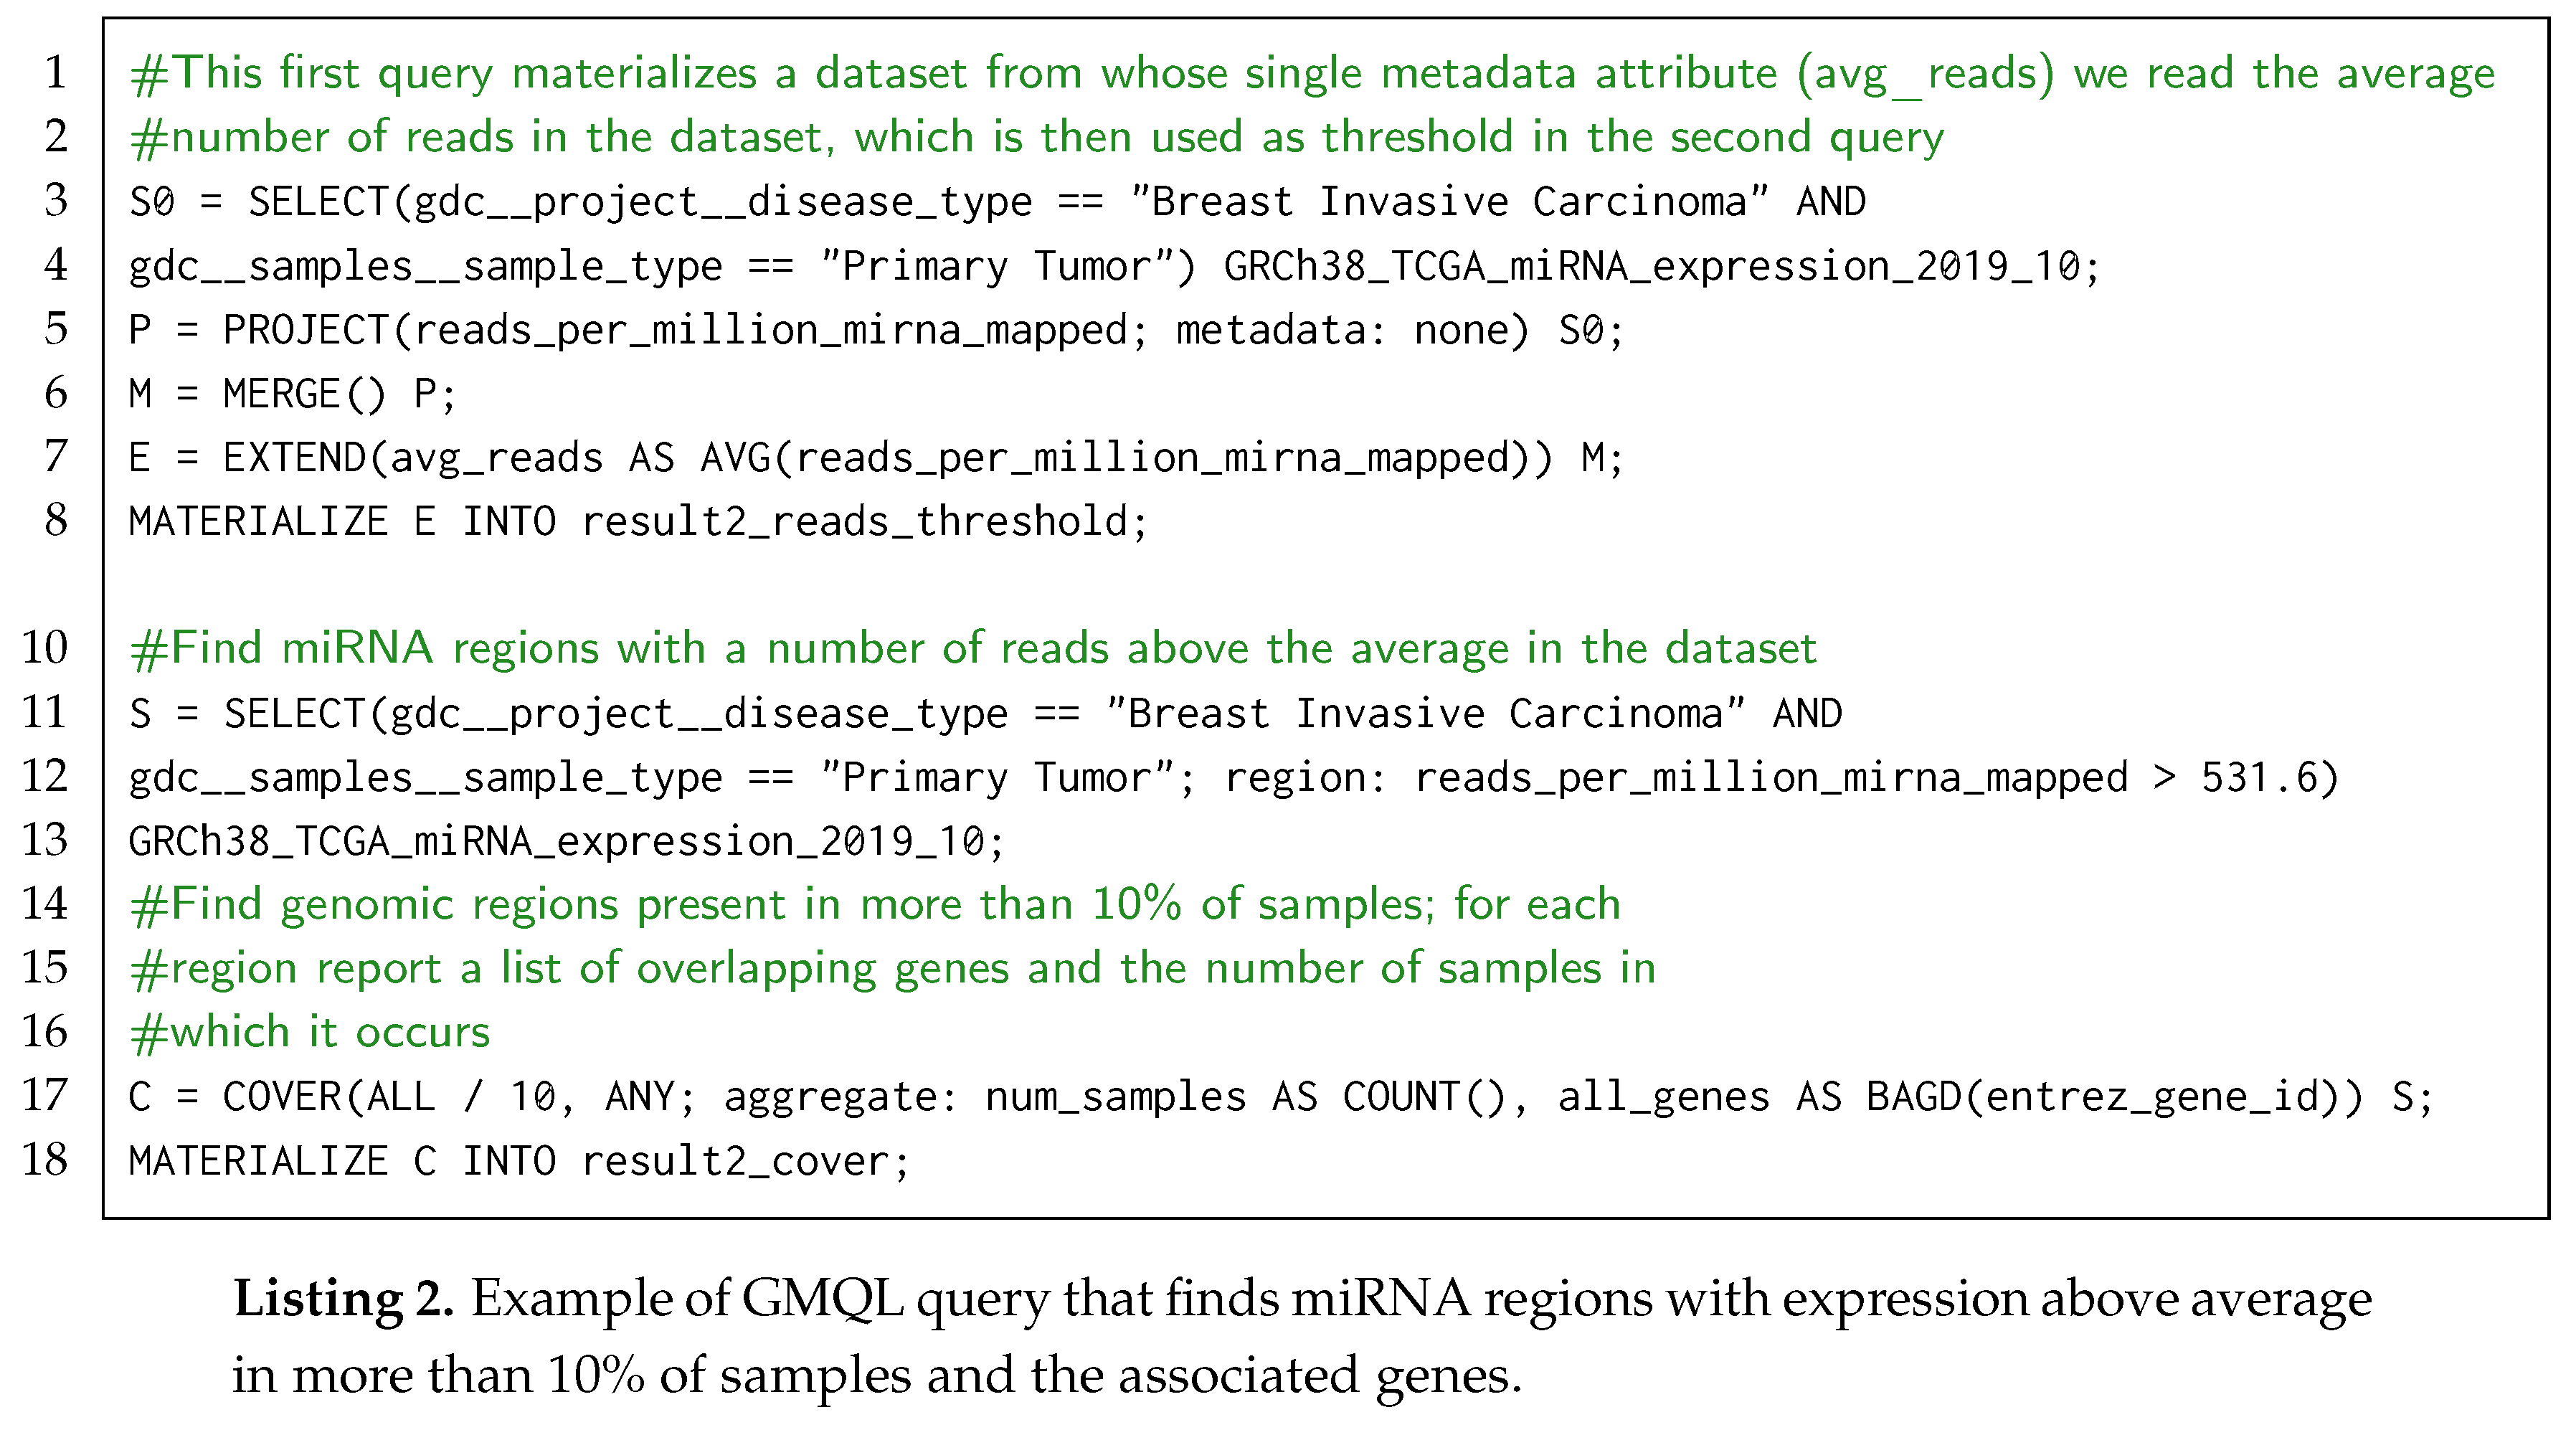
4.2. Use Case 2: in Breast Invasive Carcinoma, Find the Genomic Regions Whose Mirna Expression Counts Result above Average in at Least 10 % of Tumoral Samples
4.3. Use Case 3: in a Comparative Study, For Both Normal and Tumoral Tissue Samples of Each Patient Affected by Cholangiocarcinoma Extract the Expression and Average Promotorial Methylation Levels of Each Gene

5. Conclusions and Future Work
Supplementary Materials
Author Contributions
Funding
Acknowledgments
Availability of Software and Data
Conflicts of Interest
Abbreviations
| API | Application Programming Interface |
| BED | Browser Extensible Data format |
| BCR | Biospecimen Core Repository |
| CGC | Cancer Genomics Cloud |
| CNV | copy number variation |
| GDC | Genomic Data Commons |
| GDM | Genomic Data Model |
| GMQL | GenoMetric Query Language |
| ICD-O | International Classification of Diseases for Oncology |
| ICGC | International Cancer Genome Consortium |
| KICH | Kidney Chromophobe |
| KIRK | Kidney Renal Clear Cell Carcinoma |
| KIRP | Kidney Renal Papillary Cell Carcinoma |
| MAF | Mutation Annotation Format |
| MVC | Model-View-Controller |
| NCI | National Cancer Institute |
| NGS | Next Generation Sequencing |
| TCGA | The Cancer Genome Atlas |
| TSS | transcription start site |
| UUID | Universal Unique Identifier |
| WHO | World Health Organization. |
References
- Metzker, M.L. Sequencing technologies—The next generation. Nat. Rev. Genet. 2010, 11, 31. [Google Scholar] [CrossRef] [PubMed] [Green Version]
- Weitschek, E.; Santoni, D.; Fiscon, G.; De Cola, M.C.; Bertolazzi, P.; Felici, G. Next generation sequencing reads comparison with an alignment-free distance. BMC Res. Notes 2014, 7, 869. [Google Scholar] [CrossRef] [PubMed] [Green Version]
- Kamps, R.; Brandão, R.; Bosch, B.; Paulussen, A.; Xanthoulea, S.; Blok, M.; Romano, A. Next-generation sequencing in oncology: Genetic diagnosis, risk prediction and cancer classification. Int. J. Mol. Sci. 2017, 18, 308. [Google Scholar] [CrossRef] [PubMed]
- Ozsolak, F.; Milos, P.M. RNA sequencing: Advances, challenges and opportunities. Nat. Rev. Genet. 2011, 12, 87. [Google Scholar] [CrossRef] [PubMed]
- Zhang, Y.; Jeltsch, A. The application of next generation sequencing in DNA methylation analysis. Genes 2010, 1, 85–101. [Google Scholar] [CrossRef] [PubMed]
- Alkan, C.; Kidd, J.M.; Marques-Bonet, T.; Aksay, G.; Antonacci, F.; Hormozdiari, F.; Kitzman, J.O.; Baker, C.; Malig, M.; Mutlu, O.; et al. Personalized copy number and segmental duplication maps using next-generation sequencing. Nat. Genet. 2009, 41, 1061. [Google Scholar] [CrossRef]
- Bellazzi, R. Big data and biomedical informatics: A challenging opportunity. Yearb. Med. Inform. 2014, 23, 08–13. [Google Scholar] [CrossRef] [Green Version]
- Luo, J.; Wu, M.; Gopukumar, D.; Zhao, Y. Big data application in biomedical research and health care: A literature review. Biomed. Inform. Insights 2016, 8, BII–S31559. [Google Scholar] [CrossRef] [Green Version]
- Grossman, R.L.; Heath, A.P.; Ferretti, V.; Varmus, H.E.; Lowy, D.R.; Kibbe, W.A.; Staudt, L.M. Toward a shared vision for cancer genomic data. New Engl. J. Med. 2016, 375, 1109–1112. [Google Scholar] [CrossRef]
- Jensen, M.A.; Ferretti, V.; Grossman, R.L.; Staudt, L.M. The NCI Genomic Data Commons as an engine for precision medicine. Blood 2017, 130, 453–459. [Google Scholar] [CrossRef]
- Timmermann, B.; Kerick, M.; Roehr, C.; Fischer, A.; Isau, M.; Boerno, S.T.; Wunderlich, A.; Barmeyer, C.; Seemann, P.; Koenig, J.; et al. Somatic mutation profiles of MSI and MSS colorectal cancer identified by whole exome next generation sequencing and bioinformatics analysis. PLoS ONE 2010, 5, e15661. [Google Scholar] [CrossRef] [PubMed]
- Mortazavi, A.; Williams, B.A.; McCue, K.; Schaeffer, L.; Wold, B. Mapping and quantifying mammalian transcriptomes by RNA-Seq. Nat. Methods 2008, 5, 621. [Google Scholar] [CrossRef] [PubMed]
- Trapnell, C.; Williams, B.A.; Pertea, G.; Mortazavi, A.; Kwan, G.; Van Baren, M.J.; Salzberg, S.L.; Wold, B.J.; Pachter, L. Transcript assembly and quantification by RNA-Seq reveals unannotated transcripts and isoform switching during cell differentiation. Nat. Biotechnol. 2010, 28, 511. [Google Scholar] [CrossRef] [PubMed] [Green Version]
- Zeng, Y.; Cullen, B.R. Sequence requirements for micro RNA processing and function in human cells. RNA 2003, 9, 112–123. [Google Scholar] [CrossRef] [Green Version]
- Conrad, D.F.; Pinto, D.; Redon, R.; Feuk, L.; Gokcumen, O.; Zhang, Y.; Aerts, J.; Andrews, T.D.; Barnes, C.; Campbell, P.; et al. Origins and functional impact of copy number variation in the human genome. Nature 2010, 464, 704. [Google Scholar] [CrossRef] [Green Version]
- Bibikova, M.; Barnes, B.; Tsan, C.; Ho, V.; Klotzle, B.; Le, J.M.; Delano, D.; Zhang, L.; Schroth, G.P.; Gunderson, K.L.; et al. High density DNA methylation array with single CpG site resolution. Genomics 2011, 98, 288–295. [Google Scholar] [CrossRef] [Green Version]
- Weinstein, J.N.; Collisson, E.A.; Mills, G.B.; Shaw, K.R.M.; Ozenberger, B.A.; Ellrott, K.; Shmulevich, I.; Sander, C.; Stuart, J.M.; Network, C.G.A.R.; et al. The Cancer Genome Atlas pan-cancer analysis project. Nat. Genet. 2013, 45, 1113. [Google Scholar] [CrossRef]
- Liu, J.; Lichtenberg, T.; Hoadley, K.A.; Poisson, L.M.; Lazar, A.J.; Cherniack, A.D.; Kovatich, A.J.; Benz, C.C.; Levine, D.A.; Lee, A.V.; et al. An integrated TCGA pan-cancer clinical data resource to drive high-quality survival outcome analytics. Cell 2018, 173, 400–416. [Google Scholar] [CrossRef] [Green Version]
- Cappelli, E.; Felici, G.; Weitschek, E. Combining DNA methylation and RNA sequencing data of cancer for supervised knowledge extraction. Biodata Min. 2018, 11, 22. [Google Scholar] [CrossRef] [Green Version]
- Celli, F.; Cumbo, F.; Weitschek, E. Classification of large DNA methylation datasets for identifying cancer drivers. Big Data Res. 2018, 13, 21–28. [Google Scholar] [CrossRef]
- Weitschek, E.; Cumbo, F.; Cappelli, E.; Felici, G. Genomic data integration: A case study on next generation sequencing of cancer. In Proceedings of the 2016 27th International Workshop on Database and Expert Systems Applications (DEXA), Porto, Portugal, 5–8 September 2016; pp. 49–53. [Google Scholar]
- Harrow, J.; Frankish, A.; Gonzalez, J.M.; Tapanari, E.; Diekhans, M.; Kokocinski, F.; Aken, B.L.; Barrell, D.; Zadissa, A.; Searle, S.; et al. GENCODE: The reference human genome annotation for The ENCODE Project. Genome Res. 2012, 22, 1760–1774. [Google Scholar] [CrossRef] [PubMed] [Green Version]
- Eyre, T.A.; Ducluzeau, F.; Sneddon, T.P.; Povey, S.; Bruford, E.A.; Lush, M.J. The HUGO gene nomenclature database, 2006 updates. Nucleic Acids Res. 2006, 34, D319–D321. [Google Scholar] [CrossRef] [PubMed]
- Griffiths-Jones, S.; Saini, H.K.; van Dongen, S.; Enright, A.J. miRBase: Tools for microRNA genomics. Nucleic Acids Res. 2007, 36, D154–D158. [Google Scholar] [CrossRef] [PubMed] [Green Version]
- Sayers, E.W.; Agarwala, R.; Bolton, E.E.; Brister, J.R.; Canese, K.; Clark, K.; Connor, R.; Fiorini, N.; Funk, K.; Hefferon, T.; et al. Database resources of the national center for biotechnology information. Nucleic Acids Res. 2019, 47, D23. [Google Scholar] [CrossRef] [Green Version]
- Cumbo, F.; Fiscon, G.; Ceri, S.; Masseroli, M.; Weitschek, E. TCGA2BED: Extracting, extending, integrating, and querying The Cancer Genome Atlas. BMC Bioinform. 2017, 18, 6. [Google Scholar] [CrossRef] [Green Version]
- Masseroli, M.; Kaitoua, A.; Pinoli, P.; Ceri, S. Modeling and interoperability of heterogeneous genomic big data for integrative processing and querying. Methods 2016, 111, 3–11. [Google Scholar] [CrossRef]
- Masseroli, M.; Pinoli, P.; Venco, F.; Kaitoua, A.; Jalili, V.; Palluzzi, F.; Muller, H.; Ceri, S. GenoMetric Query Language: A novel approach to large-scale genomic data management. Bioinformatics 2015, 31, 1881–1888. [Google Scholar] [CrossRef]
- Masseroli, M.; Canakoglu, A.; Pinoli, P.; Kaitoua, A.; Gulino, A.; Horlova, O.; Nanni, L.; Bernasconi, A.; Perna, S.; Stamoulakatou, E.; et al. Processing of big heterogeneous genomic datasets for tertiary analysis of Next Generation Sequencing data. Bioinformatics 2018, 35, 729–736. [Google Scholar] [CrossRef]
- Wei, L.; Jin, Z.; Yang, S.; Xu, Y.; Zhu, Y.; Ji, Y. TCGA-assembler 2: Software pipeline for retrieval and processing of TCGA/CPTAC data. Bioinformatics 2017, 34, 1615–1617. [Google Scholar] [CrossRef] [Green Version]
- Zhang, J.; Baran, J.; Cros, A.; Guberman, J.M.; Haider, S.; Hsu, J.; Liang, Y.; Rivkin, E.; Wang, J.; Whitty, B.; et al. International Cancer Genome Consortium Data Portal—A one-stop shop for cancer genomics data. Database 2011, 2011, bar026. [Google Scholar] [CrossRef] [Green Version]
- Lau, J.W.; Lehnert, E.; Sethi, A.; Malhotra, R.; Kaushik, G.; Onder, Z.; Groves-Kirkby, N.; Mihajlovic, A.; DiGiovanna, J.; Srdic, M.; et al. The Cancer Genomics Cloud: Collaborative, reproducible, and democratized—A new paradigm in large-scale computational research. Cancer Res. 2017, 77, e3–e6. [Google Scholar] [CrossRef] [PubMed] [Green Version]
- Colaprico, A.; Silva, T.C.; Olsen, C.; Garofano, L.; Cava, C.; Garolini, D.; Sabedot, T.S.; Malta, T.M.; Pagnotta, S.M.; Castiglioni, I.; et al. TCGAbiolinks: An R/Bioconductor package for integrative analysis of TCGA data. Nucleic Acids Res. 2016, 44, e71. [Google Scholar] [CrossRef] [PubMed]
- Cerami, E.; Gao, J.; Dogrusoz, U.; Gross, B.E.; Sumer, S.O.; Aksoy, B.A.; Jacobsen, A.; Byrne, C.J.; Heuer, M.L.; Larsson, E.; et al. The cBio cancer genomics portal: An open platform for exploring multidimensional cancer genomics data. Cancer Discov. 2012, 2, 401–404. [Google Scholar] [CrossRef] [PubMed] [Green Version]
- Goldman, M.; Craft, B.; Brooks, A.; Zhu, J.; Haussler, D. The UCSC Xena Platform for cancer genomics data visualization and interpretation. BioRxiv 2018, 26470. [Google Scholar] [CrossRef] [Green Version]
- Settino, M.; Cannataro, M. Survey of main tools for querying and analyzing TCGA data. In Proceedings of the 2018 IEEE International Conference on Bioinformatics and Biomedicine (BIBM), Madrid, Spain, 3–6 December 2018; pp. 1711–1718. [Google Scholar]
- Quinlan, A.R.; Hall, I.M. BEDTools: A flexible suite of utilities for comparing genomic features. Bioinformatics 2010, 26, 841–842. [Google Scholar] [CrossRef] [Green Version]
- Fan, Y.; Xi, L.; Hughes, D.S.; Zhang, J.; Zhang, J.; Futreal, P.A.; Wheeler, D.A.; Wang, W. MuSE: Accounting for tumor heterogeneity using a sample-specific error model improves sensitivity and specificity in mutation calling from sequencing data. Genome Biol. 2016, 17, 178. [Google Scholar] [CrossRef] [Green Version]
- Larson, D.E.; Harris, C.C.; Chen, K.; Koboldt, D.C.; Abbott, T.E.; Dooling, D.J.; Ley, T.J.; Mardis, E.R.; Wilson, R.K.; Ding, L. SomaticSniper: Identification of somatic point mutations in whole genome sequencing data. Bioinformatics 2011, 28, 311–317. [Google Scholar] [CrossRef] [Green Version]
- Cibulskis, K.; Lawrence, M.S.; Carter, S.L.; Sivachenko, A.; Jaffe, D.; Sougnez, C.; Gabriel, S.; Meyerson, M.; Lander, E.S.; Getz, G. Sensitive detection of somatic point mutations in impure and heterogeneous cancer samples. Nat. Biotechnol. 2013, 31, 213. [Google Scholar] [CrossRef]
- Koboldt, D.C.; Zhang, Q.; Larson, D.E.; Shen, D.; McLellan, M.D.; Lin, L.; Miller, C.A.; Mardis, E.R.; Ding, L.; Wilson, R.K. VarScan 2: Somatic mutation and copy number alteration discovery in cancer by exome sequencing. Genome Res. 2012, 22, 568–576. [Google Scholar] [CrossRef] [Green Version]
- OpenGDC FTP Repository. Available online: ftp://geco.deib.polimi.it/opengdc/bed/ (accessed on 31 May 2020).
- Apache Spark. Available online: http://spark.apache.org/ (accessed on 31 May 2020).
- Bernasconi, A.; Canakoglu, A.; Masseroli, M.; Ceri, S. The road towards data integration in human genomics: Players, steps and interactions. Briefings Bioinform. 2020, bbaa080. [Google Scholar] [CrossRef]
- GenoSurf. Available online: http://www.gmql.eu/genosurf (accessed on 31 May 2020).
- Canakoglu, A.; Bernasconi, A.; Colombo, A.; Masseroli, M.; Ceri, S. GenoSurf: Metadata driven semantic search system for integrated genomic datasets. Database J. Biol. Databases Curation 2019, 2019, baz132. [Google Scholar] [CrossRef] [PubMed] [Green Version]
- Bernasconi, A.; Ceri, S.; Campi, A.; Masseroli, M. Conceptual Modeling for Genomics: Building an Integrated Repository of Open Data. In Conceptual Modeling; Mayr, H.C., Guizzardi, G., Ma, H., Pastor, O., Eds.; Springer International Publishing: Cham, Switzerland, 2017; pp. 325–339. [Google Scholar]
- Encode, C. An integrated encyclopedia of DNA elements in the human genome. Nature 2012, 489, 57–74. [Google Scholar]
- Kundaje, A.; Meuleman, W.; Ernst, J.; Bilenky, M.; Yen, A.; Heravi-Moussavi, A.; Kheradpour, P.; Zhang, Z.; Wang, J.; Ziller, M.J.; et al. Integrative analysis of 111 reference human epigenomes. Nature 2015, 518, 317. [Google Scholar] [CrossRef] [PubMed] [Green Version]
- Consortium, G.P. A global reference for human genetic variation. Nature 2015, 526, 68–74. [Google Scholar] [CrossRef] [Green Version]
- Bernasconi, A.; Canakoglu, A.; Masseroli, M.; Ceri, S. META-BASE: A Novel Architecture for Large-Scale Genomic Metadata Integration. IEEE/ACM Trans. Comput. Biol. Bioinform. 2020. [Google Scholar] [CrossRef]
- GMQL. Available online: http://genomic.deib.polimi.it/gmql-rest/ (accessed on 31 May 2020).
- Nanni, L.; Pinoli, P.; Canakoglu, A.; Ceri, S. PyGMQL: Scalable data extraction and analysis for heterogeneous genomic datasets. BMC Bioinform. 2019, 20, 560. [Google Scholar] [CrossRef] [Green Version]
- Sherry, S.T.; Ward, M.H.; Kholodov, M.; Baker, J.; Phan, L.; Smigielski, E.M.; Sirotkin, K. dbSNP: The NCBI database of genetic variation. Nucleic Acids Res. 2001, 29, 308–311. [Google Scholar] [CrossRef] [Green Version]


| Preserved | Different Attributes | Values |
|---|---|---|
| biospecimen__bio__analyte_type | RNA | |
| × | gdc__cases__samples__portions__analytes__analyte_type | RNA |
| × | biospecimen__admin__day_of_dcc_upload | 31 |
| clinical__admin__day_of_dcc_upload | 31 | |
| × | gdc__cases__primary_site | Ovary |
| gdc__cases__project__primary_site | Ovary | |
| × | gdc__cases__samples__portions__analytes__aliquots__concentration | 0.17 |
| gdc__cases__samples__portions__analytes__concentration | 0.17 |
| GDC Naming | OpenGDC Flattened | OpenGDC Renamed |
|---|---|---|
| cases.diagnoses.age_at_diagnosis | gdc__cases__diagnoses__age_at_diagnosis | gdc__diagnoses__age_at_diagnosis |
| analysis.input_files.data_category | gdc__analysis__input_files__data_category | gdc__input_files__data_category |
| cases.project.program.name | gdc__cases__project__program__name | gdc__program__name |
| Tumor | Aliquots | Samples | Patients |
|---|---|---|---|
| Acute Myeloid Leukemia | 1605 | 1605 | 1211 |
| Adrenocortical Carcinoma | 771 | 771 | 595 |
| Bladder Urothelial Carcinoma | 3786 | 3762 | 2873 |
| Brain Lower Grade Glioma | 4674 | 4674 | 3590 |
| Breast Invasive Carcinoma | 10,305 | 10,280 | 7520 |
| Cervical Squamous Cell Carcinoma and Endocervical Adenocarcinoma | 2706 | 2706 | 2118 |
| Cholangiocarcinoma | 401 | 401 | 267 |
| Colon Adenocarcinoma | 4358 | 4244 | 3121 |
| Esophageal Carcinoma | 1705 | 1701 | 1271 |
| Glioblastoma Multiforme | 3347 | 3282 | 2190 |
| Head and Neck Squamous Cell Carcinoma | 4955 | 4951 | 3636 |
| Kidney Chromophobe | 667 | 667 | 462 |
| Kidney Renal Clear Cell Carcinoma | 5322 | 5155 | 3499 |
| Kidney Renal Papillary Cell Carcinoma | 2812 | 2784 | 2023 |
| Liver Hepatocellular Carcinoma | 3604 | 3602 | 2610 |
| Lung Adenocarcinoma | 5245 | 5146 | 3722 |
| Lung Squamous Cell Carcinoma | 4780 | 4736 | 3460 |
| Lymphoid Neoplasm Diffuse Large B-cell Lymphoma | 423 | 423 | 327 |
| Mesothelioma | 775 | 775 | 603 |
| Ovarian Serous Cystadenocarcinoma | 4825 | 4777 | 3586 |
| Pancreatic Adenocarcinoma | 1659 | 1659 | 1267 |
| Pheochromocytoma and Paraganglioma | 1652 | 1652 | 1253 |
| Prostate Adenocarcinoma | 4778 | 4778 | 3473 |
| Rectum Adenocarcinoma | 1462 | 1453 | 1124 |
| Sarcoma | 2341 | 2335 | 1797 |
| Skin Cutaneous Melanoma | 4197 | 4197 | 3242 |
| Stomach Adenocarcinoma | 4108 | 4080 | 3018 |
| Testicular Germ Cell Tumors | 1377 | 1377 | 1045 |
| Thymoma | 1120 | 1120 | 862 |
| Thyroid Carcinoma | 4827 | 4827 | 3523 |
| Uterine Carcinosarcoma | 504 | 504 | 398 |
| Uterine Corpus Endometrial Carcinoma | 5088 | 5058 | 3860 |
| Uveal Melanoma | 720 | 720 | 560 |
| Chr | Left | Right | Strand | Gene_symbol | Fpkm | avg_beta_value | fpkm | avg_beta_value |
|---|---|---|---|---|---|---|---|---|
| chr1 | 166971581 | 166976581 | + | MAEL | 0.27401479 | 0.07428182 | 0.19981536 | 0.06583118 |
| chr1 | 166974482 | 166979482 | - | ILDR2 | 0.13031929 | 0.11815327 | 0.06208503 | 0.13756338 |
| chr3 | 38949561 | 38954561 | - | SCN11A | 0.04643162 | 0.88310268 | 0.01814642 | 0.73347131 |
| chr6 | 152746797 | 152751797 | + | VIP | 0.50472323 | 0.13604175 | 0.11766157 | 0.35010738 |
| chr11 | 114558895 | 114563895 | - | NXPE1 | 0 | 0.80843122 | 0.01618970 | 0.82677058 |
| chr4 | 8955627 | 8960627 | + | UNC93B8 | 0 | null | 0 | null |
| chr12 | 126615554 | 126620554 | - | RP11-407A16.8 | 0 | 0.96168949 | 0 | 0.97617533 |
| chr1 | 154205333 | 154210333 | - | C1orf189 | 0.16309294 | 0.89600850 | 0 | 0.90502790 |
| chr10 | 88786061 | 88791061 | - | RCBTB2P1 | 0 | null | 0 | null |
| ... | ... | ... | ... | ... | ... | ... | ... | ... |
© 2020 by the authors. Licensee MDPI, Basel, Switzerland. This article is an open access article distributed under the terms and conditions of the Creative Commons Attribution (CC BY) license (http://creativecommons.org/licenses/by/4.0/).
Share and Cite
Cappelli, E.; Cumbo, F.; Bernasconi, A.; Canakoglu, A.; Ceri, S.; Masseroli, M.; Weitschek, E. OpenGDC: Unifying, Modeling, Integrating Cancer Genomic Data and Clinical Metadata. Appl. Sci. 2020, 10, 6367. https://doi.org/10.3390/app10186367
Cappelli E, Cumbo F, Bernasconi A, Canakoglu A, Ceri S, Masseroli M, Weitschek E. OpenGDC: Unifying, Modeling, Integrating Cancer Genomic Data and Clinical Metadata. Applied Sciences. 2020; 10(18):6367. https://doi.org/10.3390/app10186367
Chicago/Turabian StyleCappelli, Eleonora, Fabio Cumbo, Anna Bernasconi, Arif Canakoglu, Stefano Ceri, Marco Masseroli, and Emanuel Weitschek. 2020. "OpenGDC: Unifying, Modeling, Integrating Cancer Genomic Data and Clinical Metadata" Applied Sciences 10, no. 18: 6367. https://doi.org/10.3390/app10186367
APA StyleCappelli, E., Cumbo, F., Bernasconi, A., Canakoglu, A., Ceri, S., Masseroli, M., & Weitschek, E. (2020). OpenGDC: Unifying, Modeling, Integrating Cancer Genomic Data and Clinical Metadata. Applied Sciences, 10(18), 6367. https://doi.org/10.3390/app10186367