Study on Magnetic Resonance Characteristics of Coal Sample under Progressive Loads


Abstract
:1. Introduction
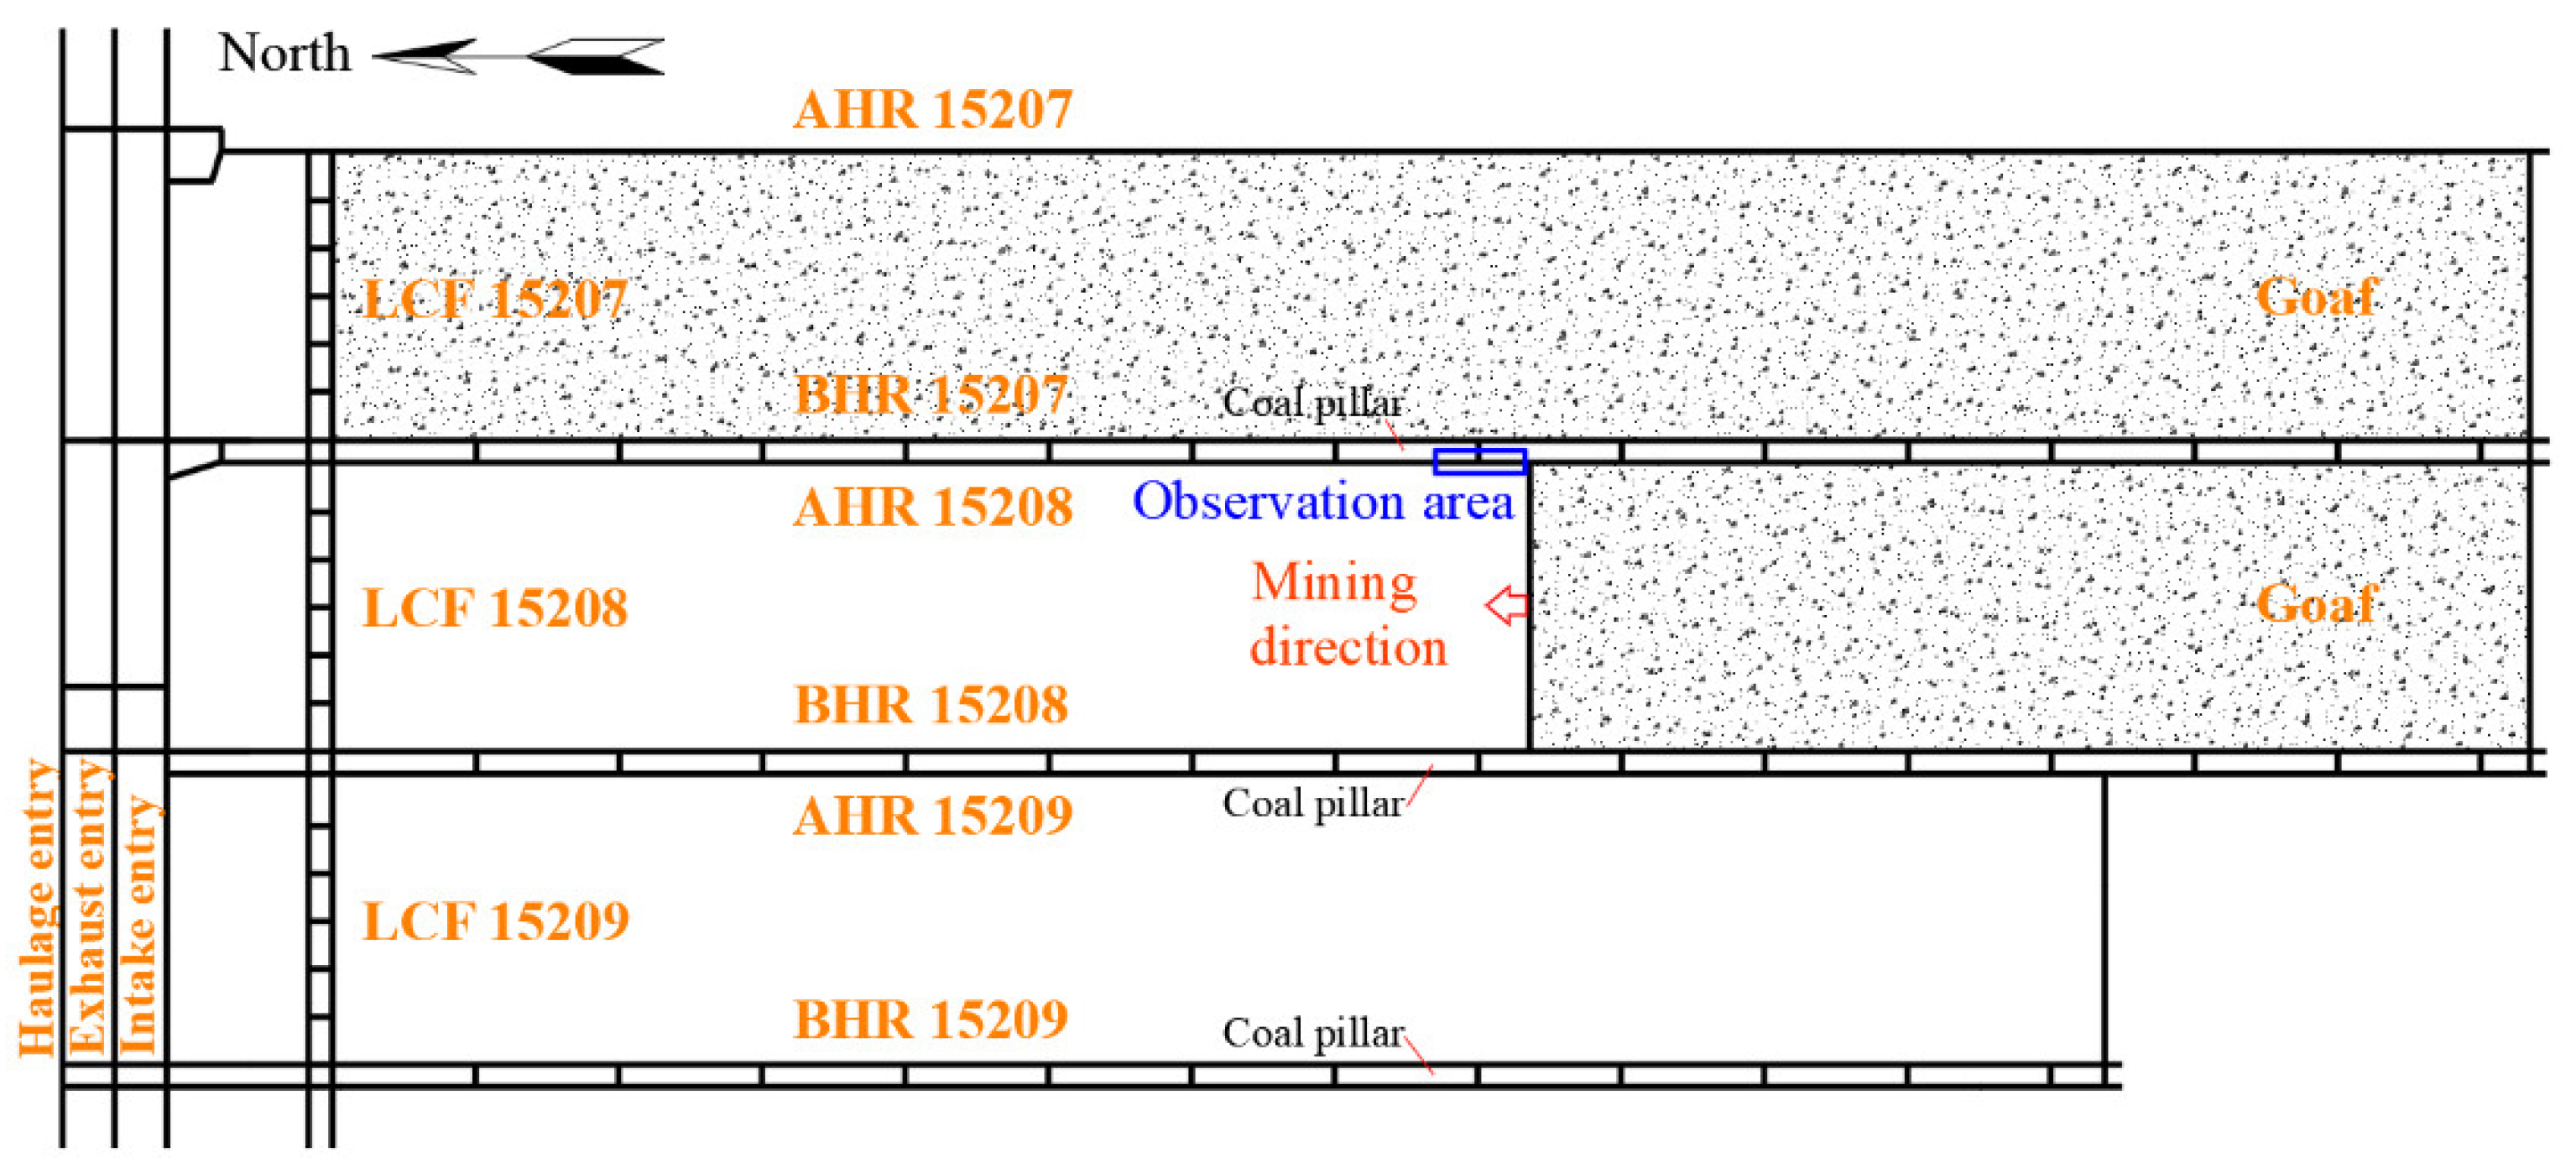
2. Engineering Geological Background
2.1. General Geological Situation
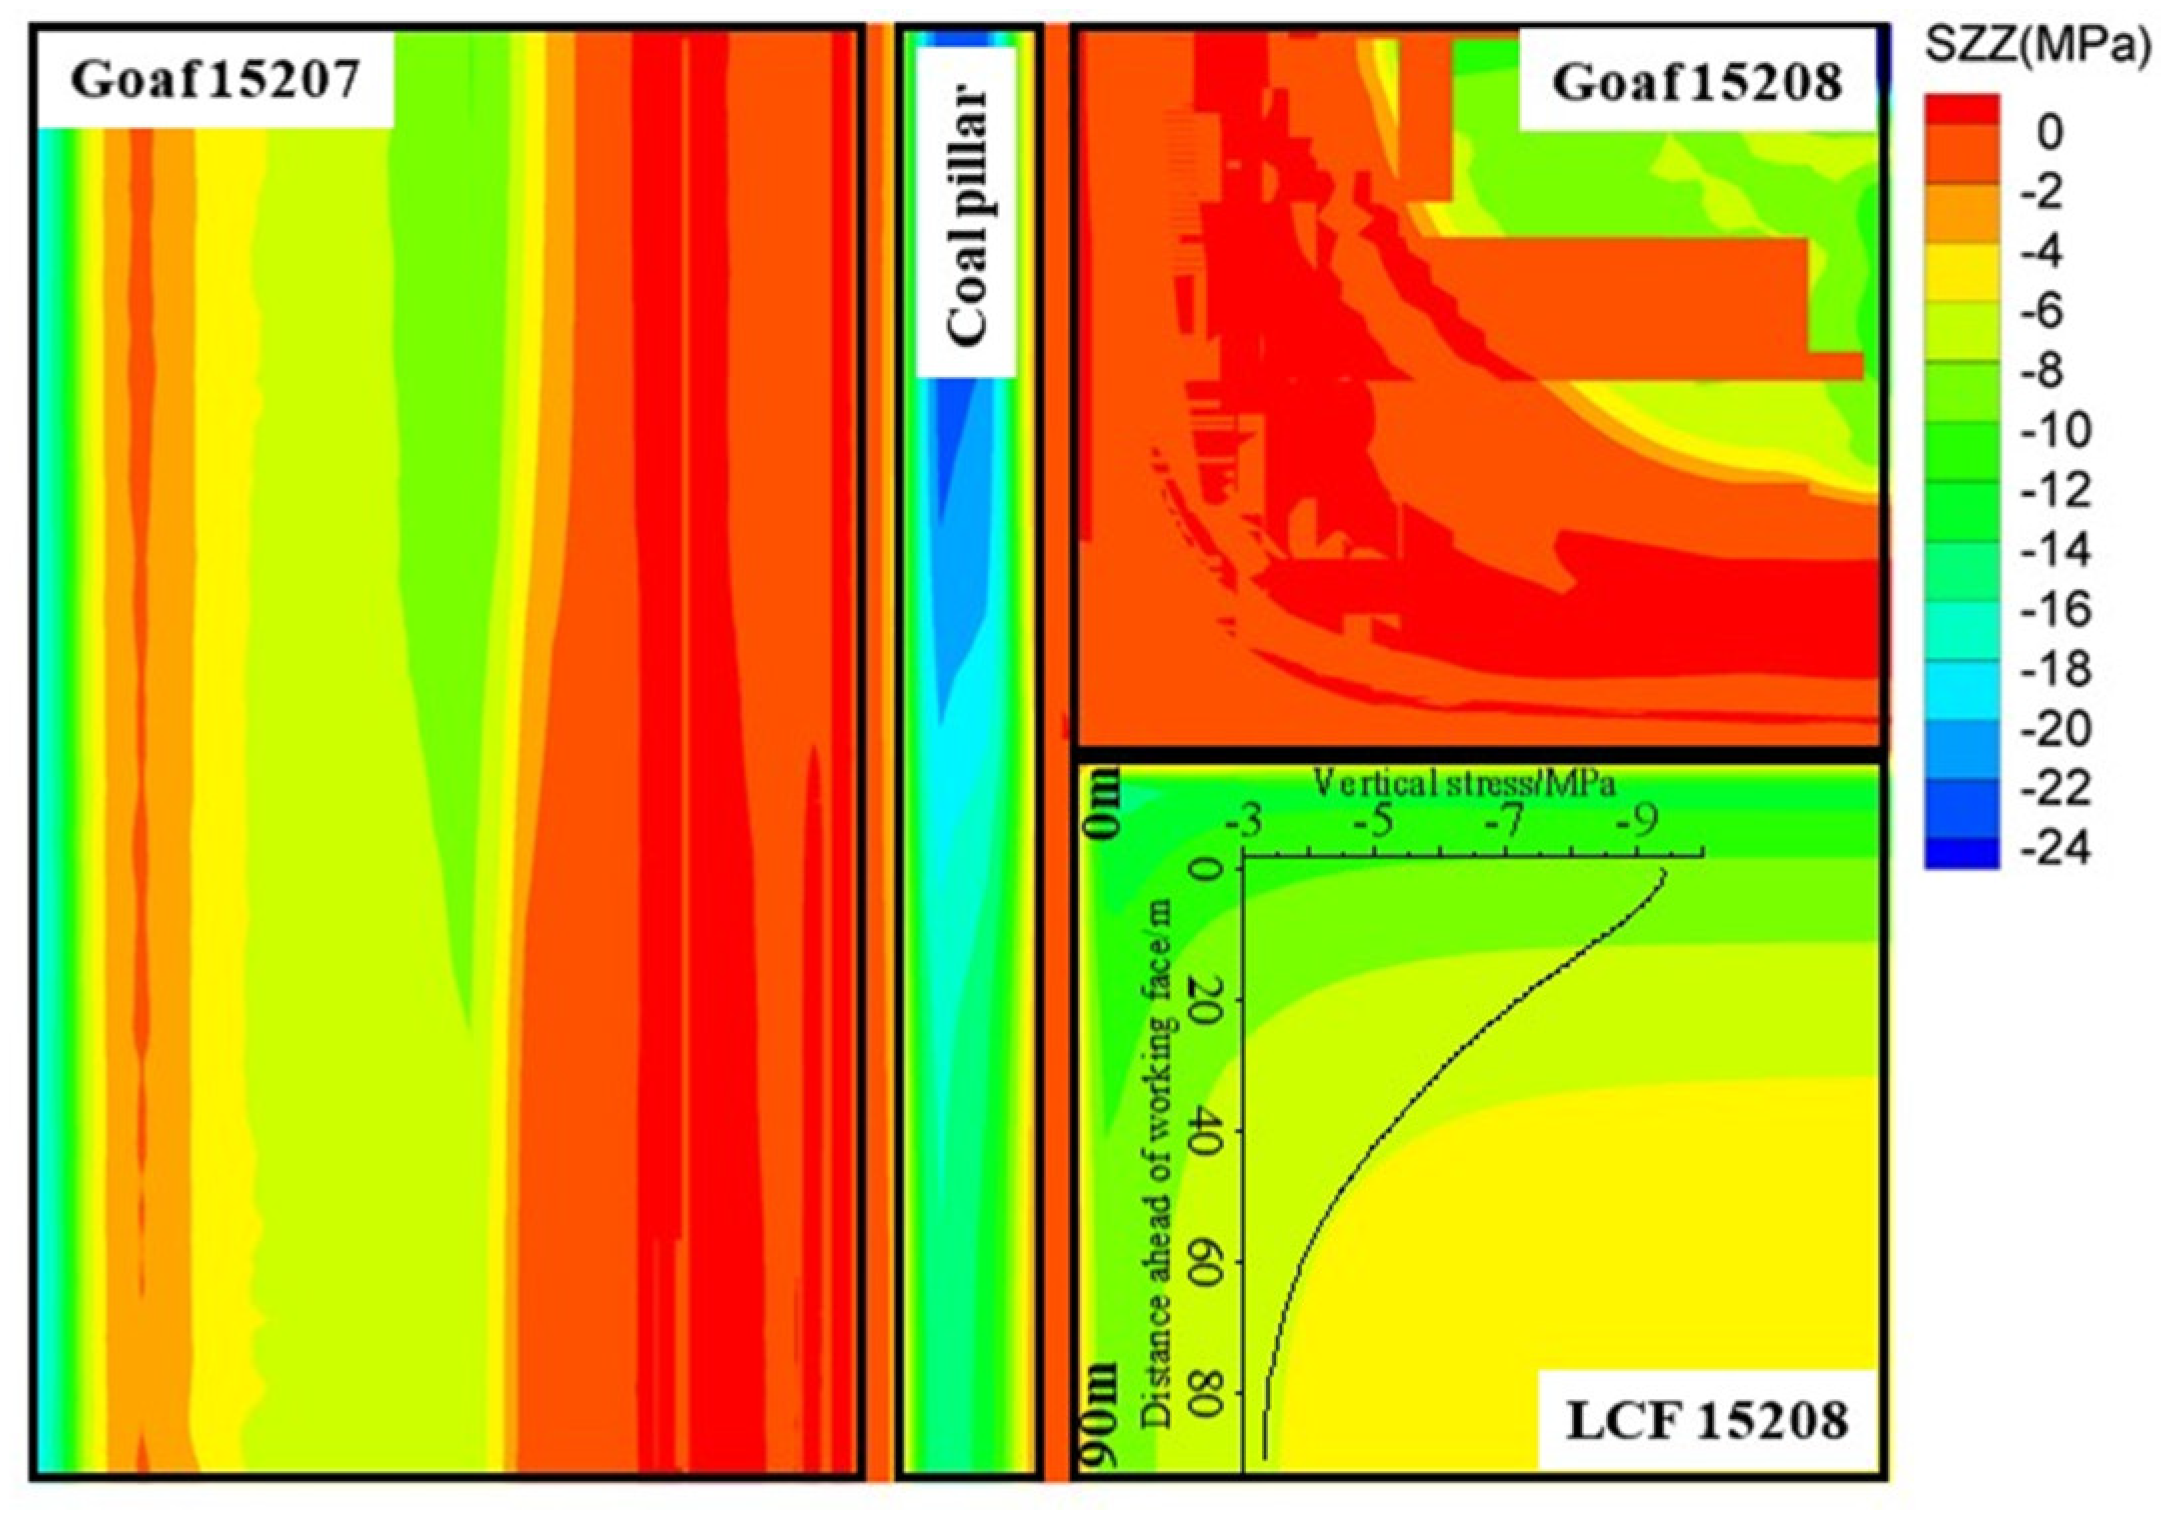
2.2. Characteristics of Gradual Coal Wall Failure in the Supporting Pressure Area
3. Materials and Methods
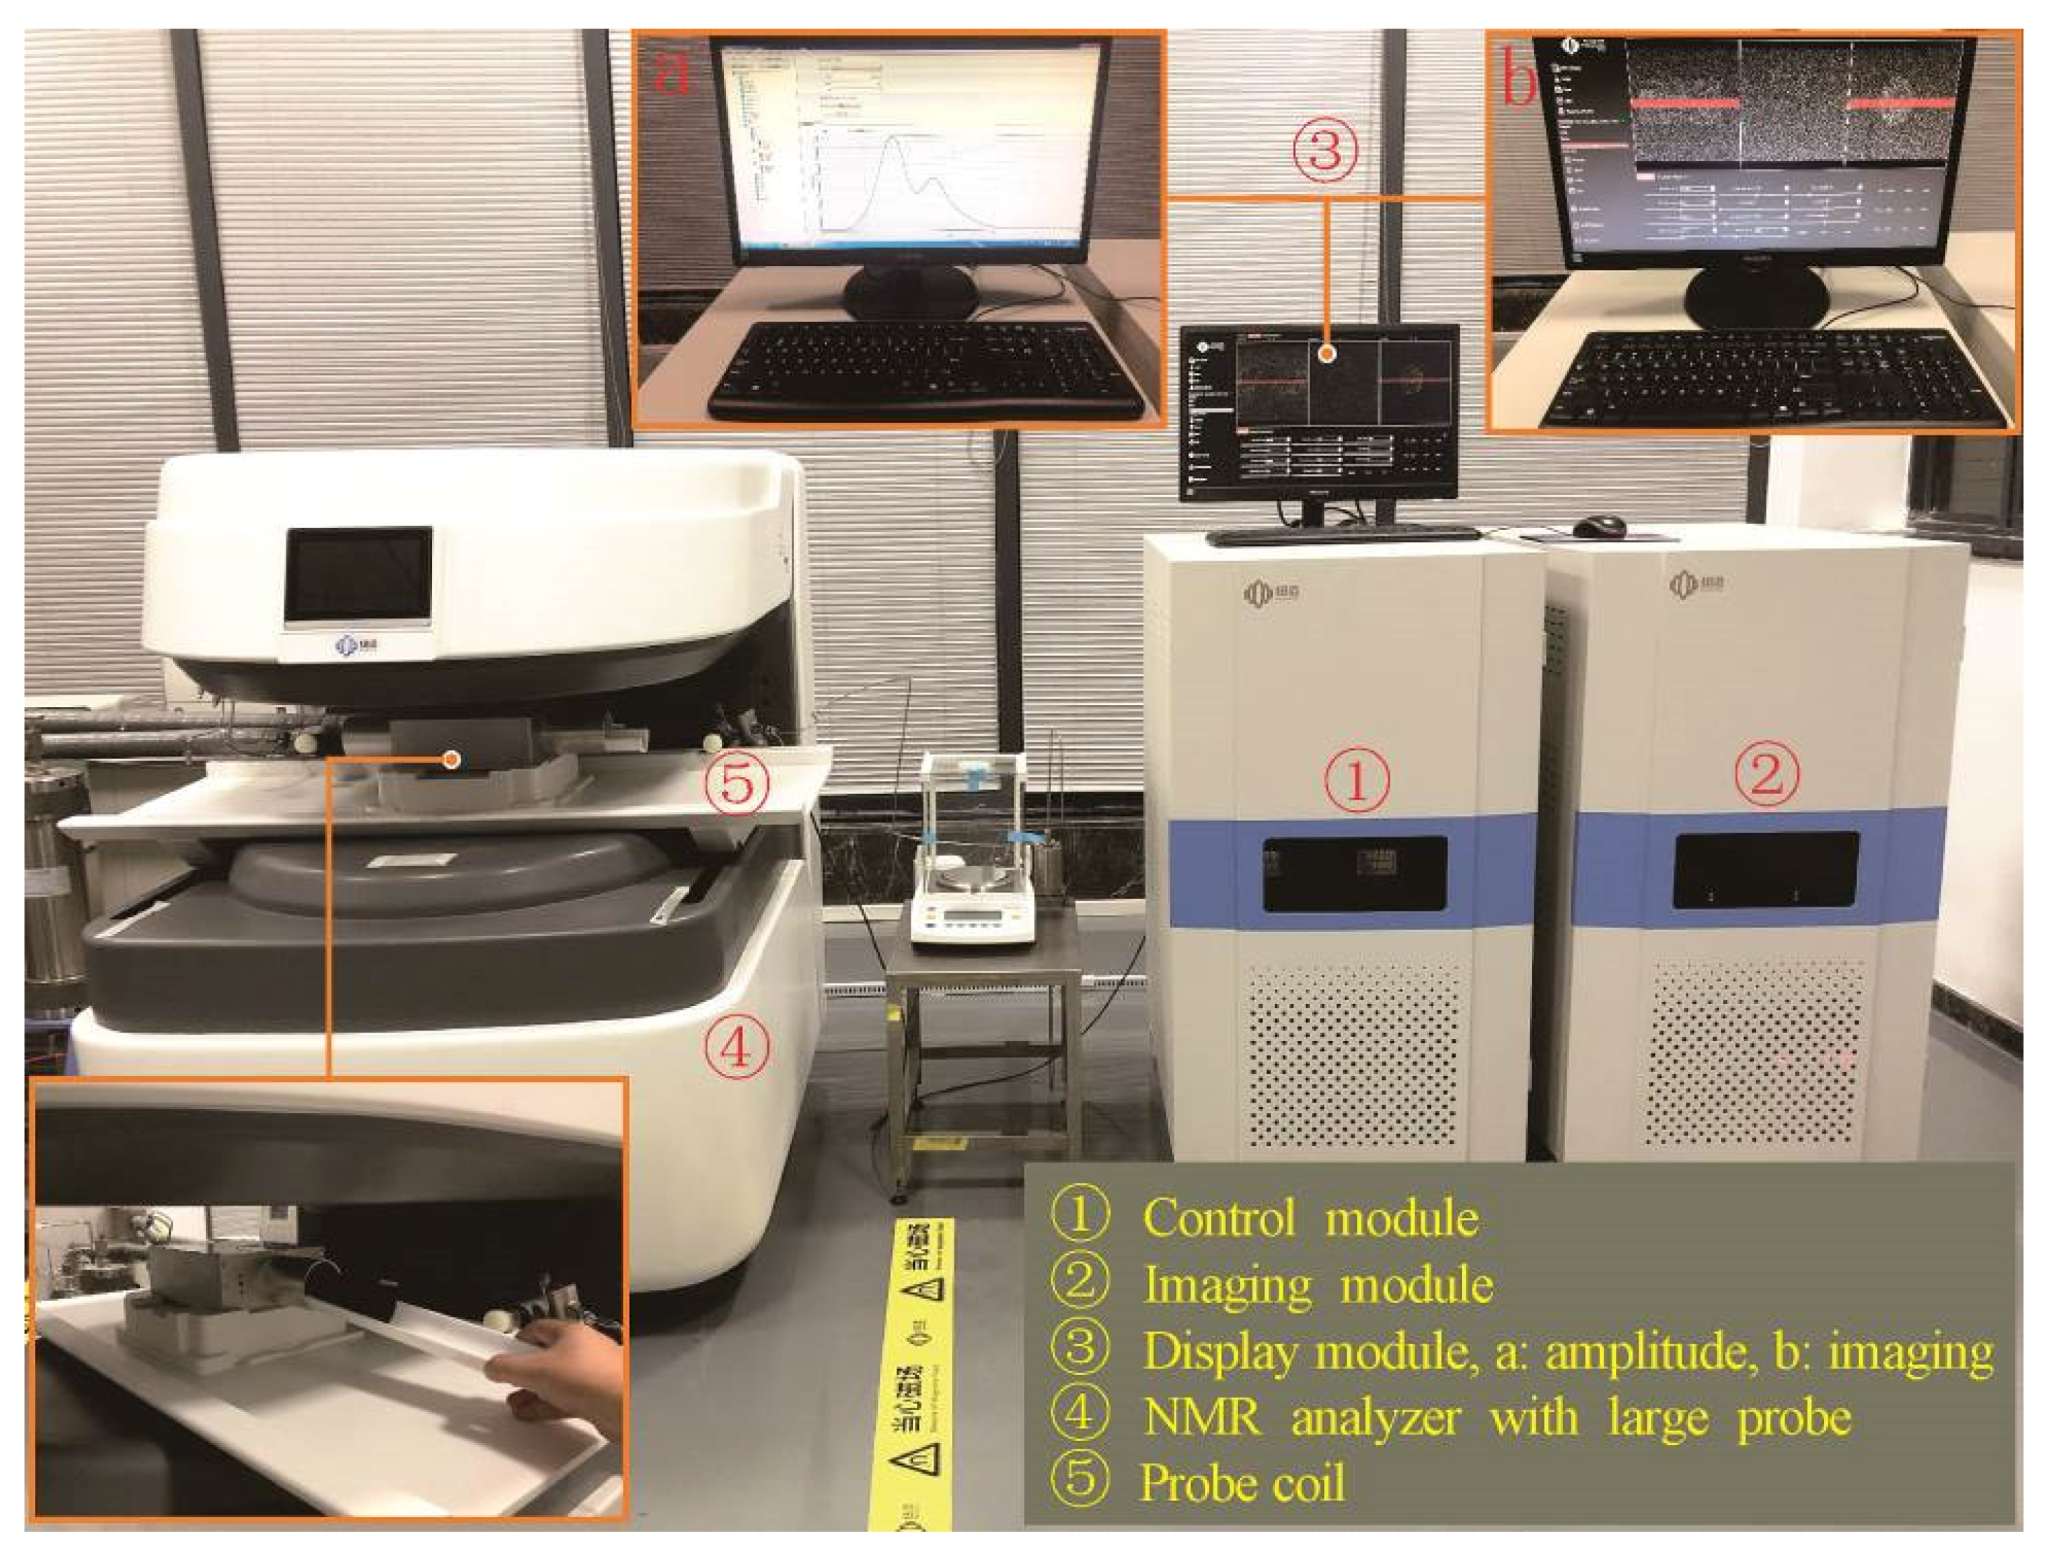
3.1. Test Equipment
3.2. Test Method
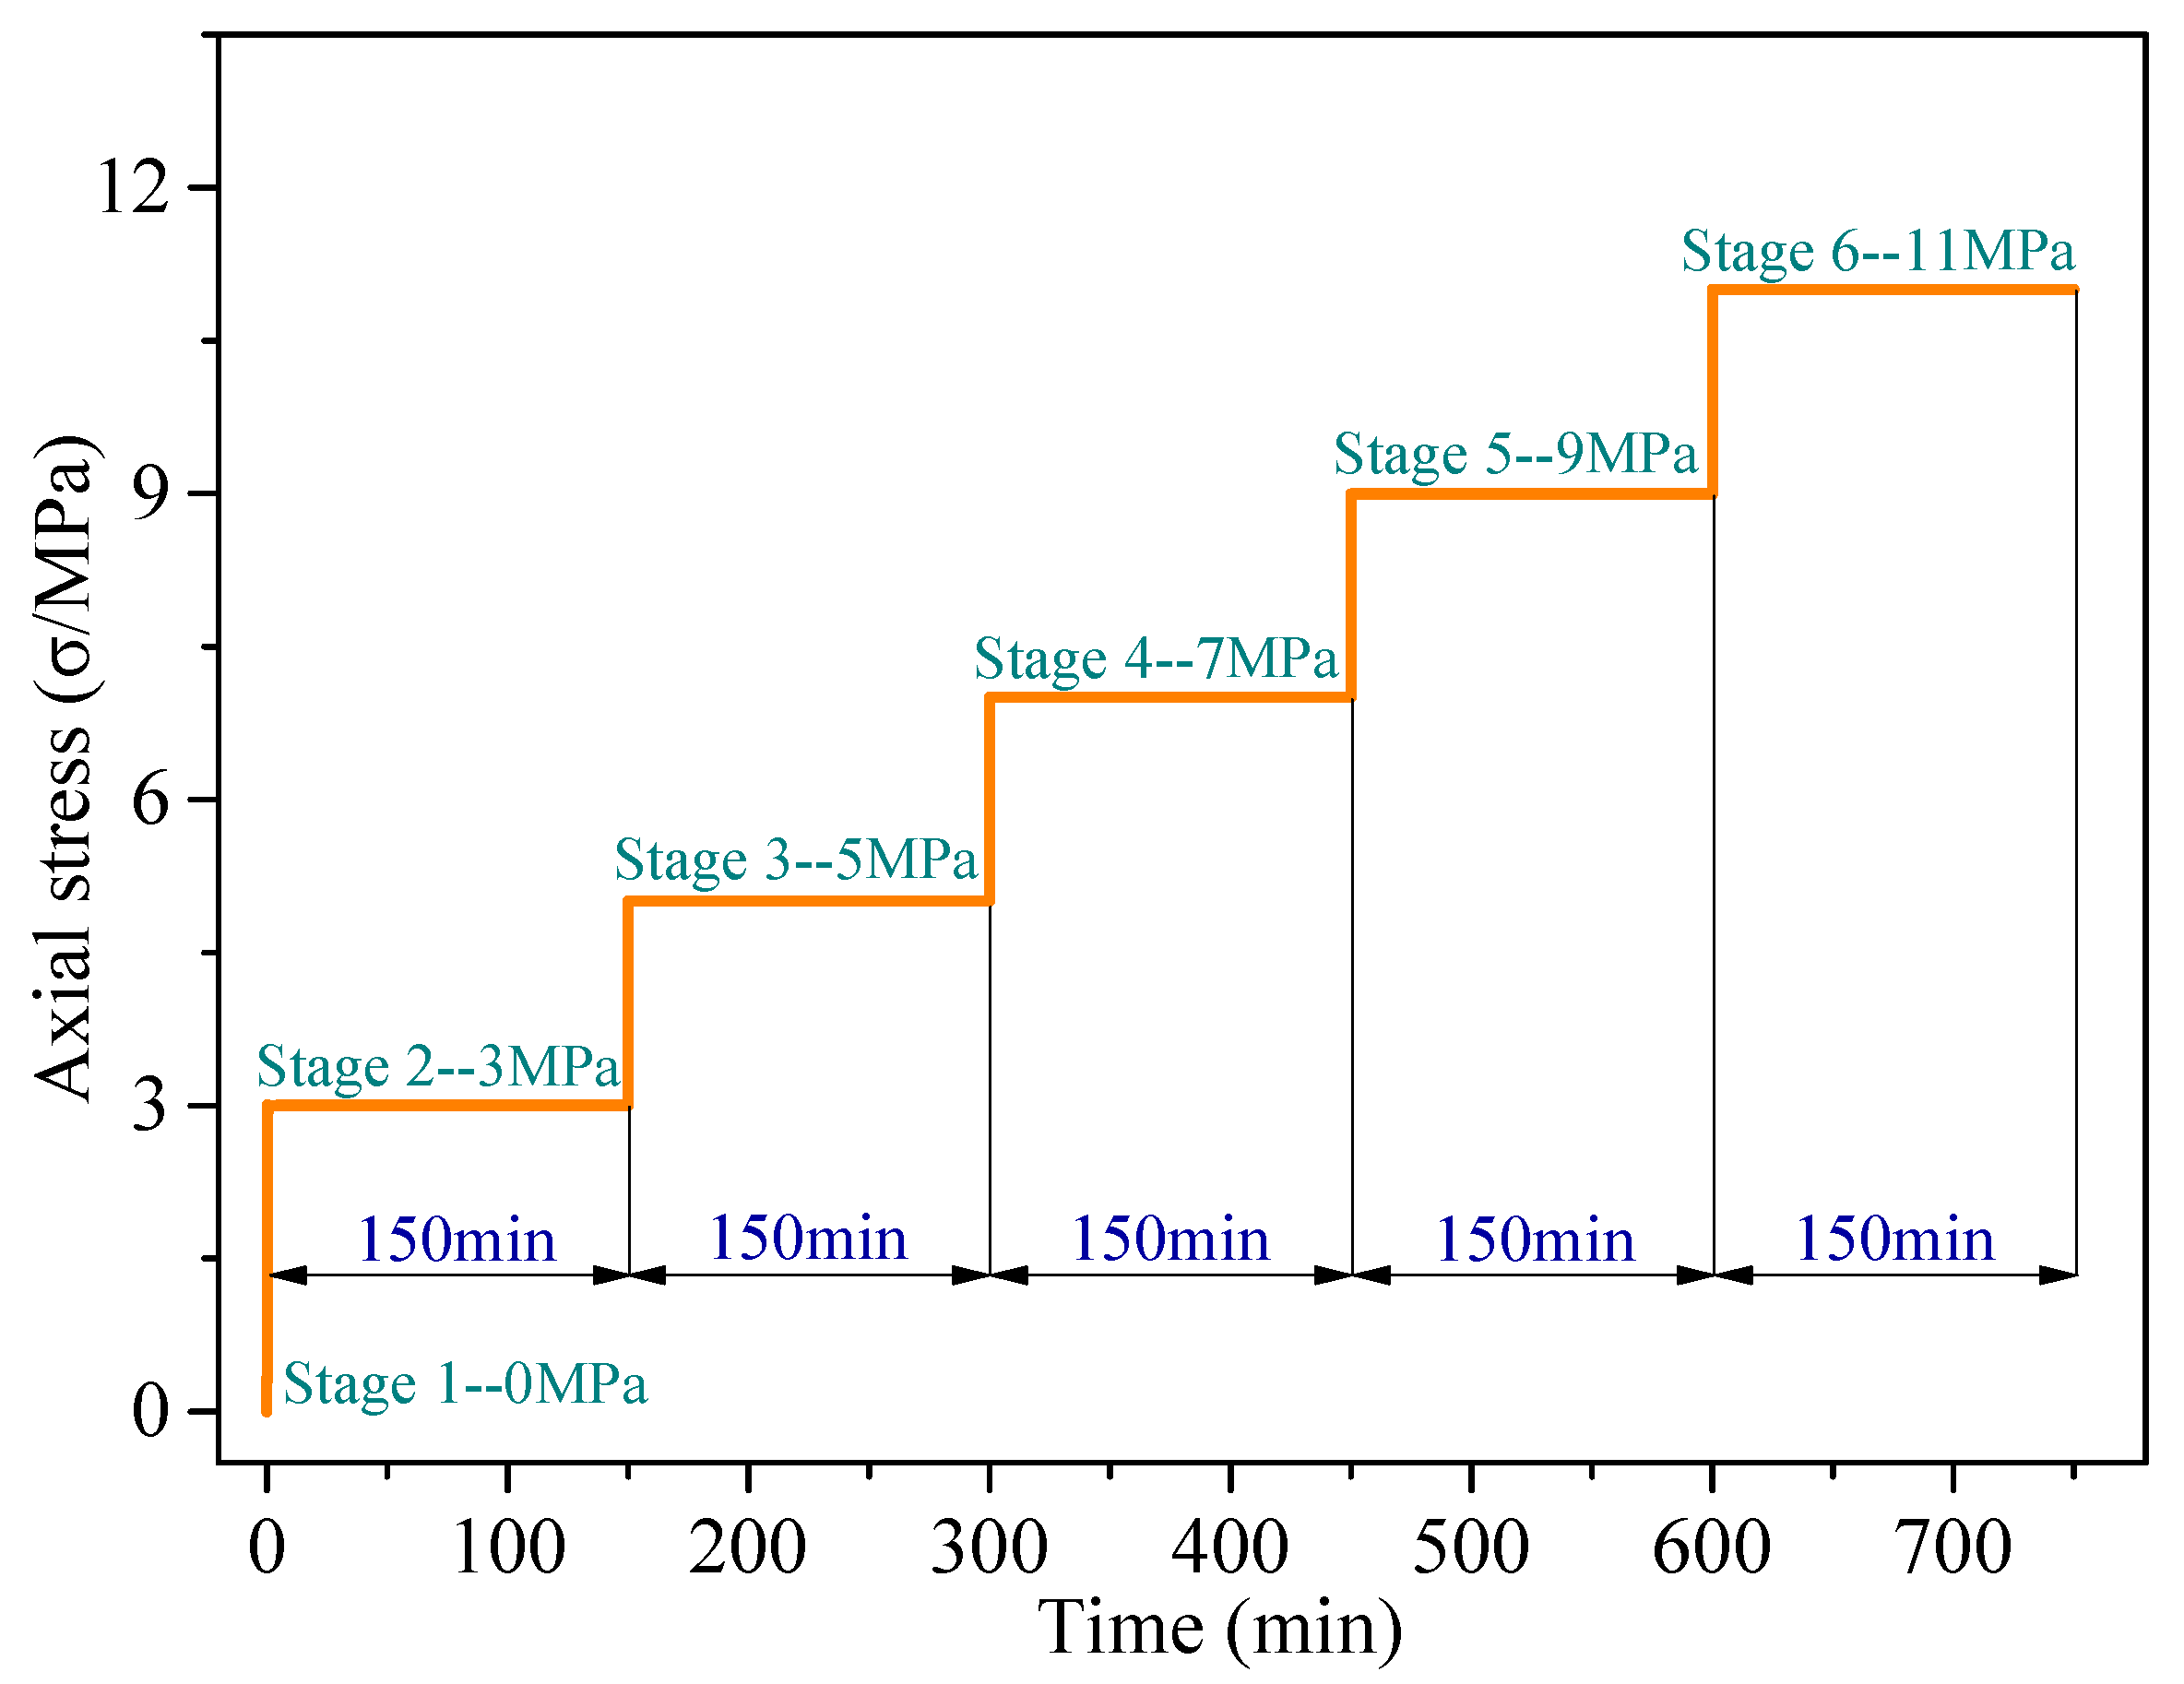
3.3. Test Scheme
- (1)
- Divide the standard coal samples into two groups and label them as Group S and Group C. Each group contains three samples, which are numbered as S-1, S-2, and S-3 and C-1, C-2, and C-3, respectively.
- (2)
- Place all samples into a drying oven to dry for 24 h. The temperature of the drying oven is set at 50 °C; then, the dried samples are put into water for water-saturation process which lasts for 12 h.
- (3)
- Conduct uniaxial loading to the water-saturated samples of Group S with a compression testing machine and obtain the mean peak strength.
- (4)
- Conduct low-field NMR test to the water-saturated samples of Group C to obtain the porosity, pore size distribution, and T2 distribution curve; NMR imaging is performed to the coal samples along either transverse or longitudinal direction.
- (5)
- Conduct loading on the coal samples of Group C in three loading modes. For the coal sample C-1, uniaxial loading-holding test is conducted under five different loads in turn, namely, 3 MPa, 5 MPa, 7 MPa, 9 MPa, and 11 MPa. For the coal sample C-2, uniaxial loading-holding test is conducted under two different loads in turn, namely, 3 MPa, and 7 MPa. For the coal sample C-3, uniaxial loading-holding test is conducted under two different loads in turn, namely, 3 MPa and 11 MPa. The coal samples should hold the loading for 150 min under each loading condition. After each run of the test, step (2) and (4) should be repeated.
4. Testing Results and Analysis
4.1. Porosity
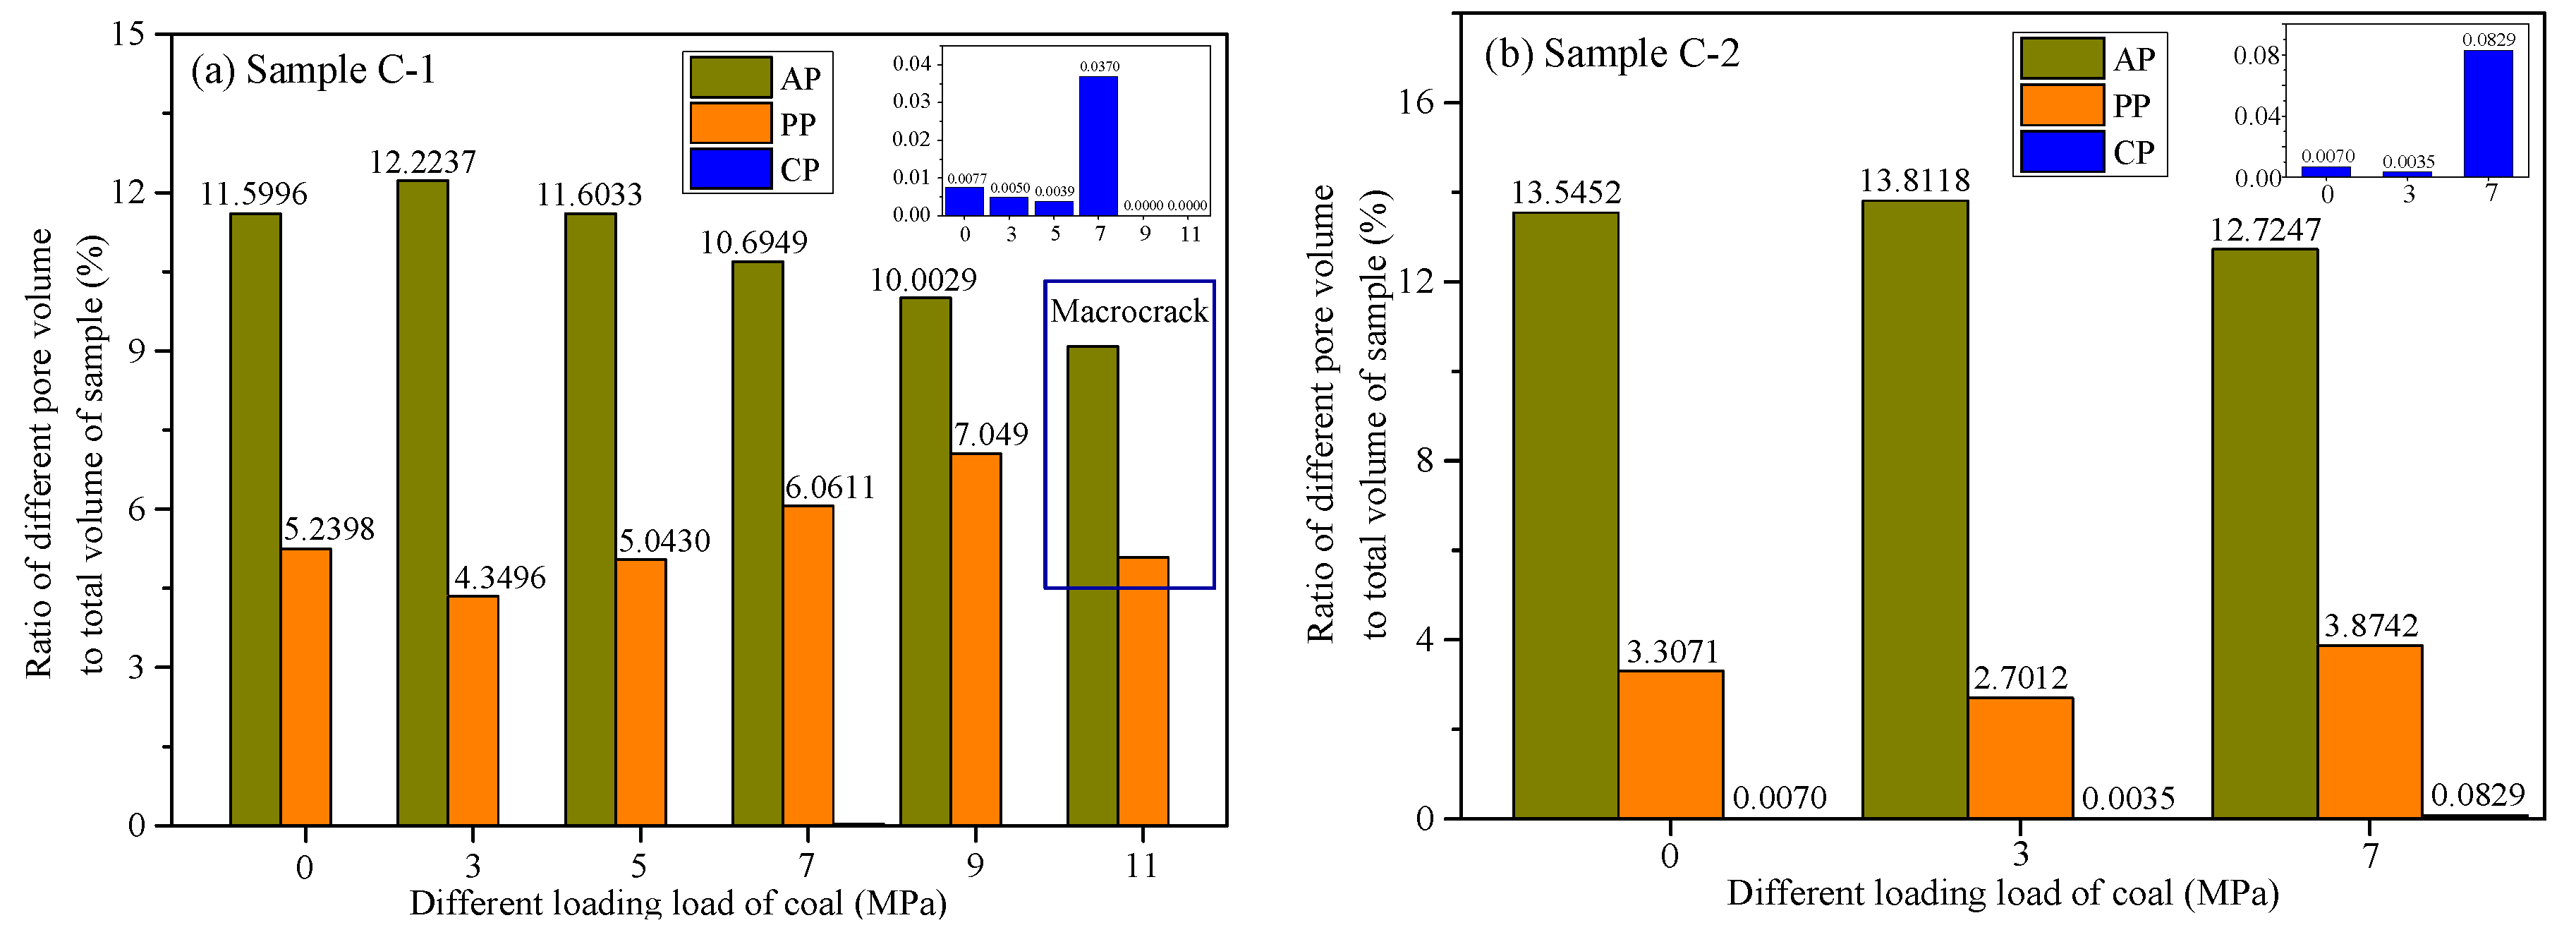
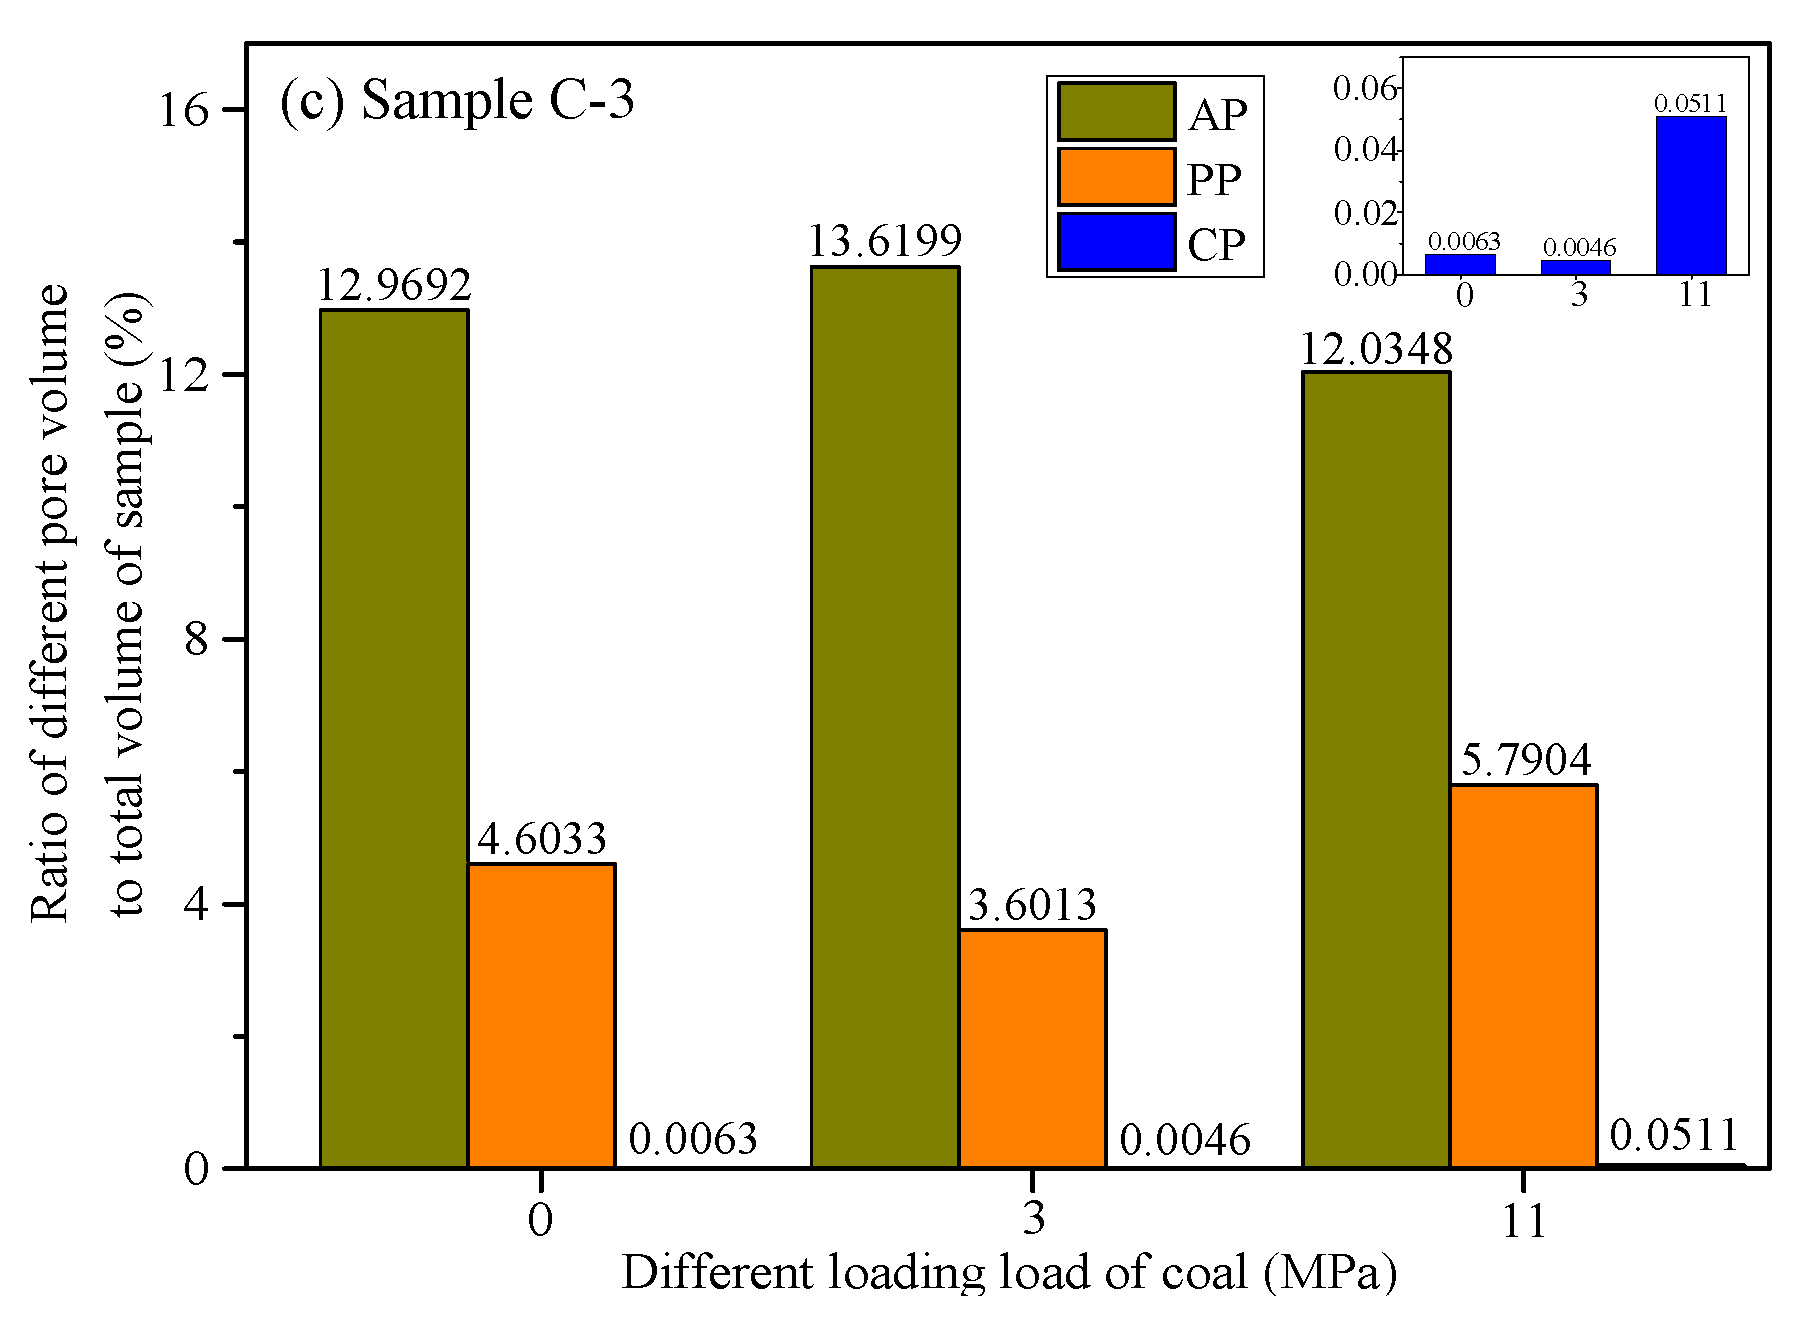
4.2. Pore Size Distribution
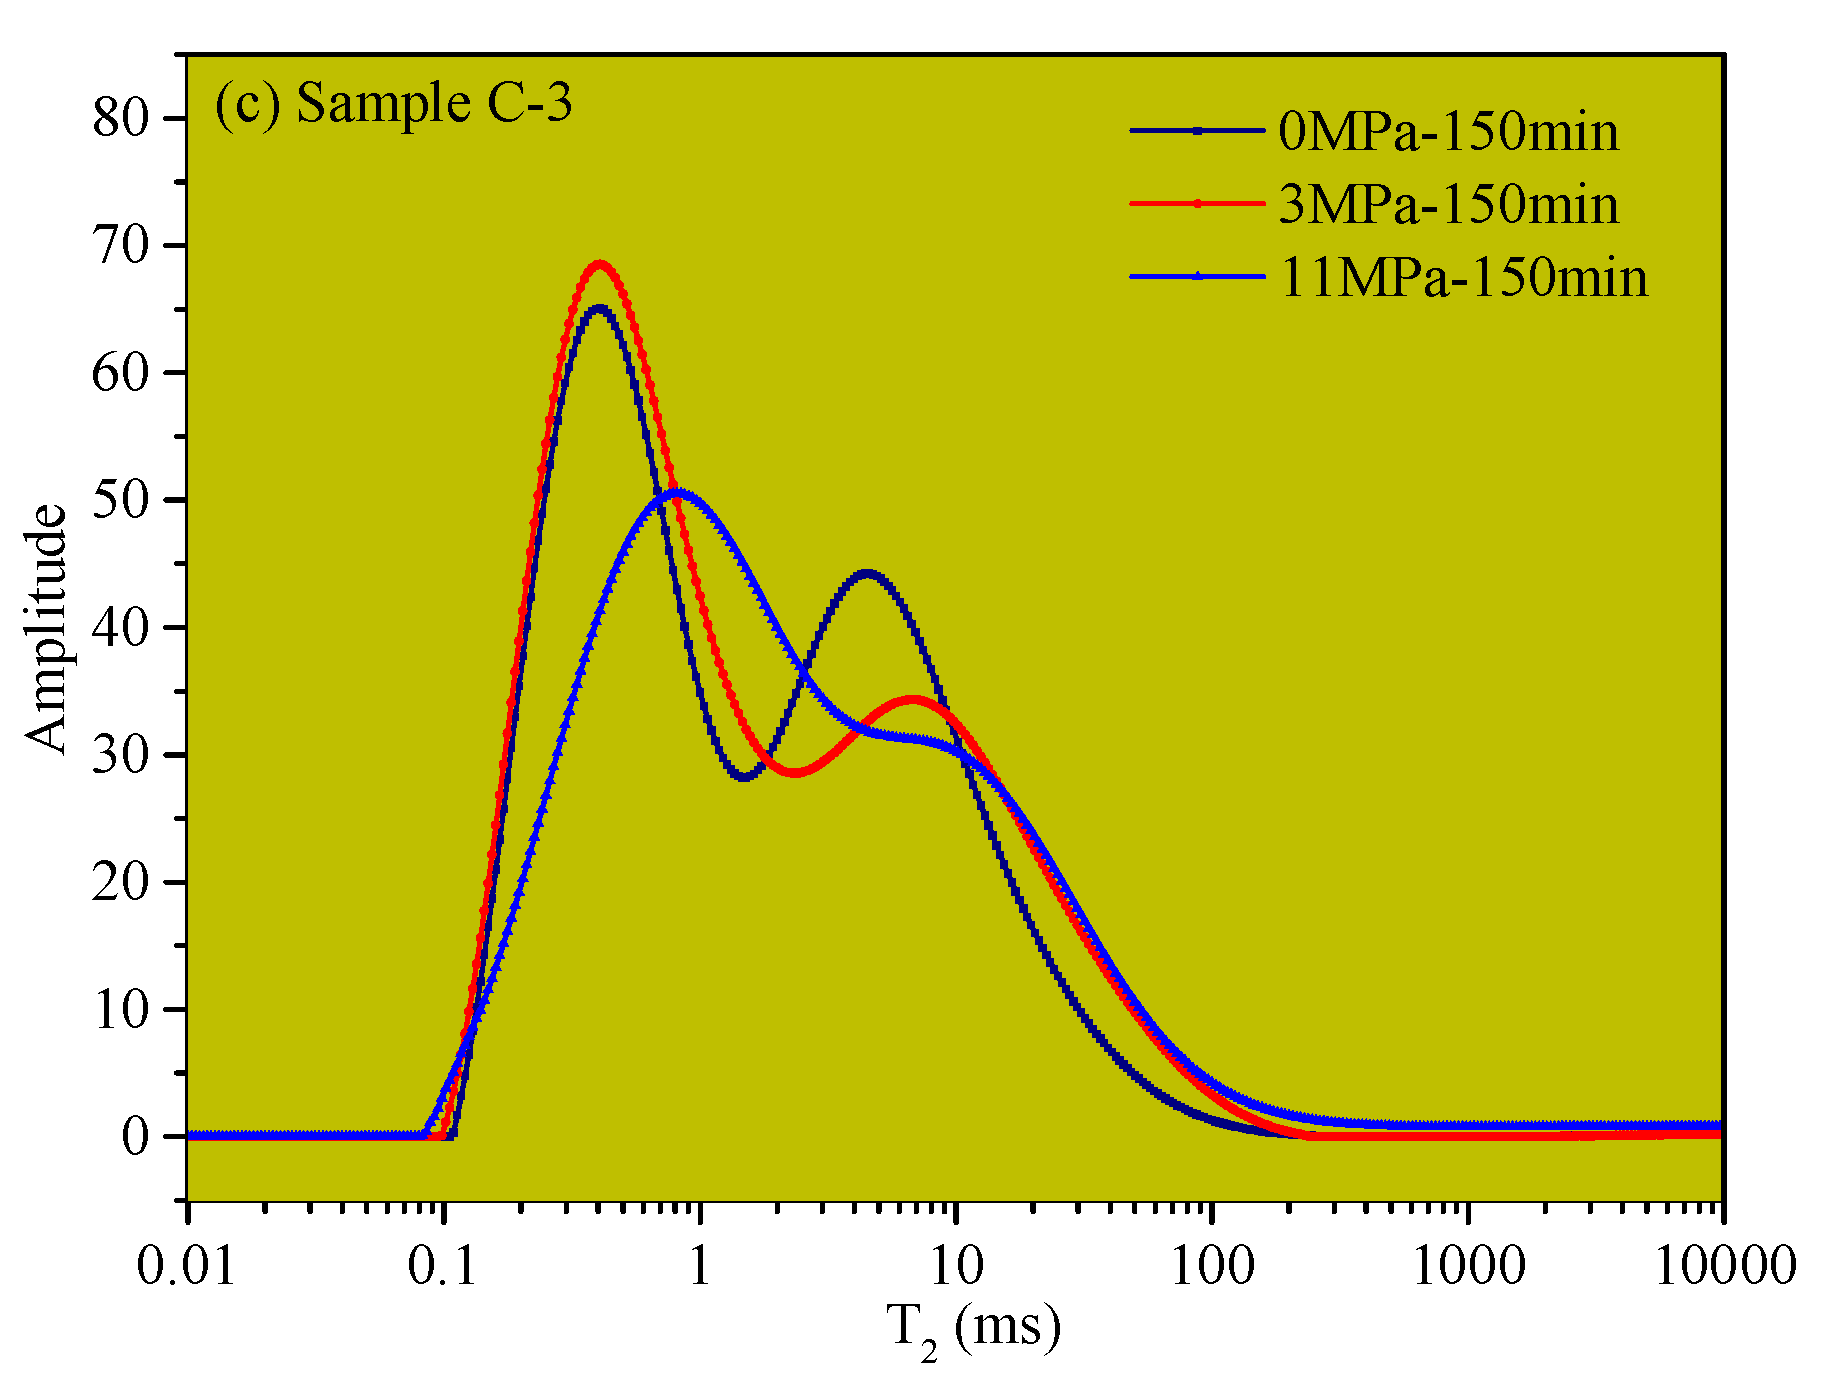
4.3. T2 Distribution Curve
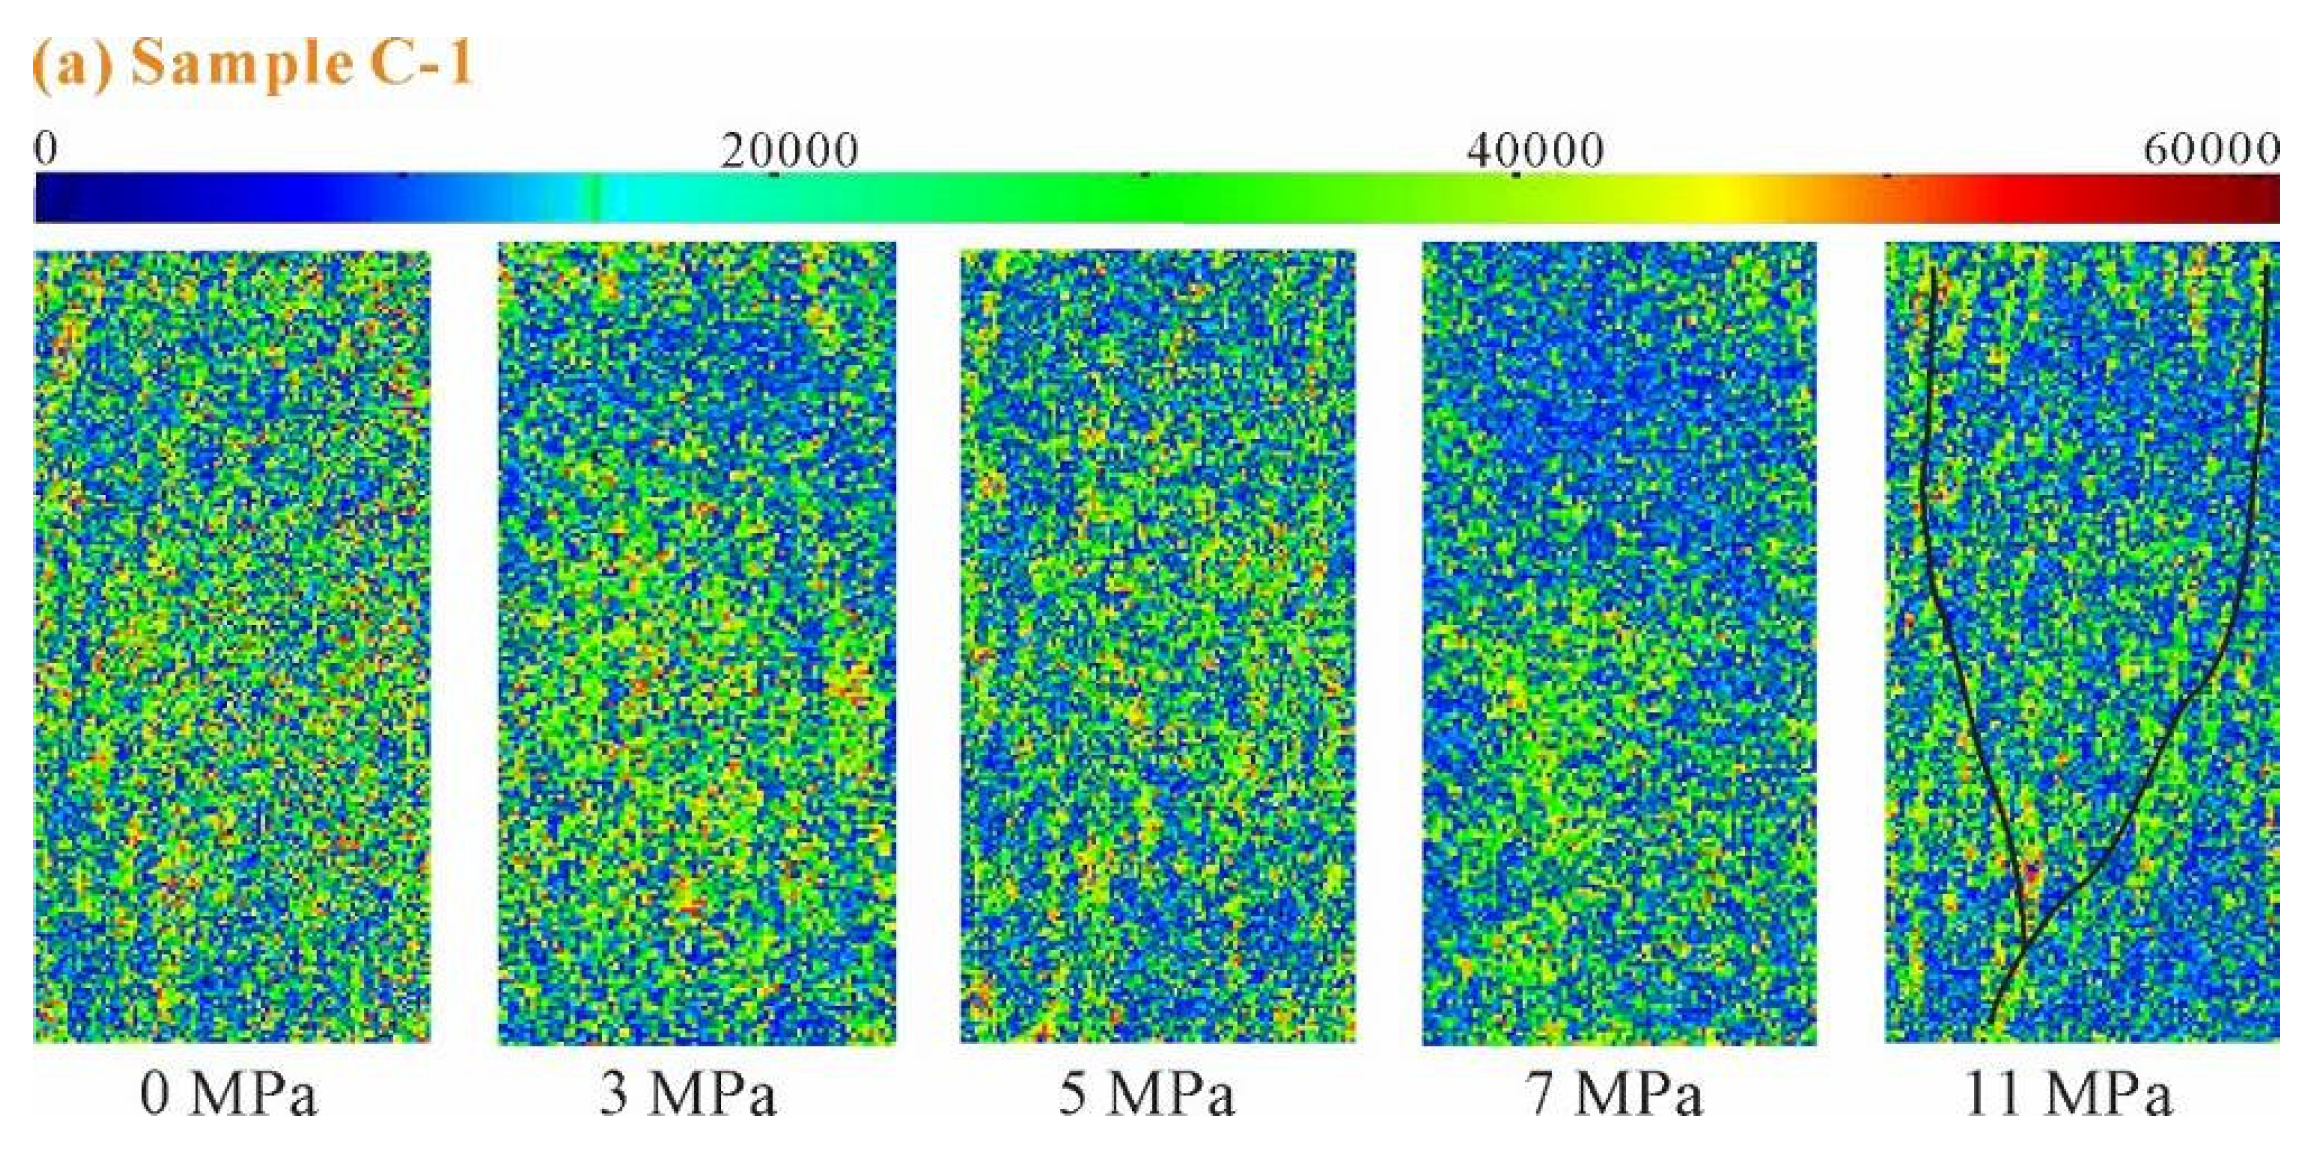
4.4. Magnetic Resonance Image (MRI)
5. Discussion
6. Conclusions
- (1)
- The porosity of coal samples evolves differently in the compaction stage and the elastic stage. During the compaction stage, the porosity declines mildly, indicating that part of the primary pores and fissures close up. During the elastic stage, the porosity increases correspondingly as the load rises gradually; and the growth rate of porosity tends to be larger and larger, indicating that secondary fissures develop more and more drastically.
- (2)
- Before loading, AP, PP, and CP all develop in the coal sample, with AP and PP taking the overwhelming advantage. When the load increases to 3 MPa, the volume ratio of PP declines while that of AP increases significantly. When the load increases to 11 MPa, the volume ratio of PP witnesses a significant rise while that of AP decreases remarkably, indicating that the elastic stage is a crucial phase for the rapid expansion of fissures. Meanwhile, it is also discovered that compared with one-time loading, progressive loading accelerates the evolution of pores and fissures.
- (3)
- Compared with the situation before loading, in the compaction stage, the T2 distribution curve moves to the smaller value as a whole and PP displays some tendency to transform to AP; in the elastic stage, the T2 distribution curve moves to the larger value as a whole and AP displays some tendency to transform to PP. As the load increases gradually, the relaxation time becomes longer correspondingly as the T2 peak of AP starts to rise, revealing that part of the primary fissures close up when secondary fissures expand.
- (4)
- The NMR images show that as the load increases, the pores and fissures experiences three phases: wide distribution—expansion in the concentration areas—macro perforation in the end. This illustrates the processive and stage characteristics of fissure expansion on the one hand, while on the other hand, it also reflects indirectly that the instability of coal wall under the effect of progressive stress displays some stage characteristics. To guarantee the long-term roadway stability, reinforcing support should be provided to inhibit the full perforation of fissures in time.
Author Contributions
Funding
Acknowledgments
Conflicts of Interest
References
- Vervoort, A. Various phases in surface movements linked to deep coal longwall mining: From start-up till the period after closure. Int. J. Coal Sci. Technol. 2020. [Google Scholar] [CrossRef]
- Kang, H.P.; Wu, L.; Gao, F.Q.; Lv, H.W.; Li, J.Z. Field study on the load transfer mechanics associated with longwall coal retreat mining. Int. J. Rock Mech. Min. Sci. 2019, 124, 104141. [Google Scholar] [CrossRef]
- Yuan, L.; Zhang, S.P. Development status and prospect of geological guarantee technology for precise coal mining. J. China Coal Soc. 2019, 44, 2277–2284. [Google Scholar]
- Liu, Q.; Chai, J.; Chen, S.J.; Zhang, D.D.; Yuan, Q.; Wang, S. Monitoring and correction of the stress in an anchor bolt based on Pulse PrePumped Brillouin Optical Time Domain Analysis. Energy Sci. Eng. 2020. [Google Scholar] [CrossRef]
- Xie, Z.Z.; Zhang, N.; Feng, X.W.; Liang, D.X.; Wei, Q.; Weng, M.Y. Investigation on the evolution and control of surrounding rock fracture under different supporting conditions in deep roadway during excavation period. Int. J. Rock Mech. Min. Sci. 2020, 123, 104122. [Google Scholar] [CrossRef]
- He, J.; Dou, L.M.; Wang, S.W.; Shan, C.H. Study on mechanism and types of hard roof inducing rock burst. J. Min. Saf. Eng. 2017, 34, 1122–1127. [Google Scholar]
- Chen, S.J.; Du, Z.W.; Zhang, Z.; Zhang, H.W.; Xia, Z.G.; Feng, F. Effects of chloride on the early mechanical properties and microstructure of gangue-cemented paste backfill. Constr. Build. Mater. 2020, 235, 117504. [Google Scholar] [CrossRef]
- Liu, D.; Zhang, D.; Fang, Q.; Sun, Z.; Cao, L.; Li, A. Displacement Characteristics of Shallow-Buried Large-Section Loess Tunnel with Different Types of Pre-Supports: A Case Study of New Badaling Tunnel. Appl. Sci. 2020, 10, 195. [Google Scholar] [CrossRef] [Green Version]
- He, J.; Pan, J.N.; Wang, A.H. Acoustic emission characteristics of coal specimen under triaxial cyclic loading and unloading. J. China Coal Soc. 2014, 39, 84–90. [Google Scholar]
- Song, H.H.; Zhao, Y.X.; Jiang, Y.D.; Zhang, X.Z. Influence of heterogeneity on the failure characteristics of coal under uniaxial compression condition. J. China Coal Soc. 2017, 42, 3125–3132. [Google Scholar]
- Li, Z.L.; He, X.Q.; Dou, L.M.; Wang, G.F.; Song, D.Z.; Lou, Q. Bursting failure behavior of coal and response of acoustic and electromagnetic emissions. Chin. J. Rock Mech. Eng. 2019, 38, 2057–2068. [Google Scholar]
- Thill, R.E.; Bur, T.R.; Steckley, R.C. Velocity anisotropy in dry and saturated rock spheres and its relation to rock fabric. Inter. J. Rock Mech. Min. Sci. Geomech. Abstr. 1973, 10, 535–557. [Google Scholar] [CrossRef]
- Shen, C.; Li, R.; Pei, J.; Cai, J.; Liu, T.; Li, Y. Preparation and the Effect of Surface-Functionalized Calcium Carbonate Nanoparticles on Asphalt Binder. Appl. Sci. 2020, 10, 91. [Google Scholar] [CrossRef] [Green Version]
- Zuo, G.G.; She, J.S.; Peng, S.P.; Yin, Q.C.; Liu, H.B.; Che, Y.Y. Two-dimensional SEM image-based analysis of coal porosity and its pore structure. Int. J. Coal Sci. Technol. 2020, 7, 350–361. [Google Scholar]
- Erarslan, N.; Williams, D.J. The damage mechanism of rock fatigue and its relationship to the fracture toughness of rocks. Int. J. Rock Mech. Min. Sci. 2012, 56, 15–26. [Google Scholar] [CrossRef]
- Rathnaweera, T.D.; Ranjith, P.G.; Gu, X.; Perera, M.S.A.; Kumari, W.G.P.; Wanniarachchi, W.A.M.; Haque, A.; Li, J.C. Experimental investigation of thermomechanical behaviour of clay-rich sandstone at extreme temperatures followed by cooling treatments. Int. J. Rock Mech. Min. Sci. 2018, 107, 208–223. [Google Scholar] [CrossRef]
- Guo, H.J.; Wang, K.; Cui, H.; Xu, C.; Yang, T.; Zhang, Y.Y.; Teng, T. Experimental Investigation on the Pore and its Fractal Characteristics. J. Chin. Univ. Min. Technol. 2019, 48, 1206–1214. [Google Scholar]
- Li, H.Y.; Ogawa, Y.; Shimada, S. Mechanism of methane flow through sheared coals and its role on methane recovery. Fuel 2003, 82, 1271–1279. [Google Scholar] [CrossRef]
- Menaceur, H.; Delage, P.; Tang, A.M.; Talandier, J. The Status of Water in Swelling Shales: An Insight from the Water Retention Properties of the Callovo-Oxfordian Claystone. Rock Mech. Rock Eng. 2016, 49, 4571–4586. [Google Scholar] [CrossRef]
- Romanov, V.N.; Graeser, L.C.; Jikich, S.A.; Soong, Y.; Irdi, G.A. Coal–gas interaction: Implications of changes in texture and porosity. Int. J. Coal Sci. Technol. 2016, 3, 10–19. [Google Scholar] [CrossRef]
- De Silva, V.R.S.; Ranjith, P.G.; Perera, M.S.A.; Wu, B.; Rathnaweera, T.D. The Influence of Admixtures on the Hydration Process of Soundless Cracking Demolition Agents (SCDA) for Fragmentation of Saturated Deep Geological Reservoir Rock Formations. Rock Mech. Rock Eng. 2019, 52, 435–454. [Google Scholar] [CrossRef]
- Hou, P.; Ju, Y.; Gao, F.; Wang, J.G.; He, J. Simulation and visualization of the displacement between CO2 and formation fluids at pore-scale levels and its application to the recovery of shale gas. Int. J. Coal Sci. Technol. 2016, 3, 351–369. [Google Scholar] [CrossRef] [Green Version]
- Pirzada, M.A.; Zoorabadi, M.; Ramandi, H.L.; Canbulat, I.; Roshan, H. CO2 sorption induced damage in coals in unconfined and confined stress states: A micrometer to core scale investigation. Int. J. Coal Geol. 2018, 198, 167–176. [Google Scholar] [CrossRef]
- Liu, Y.F.; Tang, D.Z.; Xu, H.; Li, S.; Zhao, J.L.; Meng, Y.J. Characteristics of the stress deformation of pore-fracture in coal based on nuclear magnetic resonance. J. China Coal Soc. 2015, 40, 1415–1421. [Google Scholar]
- Moroeng, O.M.; Wagner, N.J.; Brand, D.J.; Roberts, R.J. A Nuclear Magnetic Resonance study: Implications for coal formation in the (A) Witbank Coalfield, South Africa. Int. J. Coal Geol. 2018, 188, 145–155. [Google Scholar] [CrossRef]
- Zhao, J.; Qin, Y.; Shen, J.; Zhou, B.; Li, C.; Li, G. Effects of Pore Structures of Different Maceral Compositions on Methane Adsorption and Diffusion in Anthracite. Appl. Sci. 2019, 9, 5130. [Google Scholar] [CrossRef] [Green Version]
- Moroeng, O.M.; Keartland, J.M.; Roberts, R.J.; Wagner, N.J. Characterization of coal using electron spin resonance: Implications for the formation of inertinite macerals in the Witbank Coalfield, South Africa. Int. J. Coal Sci. Technol. 2018, 5, 385–398. [Google Scholar] [CrossRef]
- Ju, Y.W.; Luxbacher, K.; Li, X.S.; Wang, G.C.; Yan, Z.F.; Wei, M.M.; Yu, L.Y. Micro-structural evolution and their effects on physical properties in different types of tectonically deformed coals. Int. J. Coal Sci. Technol. 2014, 1, 364–375. [Google Scholar] [CrossRef] [Green Version]
- Gao, M.Z.; Jin, W.C.; Zhen, C.J.; Zhou, H.W. Real-time evolution and connectivity of mined crack network. J. China Coal Soc. 2012, 37, 1535–1540. [Google Scholar]
- Alexeev, A.D.; Vasilenko, T.A.; Ulyanova, E.V. Closed porosity in fossil coals. Fuel 1999, 78, 635–638. [Google Scholar] [CrossRef]
- Barenblatt, G.I.; Zheltov, I.P.; Kochina, I.N. Basic concepts in the theory of seepage of homogeneous liquids in fissured rocks. J. Appl. Math. Mech. 1960, 24, 1286–1303. [Google Scholar] [CrossRef]
- Guo, H.J.; Yuan, L.; Cheng, Y.P.; Wang, K.; Xu, C. Experimental investigation on coal pore and fracture characteristics based on fractal theory. Powder Technol. 2019, 346, 341–349. [Google Scholar] [CrossRef]
- Zheng, S.J.; Yao, Y.B.; Liu, D.M.; Cai, Y.D.; Liu, Y. Nuclear magnetic resonance surface relaxivity of coals. Int. J. Coal Geol. 2019, 205, 1–13. [Google Scholar] [CrossRef]
- Kenyon, W.E. Nuclear magnetic resonance as a petrophysical measurement. Int. J. Radiat. Appl. Instrum. Part E Nucl. Geophys. 1992, 6, 153–171. [Google Scholar]
- Yao, Y.B.; Liu, D.M.; Xie, S.B. Quantitative characterization of methane adsorption on coal using a low-field NMR relaxation method. Int. J. Coal Geol. 2014, 131, 32–40. [Google Scholar] [CrossRef]
- Zhao, Y.X.; Sun, Y.F.; Liu, S.M.; Wang, K.; Jiang, Y.D. Pore structure characterization of coal by NMR cryoporometry. Fuel 2017, 190, 359–369. [Google Scholar] [CrossRef]
- Zhai, C.; Qin, L.; Liu, S.M.; Xu, J.Z.; Tang, Z.Q.; Wu, S.L. Pore structure in coal: Pore evolution after cryogenic freezing with cyclic liquid nitrogen injection and its implication on coalbed methane extraction. Energy Fuels 2016, 30, 6009–6020. [Google Scholar] [CrossRef]
- Radovic, L.; Menon, V.; Lenon, C.L.Y.; Kyotani, T.; Danner, R.P.; Anderson, S.; Hatcher, P.G. On the porous structure of coals: Evidence for an interconnected but constricted micropore system and implications for coalbed methane recovery. Adsorption 1997, 3, 221–232. [Google Scholar] [CrossRef]
- Zheng, S.J.; Yao, Y.B.; Liu, D.M.; Cai, Y.D.; Liu, Y. Characterizations of full-scale pore size distribution, porosity and permeability of coals: A novel methodology by nuclear magnetic resonance and fractal analysis theory. Int. J. Coal Geol. 2018, 196, 148–159. [Google Scholar] [CrossRef]
- Yao, Y.B.; Liu, D.M.; Cai, Y.D.; Li, J.Q. Advanced characterization of pores and fractures in coals by nuclear magnetic resonance and X-ray computed tomography. Sci. China Earth Sci. 2010, 40, 1598–1607. [Google Scholar] [CrossRef]
- Li, S.; Tang, D.Z.; Xu, H.; Yang, Z.; Guo, L.L. Porosity and permeability models for coals using low-field nuclear magnetic resonance. Energy Fuels 2012, 26, 5005–5014. [Google Scholar] [CrossRef]


| Group C | Porosity (%) | |||||
| NMR- 0 MPa | NMR- 3 MPa | NMR- 5 MPa | NMR- 7 MPa | NMR- 9 MPa | NMR- 11 MPa | |
| C-1 | 16.8470 | 16.5783 | 16.6502 | 16.7930 | 17.0519 | 14.1662 |
| C-2 | 16.8593 | 16.5165 | / | 16.6819 | / | / |
| C-3 | 17.5788 | 17.2258 | / | / | / | 17.8763 |
© 2020 by the authors. Licensee MDPI, Basel, Switzerland. This article is an open access article distributed under the terms and conditions of the Creative Commons Attribution (CC BY) license (http://creativecommons.org/licenses/by/4.0/).
Share and Cite
Xie, Z.; Zhang, N.; Wang, J.; Xiang, Z.; Zhang, C. Study on Magnetic Resonance Characteristics of Coal Sample under Progressive Loads. Appl. Sci. 2020, 10, 6526. https://doi.org/10.3390/app10186526
Xie Z, Zhang N, Wang J, Xiang Z, Zhang C. Study on Magnetic Resonance Characteristics of Coal Sample under Progressive Loads. Applied Sciences. 2020; 10(18):6526. https://doi.org/10.3390/app10186526
Chicago/Turabian StyleXie, Zhengzheng, Nong Zhang, Jin Wang, Zhe Xiang, and Chenghao Zhang. 2020. "Study on Magnetic Resonance Characteristics of Coal Sample under Progressive Loads" Applied Sciences 10, no. 18: 6526. https://doi.org/10.3390/app10186526