Article

A Robust Experimental Model to Explore the Three-Dimensional Printing of Polylactide Parts: Solution versus Melt Extrusion

1
Department of Mechanical Engineering, Chang Gung University, Taoyuan 33302, Taiwan
2
Department of Orthopedic Surgery, Chang Gung Memorial Hospital-Linkou, Taoyuan 33305, Taiwan
3
Division of Neurosurgery, Department of Surgery, Shuang Ho Hospital, Taipei Medical University, Taipei 11031, Taiwan
4
Department of Surgery, College of Medicine, School of Medicine, Taipei Medical University, Taipei 11031, Taiwan
5
Graduate School of Organic Materials Science, Yamagata University, Yonezawa, Yamagata 992-8510, Japan
*
Author to whom correspondence should be addressed.
These authors have equal contribution to this study and are co-first authors of this paper.
Appl. Sci. 2020, 10(2), 509; https://doi.org/10.3390/app10020509
Submission received: 16 December 2019 / Revised: 1 January 2020 / Accepted: 3 January 2020 / Published: 10 January 2020

Abstract

:
Three-dimensional (3D) printing is a simple and versatile process for producing parts of complex geometries. Although the process possesses several manufacturing advantages, such as rapid prototyping, customization, and complexity, the optimization of the 3D printing procedure remains a challenge. Here we explore the influences of various processing conditions on the mechanical properties of melt extrusion- and solution extrusion-printed polylactide (PLA) products by adopting a robust experimental design model. In addition to the commercially available melt extrusion 3D printer, a novel solution-type 3D printer has been exploited especially for this study, which consists of a solution-type plunger-actuated feeding system, stepper motors and motion components, a power supply unit, a print bed, a user interface, and connectivity. The effects of various parameters were investigated by adopting a robust experimental design. We compared the parts printed using the melt extrusion and solution extrusion methods and found that, in the melt extrusion printing, the print speed and fill density were the principal parameters affecting product quality, while in the solution extrusion printing, oven temperature, fill density, and PLA/dichloromethane (DCM) ratio were the key parameters. By scanning electron microscopy, we found that the melt extrusion-printed parts exhibit a strip-like microstructure and the solution extrusion-printed parts show a fused surface morphology. Due to the addition of solvent, the solution-printed PLA material show a different thermal profile in the differential scanning calorimeter analysis, which in turn affects the mechanical behaviour of printed parts.

1. Introduction

Three-dimensional (3D) printing, also named additive manufacturing [1,2], is a simple and versatile process, with materials being added together to produce parts of complex geometries. The advantages of 3D printing, including manufacturing options, rapid prototyping, customisation, and complexity making it one of the most promising technologies. Through creating layers, 3D printing opens a whole new way in which products are created, and it offers many advantages compared to the usual traditional manufacturing methods. The most widely used 3D printing process is the fused-deposition modelling (FDM) procedure [3], which extrudes hot polymer melt of thermoplastics from a large coil and deposits the materials on the growing work. The printing head shifts in two horizontal directions to form one layer at a time. Then, the head migrates vertically in small sequential steps to create a new layer. A microprocessor controls the speed of the extruder head to constitute a three-dimensional product.
Despite its popularity, one major limitation that confounds the overall success of melt-extruded FDM is the restricted selection of commercially-available polymeric filaments for printing, mostly acrylonitrile butadiene styrene (ABS) and polylactide (PLA). If other materials are needed, including polyethylene, poly(ethylene terephthalateco-1,4-cylclohexylenedimethylene terephthalate), polyamide, thermoplastic elastomers etc., they must be made into filament by thermal extrusion before being printed by FDM [4]. However, this not only increases the overall cost, but may also pose some limitations, especially when the printed device is used for drug delivery applications [5,6]. Mixing the input polymeric materials with drugs at elevated temperatures during filament preparation or a 3D printing process can inactivate and/or degrade the drugs [7].
To overcome this limitation, we developed a novel solution extrusion-type 3D printer in our lab, which utilises the layer-by-layer method to deposit materials to create desired structures. A solution that dissolves the polymeric materials for printing is extruded out from a syringe by an actuator driven by a step motor. The printing head is migrated under computer control to obtain the desired geometry. Once the solvent evaporates, the liquid form material ejected from the syringe solidifies and deposits itself in successive layers within the 3D printing volume.
Many published studies addressing 3D printing have examined the influence of processing variables on 3D printing of polymeric parts [8,9,10,11]. However, all of these focus on the conventional FDM process. The work on investigating the effect of processing conditions on solution extrusion 3D printing is limited.
In this study, a comparative study of the influence of processing parameters on the solution extrusion 3D-printed and commercial melt extrusion FDM printed parts was completed. Polylactide (PLA) was selected for all of the experiments. Among various biodegradable polymers, PLA is one of the most widely explored polymeric materials for medical applications. PLAs belong to the category of hydrolytically biodegradable materials and have been authorised by the Food and Drug Administration (FDA) for clinical uses. The polymers range from amorphous glassy polymer to semi-crystalline and highly crystalline polymer with a glass transition of 60–65 °C and melting points of 173–178 °C [12]. The material has also been widely used for medical implants owing to its well-documented biocompatibility and good mechanical property [13].
Empirical research, based on a fractional orthogonal array design [14,15], was conducted to investigate the effect of different processing factors on the mechanical property of solution and melt extrusion 3D-printed parts. This allows one to examine a chosen subset of consolidations of diverse factors at multiple levels, but with fewer numbers of test trials for process optimisation. After printing, the mechanical property of printed PLA parts was measured by a tensile tester, while their morphology was characterized by a projecting microscope and a scanning electron microscope (SEM). Also, a differential scanning calorimeter (DSC) was employed to examine the thermal characteristics of PLAs printed by solution and melt 3D printings.

2. Materials and Methods

2.1. Materials

PLA filaments (Prolink Microsystems Corp., Taipei, Taiwan) that possess a diameter of 3.0 mm were adopted for the FDM melt extrusion printing. On the other hand, for comparison, the filaments were cut into pellets of approximately 0.5 mm in size. Predetermined weights of PLA pellets were mixed with dichloromethane (DCM, Sigma-Aldrich, St. Louis, MO, USA) with different weight/volume ratios by a magnetic stirrer for 2 h at ambient temperature (25 °C). The solutions were then used for the solution extrusion 3D printing.

2.2. Experimental Setup

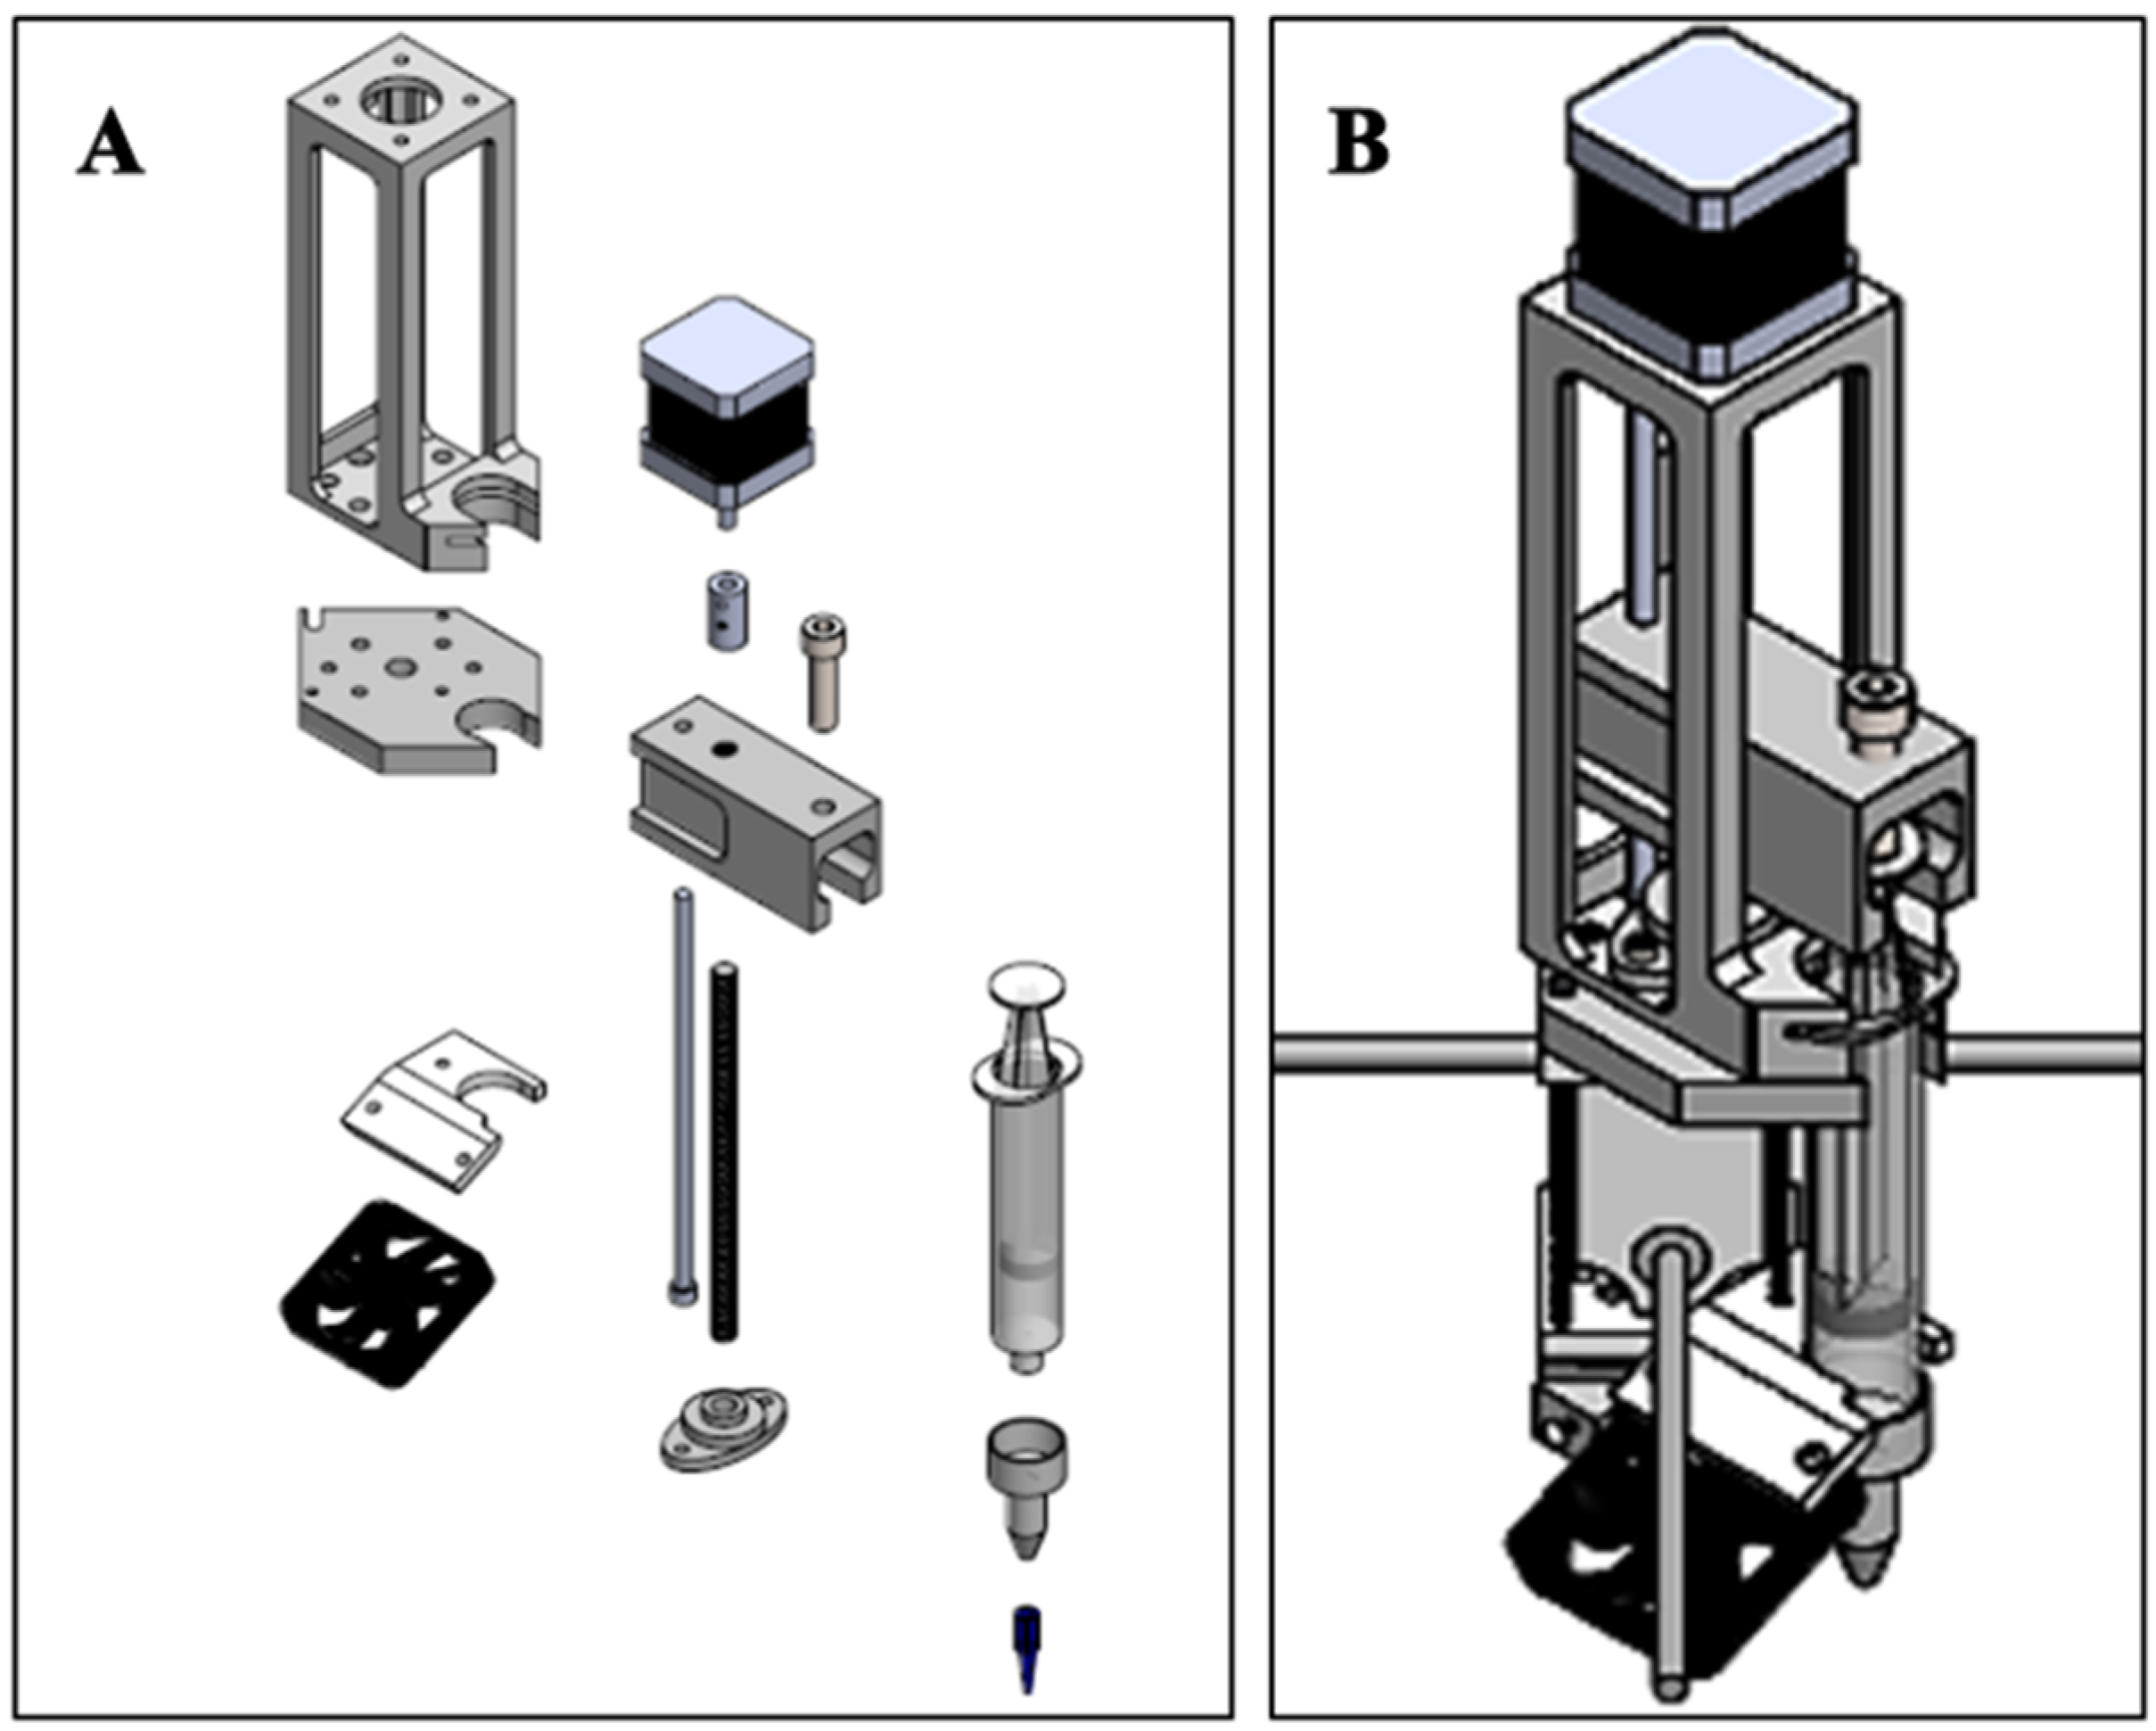
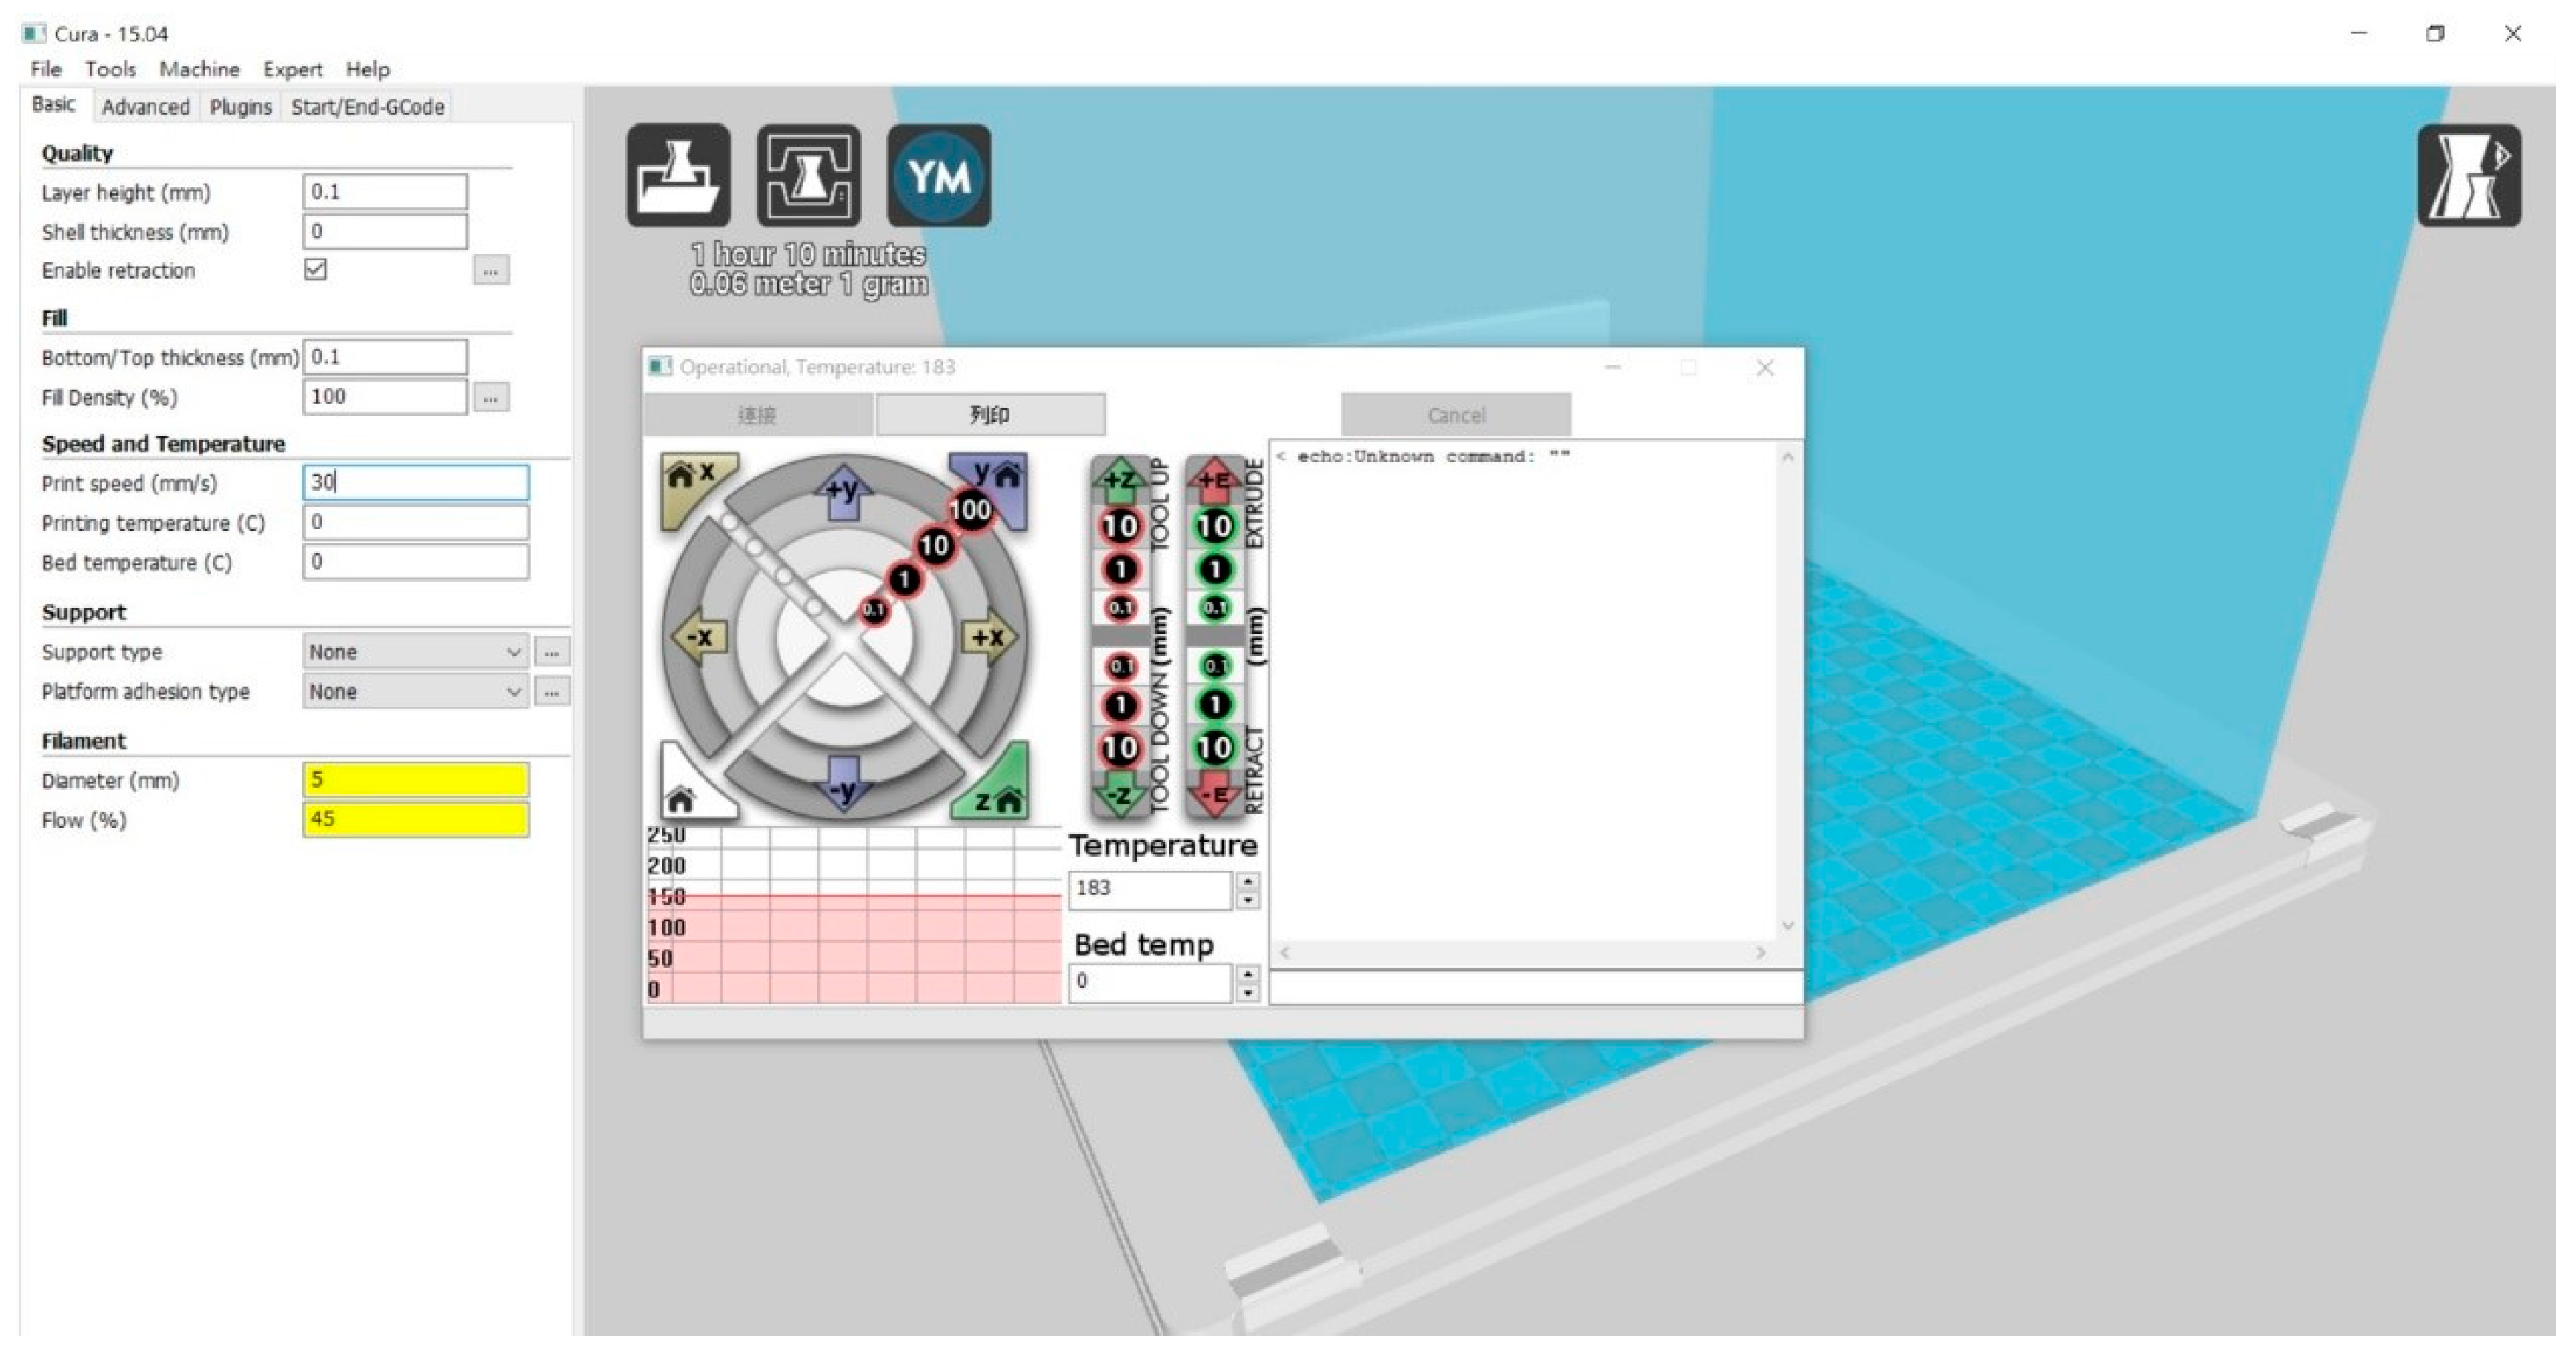
The solution extrusion printing was conducted on a novel, lab-exploited, solution-type 3D printer. As shown in Figure 1, the printer was a modified version of commercially available FDM printer (UMaker, Hertz Information, Taipei, Taiwan). By keeping the main structure intact and only installing a new solution-type plunger-actuated feeding system, stepper motors and motion components (Figure 2), a solution extrusion 3D printer was thus available for part printing (Figure 3). A free and open-source Cura interface (Ultimaker B.V., Geldermalsen, The Netherlands) was adopted to control the entire printing process (Figure 4). Before printing, a predetermined weight of PLA was first dissolved in DCM. The solution was then loaded into the solution-type feeder (a syringe) equipped with a plastic nozzle (needle) with an inner diameter of 0.18 mm for printing. During printing, the feeder was actuated by a computer-controlled servo motor and extruded the PLA solution onto the print bed. After the evaporation of DCM, a PLA bead of around 0.2 mm in diameter was deposited onto the printer bed surface layer-by-layer. Meanwhile, the setup utilised for the melt extrusion 3D printing was a commercially-available FDM printer (CR8, Taipei, Taiwan) that has a printing resolution of 200 μm.
Both the melt extrusion and solution extrusion printers were placed in an oven equipped with a forced-air circulation that has a temperature control accuracy of ±0.2 °C. Following the ASTM D638 standard, a dumbbell-shaped geometry was selected for the parts. Figure 5 shows the layout and dimensions of the part. A solid modelling computer-aided design (CAD) computer program (Solidworks, Waltham, MA, USA) that runs primarily on Microsoft Windows was adopted to generate the code that was needed for the microcontroller to controls the movement of print heads.
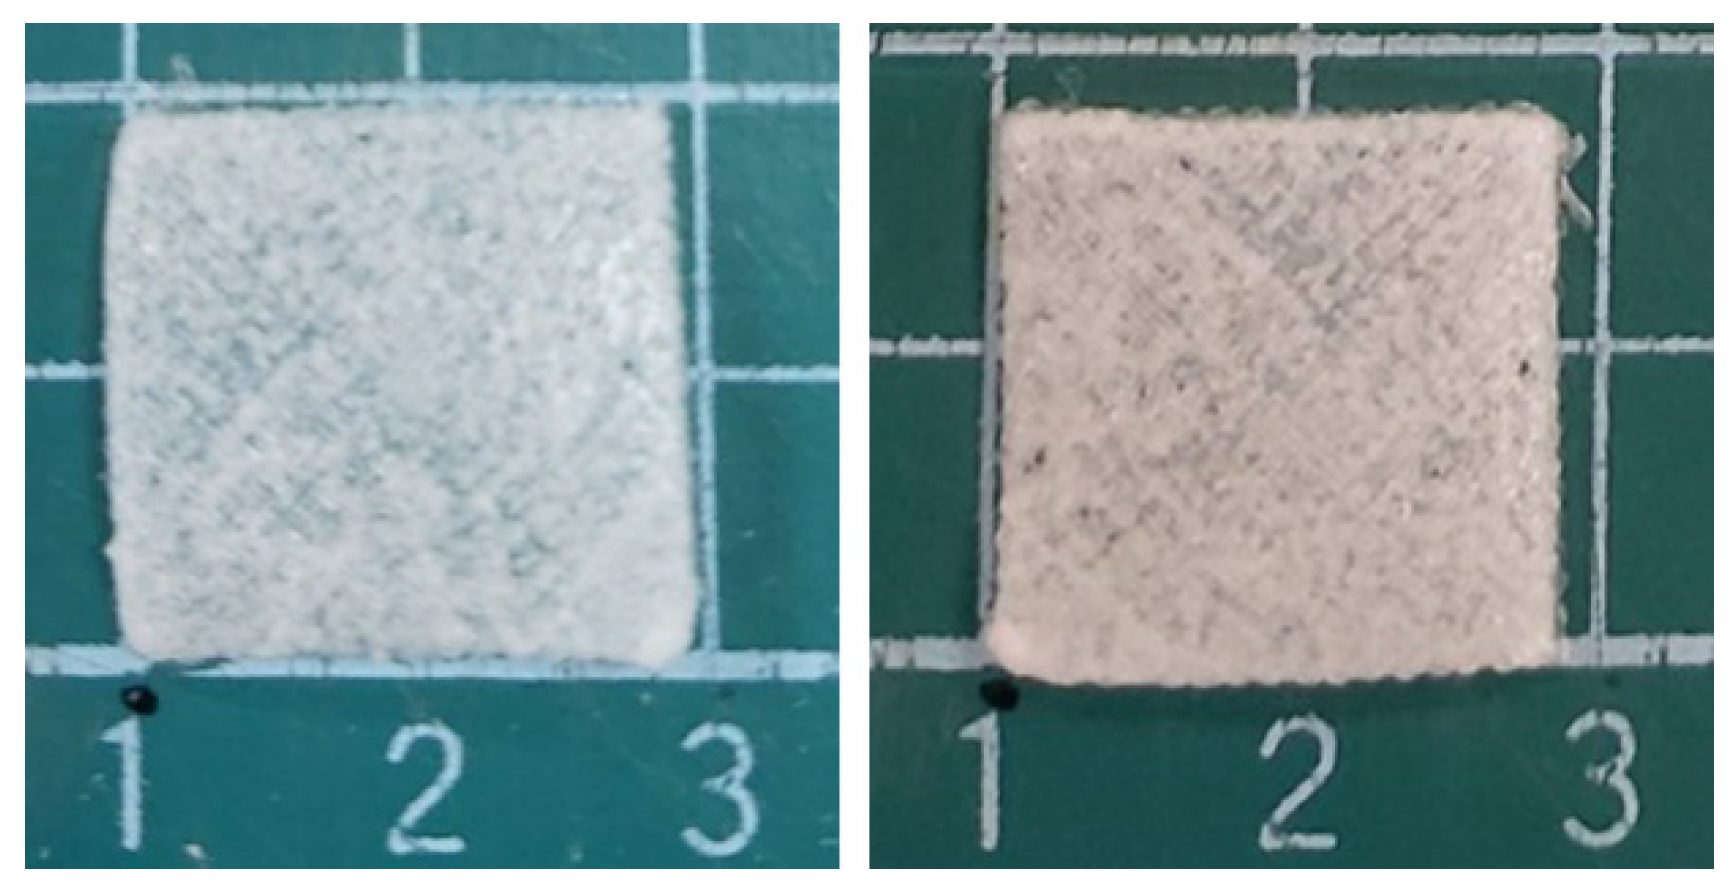
To evaluate the effect of residual solvent on printed products, a few test trials were first completed to print samples of square geometry (20 mm × 20 mm) (Figure 6), and the weights of printed parts were estimated after being put in a ventilation chamber at ambient temperature for different times. The measured weights (weight reduction percentages) at days 0, 1, 2, 3, 4, 5, 6, and 7 post printing were measured to be 0.264 g (17.58%), 0.218 g (18.18%), 0.216 g (18.56%), 0.212 g (19.69%), 0.212 g (19.69%), 0.212 g (19.69%), 0.212 g (19.69%), and 0.212 g (19.69%), respectively. The weight reductions were mainly attributable to the evaporation of residual solvents in the parts. Furthermore, the weight reduction and part shrinkage levelled off after 3 days and the final dimension of printed part shrank by approximately 10%.
All printed dumbbell-shaped parts were first placed in the ventilation chamber for 7 days so as to minimize influence of the solvents. The mechanical properties of 3D-printed parts were then assessed by a Lloyd tensiometer (AMETEK, Berwyn, PA, USA) equipped with a 2500 N load cell. The pulling rate of the clamps was set at a rate of 50 mm/min. Measurements were taken five times for each part.

2.3. Empirical Factors and Orthogonal Design

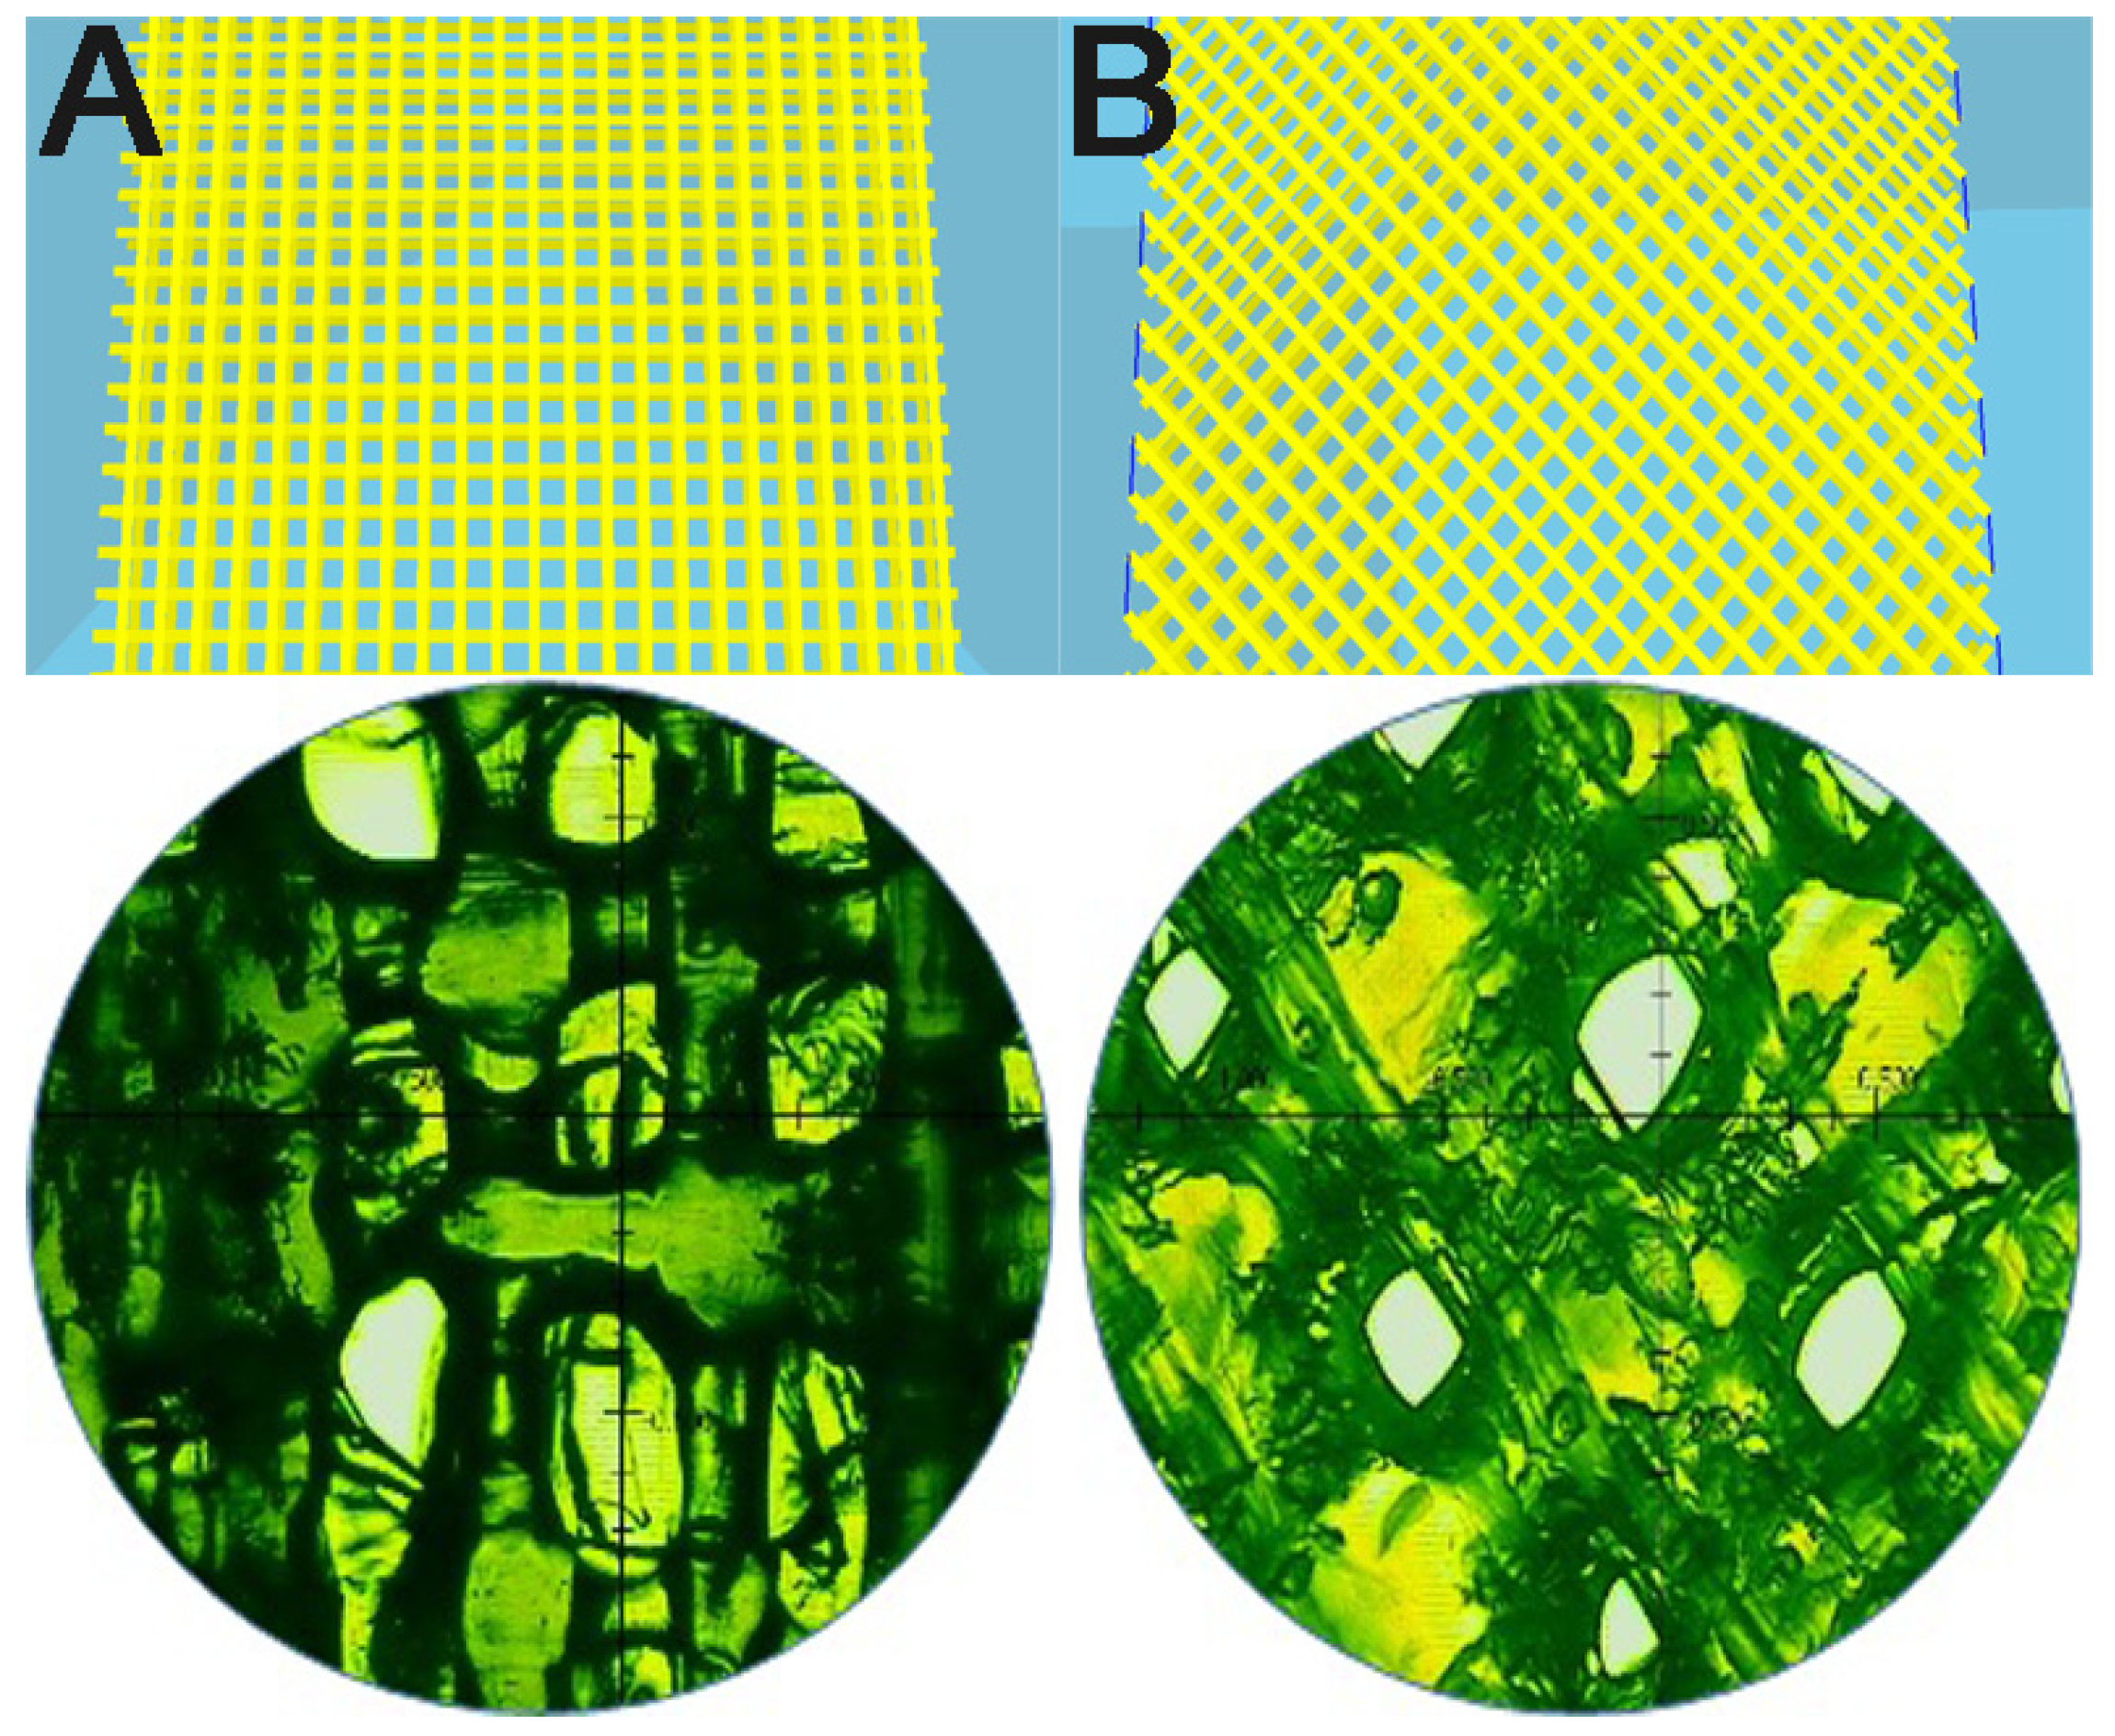
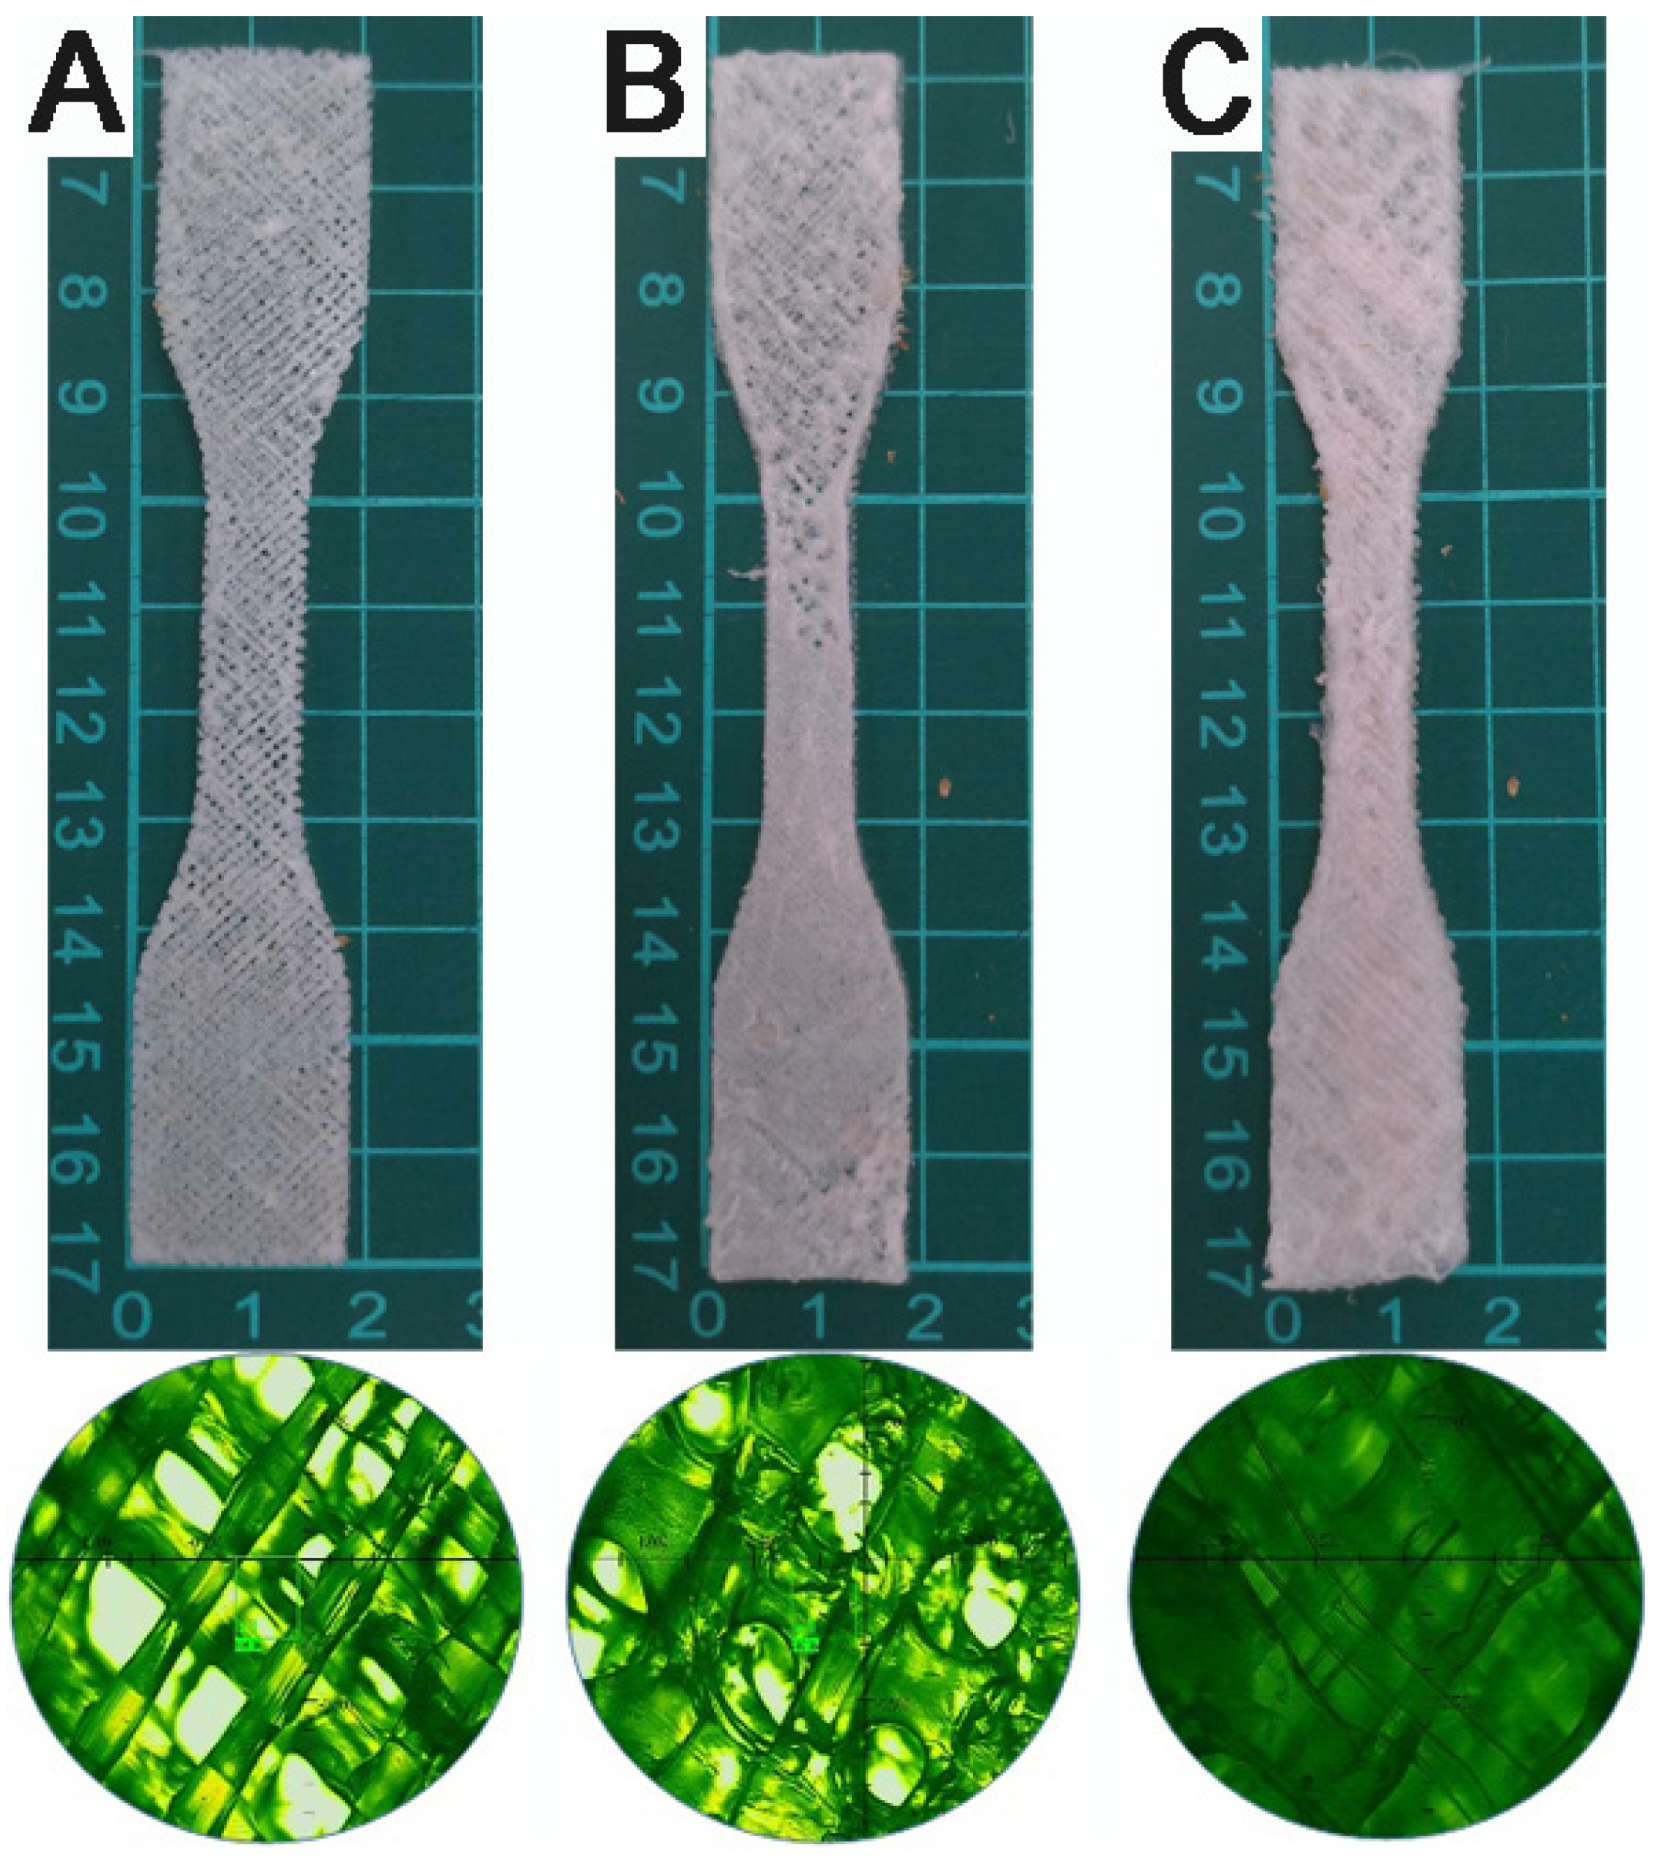
Five processing variables were chosen for analysis, including print orientation, fill density, oven temperature, nozzle temperature, and print speed. Before setting the values, a few test trials were first completed to identify the range of processing parameters that can successfully print the parts. For melt extrusion 3D printing, the print orientation was then set at either 0° or 45° (as shown in Figure 7). The fill density was 40%, 50%, or 60%. The oven temperature was maintained at 25 °C, 30 °C, or 40 °C, while the nozzle temperature was set at 210 °C, 220 °C, or 230 °C. The print speed (moving speed of the nozzle) was 50, 55, or 60 mm/s.
For solution extrusion 3D printing, five parameters were selected for analysis, including print speed, fill density, PLA/DCM ratio, oven temperature, and print orientation. The print speed (moving speed of the nozzle) was 30, 35, or 40 mm/s. The fill density was 45%, 65%, or 75% (as shown in Figure 8). The PLA/DCM ratio (w/v) was set to be 5 g/5.5 mL, 5 g/5.8 mL, or 5 g/5.2 mL. The oven temperature (air temperature of the oven) was kept at 25 °C, 20 °C, or 22 °C. The print orientation selected was either 0° or 45°. Table 1 and Table 2 list the adopted factors and factor levels for the melt and solution printing experiments, respectively.
A Taguchi L18 orthogonal array design [14] (Table 3 and Table 4, respectively, for melt extrusion FDM and solution extrusion printings) was adopted for analysis. The array provides the method of completing the minimised number of experimental runs while providing the full data of all the parameters affecting the performance [15]. To optimise the printed products’ mechanical properties, the optimised processing condition can be obtained by combining all the processing conditions that possess the highest tensile strengths.

2.4. Characterization of Printed Parts

The morphology of the parts was examined using a profile projector (APEX-2010, Taipei, Taiwan) and a field emission scanning electron microscope (FESEM; JEOL Model JSM-7500F, Tokyo, Japan).
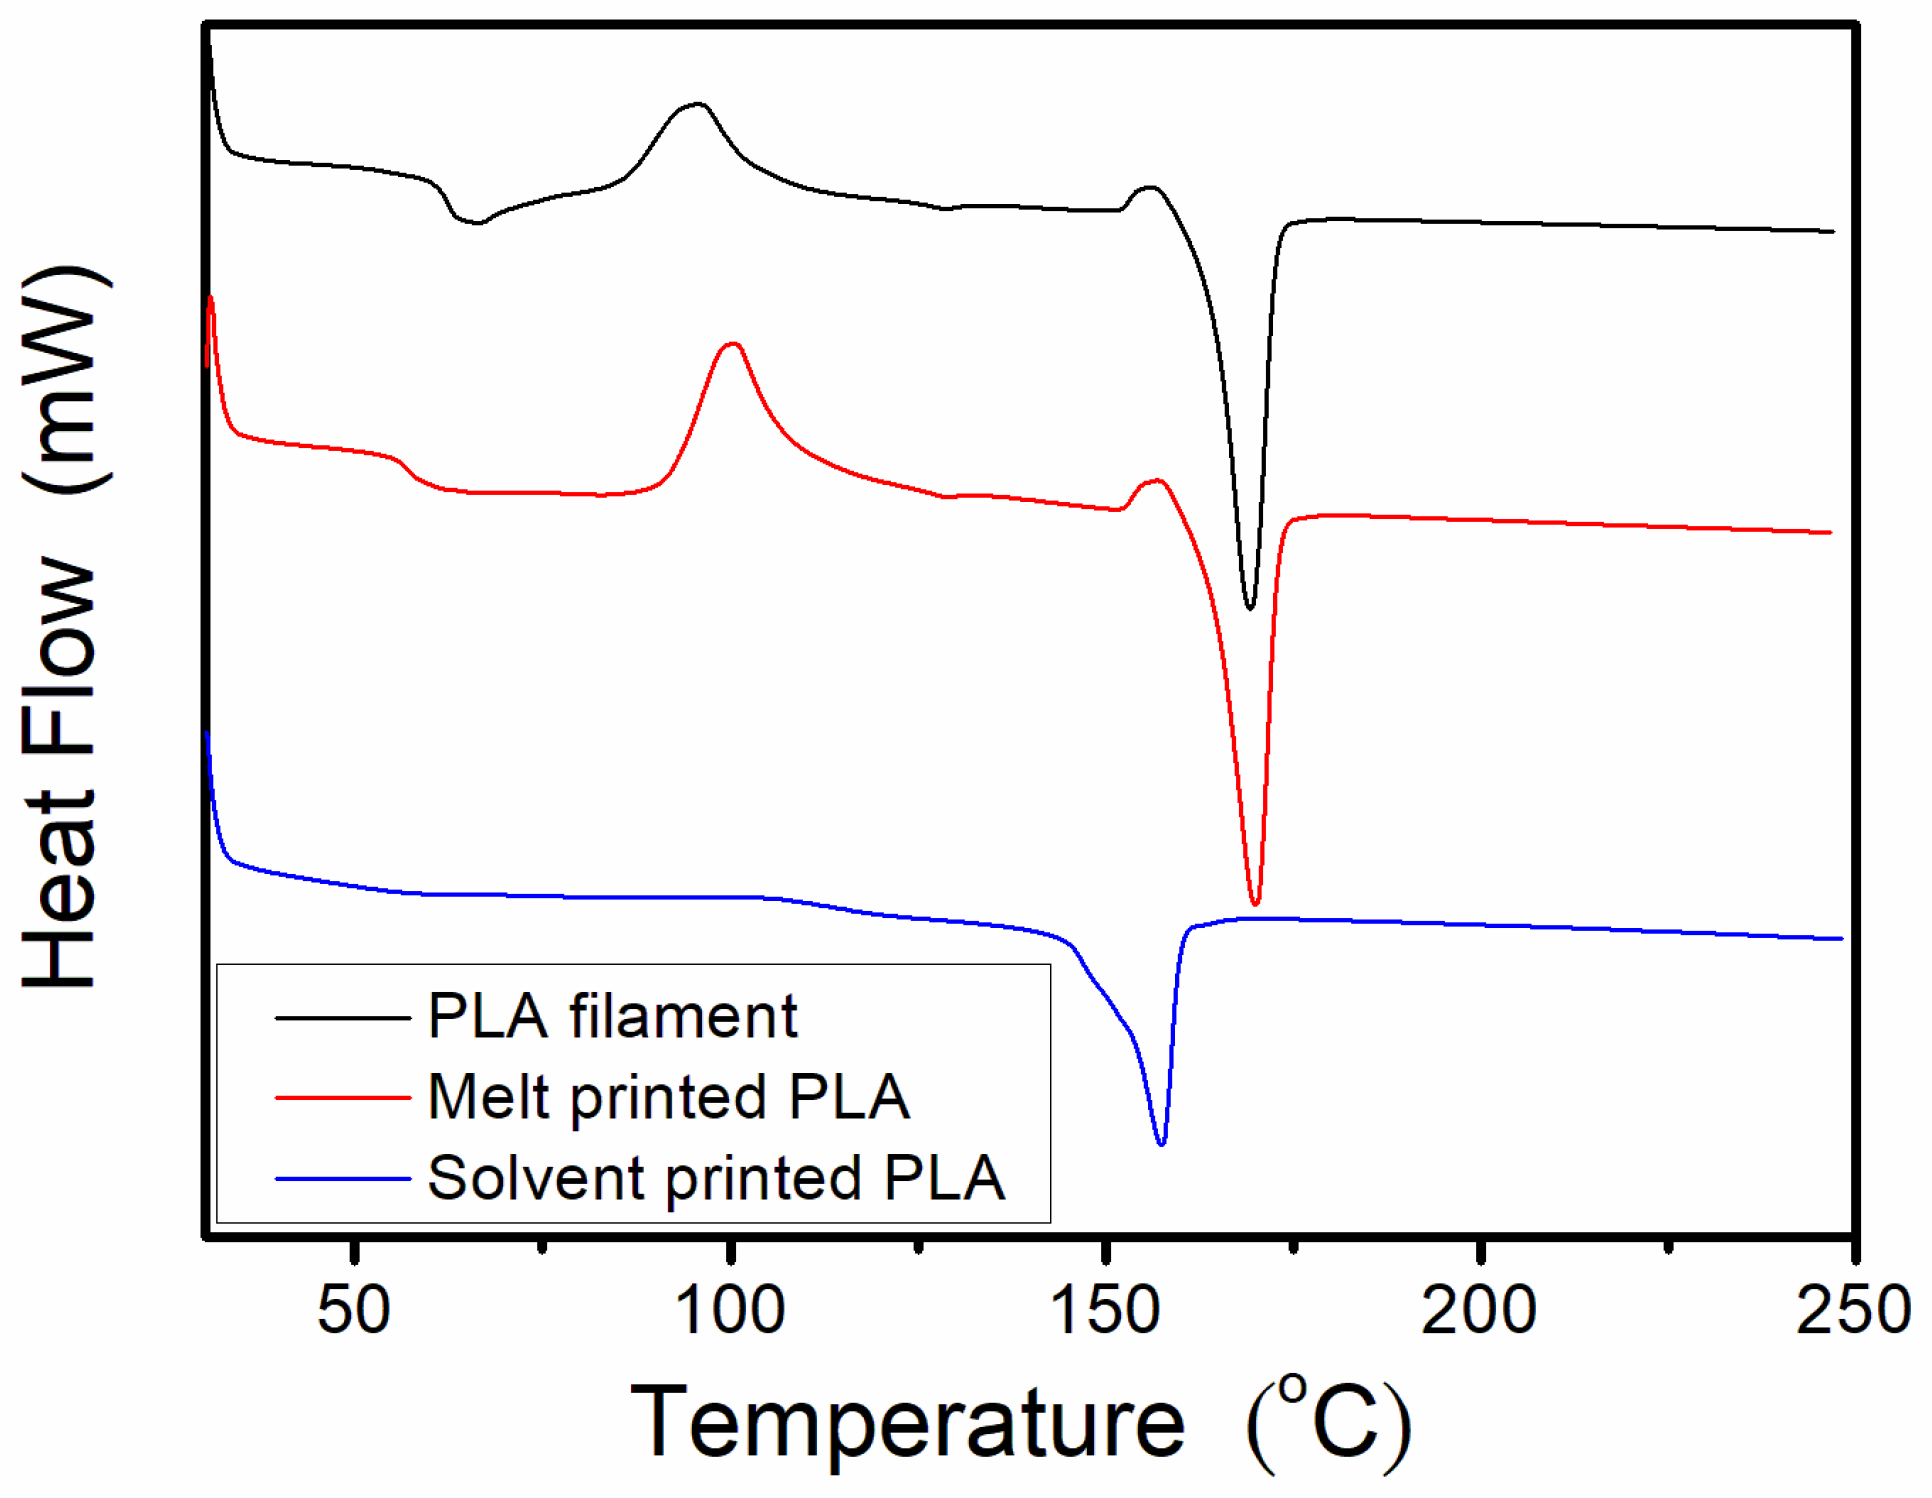
A TA Instruments model DSC25 differential scanning calorimeter was also utilised to assess the thermal properties of the PLA filaments, the melt extrusion printed PLA, and the solution extrusion-printed PLA parts. The scan temperature is from 30 to 250 °C, while the heating rate of the specimen was 10 °C/min.

3. Results

The experiments were completed on a commercially-available melt extrusion 3D printer and a lab-developed solution extrusion printer. Figure 9 displays the typical tensile curves of both solution- and melt-printed parts. Table 3 lists the tensile properties of FDM-printed parts, while Table 4 shows the properties of solution-printed parts. Clearly, FDM-printed parts exhibited greater mechanical strengths than solution-printed parts. The properties obtained from each test trial were then assessed statistically.

3.1. Optimizing the Processing Conditions

In the Taguchi method, it is desirable to minimize the variability in the product’s performance in response to noise factors (uncontrollable factors) while maximizing the variability in response to signal factors (control factors). The signal/noise (S/N) ratio is the quantity denoting statistically how the response changes with respect to the target performance (property) under diverse noise conditions [14]. A higher value of the S/N ratio determines the control variable settings that diminish the influences of the noise variables. Maximising the S/N ratio leads to minimised properties that are sensitive to noise. Since maximisation of tensile strength is the object of this work, the expression depicting the greater-the-better feature was employed for the analysis:
S N = 10 log 10 [ ( 1 n ) i = 1 n ( 1 y i 2 ) ]
where yi is the measured tensile strength for each test part, and n represents the number of specimens for each test trial. The factor levels with the largest S/N ratios will minimise the noises sensitivity and lead to the optimised levels.
The variation of part strength due to various factors was assessed following the Taguchi technique [15]. The S/N ratios for the melt extrusion FDM printed PLA parts were calculated. Figure 10A shows the results. Based on Figure 10A, the optimised factor levels that lead to parts with the highest tensile strengths were estimated to be A2/B3/C1/D3/E3. These optimal factor levels represent a 0° print orientation, a fill density of 60%, an oven temperature of 25 °C, a nozzle temperature of 230 °C, and a print speed of 60 mm/s.
Calculated S/N ratios for the solution extrusion 3D-printed PLA parts are displayed in Figure 10B. Based on the figure, the optimised factor levels that result in the maximum part strengths were estimated to be A2/B2/C2/D3/E1. These optimal factor levels indicate a print speed of 35 mm/s, a fill density of 65%, a PLA/DCM ratio of 5 g/5.8 mL, an oven temperature of 22 °C, and a 45° print orientation.

3.2. Confirmation Experiments

As the optimal combination of factor levels for the melt extrusion printed parts was not included in the array in Table 3, another path was adopted to appraise the response of the part strengths to the optimal factor levels. Presuming no interplay among the selected factors, the predicted S/N ratio for the optimal levels, ηA2/B3/C1/D3/E3, is
η A 2 / B 3 / C 1 / D 3 / E 3 = η m + ( η A 2 η m ) + ( η B 3 η m ) + ( η C 1 η m ) + ( η D 3 η m ) + ( η E 3 η m ) = η A 2 + η B 3 + η C 1 + η D 3 + η E 3 4 η m
where ηm is the mean S/N ratio for the empirical test trials in Table 3, and ηFN is the S/N ratio for factor F and level N. Based on the equation, the appraised S/N ratio of melt extrusion 3D-printed parts for the optimal levels, A2/B3/C1/D3/E3, was 37.19 dB. This estimated value was surely higher than those attained in the 18 test trials in Table 3.
A confirmation test was conducted in accordance with the optimised factor levels. The optimal levels for solution extrusion printed parts is A2/B3/C1/D3/E3. The part strength thus acquired was 40.49 MPa. In addition, the S/N ratio for this confirmation test was 35.8 dB. Although this value is lower than the predicted value of 37.19 dB, it is higher than those achieved by other processing conditions in the 18 experimental tests in Table 3. Therefore, by adopting the optimized factor levels, the tensile strengths of FDM extrusion printed parts were adequately maximised.
Meanwhile, the appraised S/N ratio of solution extrusion printed parts for the optimised levels, A2/B2/C3/D3/E1, was 22.36 dB. This predicted value was certainly higher than those achieved in the 18 test trials in Table 4. A verification test was also completed based on the optimised factor levels. The optimised levels for solution extrusion printed parts are A2/B2/C3/D3/E1. The part strength thus acquired was 9.94 MPa. Additionally, the S/N ratio for this confirmation experiment was 19.90 dB. Although this value is lower than the appraised value of 22.36 dB, it is higher than those achieved by other sets of processing conditions in Table 4. The experimental results testify again that we can adequately maximise the strengths of solution extrusion-printed parts using the optimal levels.

3.3. Importance of Processing Parameters

The S/N ratio is an important measure of robustness used to determine control variables that decrease variability in a manufacturing process by reducing the influences of uncontrollable (or noise) variables [14,15]. The importance of each processing parameter on the product quality can, therefore, be decided by the alteration of S/N. In line with the data presented in Figure 10A, the significance ranking of each parameter for the strength of FDM printed parts was fill density (∆S/N = 8.91 dB), print speed (∆S/N = 5.94 dB), oven temperature (∆S/N = 5.72 dB), print orientation (∆S/N = 3.98 dB), and nozzle temperature (∆S/N = 3.44 dB). For the parameters chosen in this analysis, fill density, print speed, and oven temperature were identified as the most important factors affecting the tensile properties of FDM printed parts.
Based on Figure 10B, the importance of each parameter for the tensile strength of solution extrusion-printed parts was, from high to low, oven temperature (∆S/N = 5.13 dB), fill density (∆S/N = 4.86 dB), PLA/DCM ratio (∆S/N = 3.95 dB), print speed (∆S/N = 2.98 dB), and print orientation (∆S/N = 1.10 dB). For the variables chosen in this analysis, oven temperature, fill density, and PLA/DCM ratio were identified as the most important parameters affecting the strength of solution extrusion-printed parts.

3.4. Characterization of Melt- and Solution-Printed Parts

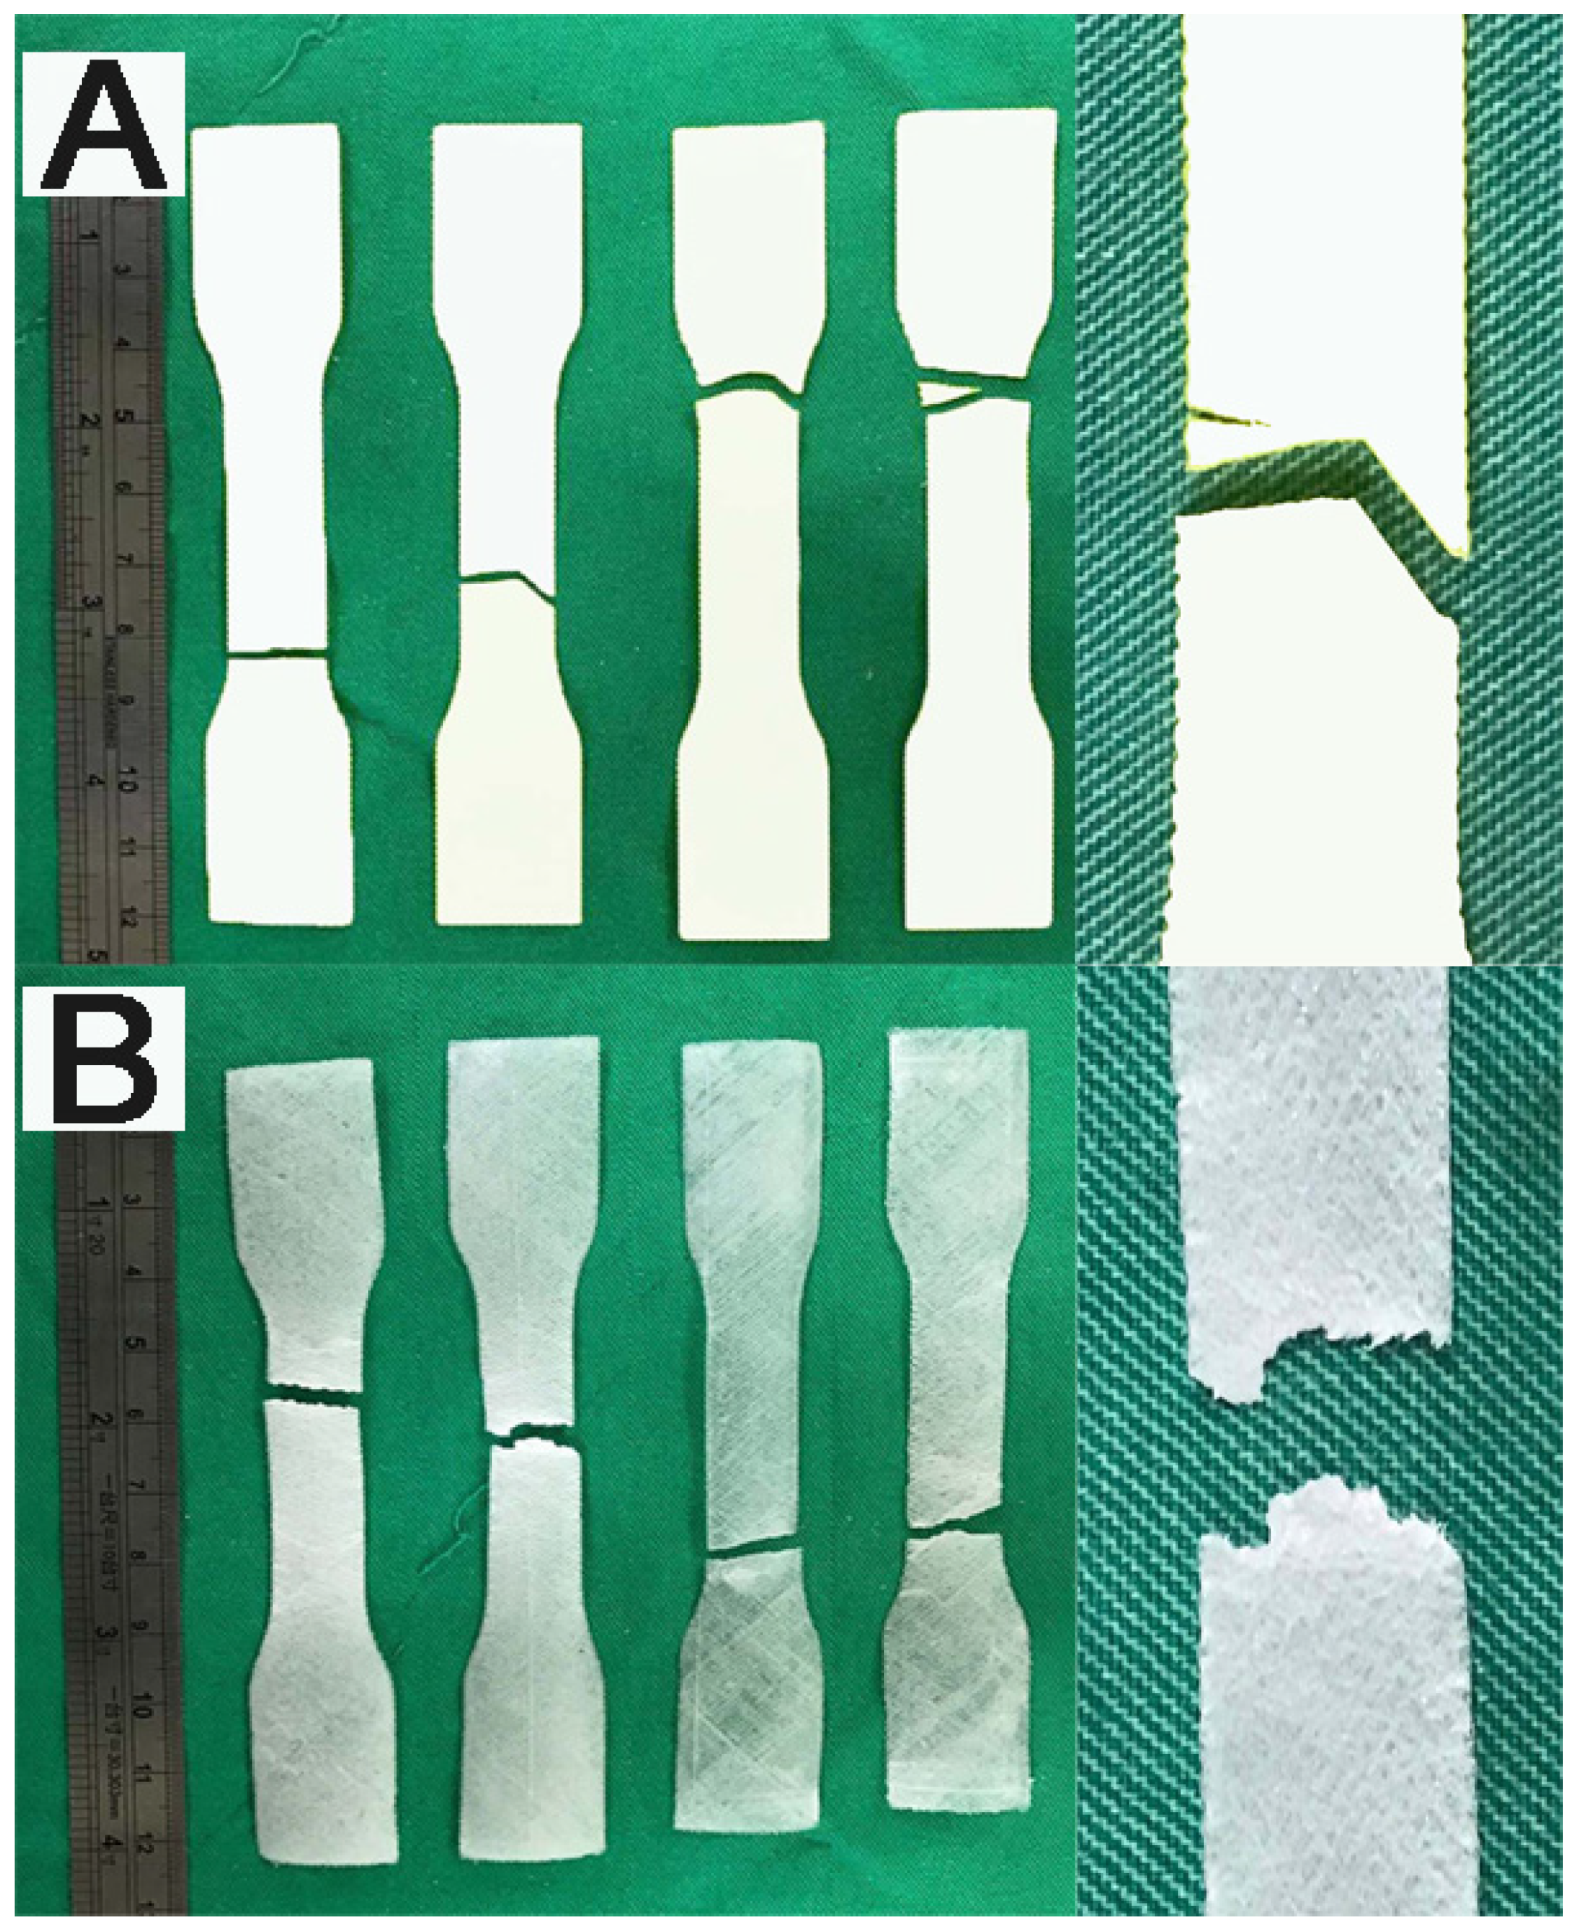
Figure 11 displays the gross appearance of the fracture parts. While the melt extrusion FDM printed parts show sharp fracture interfaces, solution printed parts exhibited more ductile interfaces at the fractures.
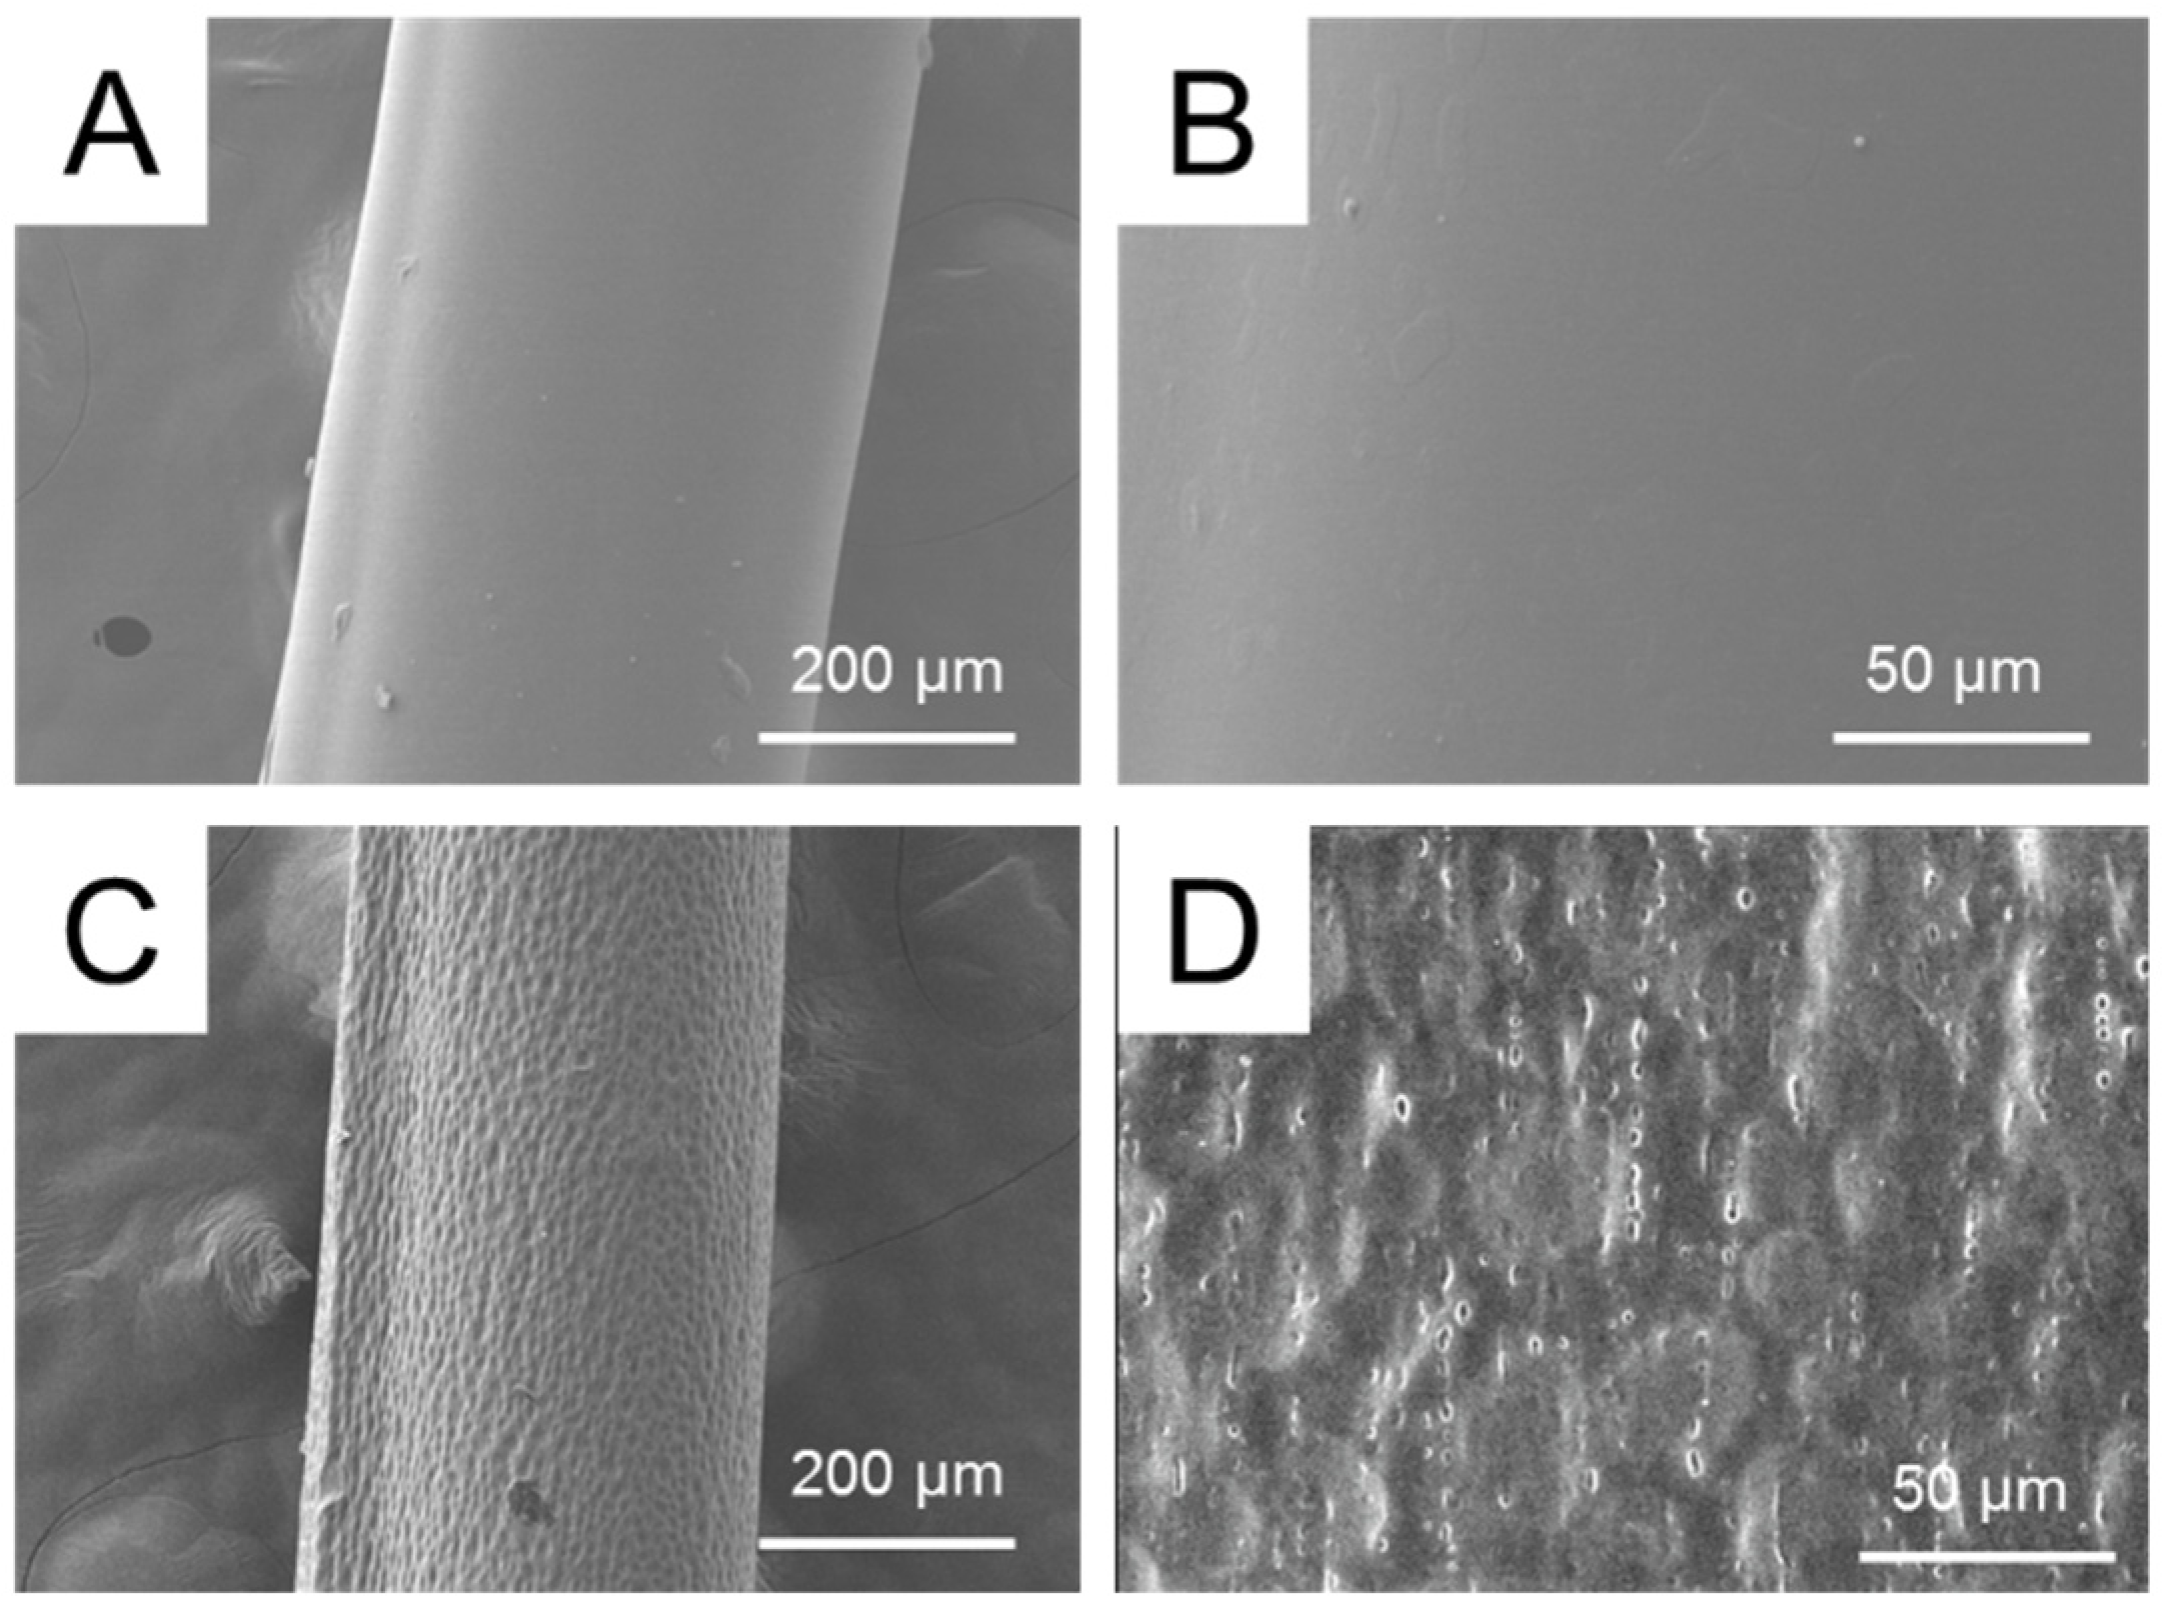
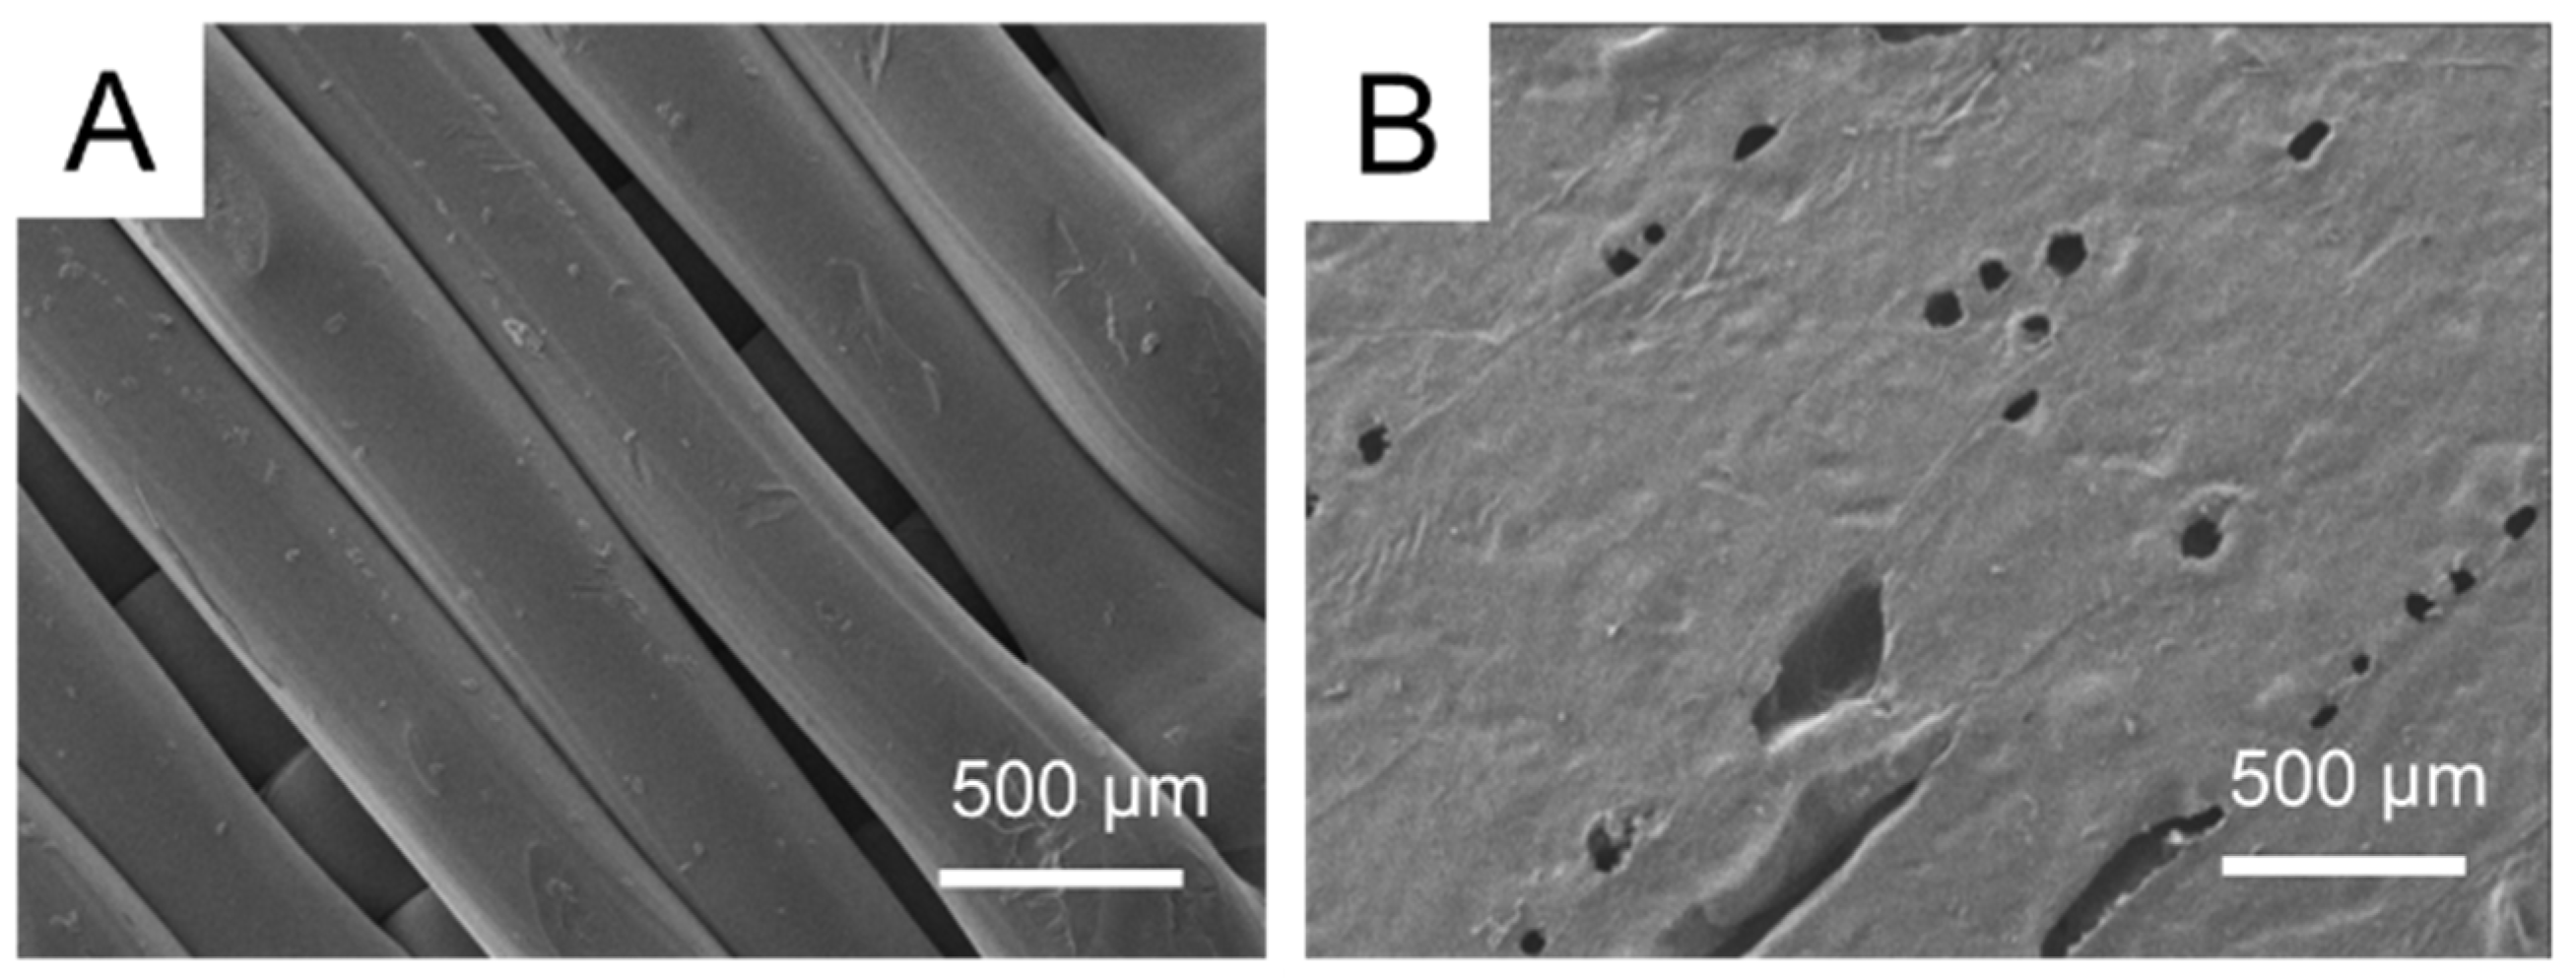
Figure 12A,B show the SEM images of one single extruded strip by FDM printing, and Figure 12C,D display images of a solution-extruded strip. While the melt-extruded strip shows a smooth surface, the solution-extruded strip exhibits a rough surface morphology. Tiny pores could be observed on the surface of the solution-extruded strip, which might result from the evaporation of solvent. Meanwhile, Figure 13A,B show the layer surfaces of melt and solution-printed parts, respectively. While the melt-printed surface displays a bundle of aligned strips, the solution-printed part exhibits a fused surface with some incompletely healed tiny pores.
Figure 14 reveals the DSC curves of the as-purchased PLA filaments, the melt extrusion FDM printed PLA, and the solution extrusion printed PLA. The melt printed PLA exhibited similar thermal properties as the as-purchased PLA filaments, namely a glass transition temperature at 66 °C, a crystallisation exotherm at near 100 °C, and a melt temperature at about 165 °C. However, due to the addition of solvent, the solution printed PLA demonstrated no obvious glass transition temperature [16]. The melting point dropped from 165 °C to 157 °C. Furthermore, the crystallisation peak at 100 °C was not observed on the DSC curve.

4. Discussion

The mechanical properties of the final product define its quality and determine its success or failure in a given application. Solution-printed parts exhibited lower strength than melt-printed parts. This might also be because, with the presence of DCM, PLA materials develop the least crystallinity during the printing process. Printed parts thus exhibited lower mechanical strengths. Meanwhile, the solution-printed parts also possessed incompletely fused tiny pores and cracks, which might lead to stress concentrations at these sites. Printed parts’ strength decreased accordingly.

4.1. Melt Extrusion-Printed Products

The experimental data in Figure 10A (factor level B3) showed that the PLA parts printed with the highest fill density exhibit the greatest tensile strengths. The fill density defines the amount of plastic used on the inside of the print. A higher fill density indicates that there is more plastic on the inside of the print, thus leading to a stronger object.
The experimental data in Figure 10A (factor level E3) suggests that one can obtain 3D-printed PLAs of the greatest strength by utilizing the highest print speed. To gain mechanical strengths, the molecular chain entanglement among various strips is important. During the printing process, the polymeric melt begins to cool as soon as it is extruded from the nozzle. Increasing the print speed keeps the polymeric strips hot for a longer time. It is easier for a molecular chain to entangle at the interfaces at a higher temperature and gain in strength. Thus, the printed parts expressed higher mechanical strengths.
The empirical data in Figure 10A suggest that one should use the lowest oven temperature (25 °C, factor level C1) to print parts of the greatest mechanical strengths. Keeping the oven temperature at a lower level provides a fast cooling environment for potential material quenching. Printed parts might thus exhibit higher tensile properties.
The experimental data suggested the adoption of the highest nozzle temperature to print parts with the greatest mechanical strengths (factor level B3 in Figure 10A). A higher nozzle temperature keeps the materials hot for a longer time. It is easier for the material strips to merge during the printing process. The printed parts thus exhibited greater strength. Finally, again, due to the irregular fractures (Figure 11A), the effect of print orientation on melt extrusion-printed parts is thus calculated to be relatively insignificant.

4.2. Solution Extrusion-Printed Parts

The experimental results in Figure 10B (factor level D3) show that we should adopt an oven temperature of 22 °C to print parts of the greatest mechanical strength. This is due to the fact that to produce parts of greater strength, it is necessary to enhance chain entanglements [17] at the interfaces of various extruded strips. During solution printing, evaporation of solvents and chain diffusion of polymers take place during the solidification process of polymeric materials, and chain entanglement is liable for the final mechanical properties of printed parts [18]. The previous study reported that for solution processing of polymeric materials, the best polymeric solution is a semi-dilute, moderately entangled regime, which takes place at Ce (critical entanglement concentration) [19]. This stage is the crossover point from the semi-dilute un-entangled regime to the semi-dilute moderately entangled regime. Within this range, enhanced entanglement at the strip interfaces can be expected. When the oven temperature is too high (high than 22 °C), the solvent can evaporate too fast, and there is insufficient time for the polymeric solution to undergo molecular entanglement at the interface. The tensile strengths of printed parts thus decreased. On the other hand, if the oven temperature is too low, it would take longer for the solvent to be evaporated. The excessive solvent might diffuse and dissolve the surrounding strips (as shown in Figure 13B) and diminish the molecular chain entanglement. Printed part strengths decreased accordingly.
The data in Figure 10B suggest the optimal fill density to be 65% (factor level B2). The fill density defines the number of polymeric materials used in printing a part. A higher fill density indicates that there is more plastic on the inside of the print, leading to a stronger object. Nevertheless, as the fill density is too high, due to the excessive solvent, it might take longer to solidify the semi-dilute materials. The unevaporated solvent might diffuse and penetrate into the surrounding strips, and reduce the molecular chain entanglement and the relevant part strengths.
Adopting the highest concentration of DCM (i.e., PLA/DCM = 5/5.8, factor level C2 in Figure 10B) increased the mechanical strength of the solution-printed parts. Increasing the solvent keeps the polymer in the semi-dilute state for a longer time. It is then easier for the polymeric strips to heal at the interfaces. Printed PLA parts thus exhibited higher strength.
The empirical data suggested that a print speed of 35 mm/s (factor level A2 in Figure 10B) should be used to print parts with the highest strengths. As soon as the solution is extruded out of the nozzle, the solvent begins to evaporate. If the print speed is too high, the solvent evaporates too fast, and there is less time for the polymeric solution to undergo molecular entanglement at the interface. By contrast, if the print speed is too low, it would take a longer time for the solvent to evaporate. The excessive solvent might diffuse and diminish the molecular chain entanglement. The strength of the printed parts is thus decreased. Finally, the 45° orientation printed parts exhibited higher strength than the 0° printed parts. Due to the irregular fracture characteristic at the ductile interfaces (Figure 11B), the effect of print orientation on the solution extrusion-printed parts is relatively limited.
This study has satisfactorily utilized the Taguchi technique to maximize the mechanical properties of both solutions and melt extrusion 3D-printed products. The same method can also be adapted to optimize the other properties of printed parts or the printing of other materials. This proves the eventuality of the empirical design in 3D printing products of different applications.
Finally, PLA is a biodegradable, biocompatible, non-toxic and eco-friendly polymer that can be used for many applications, where the tensile strength may not be the only important property of the 3D-printed material (surface morphology, etc. can be important as well). The use of DCM significantly reduced the mechanical strength of PLA materials. Other solvents should also be investigated for their feasibility in solution extrusion printing. Additionally, PLA is currently employed in various medical applications including medical implants, tissue engineering, orthopaedic devices, and drug-delivery systems. Printing PLA parts mixed with drugs and/or biomolecules using solution extrusion 3D printing offers the advantage of avoiding the high temperatures associated with FDM printing and minimizing the possibility of deactivating drugs/biomolecules. This would provide a great alternative for the fabrication of drug-loaded products.

5. Conclusions

Here we report the findings of a comparative study of the effects of different processing parameters on the solution and melt 3D printing of PLA parts. The following conclusions can be reached based on the experimental results:
First, our empirical design based on the Taguchi method was successful in maximizing the mechanical strengths of 3D-printed parts by optimizing the processing parameters, although the interplay among the selected parameters was beyond the scope of this work.
Second, the solution extrusion-printed parts exhibited less strength than the melt extrusion-printed parts. This might be because, with the presence of DCM, PLA materials develop the least crystallinity during the printing process. Printed parts thus exhibited a much lower mechanical strength.
Third, for the parameters chosen in this analysis, fill density, print speed, and oven temperature were identified as the most important factors affecting the tensile properties of melt extrusion 3D-printed parts. On the other hand, oven temperature, fill density, and PLA/DCM ratio were found to be the most important parameters influencing the strength of solution extrusion-printed parts.

Author Contributions

Conceptualization, J.-M.C. and Y.-Y.T.; methodology, Y.-T.L.; formal analysis, Y.-T.L.; investigation, D.L., S.-H.L. and T.-Y.L.; data curation, Y.-T.L.; writing—original draft preparation, S.-J.L.; writing—review and editing, H.I.; project administration, S.-J.L.; funding acquisition, S.-J.L. All authors have read and agreed to the published version of the manuscript.

Funding

The final supports from the Ministry of Science and Technology, Taiwan (Contract No. 108-2221-E-182-004) and the Chang Gung Memorial Hospital (Contract No. CMRPD2H0032) were acknowledged.

Conflicts of Interest

The authors declare that there is no conflict of interest regarding the publication of this paper.

References

  1. Ngo, T.D.; Kashani, A.; Imbalzano, G.; Nguyen, K.T.Q.; Hui, D. Additive manufacturing (3D printing): A review of materials, methods, applications and challenges. Compos. Part B 2018, 143, 172–196. [Google Scholar] [CrossRef]
  2. Choi, J.C.; Kwon, O.C.; Jo, W.; Lee, H.J.; Moon, M.W. 4D printing technology: A review. 3D Print Addit. Manuf. 2015, 2, 2159–2167. [Google Scholar] [CrossRef]
  3. Alafaghani, A.; Qattawi, A.; Alrawi, B.; Guzman, A. Experimental optimization of Fused Deposition Modelling processing parameters: A design-for-manufacturing approach. Procedia Manuf. 2017, 10, 791–803. [Google Scholar] [CrossRef]
  4. Guerra, A.J.; Ciurana, J. 3D-printed bioabsordable polycaprolactone stent: The effect of process parameters on its physical features. Mater. Des. 2018, 137, 430–437. [Google Scholar] [CrossRef]
  5. Holländer, J.; Genina, N.; Jukarainen, H.; Khajeheian, M.; Rosling, A.; Mäkilä, E.; Sandler, N. Three-dimensional printed PCL-based implantable prototypes of medical devices for controlled drug delivery. J. Pharm. Sci. 2016, 105, 2665–2676. [Google Scholar] [CrossRef] [PubMed] [Green Version]
  6. Visscher, L.E.; Dang, H.P.; Knackstedt, M.A.; Hutmacher, D.W.; Tran, P.A. 3D printed Polycaprolactone scaffolds with dual macro-microporosity for applications in local delivery of antibiotics. Mater. Sci. Eng. C 2018, 87, 78–89. [Google Scholar] [CrossRef] [PubMed] [Green Version]
  7. Yi, H.G.; Choi, Y.J.; Kang, K.S.; Hong, J.M.; Pati, R.G.; Park, M.N.; Shim, I.K.; Lee, C.M.; Kim, S.C.; Cho, D.W. A 3D-printed local drug delivery patch for pancreatic cancer growth suppression. J. Control. Release 2016, 238, 231–241. [Google Scholar] [CrossRef] [PubMed]
  8. Huang, B.; Meng, S.; He, H.; Jia, Y.; Xu, Y.; Huang, H. Study of processing parameters in fused deposition modeling based on mechanical properties of Acrylonitrile-Butadiene-Styrene filament. Polym. Eng. Sci. 2019, 59, 120–128. [Google Scholar] [CrossRef] [Green Version]
  9. Ingrassia, T.; Nigrelli, V.; Ricotta, V.; Tartamella, C. Process Parameters Influence in Additive Manufacturing. In Advances on Mechanics, Design Engineering and Manufacturing; Eynard, B., Nigrelli, V., Oliveri, S., Peris-Fajarnes, G., Rizzuti, S., Eds.; Springer: Cham, Switzerland, 2017. [Google Scholar]
  10. Maloch, J.; Hnatkova, E.; Zaludek, M.; Kratky, P. Effect of processing parameters on mechanical properties of 3D printed samples. Mater. Sci. Forum 2018, 919, 230–235. [Google Scholar] [CrossRef]
  11. Lanzotti, A.; Grasso, M.; Staiano, G.; Martorelli, M. The impact of process parameters on mechanical properties of parts fabricated in PLA with an open-source 3-D printer. Rapid Prototyp. J. 2015, 21, 604–617. [Google Scholar] [CrossRef] [Green Version]
  12. Pretula, J.; Slomkowski, S.; Penczek, S. Polylactides-Methods of synthesis and characterization. Adv. Drug Deliv. Rev. 2016, 107, 3–16. [Google Scholar] [CrossRef] [PubMed]
  13. Farah, S.; Anderson, D.G.; Langer, R. Physical and mechanical properties of PLA, and their functions in widespread applications—A comprehensive review. Adv. Drug Deliv. Rev. 2016, 107, 367–392. [Google Scholar] [CrossRef] [PubMed] [Green Version]
  14. Dehnad, K. Quality Control, Robust Design, and the Taguchi Method; Springer: Berlin/Heidelberg, Germany, 1989. [Google Scholar]
  15. Davim, J.P. Design of Experiments in Production Engineering; Springer: Berlin/Heidelberg, Germany, 2016. [Google Scholar]
  16. Sato, S.; Gondo, D.; Wada, T.; Kanehashi, S.; Nagai, K. Effects of various liquid organic solvents on solvent-induced crystallization of amorphous poly (lactic acid) film. J. Appl. Polym. Sci. 2013, 129, 1607–1617. [Google Scholar] [CrossRef]
  17. Yokomizo, K.; Banno, Y.; Yoshikawa, T.; Kotaki, M. Effect of molecular weight and molecular weight distribution on weld-line interface in injection-molded polypropylene. Polym. Eng. Sci. 2013, 53, 2336–2344. [Google Scholar] [CrossRef]
  18. Yizong, T.; Ariff, Z.M.; Liang, K.G. Evaluation of weld line strength in low density polyethylene specimens by optical microscopy and simulation. J. Eng. Sci. 2017, 13, 53–62. [Google Scholar]
  19. Costa, L.M.M.; Bretas, R.E.S.; Gergorio, R., Jr. Effect of solution concentration on the electrospray/electrospinning transition and on the crystalline phase of PVDF. Mater. Sci. Appl. 2010, 1, 247–252. [Google Scholar] [CrossRef] [Green Version]
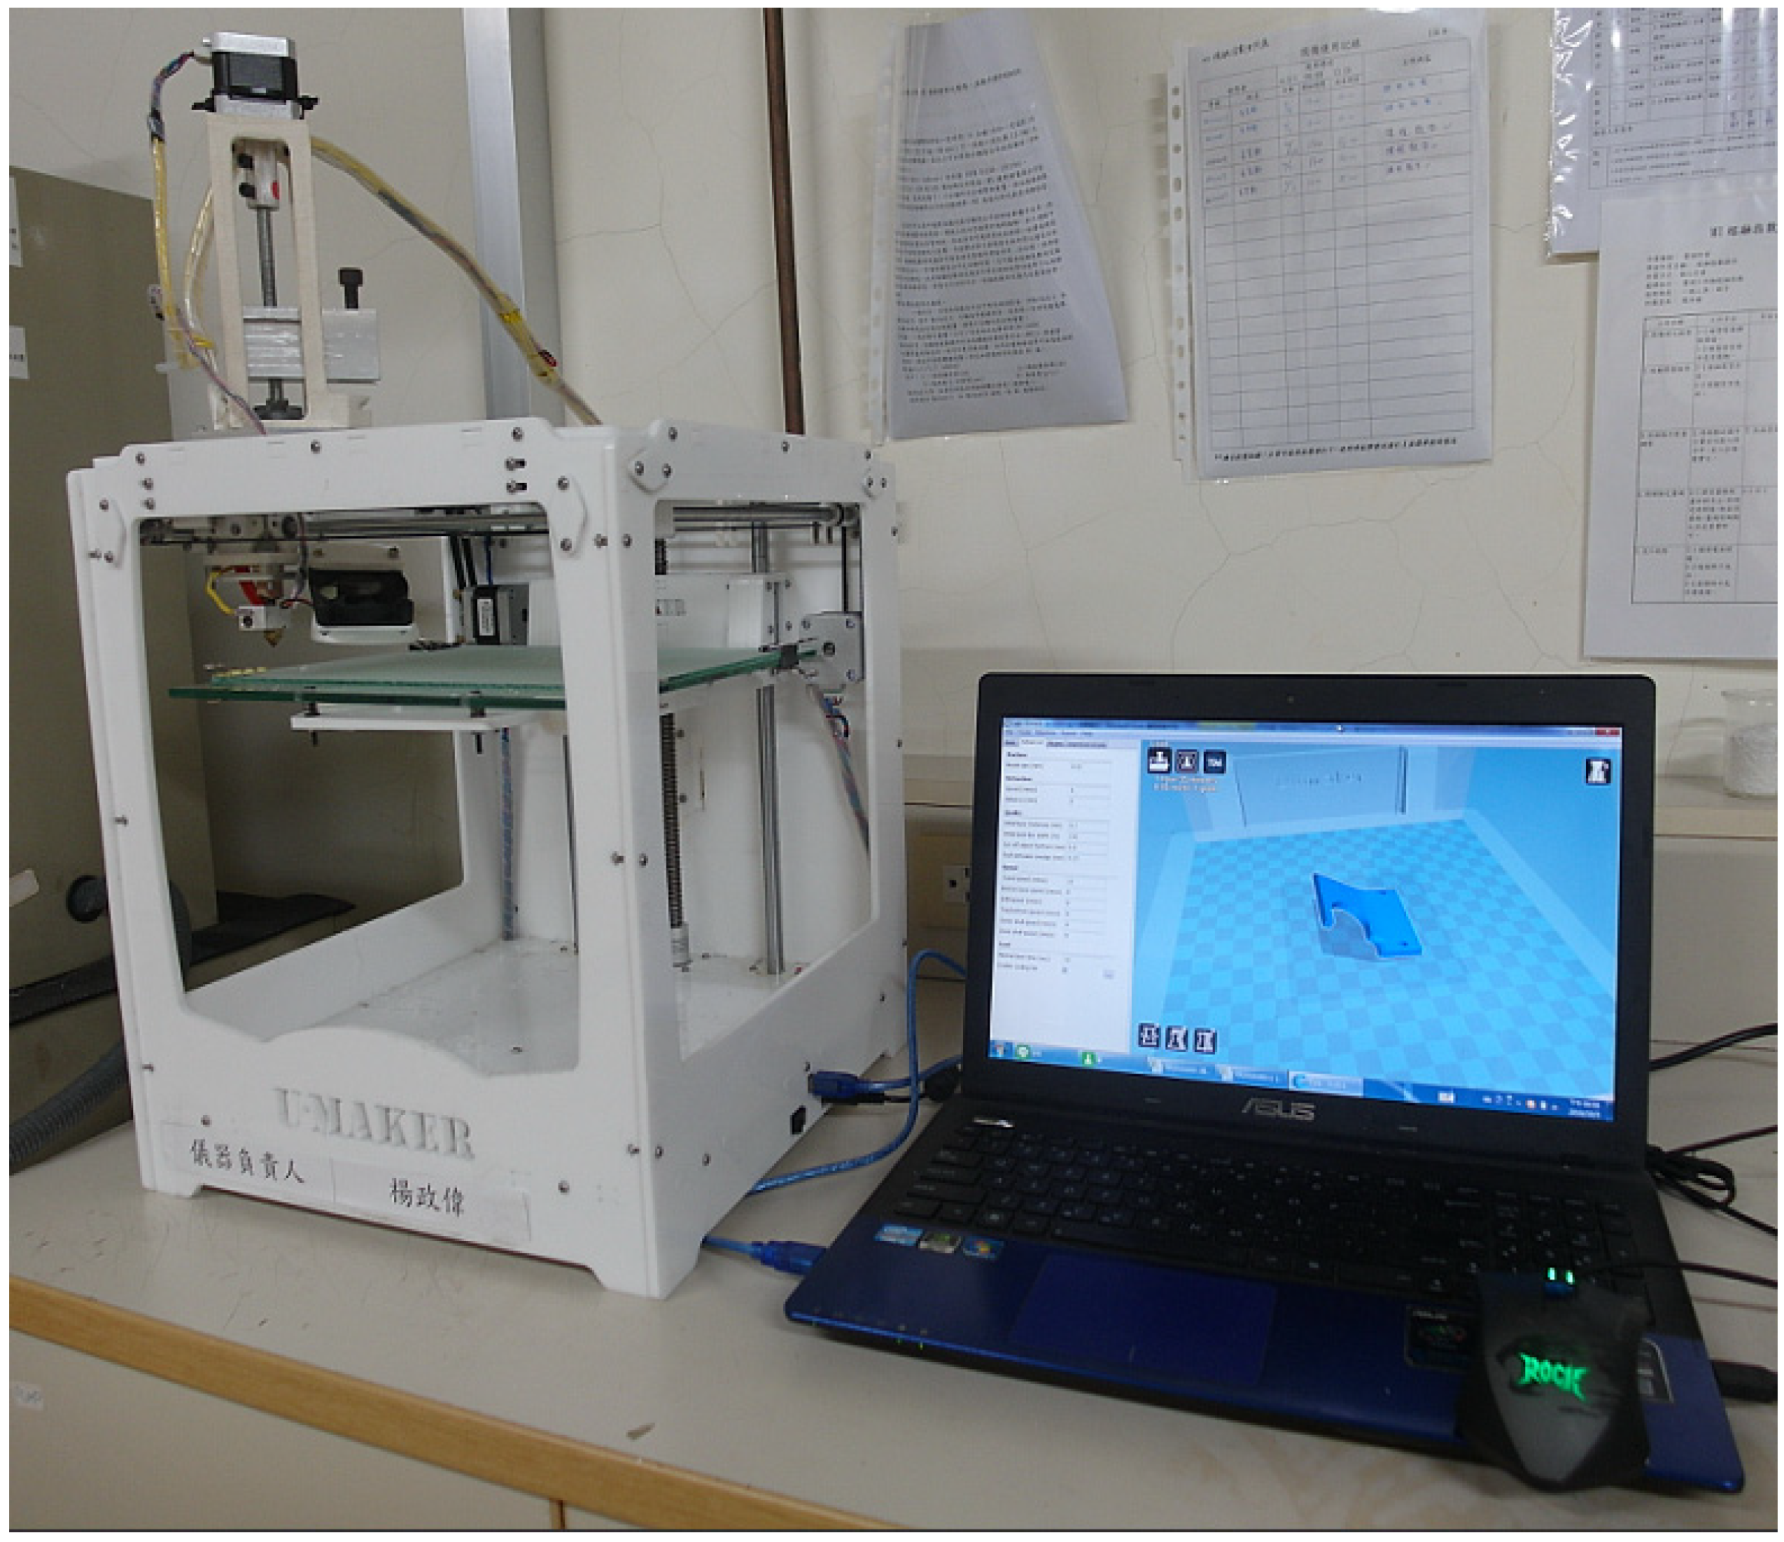
Figure 1. Photo of the lab-exploited solution extrusion type 3D printer, which was a modified version of commercially available fused-deposition modelling (FDM) printer.
Applsci 10 00509 g001
Figure 2. Schematically, the lab-exploited solution extrusion type 3D printer, (A) components of solution-type plunger-actuated feeding system and the feeding syringe (rightmost), (B) assembly of the system.
Applsci 10 00509 g002
Figure 3. Photo of the solution extrusion 3D printer.
Applsci 10 00509 g003
Figure 4. The Cura interface used to control the printing process.
Applsci 10 00509 g004
Figure 5. Layout and dimension of the dumbbell part.
Applsci 10 00509 g005
Figure 6. Photos of square-shaped parts right after printing (left), and 7 days post printing (right).
Applsci 10 00509 g006
Figure 7. Print orientation and the optical image of printed parts (A) 0°, (B) 45°.
Applsci 10 00509 g007
Figure 8. Appearance and optical images of printed parts with different fill densities, (A) 45%, (B) 65%, (C) 75%.
Applsci 10 00509 g008
Figure 9. Stress-strain curves of melt- and solution-printed parts.
Applsci 10 00509 g009
Figure 10. Variation of the signal/noise (S/N) ratio with factor levels, (A) melt extrusion printing, (B) solution extrusion printing.
Applsci 10 00509 g010
Figure 11. Fracture photos of (A) melt extrusion, (B) solution extrusion printed parts.
Applsci 10 00509 g011
Figure 12. Scanning electron microscope (SEM) image of (A) and (B) a single melt-extruded filament, (C) and (D) a single solution extruded filament.
Applsci 10 00509 g012
Figure 13. Surface images of (A) melt extrusion, (B) solution extrusion printed parts under SEM.
Applsci 10 00509 g013
Figure 14. Differential scanning calorimetry (DSC) curves of PLA as purchased, after melt extrusion printing, and after solution extrusion printing.
Applsci 10 00509 g014
Table 1. Parameters used for melt-extruded 3D printing.
FactorA: Print OrientationB: Fill Density (%)C: Oven Temperature (°C)D: Nozzle Temperature (°C)E: Print Speed (mm/s)
Level 1402521050
Level 245°503022055
Level 3 603523060
Table 2. Parameters used for solution extruded 3D printing.
FactorA: Print Speed (mm/s)B: Fill Density (%)C: PLA/DCM * (gram/mL)D: Oven Temperature (°C)E: Print Orientation
Level 130455/5.525
Level 235655/5.82045°
Level 340755/5.222
* PLA: polylactide; DCM: dichloromethane.
Table 3. L18 array used for melt extrusion printing.
RunABCDETensile Strength (MPa)S/N (dB)
11111125.891217.2067
21122225.895612.4604
31133325.764815.4102
41211217.631117.2866
51222321.779415.1252
61233127.207527.8752
71312129.237324.1081
81323228.266022.0089
91331326.223621.5623
102113338.589920.9683
112121139.346715.2586
122132236.548815.7932
132212334.856328.0316
142223135.921720.0155
152231238.632522.8987
162313231.767526.0880
172321333.416421.5181
182332137.253531.3118
Table 4. L18 array used for solution extrusion printing.
RunABCDETensile Strength (MPa)S/N (dB)
1111112.055354.40889
2122216.2388815.88327
3133316.7357516.1665
4212318.9446319.01
5223117.1360516.93238
6231215.735815.02893
7313214.8198313.47489
8321318.042718.10108
9332116.7442816.50814
10111121.609753.35802
11122227.5192817.4975
12133329.055319.08548
13212325.3243514.48105
14223123.181239.64352
15231229.1259519.16463
16313222.792388.48284
17321325.239214.35377
18332129.555519.58572