Article

Simulation of the Hot Deformation and Fracture Behavior of Reduced Activation Ferritic/Martensitic 13CrMoNbV Steel

by
Asad Shaikh
1,2,
Alexander Churyumov
1,*,
Andrey Pozdniakov
1 and
Tatiana Churyumova
3
1
National University of Science and Technology “MISiS”, Leninskiy Prospekt 4, 119049 Moscow, Russia
2
Department of Mechanical and Industrial Engineering, Tallinn University of Technology, Ehitajate tee 5, 19086 Tallinn, Estonia
3
JSC ‘‘VNIINM’’, Rogova str. 5a, 123098 Moscow, Russia
*
Author to whom correspondence should be addressed.
Appl. Sci. 2020, 10(2), 530; https://doi.org/10.3390/app10020530
Submission received: 12 December 2019 / Revised: 25 December 2019 / Accepted: 9 January 2020 / Published: 10 January 2020
(This article belongs to the Section Computing and Artificial Intelligence)

Abstract

:

Featured Application

The obtained models of deformation behavior and fracture of reduced activation ferritic/martensitic steel allows one to use it for the finite element optimization of the industrial production processes.

Abstract

This study describes deformation behavior and fracture during compression and tension at high temperatures of ferritic/martensitic 13CrMoNbV steel. Hot compression and tensile tests were carried out in the temperature range of 1100–1275 °C with a thermomechanical simulator Gleeble 3800. The true stress and ultimate tensile strength decrease with an increase in the deformation temperature. The modified Arrhenius-type constitutive model was built for 13CrMoNbV ferritic/martensitic steel using the experimental stress–strain compression data. The modified Rice and Tracy ductile fracture criteria were calculated using finite element simulation of the tensile test at different temperatures. The comparison between experimental and computed force vs. displacement curves shows high predictability of the deformation and fracture models for ferritic/martensitic 13CrMoNbV steel.

1. Introduction

One of the most critical tasks of metallurgy is to reduce losses in production. In industrial conditions, the processing of new materials increases the risk of many losses due to fracturing. In this regard, it is necessary to provide preliminary experimental research and theoretical calculations of deformation behavior and fracture for the development of new technologies. Ductile failure depends basically on the internal plasticity and triaxial stress state of the material [1]. To the present, investigators have developed many fracture criteria. The most famous is the critical level of accumulative energy [2] and the critical value of triaxial stress [3,4]. Moreover, mathematical models of flow stress are needed to correctly predict the hot deformation behavior of materials during industrial production [5,6,7,8,9]; such models can be realized by finite element modeling (FEM) [10,11,12]. Determination of critical plastic deformation until fracture is required to predict hot deformation conditions, which prevent failure of the material [13]. The hot plasticity of metallic materials may be determined by torsion [14,15,16] or tensile [17,18] tests at high temperatures and different deformation rates.
In this work, 13CrMoNbV ferritic/martensitic steel was investigated due to its enhanced resistance to void swelling under irradiation conditions, low creep, and superior corrosion resistance [19,20,21,22,23,24]. However, dual-phase ferritic/martensitic steels lack high ductility during hot deformation, as is the case with one-phase austenitic steels, due to the presence of interphase boundaries in their structure. The hot plasticity of the steel is not enough for hard schemes of hot deformation, such as helical rolling, which is required for the industrial technology of the nuclear fuel shell’s production. To prevent the fracture under hard, hot deformation conditions, deformation and fracture models need to be developed, which can be realized by FEM for the simulation of industrial processes. For this purpose, the hot deformation behavior of the steel was investigated via tensile and compression tests carried out at temperatures in the range of 1100–1275 °C and at strain rates of 0.1, 1, 10 s−1. A model of the fracture was built based on the experimental data and was proved by FEM.

2. Materials and Methods

The ingots of the investigated 13CrMoNbV steel were obtained by vacuum induction melting. Table 1 presents the chemical composition of the steel.
Thermomechanical simulator Gleeble 3800 was used for compression and tensile tests. The compression tests were carried out on specimens with a height of 15 mm and a diameter of 10 mm. Samples for the hot tensile tests had a deformation area with a length of 50 mm and a diameter of 6 mm. Three samples for each of the deformation conditions were used. Specimens were annealed at 1275 °C for 5 min immediately before the mechanical tests and were cooled to testing temperature in the range of 1100–1275 °C with a step of 25 °C. The constant strain rates of 0.1, 1, or 10 s−1 were used for compression to a true strain of 1.0. The specimens were quenched in water directly after the compression to fix the microstructure after deformation. The obtained true stress–strain curves were corrected to take into consideration friction on the edges of the samples and adiabatic heating during deformation, especially at a high strain rate [25,26]. The tensile tests were continued with a constant deformation rate of 50 mm/s. A Tescan-VEGA3 LMH scanning electron microscope (SEM) was used for microstructural investigations. The finite element modeling software Deform 3D was used to simulate plastic deformation behavior and the failure of the steel. The specimens for the simulation of compression and tensile tests were divided into 50,000 tetrahedral elements. The compression was proceeded between two rigid dies with the friction coefficient between the sample and the dies equal to 0.3. The movement boundary conditions were applied to one of the tensile sample’s edges while another edge was fixed. The phase composition of the steel at elevated temperatures was calculated by the Calphad method using Thermocalc software with the thermodynamic database TCFe7 for Fe-based alloys.

3. Results and Discussion

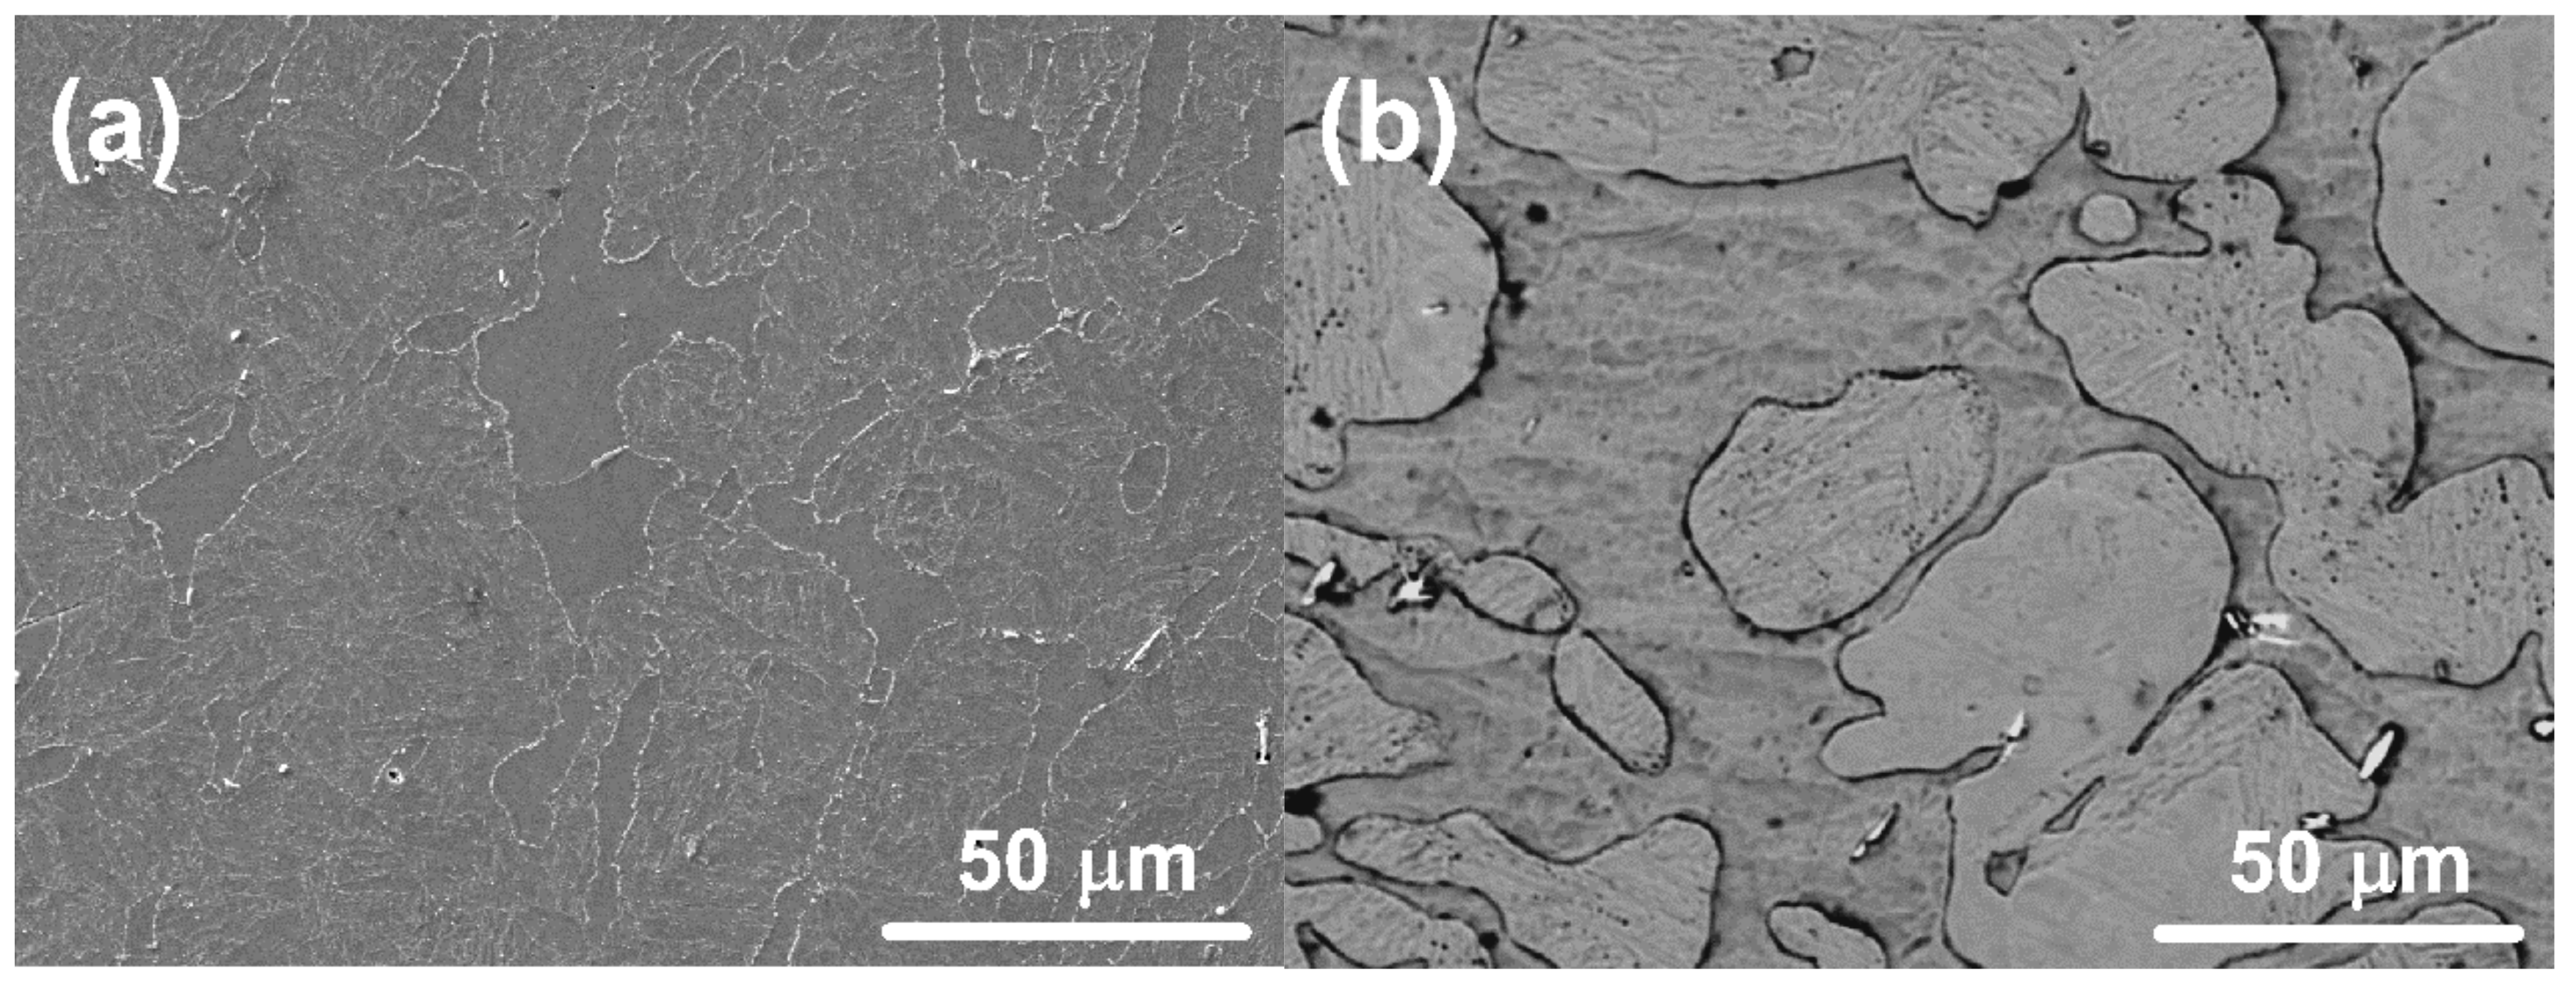
3.1. Initial Microstructure

As shown in Figure 1a, the initial as-cast microstructure of 13CrMoNbV steel consists of martensite, ferrite, and non-metallic particles. The chemical composition of ferrite and martensite significantly differs only in the concentration of Cr and Mo (Table 2). The low level of Nb in both ferrite and martensite phases may confirm that Nb forms boridcarbides of niobium Nb7B4C4 during crystallization, such as in 10CrMoWNb ferritic/martensitic steel [18]. The annealing at 1275 °C for 5 min before deformation increases the size of the ferrite and austenite grains and leads to the dissolution of small Nb7B4C4 particles (Figure 1b). The redistribution of Cr and Mo between ferrite and martensite proceeds during annealing with the increase in its concentrations in the bcc-Fe phase (Table 2).

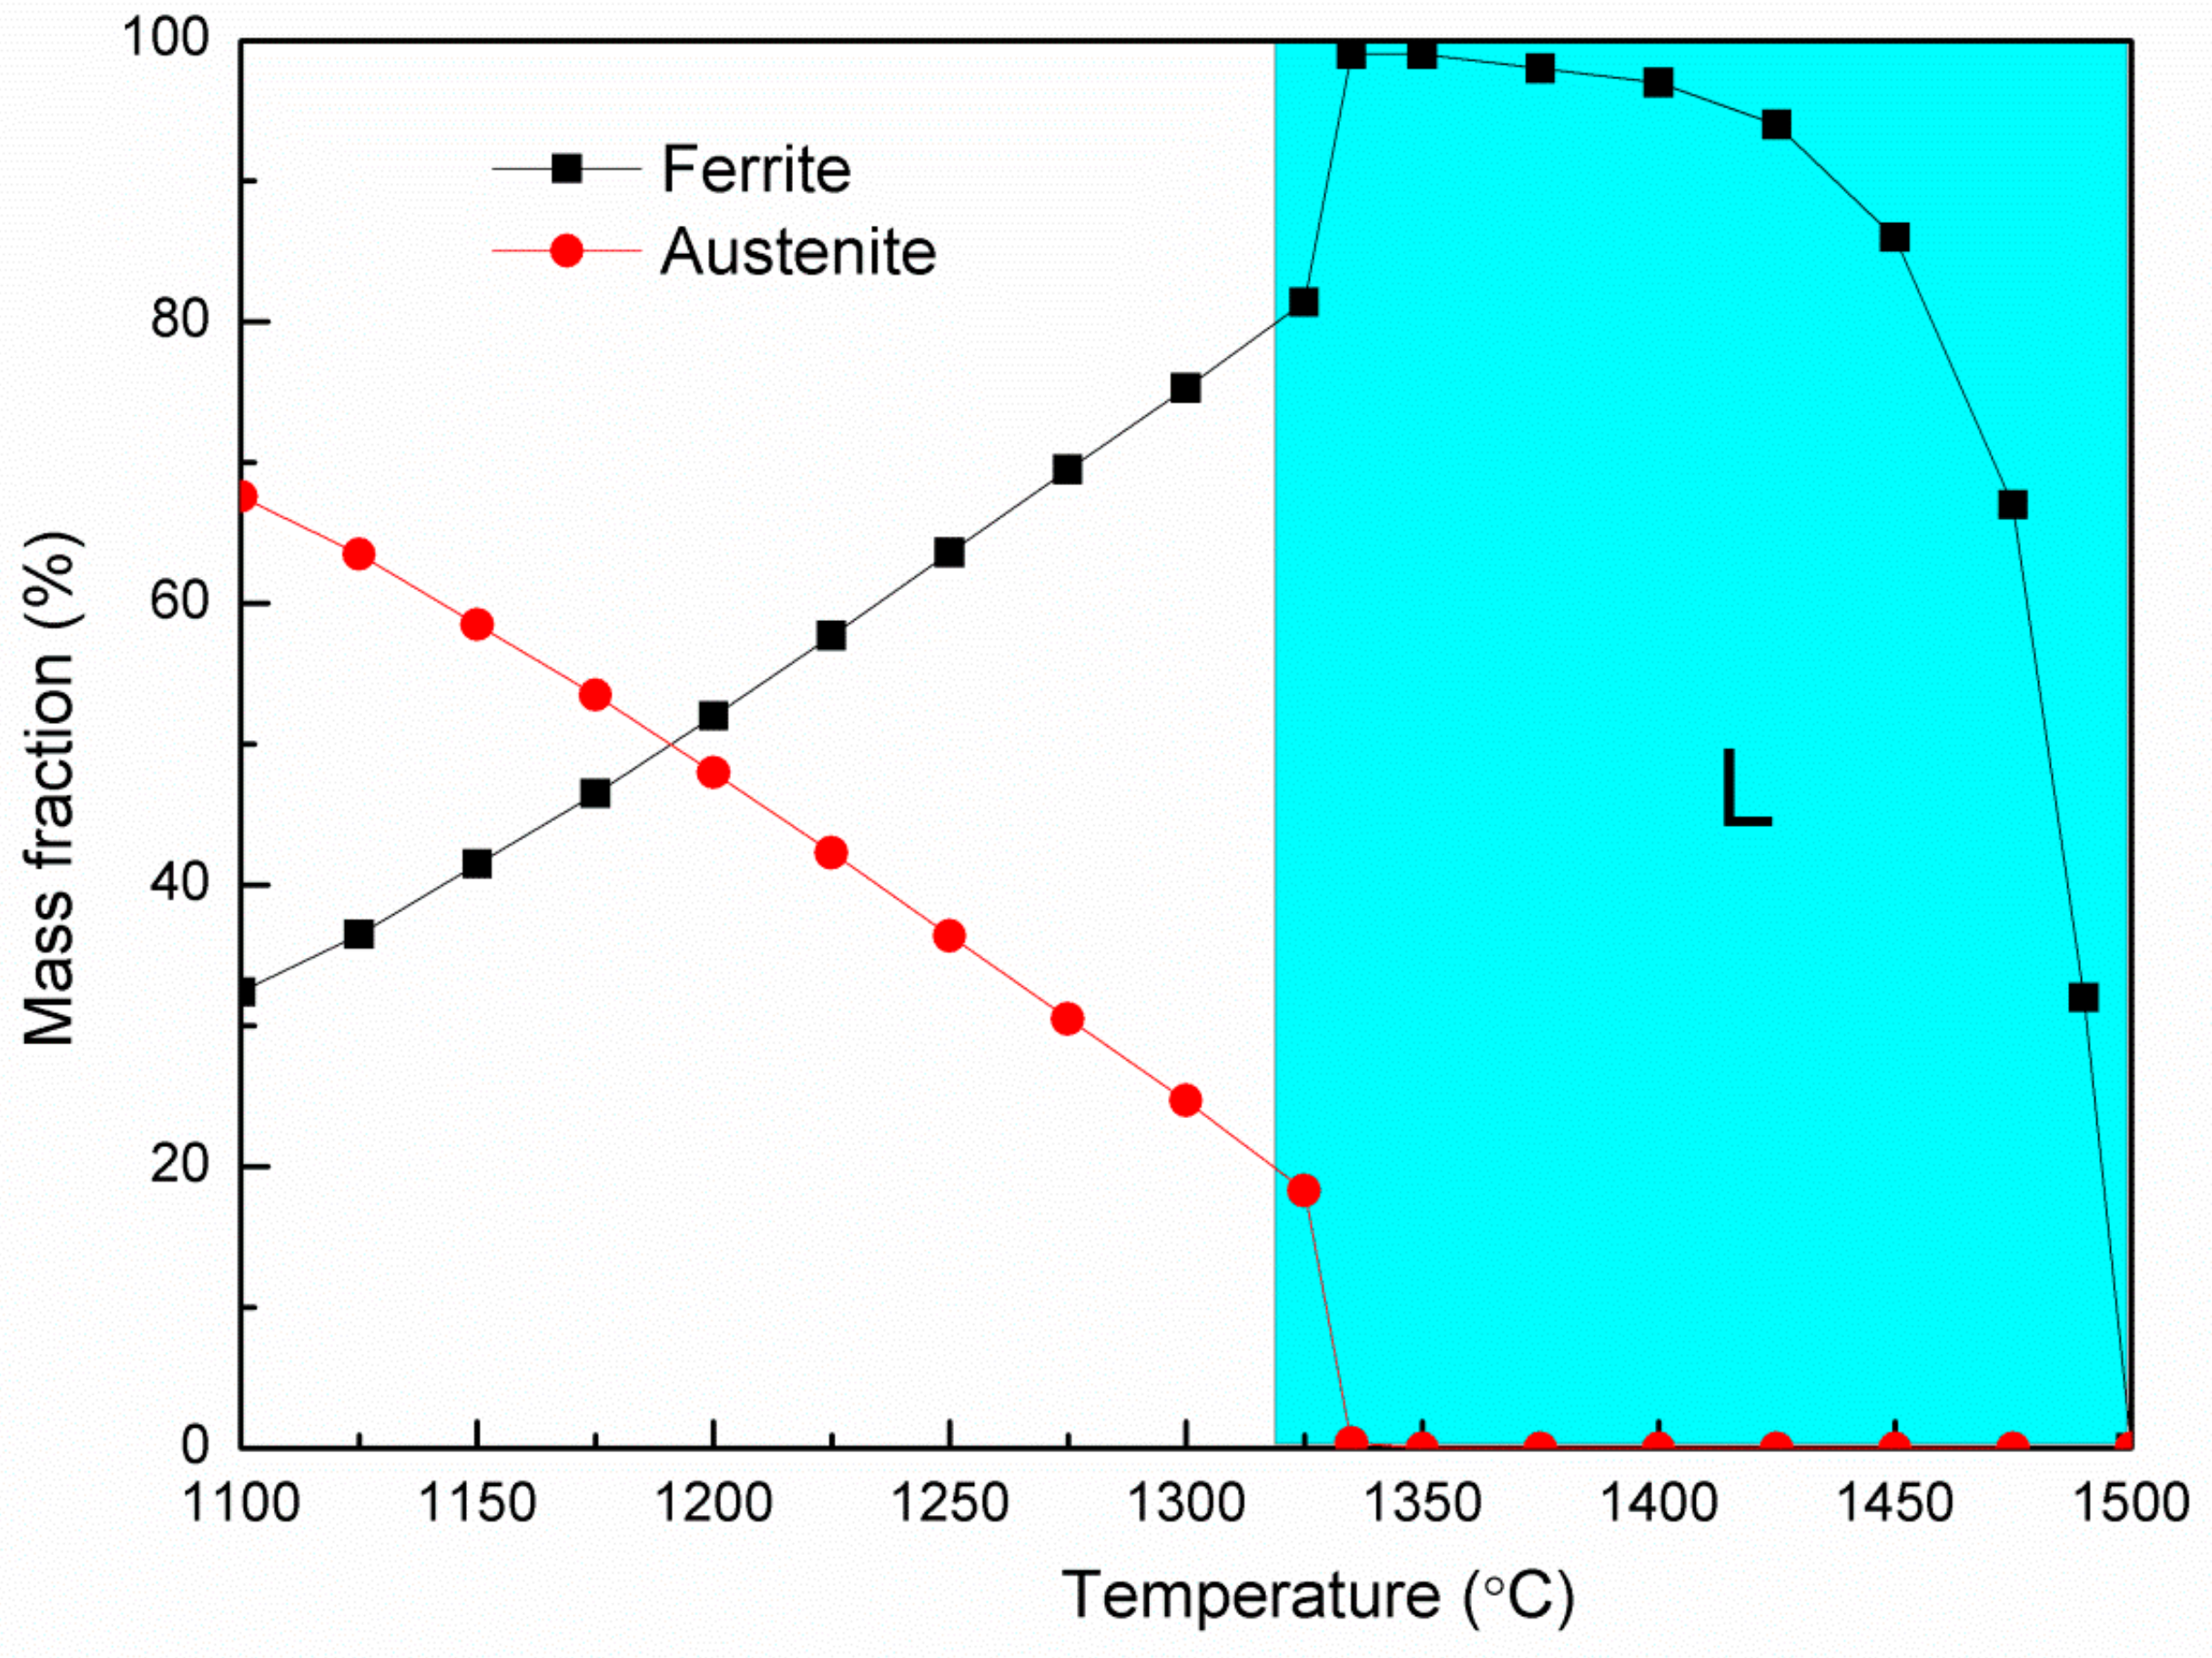
3.2. The Phase Composition of the Steel at Elevated Temperatures

Thermodynamic analysis of the phase composition was carried out to obtain the appropriate temperature range for hot deformation. As shown in Figure 2, the mass fraction of ferrite in 13CrMoNbV steel increased with the rise in temperature by reducing the austenite phase. The equilibrium temperature of the liquid phase appearing is 1317 °C. After the disappearance of the austenite phase, the ferrite mass fraction decreases until the liquidus temperature of 1497 °C. In accordance with the calculations, the temperature of 1275 °C was chosen as a maximum deformation temperature.

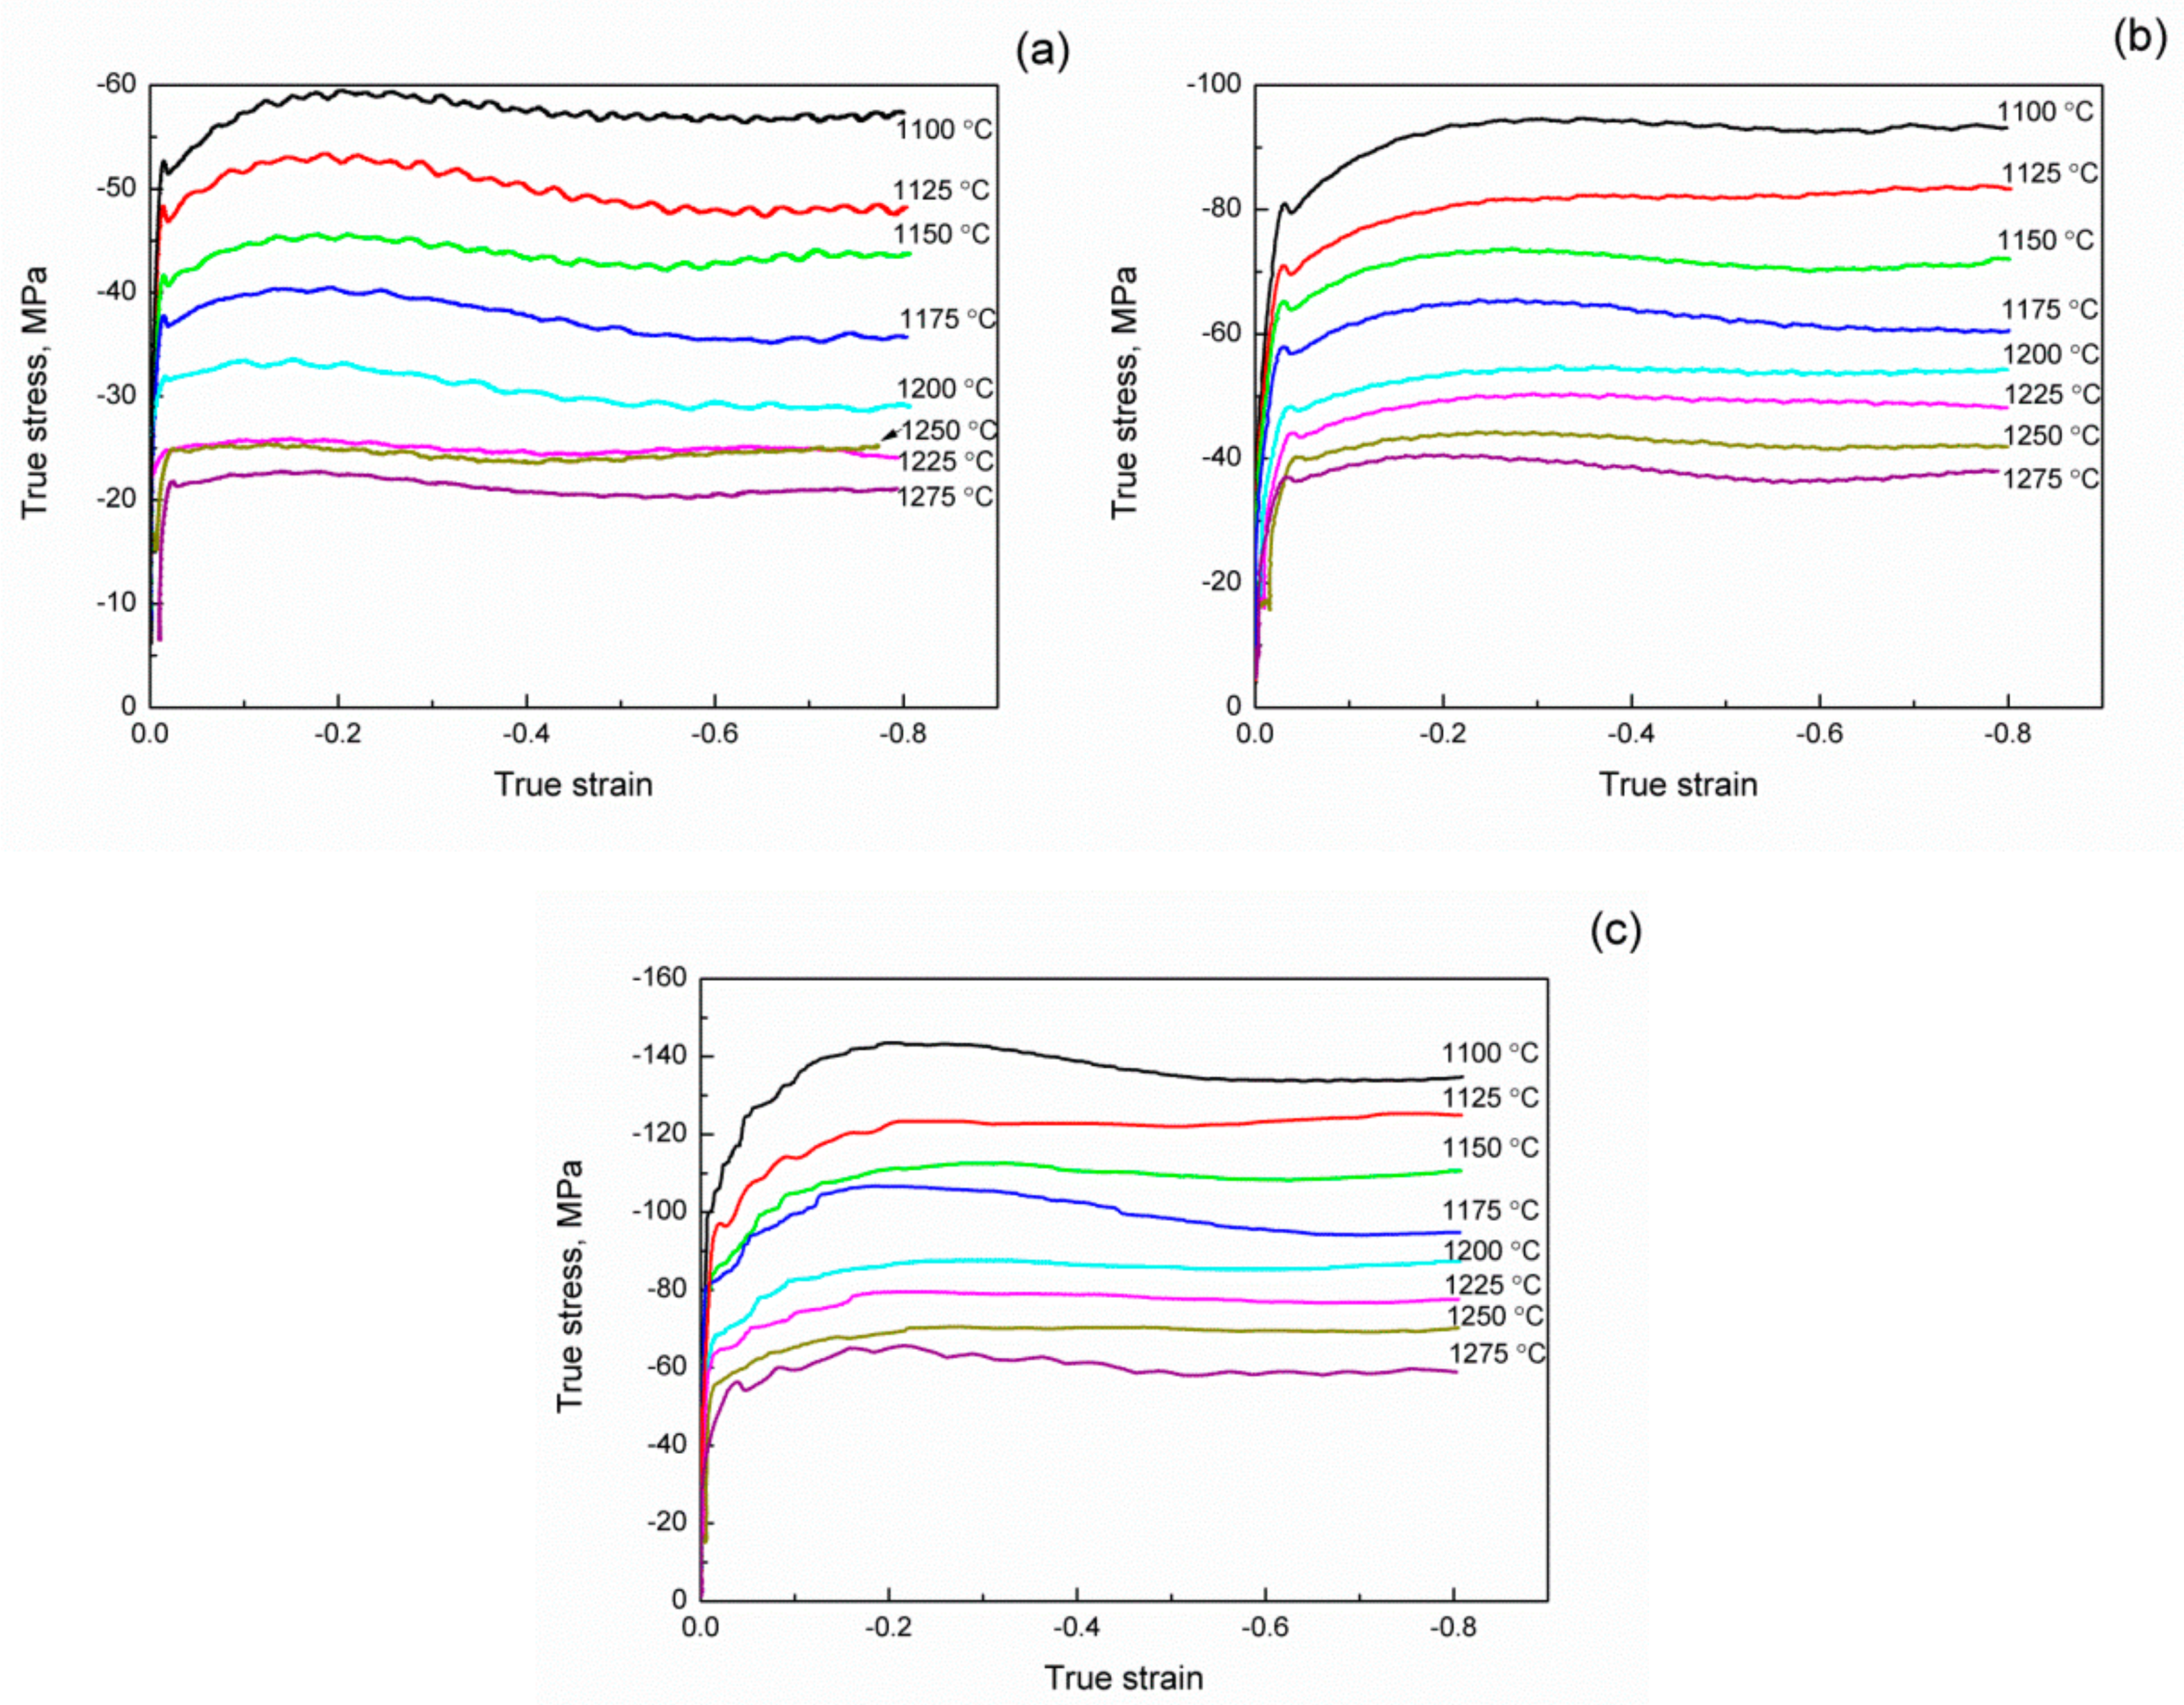
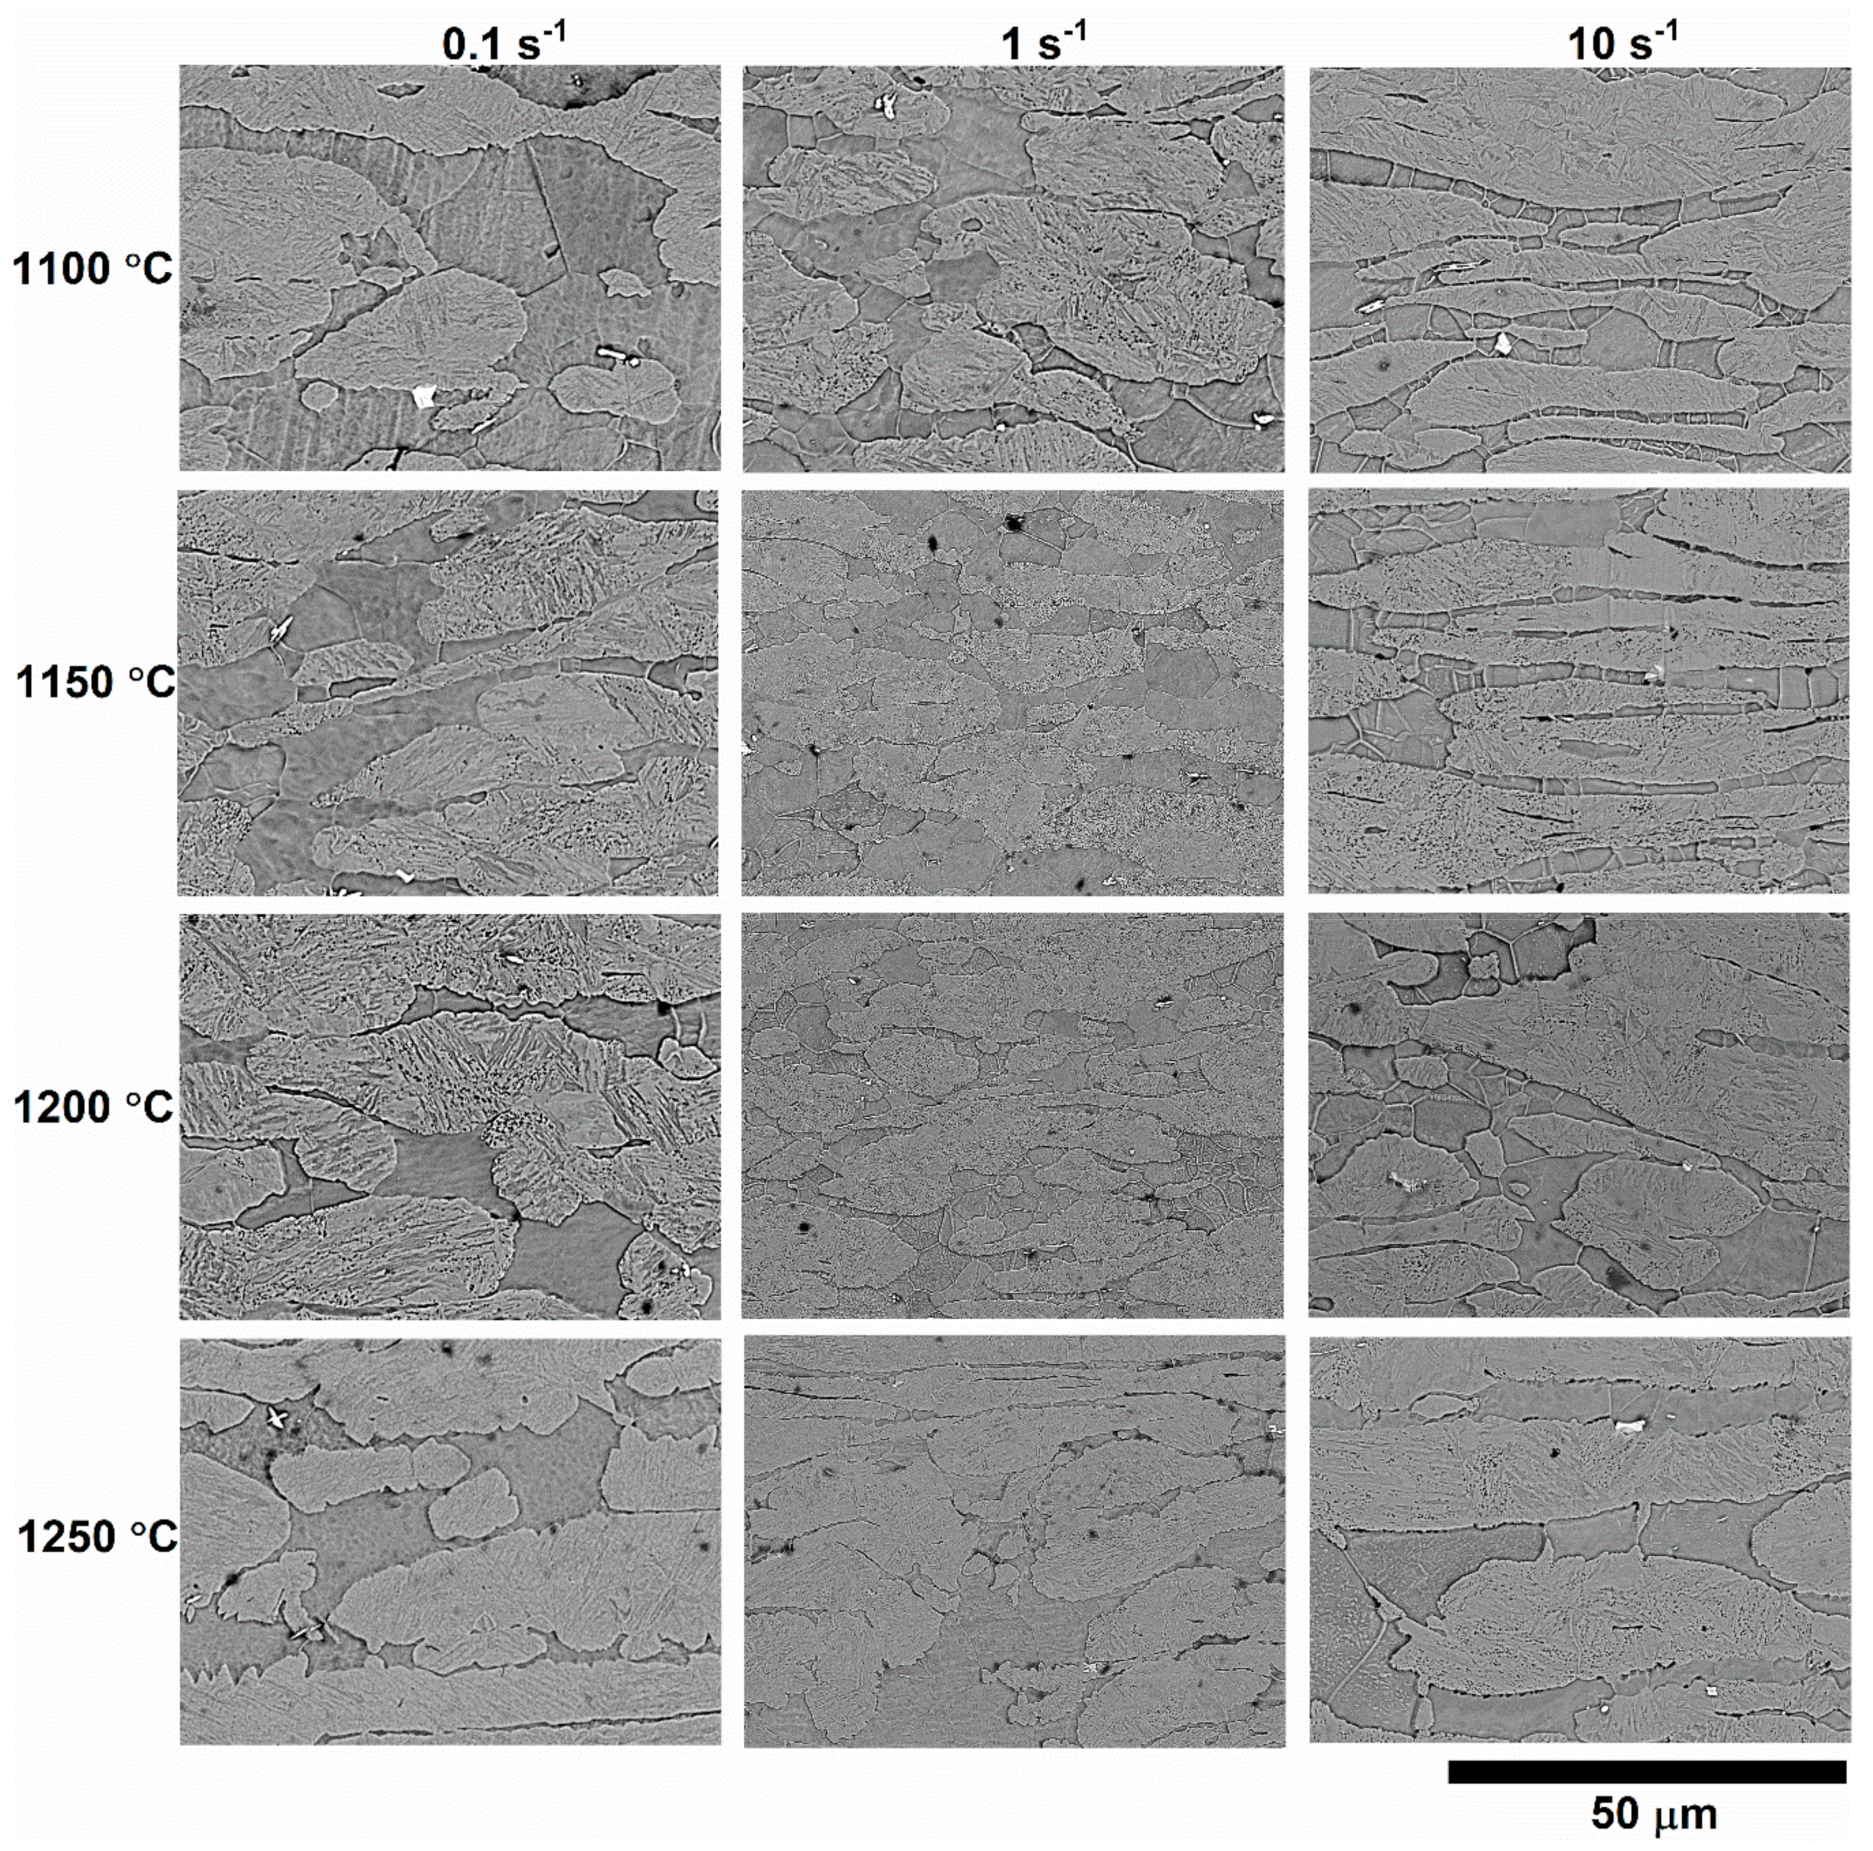
3.3. Hot Deformation Behavior during Compression

In Figure 3, the experimental stress vs. strain compression curves are shown. The flow stress increases with decreasing deformation temperature and rising strain rate. The stress–strain curve’s shape indicates that the process of dynamic recrystallization (DRX) proceeds during deformation at all temperatures and all strain rates. The recrystallization proceeds due to austenite low stack fault energy. The stack fault energy of the ferrite phase is larger than in the austenite phase, and as a result, the dynamic recovery process (DRV) is preferable. The dislocations move intensively, forming the boundaries of cells and subgrains during the DRV.
The microstructure of 13CrMoNbV steel after hot compression at temperatures of 1100, 1150, 1200, and 1250 °C with strain rates of 0.1, 1, and 10 s−1 is shown in Figure 4. As one can see, the deformation at the strain rate of 10 s−1 stretches the equiaxed ferrite grains into fibers. The fibers are divided into separate grains/subgrains, the sizes of which are increased with increases in the deformation temperature. Deformation at a lower strain rate leads to the formation of the equiaxed ferrite and martensite (former austenite) grains/subgrains, the sizes of which are slightly influenced by the deformation temperature.

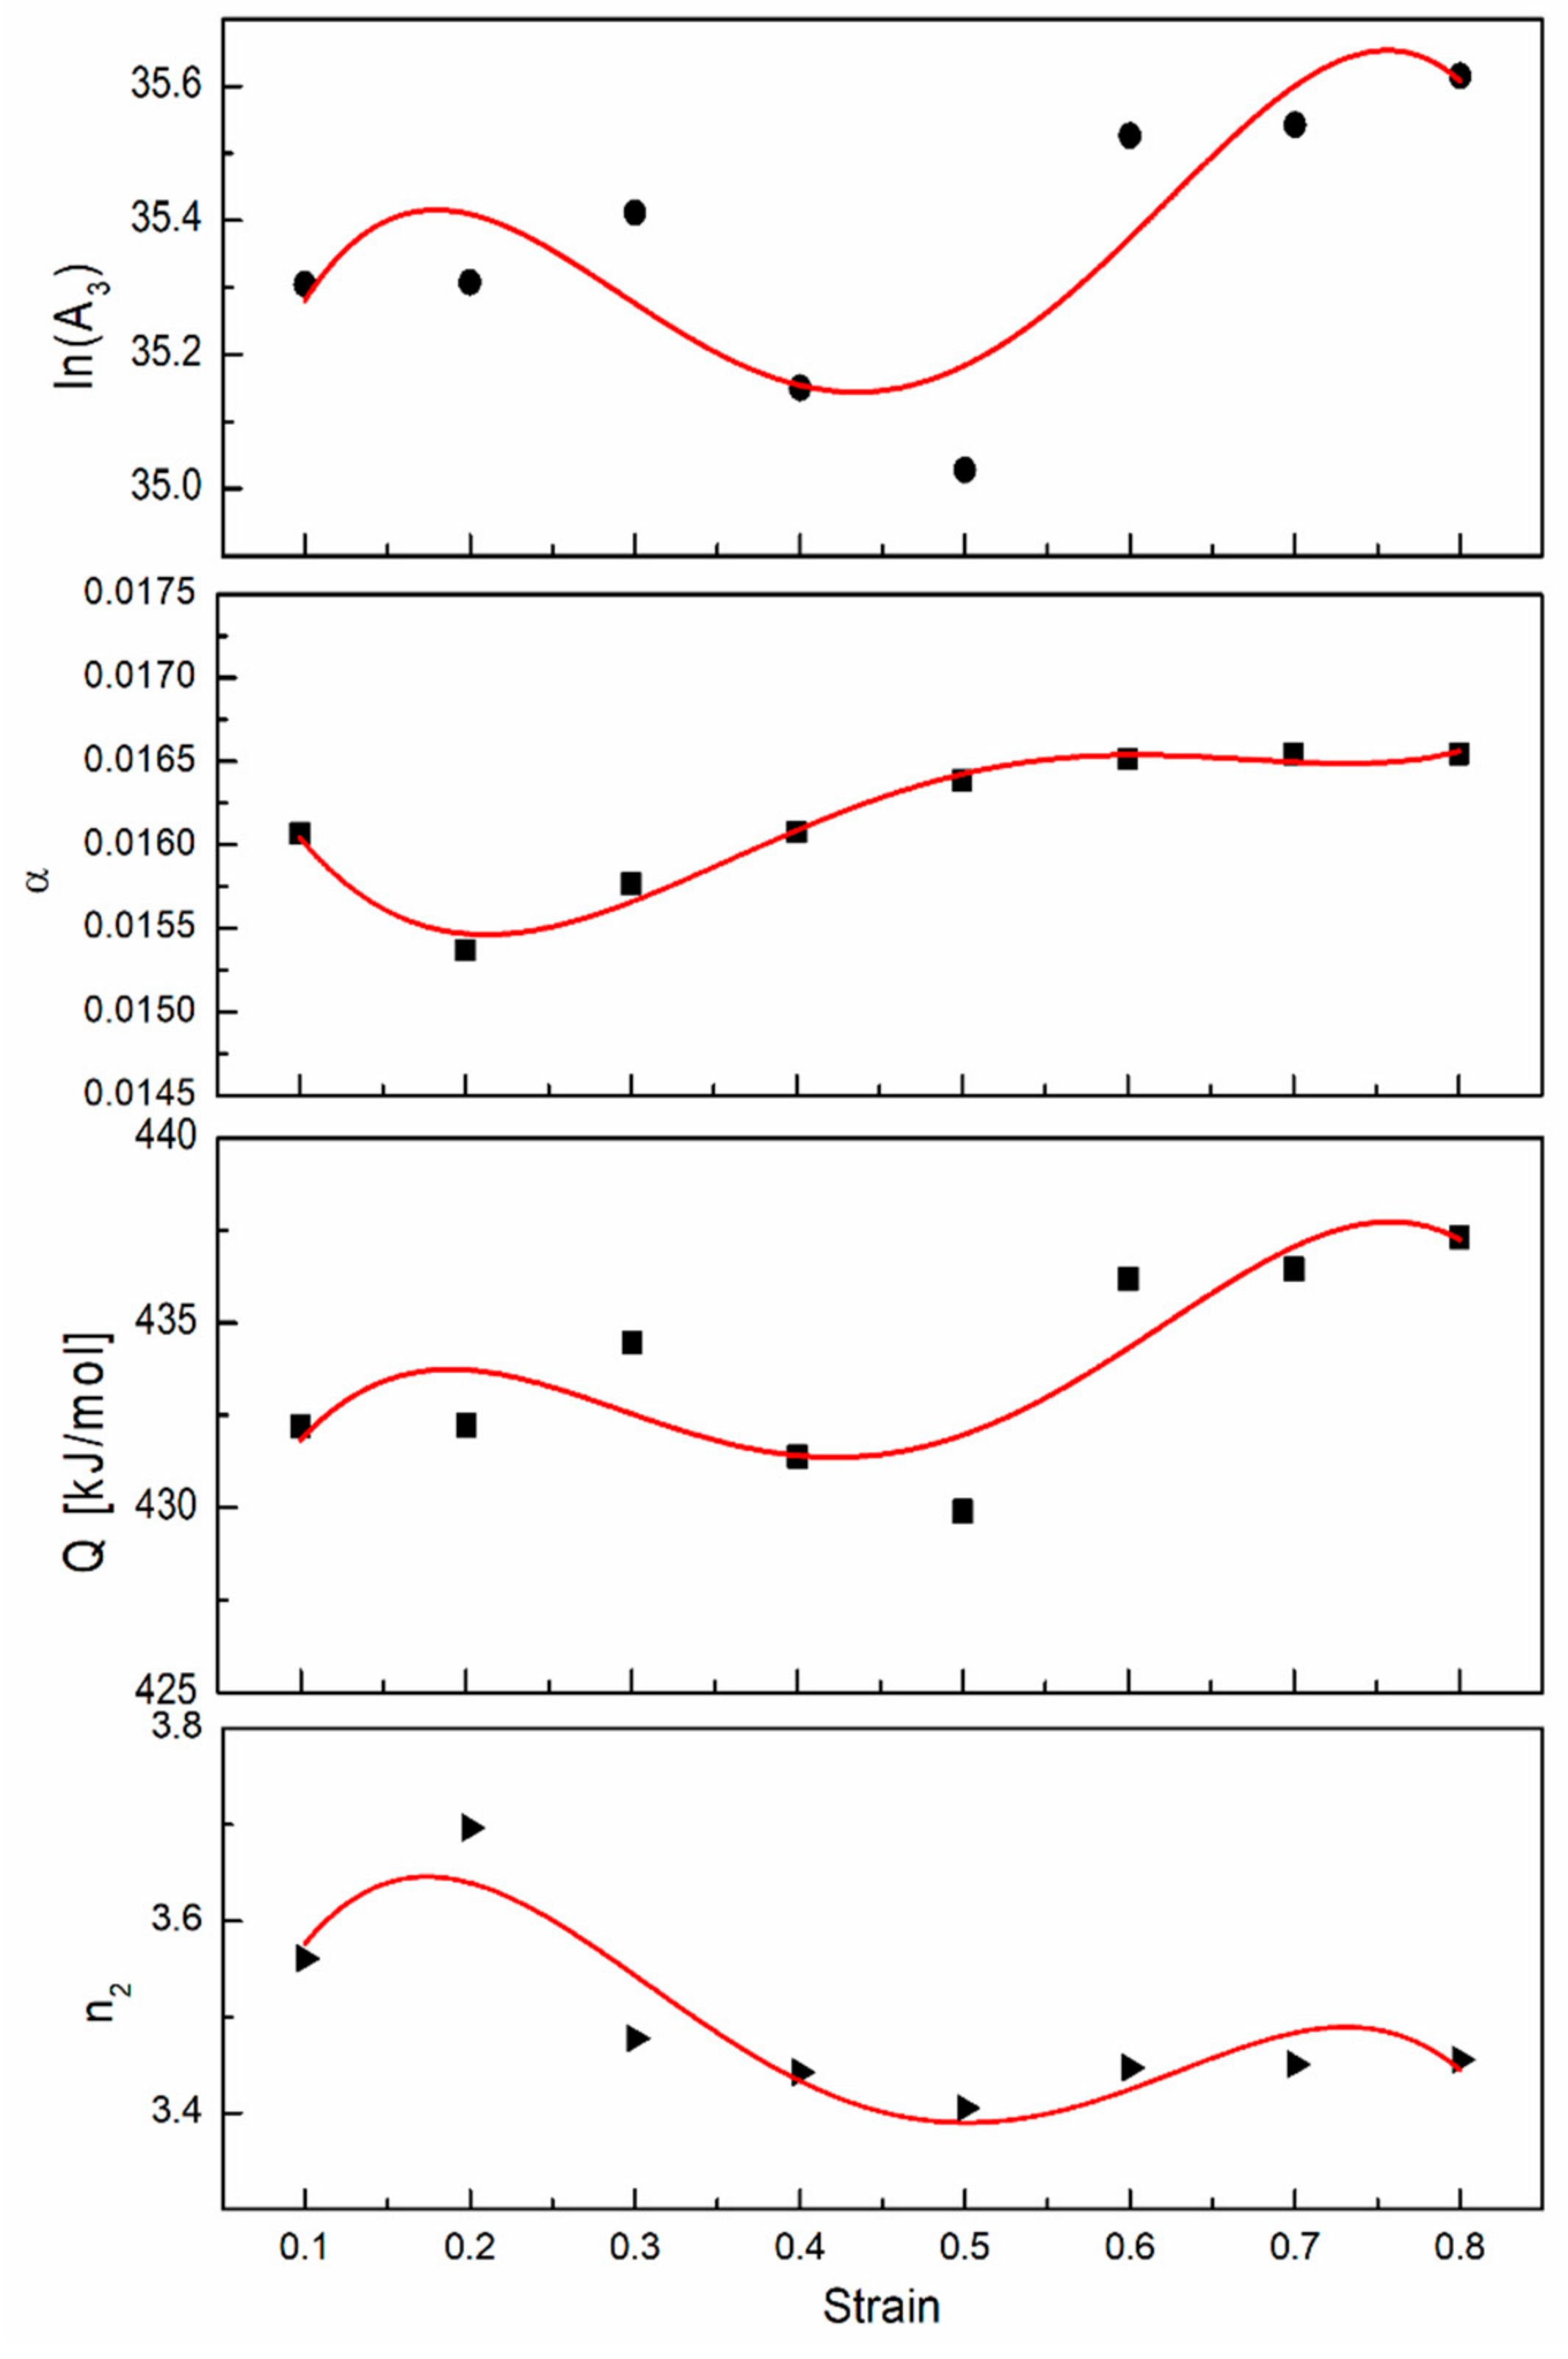
3.4. Constitutive Model of Hot Deformation Behavior

The dependence of stress on hot deformation parameters, such as deformation temperature and strain rate, may be described by the Zener–Hollomon parameter [27]:
Z = ε ˙ e Q R T
where ε ˙ is strain rate (s−1), T is temperature (K), and Q is apparent activation energy (J/mol). The relation between the Zener–Hollomon parameter and the stress is commonly expressed by three types of empirical equations, such as power law, the exponential, and the hyperbolic sine dependences.
Z = A 1 σ n 1
Z = A 2 e β σ
Z = A 3 sinh α σ n 2
where A1, A2, A3, n1, n2, β, and α are constants of the material.
Equation (4) is a universal function for a wide range of stresses. Nevertheless, the determination of the value adjustable constant α is needed to find the constants of Equations (2) and (3):
α β n 1
The values of A1, A2, A3, n1, n2, β, α, and Q constants at different strain values were calculated using the multiple linear regression of Equations (2)–(4) in linearized form. As one can see in Figure 5, the values of A3, n2, α, and Q3 constants are significantly dependent on true strain due to changes in the microstructure during deformation. To include the strain ( ε ) influence too, the constitutive Equation (3) was modified by using fourth-degree polynomial dependence of the material constants [28,29]:
ln ( A 3 ) = 34.48 + 12.98 ε 59.7 ε 2 + 100.6 ε 3   55.1 ε 4  
α = 0.0188 0.0307 ε + 0.12 ε 2 0.17 ε 3 + 0.08 ε 4
Q 3 = 422.18 + 154.57 ε 690.3 ε 2 + 1156.9 ε 3 632.7 ε 4
n 2 = 3.14 + 7.11 ε 32.4 ϵ 2 + 52.3 ε 3 27.9 ε 4
As one can see in Figure 6a, the average difference between calculated and experimental flow stress values is 3.3%. In addition, the accuracy of the constitutive model was checked by the modeling of the samples’ compression at a strain rate of 1 s−1 using the FEM method. The comparison between measured and simulated force vs. displacement dependences for 1100 and 1200 °C temperatures (Figure 6b) shows the satisfactory predictability of the model.

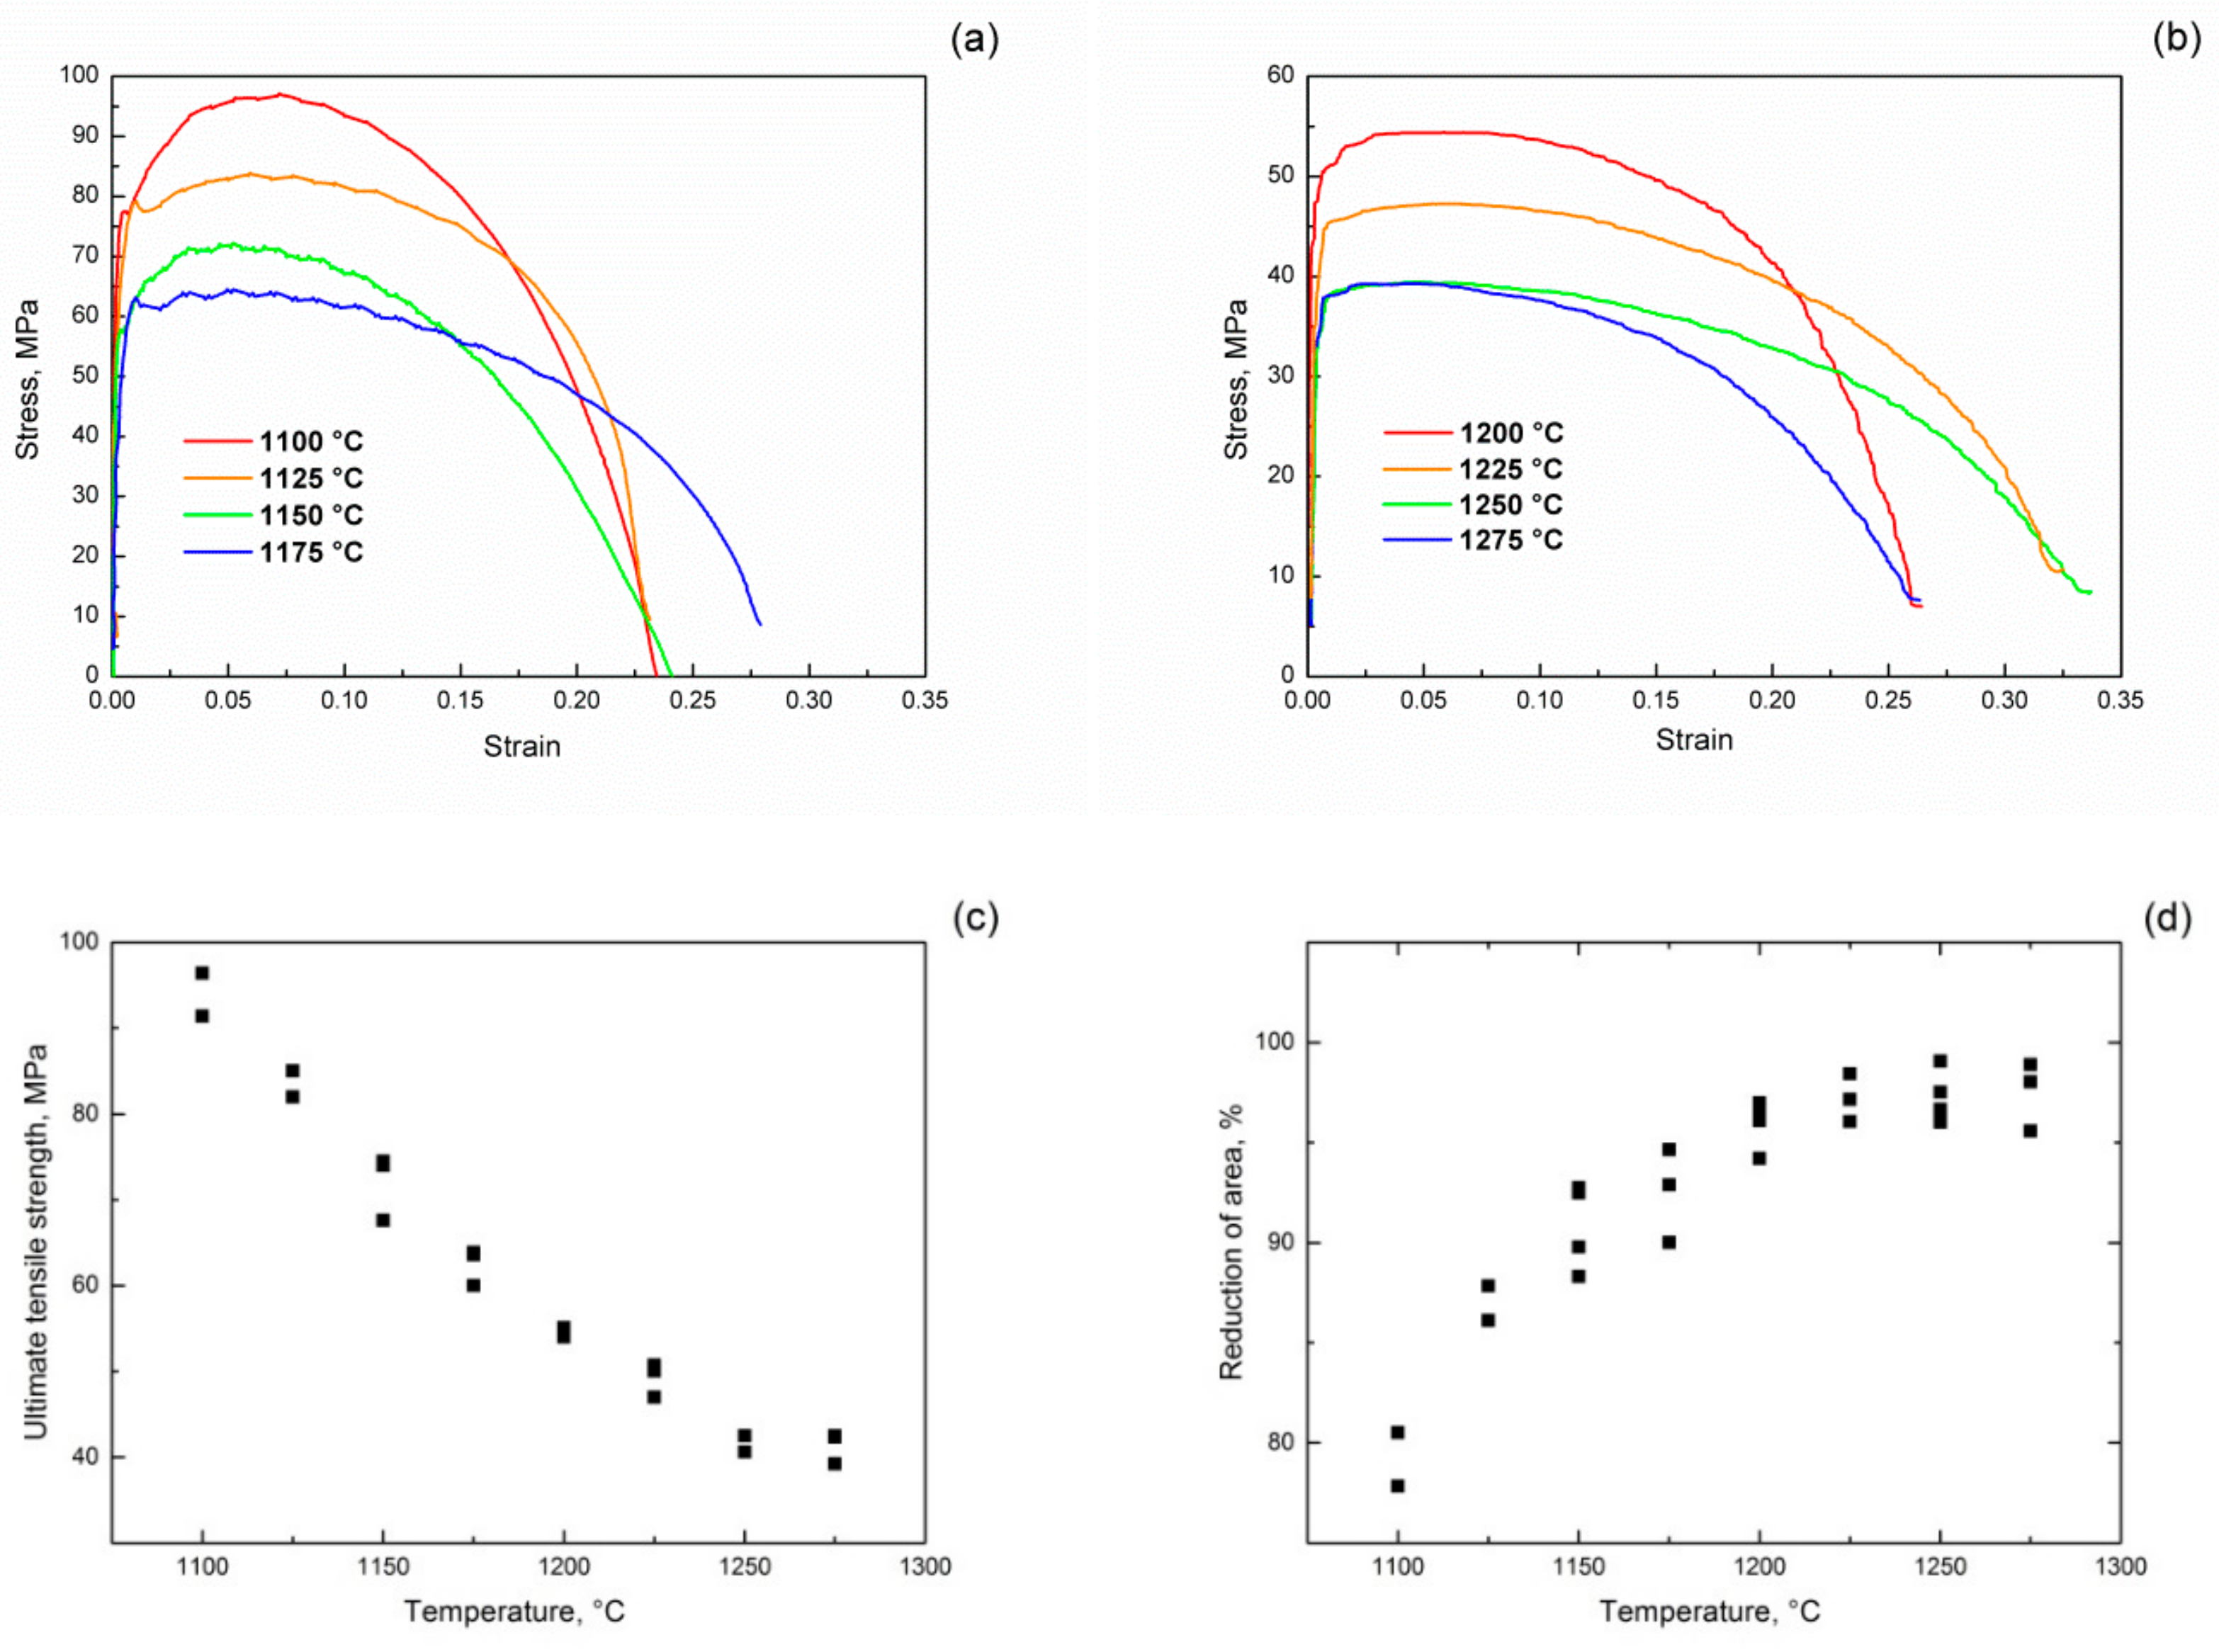
3.5. Hot Deformation Behavior during Tensile Tests

The typical tensile engineering stress–strain curves are shown in Figure 7a,b. As can be seen, the increase in the tensile temperature decreased the engineering stress, which is like the hot compression behavior of the steel. The dependence of the maximum engineering stress (ultimate tensile strength–UTS) on the temperature is shown in Figure 7c. As can be seen, the UTS values increase with decreasing temperature. The 13CrMoNbV steel shows high values of plasticity at all investigated temperatures in the range of 1100–1275 °C despite its two-phase ferritic/austenitic microstructure (Figure 7d).
The high strain in the localized strain discontinuity cannot be compensated for by recovery processes, which led to the appearance of microvoids. The micropores nucleate basically at second phase particles, interphase, and grain boundaries. As the strain in the material increases, the microvoids grow, coalesce, and lead to the separation of the two samples’ parts when the size of the micropores achieves critical value, forming a continuous fracture surface. The microstructure of the fracture surface is shown in Figure 8 and consists of traces of intensive deformation before failure, such as microvoids, dimples, and sharp crests. The fracture surface becomes more heterogeneous with a temperature increase from 1100 to 1200 °C. The dimples’ size increases with increasing deformation temperature due to a more intensive plastic deformation and as a result of the coalescence of microvoids during a longer deformation process at high deformation temperatures.

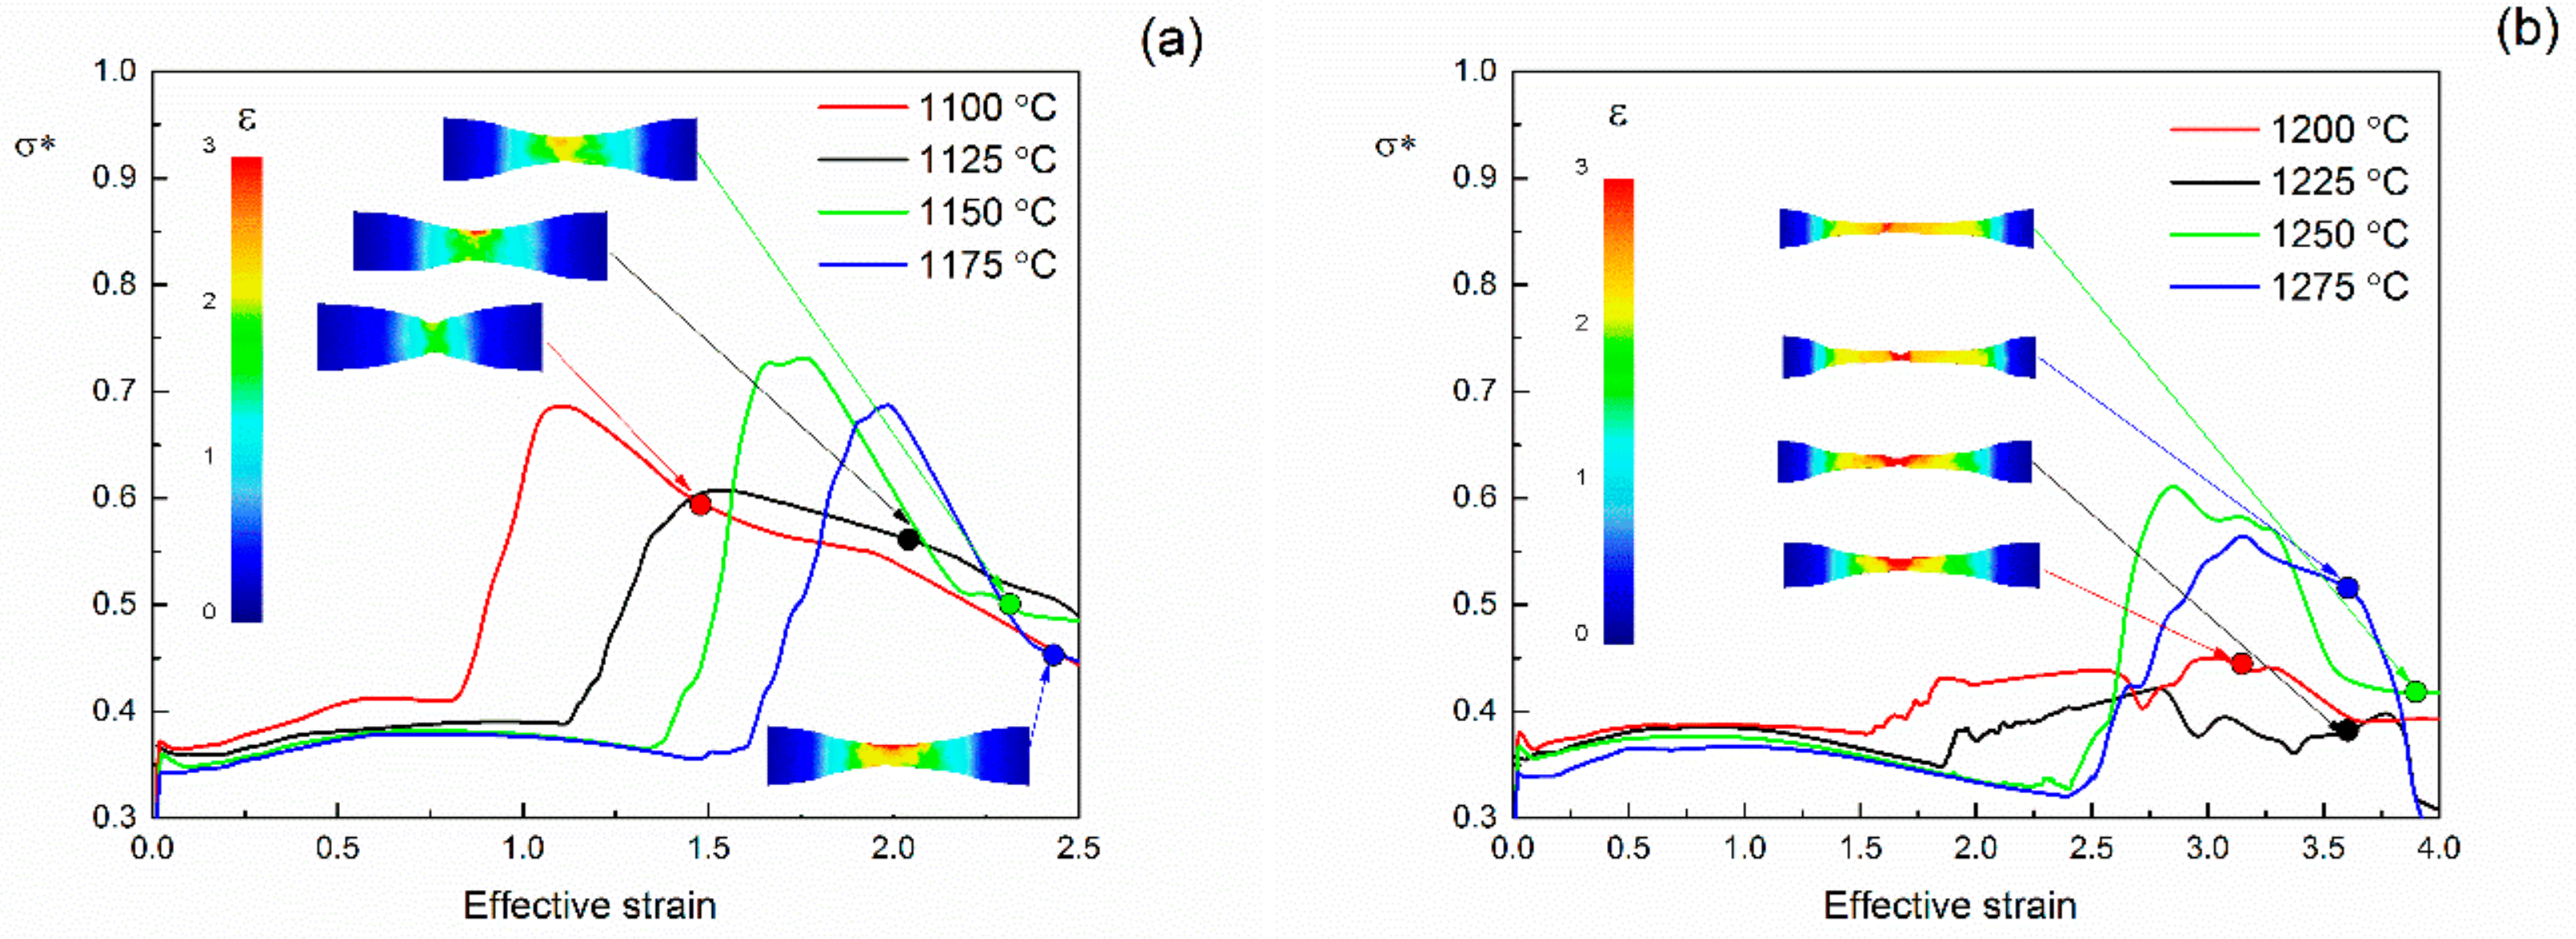
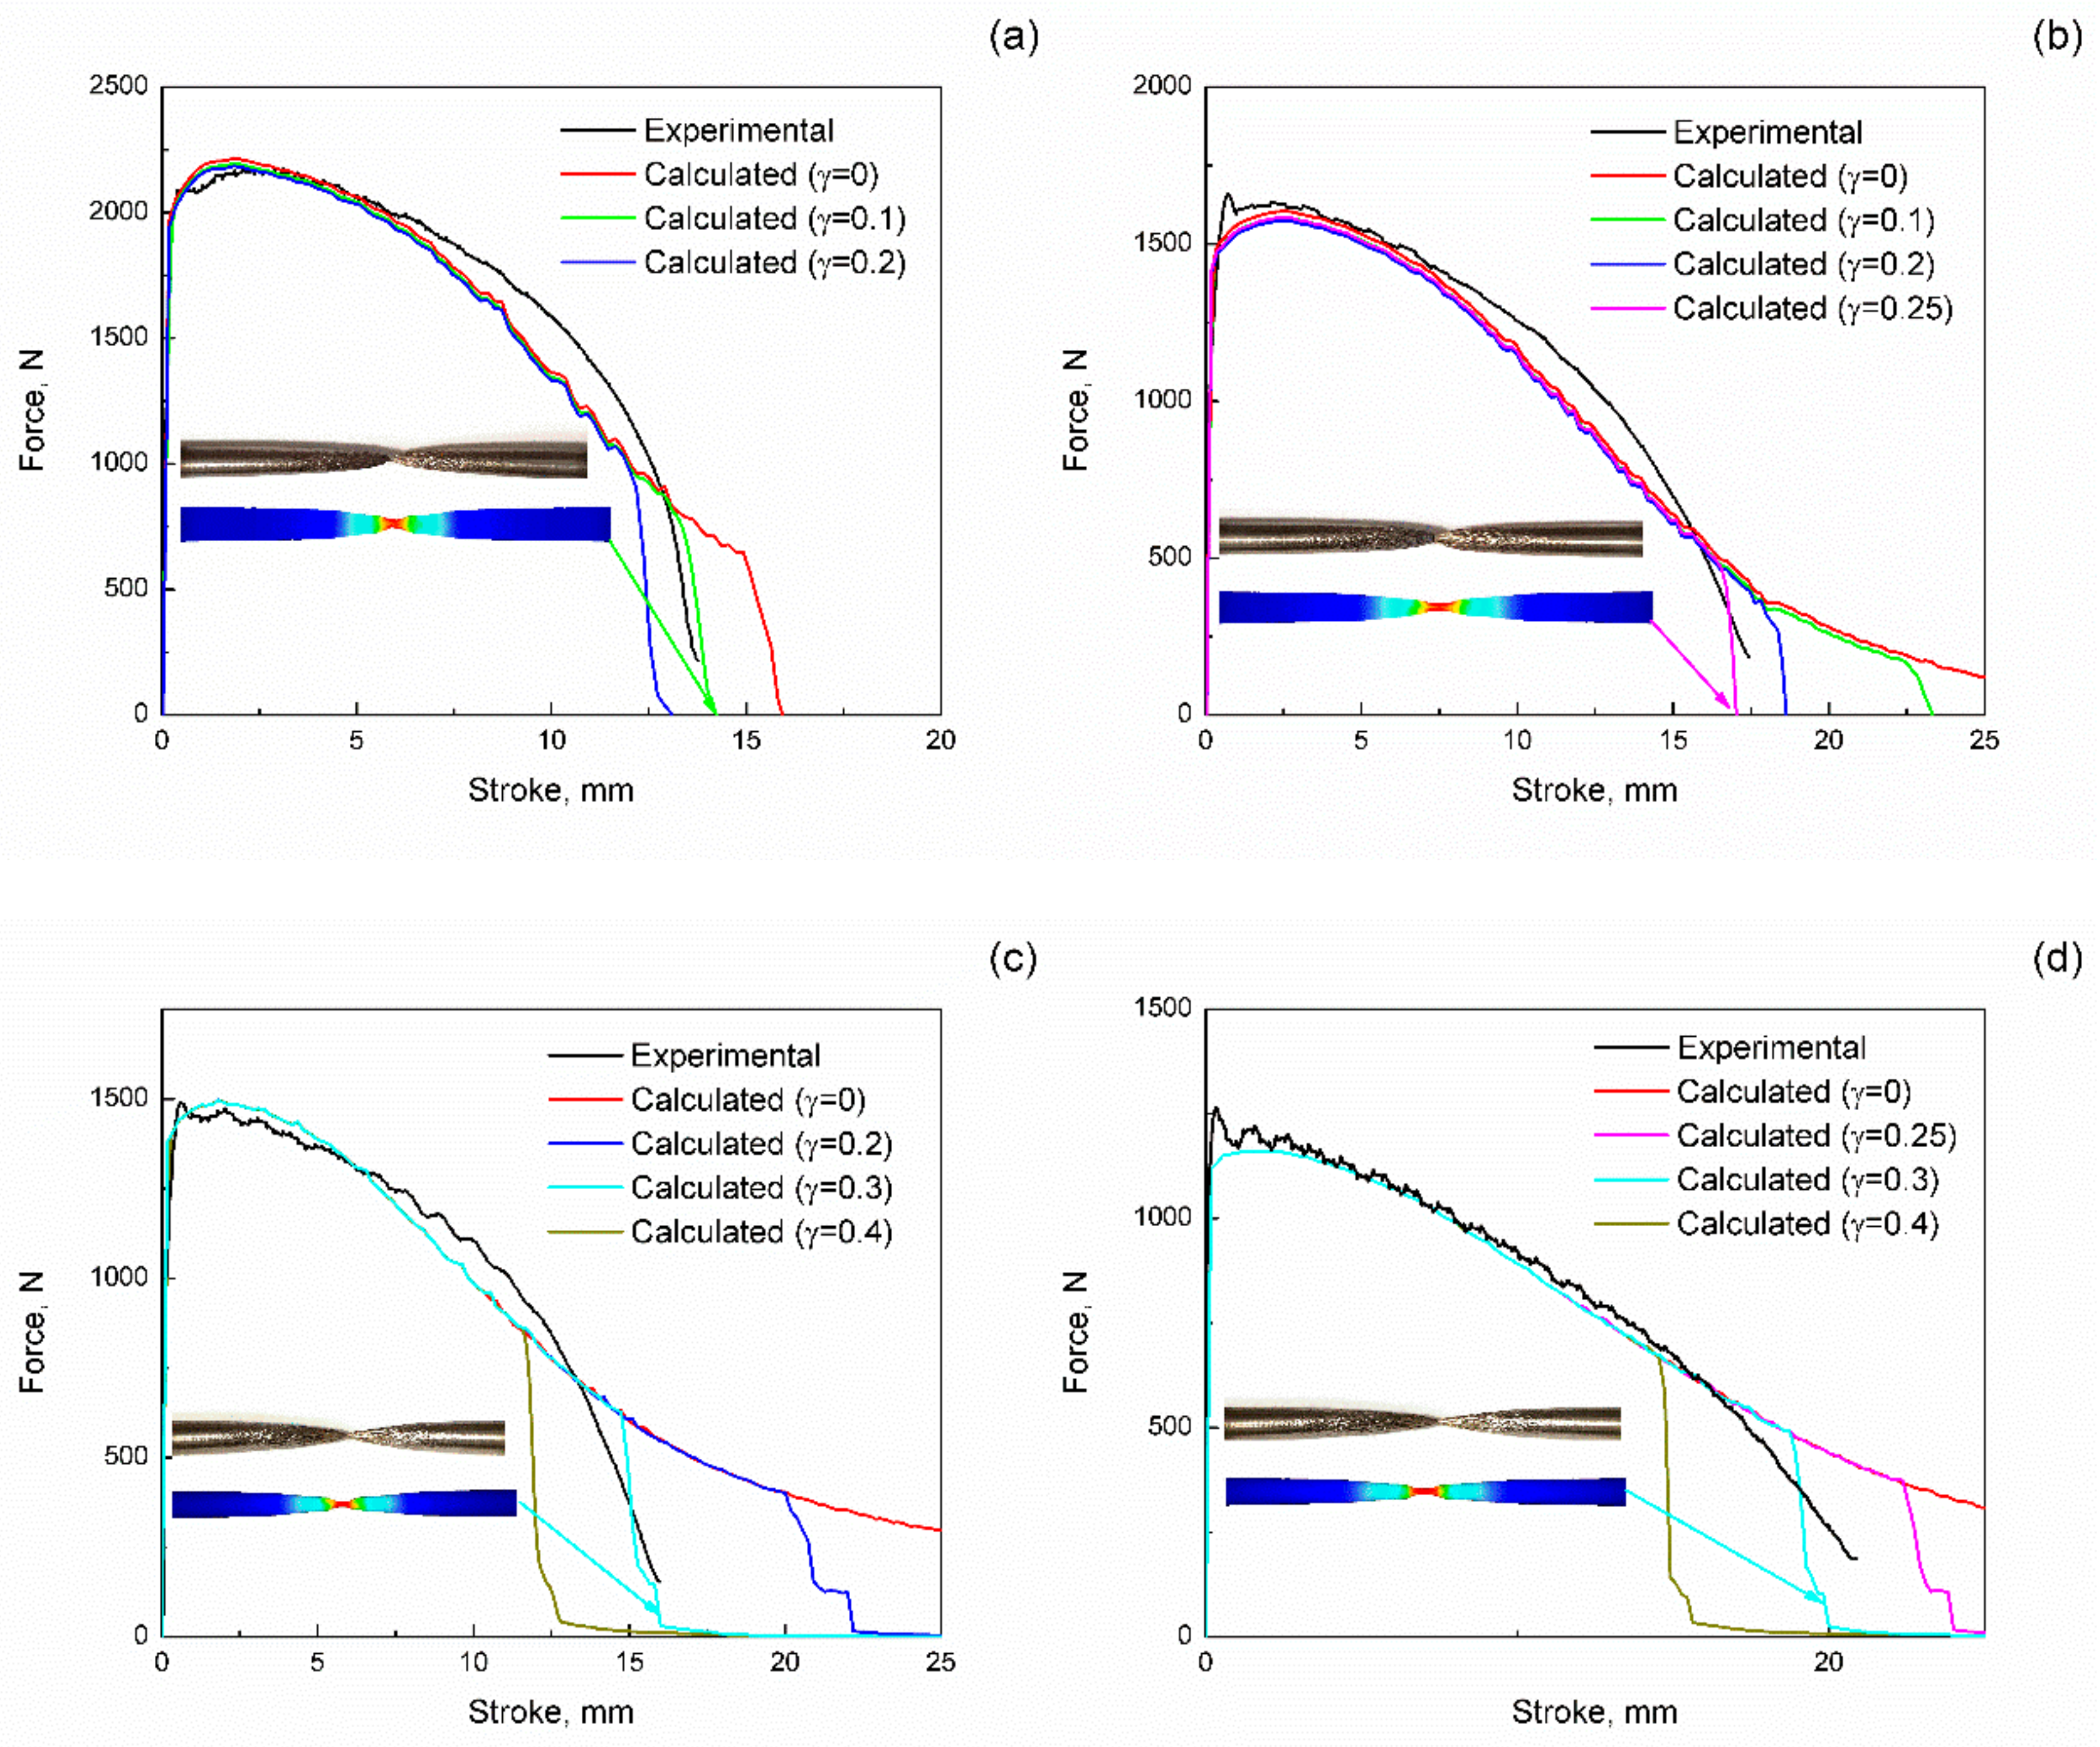
3.6. Simulation of the Hot Fracture

Stress triaxiality criteria σ * was used to analyze the fracture behavior of 13CrMoNbV steel during tensile tests. Stress triaxiality may be determined as a ratio of hydrostatic pressure ( σ m ) to the von Mises equivalent stress σ - :
σ * = σ m σ ¯ = 1 / 3 σ 1 + σ 2 + σ 3 σ 1 σ 2 2 + σ 2 σ 3 2 + σ 3 σ 1 2 2
where σ 1 , σ 2 , σ 3 are the principal stresses.
For the description of the steel fracture behavior, the Rice and Tracy ductile fracture criteria K [3] was modified by the addition of a parameter that depended on accumulated strain:
K * = 0 ε ¯ f e σ * e γ ε ¯   d ε ¯
where γ is a constant, ε ¯ is the equivalent strain, and ε ¯ f is the critical strain, which can be determined by the reduction of area value of the samples after fracture:
ε ¯ f = ln S 0 S F
where S0 and SF are the cross-section areas at the beginning of a tensile test and after failure, respectively.
The tensile tests with zero fracture criteria value were calculated using the finite element approach for the determination of the dependence of stress triaxiality on equivalent strain (Figure 9). The integration of obtained dependences using Equation (11) with different values of the γ coefficient give the critical values of the fracture criteria K * . To determine the correct values of the γ coefficient, it is necessary to compare the experimental force vs. displacement curves calculated using the FE approach curves obtained at different γ and K * . The comparison of the predicted and experimental curves is shown in Figure 10. As can be seen, the optimum value of the γ coefficient is changed from 0.1 at the temperature of 1100 °C to 0.3 at temperatures of 1200 and 1250 °C. The increase in the γ coefficient with the increase in temperature shows that recovery of the accumulated strain at a high temperature significantly prolongs deformation before fracture, even during extremely localized deformation. Optimized values of the fracture model coefficients γ and K * are depicted in Table 3. The critical value of the ductile fracture criteria K * is increased with temperature increase from 1.58 at 1100 °C to 2.20 at 1250 °C, which correlates with the tensile samples’ reduction of area until fracture.
The minor discrepancy between the predicted and experimental tensile curves can be seen in Figure 10, even for the optimized values of γ and K * coefficients. It may be described by obtaining strain values up to 4.0 (Figure 9) during tensile tests due to deformation localization, while the constitutive model for the description of the steel deformation behavior was constructed for strain values up to 0.8 (Figure 5). The slight difference between experimental stress values and those calculated using Equations (1) and (4) and (6)–(9) may be present despite steady-state deformation mode after strain of 0.6.
The good agreement of the constructed deformation and fracture models with experimental data grants perspective on the simulation and optimization of the industrial deformation processes for 13CrMoNbV steel.

4. Conclusions

  • The compression true stress and ultimate tensile strength of reduced activation ferritic/martensitic 13CrMoNbV steel decrease with the increase in the deformation temperature.
  • The strain-compensated Arrhenius-type model of 13CrMoNbV ferritic/martensitic steel’s hot deformation behavior was built using the Zener–Hollomon parameter. The model was checked by finite element modeling of the compression tests and gave good accordance between the predicted and experimental values of flow stress during hot compression at temperatures of 1100–1275 °C and at strain rates of 0.1–10 s−1.
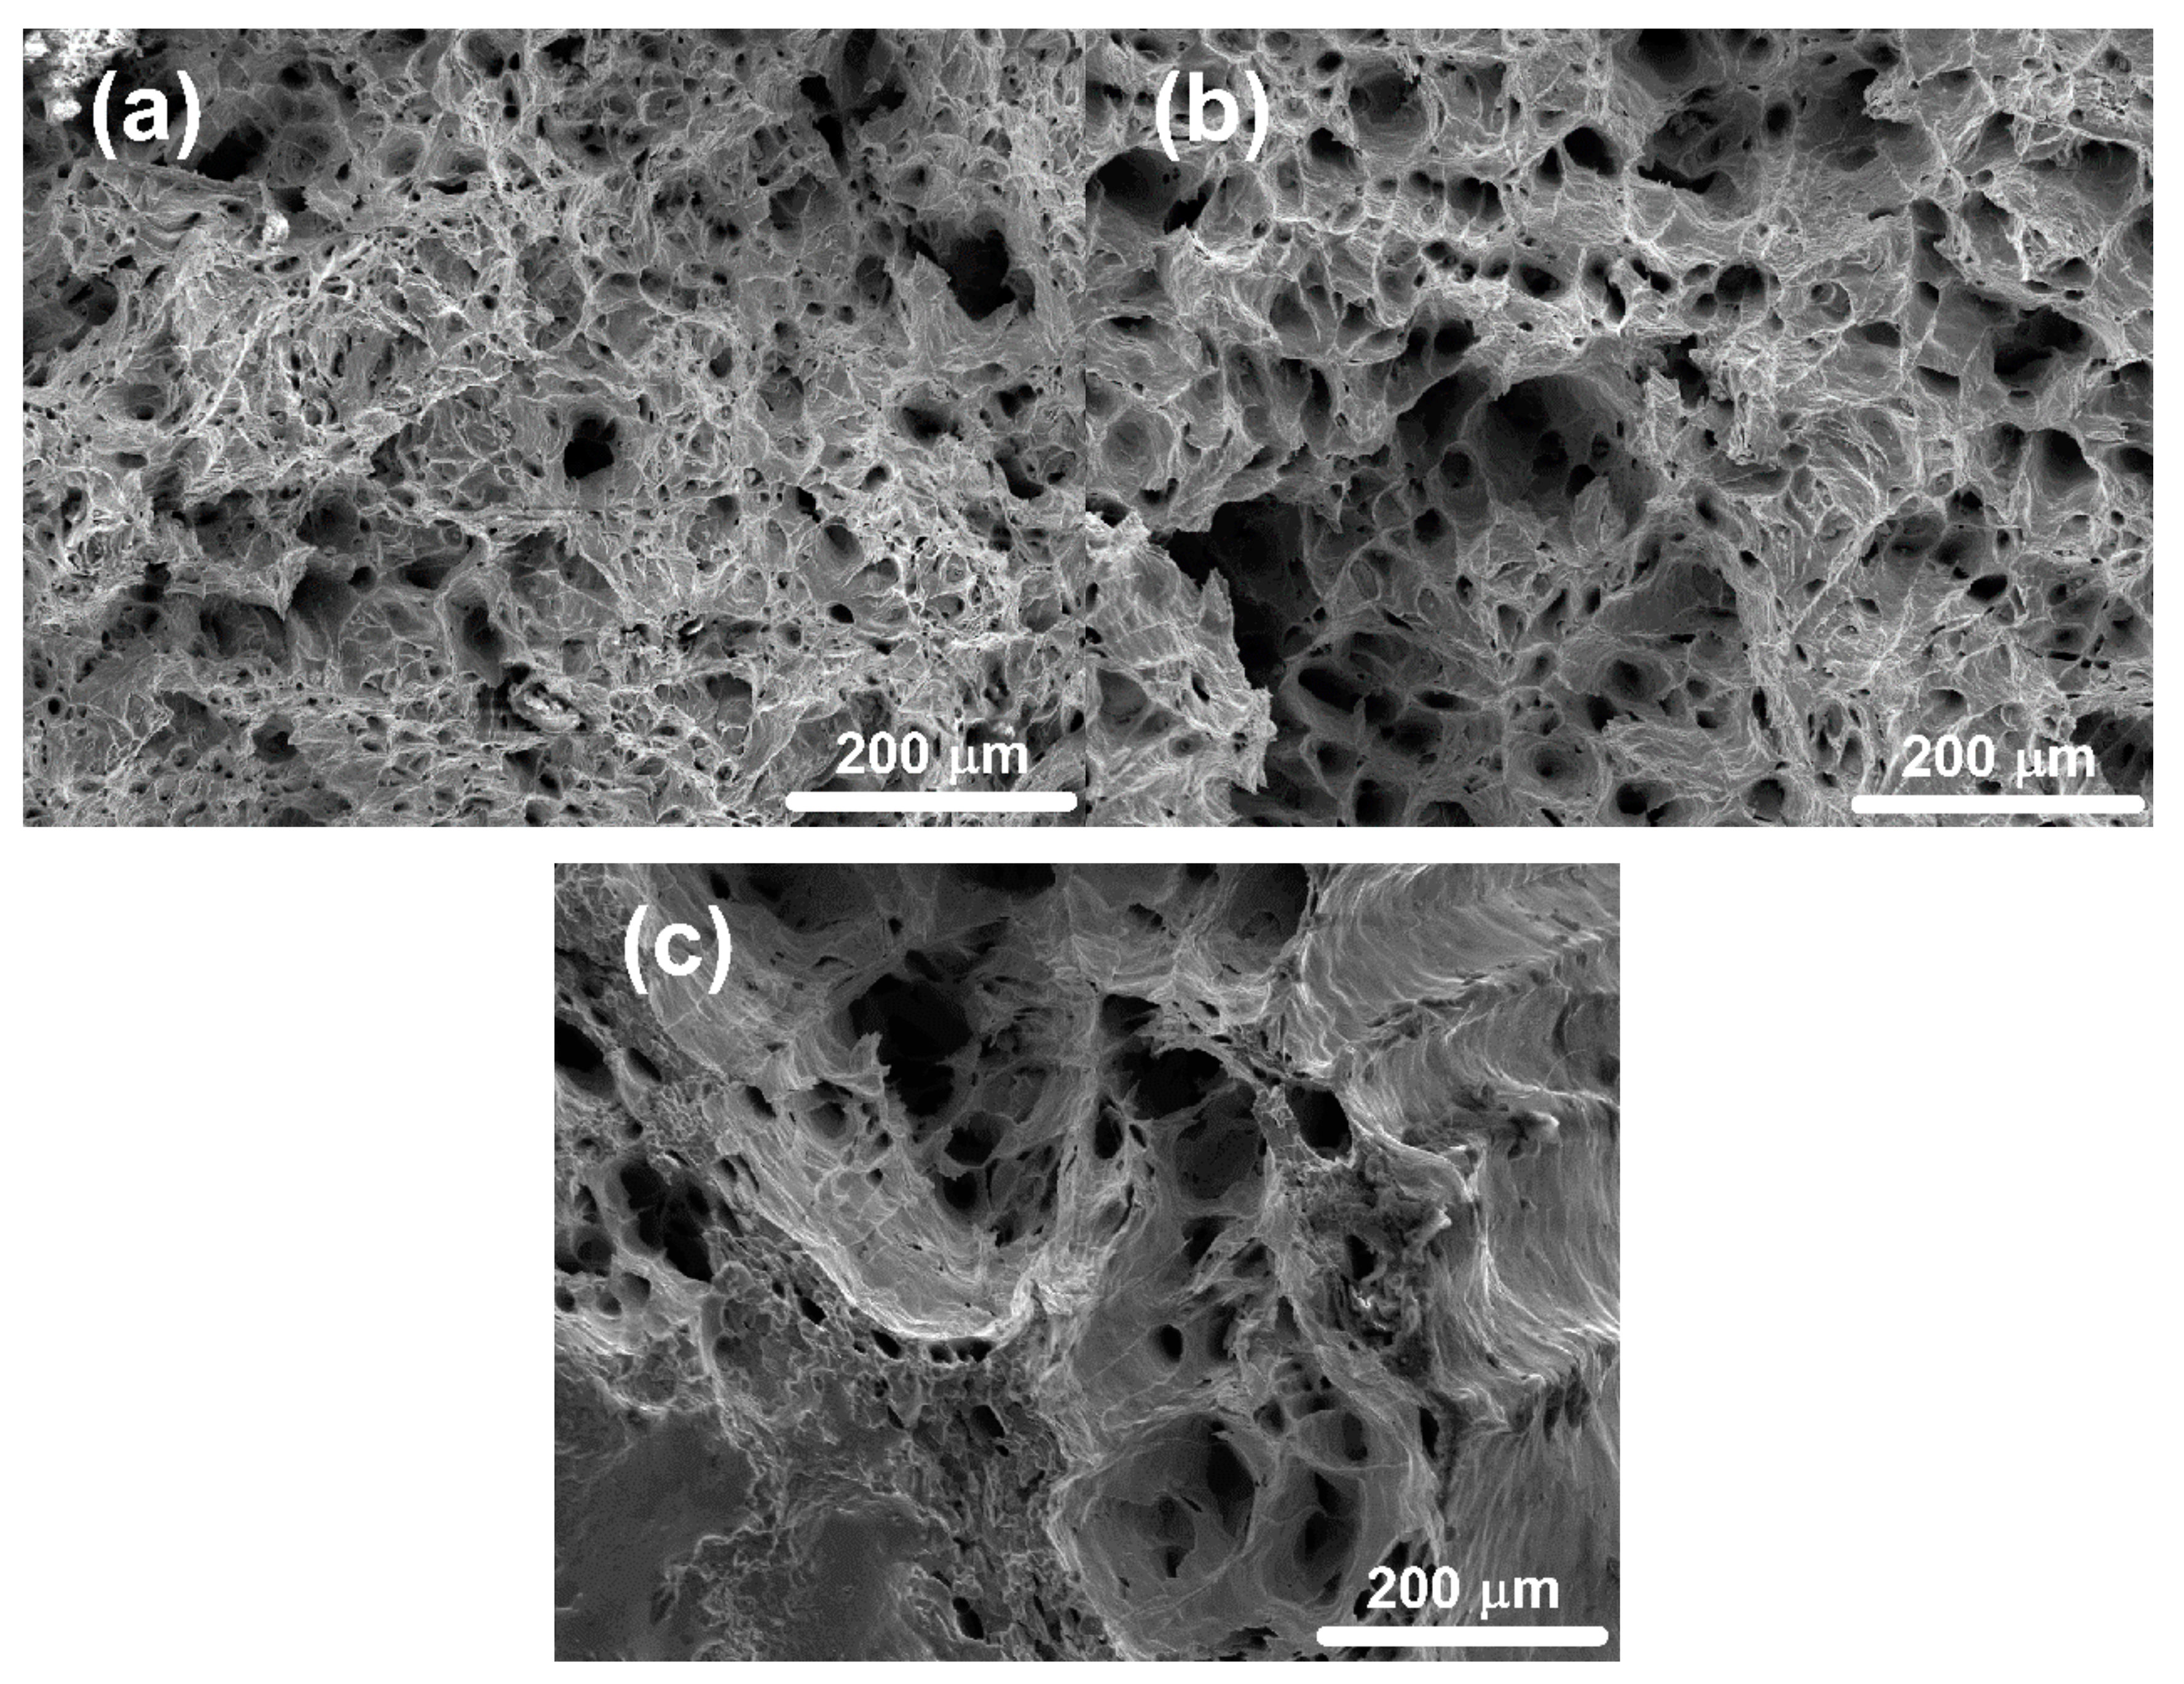
  • Microstructural investigations of 13CrMoNbV steel show that initial ferrite and austenite grains extended into fibers and fragmented into small grains/subgrains during deformation. The size of the grains/subgrains increased with increases in the deformation temperature due to an intensification of the dynamic recovery and recrystallization processes.
  • The modified Rice and Tracy ductile fracture model was constructed using experimental tensile tests and the finite element approach. It was found that the critical value of the ductile fracture criteria K * and the value of the strain incorporated exponential constant are increased with increasing temperature.

Author Contributions

All authors have read and agree to the published version of the manuscript. Conceptualization, A.C.; methodology, A.C.; investigation, A.S., A.P., T.C.; writing—original draft preparation, A.S., A.C.; writing—review and editing, A.P.

Funding

This work was supported by the Russian Science Foundation (project No. 18-79-10153).

Conflicts of Interest

The authors declare no conflict of interest.

References

  1. Atkins, A.G. Fracture in forming. J. Mater. Process. Technol. 1996, 56, 609–618. [Google Scholar] [CrossRef]
  2. Latham, M.; Cockroft, D. Ductility and the workability of metals. J. Inst. Met. 1968, 96, 33–39. [Google Scholar]
  3. Rice, J.R.; Tracey, D.M. On the ductile enlargement of voids in triaxial stress fields. J. Mech. Phys. Solids 1969, 17, 201–217. [Google Scholar] [CrossRef] [Green Version]
  4. Oyane, M.; Sato, T.; Okimoto, K.; Shima, S. Criteria for ductile fracture and their applications. J. Mech. Work. Technol. 1980, 4, 65–81. [Google Scholar] [CrossRef]
  5. Churyumov, A.Y.; Pozdniakov, A.V.; Mondoloni, B.; Prosviryakov, A.S. Effect of boron concentration on hot deformation behavior of stainless steel. Results Phys. 2019, 13, 102340. [Google Scholar] [CrossRef]
  6. Lin, Y.C.; Nong, F.Q.; Chen, X.M.; Chen, D.D.; Chen, M.S. Microstructural evolution and constitutive models to predict hot deformation behaviors of a nickel-based superalloy. Vacuum 2017, 137, 104–114. [Google Scholar] [CrossRef]
  7. Lin, Y.C.; Chen, X.M. A critical review of experimental results and constitutive descriptions for metals and alloys in hot working. Mater. Des. 2011, 32, 1733–1759. [Google Scholar] [CrossRef]
  8. Chen, M.S.; Yuan, W.Q.; Lin, Y.C.; Li, H.B.; Zou, Z.H. Modeling and simulation of dynamic recrystallization behavior for 42CrMo steel by an extended cellular automaton method. Vacuum 2017, 146, 142–151. [Google Scholar] [CrossRef]
  9. Prosviryakov, A.; Mondoloni, B.; Churyumov, A.; Pozdniakov, A. Microstructure and hot deformation behaviour of a novel Zr-alloyed high-boron steel. Metals 2019, 9, 218. [Google Scholar] [CrossRef] [Green Version]
  10. Yao, D.; Cai, L.; Bao, C. A new fracture criterion for ductile materials based on a finite element aided testing method. Mater. Sci. Eng. A 2016, 673, 633–647. [Google Scholar] [CrossRef]
  11. Zhu, Y.; Zeng, W.; Zhang, F.; Zhao, Y.; Zhang, X.; Wang, K. A new methodology for prediction of fracture initiation in hot compression of Ti40 titanium alloy. Mater. Sci. Eng. A 2012, 553, 112–118. [Google Scholar] [CrossRef]
  12. Yuk, S.C.; An, W.R.; Hwang, B.K.; Kim, T.S. An investigation on base metal block shear strength of ferritic stainless steelwelded connection. Appl. Sci. 2019, 9, 4220. [Google Scholar] [CrossRef] [Green Version]
  13. Fu, X.Y.; Bai, P.C.; Yang, J.C. Cracking the initiation mechanism of high Cu-bearing nitrogen-alloyed austenitic stainless steel in the process of hot deformation. Metals 2018, 8, 816. [Google Scholar] [CrossRef] [Green Version]
  14. Zhang, J.; Yao, K.; Chen, H.; Zhu, G.; Li, F. Microstructure Evolution of SAF2205 Duplex Stainless Steel During Torsion Deformation at Elevated Temperature. Xiyou Jinshu Cailiao Yu Gongcheng Rare Met. Mater. Eng. 2018, 47, 1689–1694. [Google Scholar]
  15. Ghazani, M.S.; Eghbali, B. Characterization of the hot deformation microstructure of AISI 321 austenitic stainless steel. Mater. Sci. Eng. A 2018, 730, 380–390. [Google Scholar] [CrossRef]
  16. Ji, G.; Li, L.; Qin, F.; Zhu, L.; Li, Q. Comparative study of phenomenological constitutive equations for an as-rolled M50NiL steel during hot deformation. J. Alloys Compd. 2017, 695, 2389–2399. [Google Scholar] [CrossRef]
  17. Akbarzadeh, A.; Naghdy, S. Hot workability of a high carbon high chromium tool steel. Mater. Des. 2013, 46, 654–659. [Google Scholar] [CrossRef]
  18. Churyumov, A.Y.; Khomutov, M.G.; Solonin, A.N.; Pozdniakov, A.V.; Churyumova, T.A.; Minyaylo, B.F. Hot deformation behaviour and fracture of 10CrMoWNb ferritic-martensitic steel. Mater. Des. 2015, 74, 44–54. [Google Scholar] [CrossRef]
  19. Klueh, R.L.; Nelson, A.T. Ferritic/martensitic steels for next-generation reactors. J. Nucl. Mater. 2007, 371, 37–52. [Google Scholar] [CrossRef]
  20. Qiu, G.; Zhan, D.; Li, C.; Qi, M.; Jiang, Z.; Zhang, H. Effects of Y and Ti addition on microstructure stability and tensile properties of reduced activation ferritic/martensitic steel. Nucl. Eng. Technol. 2019, 51, 1365–1372. [Google Scholar] [CrossRef]
  21. Liao, H.; Wang, X.; Yang, G.; Feng, Y.; Wang, P.; Feng, K. Recent progress of R&D activities on reduced activation ferritic/martensitic steel (CLF-1). Fusion Eng. Des. 2019, 147, 111235. [Google Scholar]
  22. Prakash, P.; Vanaja, J.; Reddy, G.V.P.; Laha, K.; Rao, G.V.S.N. On the effect of thermo-mechanical treatment on creep deformation and rupture behaviour of a reduced activation ferritic-martensitic steel. J. Nucl. Mater. 2019, 520, 65–77. [Google Scholar] [CrossRef]
  23. Chen, Y.; Zhang, F.; Yan, Q.; Zhang, X.; Hong, Z. Microstructure characteristics of 12Cr ferritic/martensitic steels with various yttrium additions. J. Rare Earths 2019, 37, 547–554. [Google Scholar] [CrossRef]
  24. Zhu, Z.; Cheng, Y.; Xiao, B.; Khan, H.I.; Xu, H.; Zhang, N. Corrosion behavior of ferritic and ferritic-martensitic steels in supercritical carbon dioxide. Energy 2019, 175, 1075–1084. [Google Scholar] [CrossRef]
  25. Evans, R.W.; Scharning, P.J. Axisymmetric compression test and hot working properties of alloys. Mater. Sci. Technol. 2001, 17, 995–1004. [Google Scholar] [CrossRef]
  26. Churyumov, A.Y.; Khomutov, M.G.; Tsar’Kov, A.A.; Pozdnyakov, A.V.; Solonin, A.N.; Efimov, V.M.; Mukhanov, E.L. Study of the structure and mechanical properties of corrosion-resistant steel with a high concentration of boron at elevated temperatures. Phys. Met. Metallogr. 2014, 115, 809–813. [Google Scholar] [CrossRef]
  27. Zener, C.; Hollomon, J.H. Effect of strain rate upon plastic flow of steel. J. Appl. Phys. 1944, 15, 22–32. [Google Scholar] [CrossRef]
  28. Slooff, F.A.; Zhou, J.; Duszczyk, J.; Katgerman, L. Constitutive analysis of wrought magnesium alloy Mg-Al4-Zn1. Scr. Mater. 2007, 57, 759–762. [Google Scholar] [CrossRef]
  29. Quan, G.; Pan, J.; Wang, X. Prediction of the hot compressive deformationBehavior for superalloy nimonic 80A by BP-ANN model. Appl. Sci. 2016, 6, 66. [Google Scholar] [CrossRef] [Green Version]
Figure 1. Microstructure of 13CrMoNbV steel (SEM) (a) as-cast and (b) after the annealing at 1250 °C for 5 min.
Applsci 10 00530 g001
Figure 2. The phase composition of 13CrMoNbV steel at elevated temperatures according to thermodynamic analysis.
Applsci 10 00530 g002
Figure 3. True stress curves at temperatures in the range of 1100 to 1275 °C and strain rates of (a) 0.1 s−1, (b) 1 s−1 and (c) 10 s−1.
Applsci 10 00530 g003
Figure 4. Microstructure of 13CrMoNbV steel after hot deformation at different temperatures and strain rates.
Applsci 10 00530 g004
Figure 5. The fits of the dependence of ln(A3), α, Q3, and n2 on true strain by a fourth-order polynomial.
Applsci 10 00530 g005
Figure 6. The comparison between the calculated and experimental values of flow stress (a) and calculated and FEM simulated force vs. displacement curves (b).
Applsci 10 00530 g006
Figure 7. Hot tension curves (a,b), ultimate tensile strength (c) and reduction of area (d) of 13CrMoNbV steel at temperatures in the range of 1100–1275 °C.
Applsci 10 00530 g007
Figure 8. Microstructure of the tensile samples’ fractured surface after deformation at (a) 1100, (b) 1150 and (c) 1200 °C.
Applsci 10 00530 g008
Figure 9. Dependences of stress triaxiality on equivalent strain during tensile tests at (a) 1100–1175 °C and (b) 1200–1275 °C (the circles are the experimental values of ε ¯ f ).
Applsci 10 00530 g009
Figure 10. Comparison between experimental and calculated tensile curves at (a) 1100, (b) 1150, (c) 1200 and (d) 1250 °C.
Applsci 10 00530 g010
Table 1. Chemical composition (wt. %) (balance Fe).
CMnSiSPCrNiMoVN2NbB
0.120.770.420.0020.01713.60.171.510.210.070.250.004
Table 2. Chemical composition of the phases in the microstructure of 13CrMoNbV steel (wt. %).
StatePhaseCSiVCrMnMoNbBFe
As-castFerrite-0.50.313.40.71.70.05-Balance
Martensite-0.40.213.90.81.40.04-Balance
AnnealedFerrite-0.50.314.50.72.10.07-Balance
Martensite-0.50.212.80.81.30.04-Balance
White particles8.8-----83.57.7-
Table 3. The optimized values of the fracture model coefficients.
Coefficient1100 °C1150 °C1200 °C1250 °C
γ 0.10.250.30.3
K * 1.581.821.782.20

