Article

Value of Information (VoI) for the Chloride Content in Reinforced Concrete Bridges

by
Ivan Zambon
1,2,*,
Monica Patricia Santamaria Ariza
3,
José Campos e Matos
3 and
Alfred Strauss
2
1
Department of Bridge Construction, FCP Fritsch, Chiari & Partner ZT GmbH, Marxergasse 1 B, 1030 Vienna, Austria
2
Department of Civil Engineering and Natural Hazards, Institute for Structural Engineering, University of Natural Resources and Life Sciences, Peter-Jordan-Straße 82, A-1190 Vienna, Austria
3
Department of Civil Engineering, Campus de Azurem, University of Minho, 4800-058 Guimaraes, Portugal
*
Author to whom correspondence should be addressed.
Appl. Sci. 2020, 10(2), 567; https://doi.org/10.3390/app10020567
Submission received: 16 November 2019 / Revised: 30 December 2019 / Accepted: 6 January 2020 / Published: 13 January 2020
(This article belongs to the Special Issue Assessing and Extending the Service Life of Bridges)

Abstract

:
The corrosion of reinforcement caused by chloride ingress significantly reduces the length of the service life of reinforced concrete bridges. Therefore, the condition of bridges is periodically inspected by specially trained engineers regarding the possible occurrence of reinforcement corrosion. Their main goal is to ensure that the structure can resist mechanical and environmental loads and offer a satisfactory level of safety and serviceability. In the course of assessment, measuring the chloride content, through which corrosion could be anticipated and prevented, presents a possible alternative to visual inspections and corrosion tests that can only indicate already existing corrosion. It is hard to determine the cost-effectiveness and actual value of chloride content measurements in a simple and straightforward way. Thus, the main aim of the paper was to study the value of newly gained information, which is obtained when a chloride content in reinforced concrete bridges is measured. This value was here analyzed through the pre-posterior analysis of the cost of measurement and repair, taking into account different types of exposure and material properties for a general case. The research focus was set on the initiation phase in which there are no visible damages. A relative comparison of costs is presented, where the cost of possible reactive/proactive repair was compared with the maximum cost of measurement, while the measurement is still cost effective. The analysis showed a high influence of the initial probability of depassivation on the maximum cost of the cost-effective measurement, as well as a nonreciprocal relation of the minimum cost of cost-effective reactive repair with the measurement accuracy.

1. Introduction

A predominant amount of roadway and railway bridges today consist of bridges erected using reinforced concrete. When observing developed countries, the main reasons for that can be traced to the boom in the building and reconstruction of infrastructure after the Second World War, as well as in the enhancement of concrete technology in the 20th century. Although, when compared with other building materials, concrete is deemed as a durable material, nonetheless, evidence of its ageing can be found in infrastructure all over the world [1,2].
Chloride-induced corrosion is identified as one of main causes of reinforced concrete deterioration, especially in transportation infrastructure [3]. In 2002, the National Association of Corrosion Engineers International (NACE) and the Federal Highway Administration (FHWA) stated that approximately 134,000 bridges in the USA require urgent repairs due to structural deficiency caused by rebar corrosion [4]. This mobilized numerous researchers and organizations to invest substantial effort in developing and enhancing chloride ingress models, resulting in many different approaches for describing the time-dependent process of chloride ingress. For an overview of their development, and for a comprehensive description of different chloride ingress models, see [5,6,7,8]. The model employed in the following analysis is supported by the Federation for Structural Concrete (fib) in Model Code 2010 [9], fib Bulletin 34 [10], fib Bulletin 59 [3], and fib Bulletin 76 [11]. Projects, such as the BMB [12], HETEK [13], DuraCRETE [14], Lifecon [15], DARTS [16], CHLOROTEST [17], and Life-365 [18], etc., played an important role in shaping the current analytical model of chloride ingress supported by the fib.
Simultaneously with enhancements in the modelling and understanding of the chloride ingress phenomenon, the testing and monitoring techniques of the chloride content have been developing. However, some studies reported that significant differences between theoretical and measured chloride content profiles still exist, possibly leading to under- or over-estimations of the chloride content and to wrong maintenance decisions [4].
Another research field that is emerging is the use of test and monitoring data of chloride content for decision making by applying Bayesian statistics. Jung et al. [19] developed a probabilistic life-cycle cost model for marine structures exposed to chloride attack based on a Bayesian approach using monitoring data. Tran et al. [20] studied Bayesian updating for the optimization of inspection schedules of chloride ingress into concrete. Moreover, in their more recent works, they presented and improved the Bayesian network configurations for parameter identification of concrete chlorination models [21,22,23]. Recently, the most significant effort within the Bayesian decision theory was invested through the work of the COST Action TU1402 “Quantifying the Value of Structural Health Monitoring (SHM)”, which was active from 2014 until 2019. The effort of the action was directed in the formulation of so-called value of information (VoI) analysis within the Bayesian decision theory as a special case of the pre-posterior decision analysis [24,25,26]. It was a joint effort of 29 European countries, China, the USA, and Australia, with participants from academia, industry, and infrastructure owners, operators, and authorities. The aim was to provide (i) scientific evidence of the high value of SHM and its boundary conditions; (ii) an industrial and societal impact for the infrastructure design and management; and (iii) accessibility to the scientific field for quantifying the value of SHM [27].
Driven by the described developments and enhancements in the knowledge pool, this paper aimed to present the use of pre-posterior analysis for determining the value of information (VoI) for measurements of chloride content. Value of information (VoI) is the quantity a decision maker would be willing to pay for information before making a decision. For the present study, it can be characterized as the cost of chloride content measurement that a decision maker is willing to pay prior to making decision on repair. Pre-posterior analysis was defined by Raiffa and Schleifer [28] as a statistical problem where the choice of the experiment that is to be performed is analyzed, contrary to terminal analysis, where a suitable choice of a terminal act after an experiment has already been performed is being analyzed. In pre-posterior analysis, one is evaluating potential experiments before they are actually performed by taking into account outcomes that might occur. The analysis has found applications in a wide range of civil engineering problems. Just in the last year, it was used to study areas, such as terrorism risk mitigation measures for iconic bridges [29], optimization of in-situ testing for historic masonry structures [30], serviceability analysis of long span roofs [31], seismic emergency management [32], the design of offshore wind turbines [33], and many other areas.
The VoI analysis in the paper was used as a quantitative method to find out what the maximum, still cost-effective, cost of chloride content measurement is. The observed problem was defined through a decision tree, where all possible steps and outcomes were defined. As an input for calculation, the uncertainties in each step were studied, such as the prior probability of depassivation, probability of the occurrence of corrosion, uncertainty in measuring techniques, and uncertainty in repair outcomes. The costs of measurement and repair were taken as undefined variables, since these are dependent on numerous parameters. The outcomes of the analysis were presented as relative quantities, through the ratio of the cost of measurement and repair. Therefore, the ratio between the maximum costs of measurement for given costs of proactive and reactive repair was given.

2. Problem Statement

The process of reinforcement corrosion can be roughly divided into the phase until the reinforcement becomes depassivated, which is called the initiation phase, and the subsequent phase characterized by corrosion propagation. On the surface of the reinforcement, a microscopically thin oxide layer forms due to the alkalinity of the surrounding concrete, which keeps steel bars passive. The oxide layer is dissolved when the chloride threshold content is exceeded on the surface of the reinforcement, which leads to steel becoming depassivated. Once corrosion starts propagating, a deterioration caused by various mechanisms can be noticed, such as concrete cracking, delamination, loss of the steel–concrete bond, and loss of the reinforcement section. These mechanisms cause decay in the physical and mechanical properties of reinforcement and generate large repair and maintenance costs, with a severe impact on the durability and life-cycle performance [4].
Corrosion risks could be diminished by focusing on the preventive maintenance/repair of RC structures subjected to chloride ingress while the corrosion is still in its initiation phase. To be able to predict and control corrosion in its initiation phase, measurements of the chloride content should be performed. However, such measurements bear costs and associated uncertainties. Hence, the quantification of the value of information (VoI) can substantially contribute to showing if the tests and measurements of the chloride content in the phase of no visible damages would be cost effective. VoI analysis can be performed by taking into account four different events, namely the measurement of the chloride content, depassivation, damage, and repair. Herein, the event of measuring already initiated corrosion is not taken into account since the study focuses only on the VoI for the chloride content, i.e., the focus is set on the initiation phase in which there are no visible damages. All the stated events have a probability of occurrence and costs related to their outcomes. The costs of chloride measurements and concrete repair depend on numerous parameters, such as the methods of measurement, type of repair, market situation, etc. Thus, in this study, the costs of measurement and repairs are taken as relative to each other, resulting in a ratio of costs. This ratio is then easily translated to every particular situation, when a decision on performing chloride measurements has to be made.
The first of the four stated events is the decision on performing the measurement (test) or not. If a measurement is performed, the results can indicate a need or no need for a repair, however, with a certain accuracy. The accuracy of the measurement results depends on the measuring technique, spatial variability, number of samples taken, etc. In the case that a measurement shows a state of depassivation and a repair is performed, it can be performed successfully or unsuccessfully. In the paper, the successful/unsuccessful event was observed only for the proactive repair. In cases where no measurements are performed or measurements indicated no need for repair, it is possible that the reinforcement is indeed already depassivated. Caused depassivation can, with a certain probability, trigger corrosion, which is herein considered as an undesirable event since it leads to damage. The described process can be depicted as a decision tree, as presented in Figure 1. As it can be seen, the decision tree results in nine possible outcomes, the costs of which are here marked as Ui.
It is important to mention that the time component of the whole process was not taken into account. In other words, the period in which the corrosion would occur given the existing depassivation was not investigated, nor was the way the length of this period influences the cost-efficiency of the performed measurement. Furthermore, the concept assumed an immediate repair will take place in the case of depassivation being detected.
The events depicted in the decision tree (see Figure 1) and the probability of their occurrence are given in Table 1, accompanied by a short description.
To find the maximum cost of measurement for which it would still be cost effective to conduct a measurement, the two sides of the decision tree have to be in equilibrium. In other words, the sum of the costs of the outcomes multiplied by the probability of their occurrence in the branch where no measurement is performed has to be equal to the sum of those where measurement is performed. Hence, resulting in Equation (1):
i = 1 3 E i = j = 4 9 E j
Every particular outcome is quantified as the sum of the costs that can occur multiplied by the probability of occurrence, herein marked as Ei and Ej. This quantification is shown in Table 2, for each outcome separately.

3. Chloride Ingress Model

The chloride ingress model used in the paper is based on Fick’s second law of diffusion, believing that the transport of chlorides in concrete is mainly controlled by diffusion [34]. Collepardi et al. [35] were the first to apply Crank’s solution [36] for Fick’s second law, which resulted in a prediction model based on the error function. Although it is generally accepted today, the model still exhibits certain shortcomings, which are described in [37,38].
A full probabilistic design approach for modelling chloride-induced depassivation is based on the limit state given in Equation (2). In the approach, the actual chloride content at the depth of the reinforcing steel is compared to the critical chloride content:
g ( c , t ) = C c r i t C ( c , t )
The content of chlorides at a corresponding depth x is given by Equations (3)–(5):
C x ( x , t ) = C 0 + ( C S , Δ x C 0 ) · [ 1 e r f x Δ x 2 · D a p p ( t ) · t ] ,
where Ccrit is the critical chloride content [wt.-%/c]; C0 is the initial chloride content [wt.-%/c]; CSx is the chloride content at depth Δx [wt.-%/c]; x is the depth with a corresponding content of chlorides (x = c) [mm]; Δx is the depth of the convection zone [mm]; Dapp(t) is the apparent chloride diffusion coefficient [m2/s]; and t is the time [s].
The apparent chloride diffusion coefficient can be expressed as:
D a p p ( t ) = k e · D R C M , 0 · ( t 0 t ) α
where ke is the environmental variable [–]; DRCM,0 is the chloride migration coefficient at the reference point of time [m2/s]; t0 is the reference point of time [y]; and α is the ageing exponent [–].
The environmental variable, ke, takes the form:
k e = exp [ b e ( 1 T r e f 1 T r e a l ) ]
where be is the temperature coefficient [K]; Tref is the reference temperature [K]; and Treal is the temperature of the structural element or the ambient air [K].
To detect and categorize the values of the chloride ingress parameters in existing concrete bridges, an adjustment is required. Such an adjustment is necessary since in codes and norms, no correlation of chloride ingress parameters to formerly used exposure classes, concrete classes, cement types, etc. is given. Unfortunately, a detailed description of the correlation between chloride transport characteristics and parameters resulting from former and new codes is beyond the scope of this paper. Thus, the parameter identification and the process of obtaining prior probabilities of depassivation, Pdep, were in this paper based on a general case. For quantification and a detailed description of parameters of the employed model, see [1,2,3,10,11,39,40,41]. Furthermore, for a detailed insight into how the chosen parameters influence the outcome of the used model, see [42].
As shown in Equation (2), the limit state of chloride-caused depassivation is assumed to be reached when the chloride content, C(c,t), at the reinforcement depth surpasses the critical chloride content, Ccrit. Both of these variables are random, and hence, form a random limit state function, g(c,t). The probability of failure, pf(t), is regarded as the probability of the limit state function, g(c,t), being lower than zero, as shown in Equation (6):
p f ( t ) = p d e p = p { g < 0 }
The reliability (safety) index, β, was introduced to demonstrate how often the standard deviation, sg(t), of the limit state function, g(c,t), may be placed between zero and the mean value, mg(t), as shown in Equation (7):
β ( t ) m g ( t ) s g ( t )
The reliability index, β(t), can be used for determining the initial (prior) probability of depassivation, Pdep, the value of which has not yet been affected by the additional information obtained in tests and measurements. Assuming that the limit state, g(c,t), is normally distributed, the probabilities of depassivation can be estimated through the reliability index, β(t), as follows:
P d e p = p f ( t ) Φ ( u = β )
where Φ(u) is the normal distribution function, which gives the probability that a standard normal variate assumes a value in the interval [0, u].
Although the service life of a structure is the sum of the initiation and propagation period, by the limit state given in Equation (3), only the initiation period is taken into account, deeming the propagation period to be comparatively very short. The evolution of different forms of deterioration, once corrosion has been initiated, does not always occur at the same rate. Hence, the consequences of reaching the limit state, cost of repair, and probability of the occurrence of damage are not always the same. For the exposure classes XD1 and XD2, according the European Standard EN 206-1 [43] (i.e., for predominantly dry or wet conditions), the consequences and probability of corrosion occurrence are not expected to be significant, because the corrosion rate is limited either due to the lack of moisture or the lack of oxygen. However, in exposure class XD3, higher consequences and probabilities of the occurrence of corrosion are expected because it is likely that sufficient moisture and oxygen are present. Therefore, the uncertainty of damage given depassivation has been initiated was also taken into account in the analysis.

4. Measuring Techniques

When considering the nature of measurement, Torres-Luque et al. [4] divided common techniques for measuring the chloride content and estimating the diffusion coefficient in concrete structures in laboratory and field techniques. Laboratory techniques are performed on specimens, and the most common of these techniques are the rapid chloride permeability test (RCPT), non-steady state diffusion test, ponding test, electrical migration test, etc. Laboratory tests are mostly used to determine concrete properties regarding the chloride ingress. Using laboratory tests, certain properties, such as the diffusion coefficient, ageing coefficient, temperature dependence, etc., can be assigned to a specific concrete mixture. The non-steady state diffusion tests are deemed as the most covered laboratory tests when considering the extent and attention given in the literature. These tests are described in [44,45,46,47].
On the other side, field techniques can be further divided into destructive (performed on extracted cores) and non-destructive techniques. When performing field destructive techniques, samples are taken from in-service structures, and chloride profiles are determined by using physical or chemical lab techniques. Quantitative X-ray diffraction analysis is deemed as being representative of physical destructive techniques while the most common chemical techniques are the Volhard method and potentiometric evaluation. Non-destructive techniques (NDTs) comprise methods that do not alter the future usefulness of the material where the measurement is taken. According to [4], the most developed and studied NDT methods could be categorized as ion selective electrodes (ISEs) [48,49], electrical resistivity (ER) [50,51], and the optical fiber sensor (OFS) [52,53].
When observing all the presented techniques, the most common are field destructive tests, from which the most popular are the potentiometric and Volhard method. For the needs of short-term decision-making, e.g., repair or maintenance, these techniques are of essential value. However, they can also be used for model updating [54,55].
A round-robin test with 30 laboratories on chloride analysis in concrete was carried out by the Technical Committee TC 178-TMC of the International Union of Laboratories and Experts in Construction Materials, Systems, and Structures (RILEM), in which it was found that the most suitable method for total chlorides (extraction and quantification) is the Volhard method [56]. Furthermore, in [56], the repeatability and reproducibility of the Volhard method were elaborated. The repeatability was shown to be independent of the actual value, with an average of 0.0135. The reproducibility showed a linear dependency on the actual value, according to the equation, R = 0.1312 (%Cl) + 0.0152, with a correlation coefficient, r, of 0.994.
When considering destructive methods, such as the Volhard method, errors in measurement depend mainly on different steps of the protocol, such as grinding, preparation of powder, acid attack, dilution, and concentration measurements. Bonnet et al. [57] analyzed 42 chloride content measurements in order to assess the total measurement error by considering three main errors (protocol error, sample error, and human error). The probability of the detection of corrosion initiation was expressed as a function of the margin between the critical concentration and the real concentration, i.e., C(t) − Ccrit. For a margin of 0.0001 (by weight of concrete), the probability of detection was found to be around 87%. This margin corresponds to approximately 0.1 wt.-%/c (by weight of cement).
However, besides the accuracy of the testing method, the uncertainties in measurement consist of spatial variability, the number of measurements taken, etc. Thus, when performing an analysis of the VoI, it is not possible to assign an exact cost or accuracy to a measurement event, in such a way that it covers all stated methods of measurement. For this reason, the maximum cost (assigned as Cmeas) was calculated in relation to costs of proactive and reactive repair. The uncertainties in measurement were observed through four different scenarios, namely P(Ddep | Tno), P(Dno-dep | Tno), P(Ddep | Tyes), and P(Dno-dep | Tyes), as previously described in Table 1.

5. Repair Methods

In the Model Code 2010 [9], the term conservation embraces all activities aimed at maintaining or returning a structure to a state that satisfies the defined performance requirements. This includes activities, such as maintenance, repair, rehabilitation, retrofitting, replacement, etc. Furthermore, two different conservation objectives are distinguished:
  • Conservation activities with the intention to enable a structure to meet its intended service life, as envisaged at the time of design; and
  • Conservation activities with the intention to prolong the planned service life of a structure or to enable it to meet altered performance requirements (e.g., altered loading or functionality needs).
In the paper, only the objective of enabling the structure to meet its intended service life was observed. This is because it is assumed that when a measurement is performed, only the information on the current chloride content is available, and an extrapolation of the process and forecasting future content was not taken into account.
In the Model Code 2010 [9], the choice of conservation strategy is seen as being dependent on numerous factors, the most important of which are:
  • Consequences of a potential failure;
  • Feasibility of evaluating the condition of the structure;
  • Predictability of the service life of the structure or its components;
  • Recording and quantification of the actions that occur during the service life of the structure;
  • Feasibility of preventative or remedial interventions (e.g., repairs, replacements etc.); and
  • Cost of conservation activities.
From these factors, only the factors related to the conservation of the serviceability limit state were observed in the analysis, i.e., the possible consequences of actual structural failure were not considered. According to [58], the conservation strategies were characterized based on their proactive versus reactive characteristics as follows:
  • Proactive conservation activities;
  • Reactive conservation activities; and
  • Situations where conservation activities are not feasible.
A proactive conservation strategy is based on preventive (or protective) interventions and measures. These measures are primarily intended to avoid and minimize future deterioration by implementing some form of treatment or taking action prior to damage becoming detectable. This approach should enable early identification of problems and possible risk issues affecting the condition of the structure, and is hence deemed as desirable. Furthermore, the approach should potentially enable early preventive action to be taken to minimize the overall cost of ownership [58].
It is important to mention that this paper focuses only on the repair activities as possible methods of structural conservation, and does not consider other options, such as replacement, demolition, etc. Eleven possible principles for concrete repair and protection were summarized, when the European Standards 1504 were fully introduced in 2009 [59]. The recommendations given in the European Standards 1504 should assist engineers in the selection of a method that would repair or retard (potential) damage in reinforced concrete structures. When observing these principles, a systematic division into two groups can be noticed, i.e., principles related to defects in concrete and principles related to reinforcement corrosion. Principles related to defects in concrete were divided into protection against ingress, moisture control, concrete restoration, structural strengthening, increasing physical resistance, and increasing resistance to chemicals. On the other hand, principles related to reinforcement corrosion were divided into preserving or restoring passivity, increasing resistivity, cathodic control, cathodic protection, and control of anodic areas. Raupach and Büttner [60] assigned examples of methods of repair to each of these principles.
Some of these repair principles and specific methods can be applied as both proactive and reactive measures while others just as one of these strategies. Each of these methods has its own specific procedure and associated cost. Moreover, this cost varies due to the global and local market situations, and it is different in each country at each given time. Because of this reason, the actual cost of a specific repair method was not considered in the analysis; rather, the ratio of preventive and reactive cost was observed.
In the thematic network CONREPNET, around 230 case studies were examined on repaired concrete structures. The case histories were located in different countries across Europe, with about 70% located in North Europe. From the study, it was confirmed that 50% of the repaired concrete structures have failed, of which 25% deteriorated within the first 5 years, 75% deteriorated within 10 years, and 95% within 25 years [61].
Since the analysis according to the decision tree presented in Figure 1 does not take time dependency into account, only unsuccessful repair, which can be seen within rather short period of time, was considered. In other words, the effects of unsuccessful repair that can be seen within 15 to 20 years were not considered. Thus, according to the above percentages, the probability of successful repair was calculated as the percentage of structures that have not deteriorated within the first 5 years, according to Equation (9):
P r e p = 0.5 + 0.5 ( 1 0.25 ) = 0.875
Hence, the probability of successful repair used in the analysis was taken as Prep = 0.875, although this value can be adapted to every specific case study considered.

6. Pre-Posterior Analysis

Based on the decision tree presented in Figure 1, a pre-posterior analysis of the cost effectiveness of chloride content measurement was performed. For the analysis, values of the uncertainties of events were chosen based on the previous chapters, as presented in Table 3.
The calculation was performed for different probabilities of depassivation, Pdep, namely Pdep = 0.2, Pdep = 0.4, Pdep = 0.6, and Pdep = 0.8. These probabilities were chosen to represent different concrete mixtures, since a general case was analyzed. The probability of damage occurring, given that the depassivation was indicated, P (Dcrack | Ddep), was taken as 80%. Since the critical chloride level, Ccrit, is not an exact number, P (Dcrack | Ddep) covers possible situations where the chloride level is higher than the critical but does not cause the depassivation, or situations where depassivation occurs but does not cause any damages. The probability of successful repair was set as Prep = 0.875, as described in the chapter “repair methods”. For the purpose of the analysis, the actual chloride level was assumed to approximately correspond to the critical chloride level. This assumption led to the probability of correct measurement (i.e., probability of detection) being considered with an accuracy of 90% (previously elaborated in the chapter “measuring techniques”).
From the presented uncertainties, it was possible to calculate the ratio of the maximum cost of measurement, Cmeas,max, which is still cost effective, as dependent on the cost of proactive and reactive repairs. The calculated Cmeas,max are herein presented graphically through charts in Figure 2, and through Equations (10) and (11). Figure 2. shows the graphs for the ratio of the cost of proactive, Crep,p, and reactive repair, Crep,r, and calculated maximum still cost-effective cost of measurement, Cmeas,max, for four different probabilities of depassivation. In this way, one can easily graphically extract the value of the maximum cost-effective cost of measurement, Cmeas,max, and translate it to a real cost, in a real decision-making situation.

7. Discussion

In Figure 2, the examples of the procedure of graphical calculation are depicted with green lines and the obtained values of Cmeas,max are shown in the green color. Simply, if a proactive repair costs € 15,000 and reactive repair € 60,000, then the maximum cost of measurement that would still be cost effective is € 3400, € 8000, € 13,100, and € 17,900, given that the initial probabilities of depassivation are Pdep = 0.2, Pdep = 0.4, Pdep = 0.6, and Pdep = 0.8, respectively. As in the graphical example, an analytical calculation can be performed if the lines in Figure 2 that represent the Cmeas,max are given as linear equations. These can be written as:
C r e p , r = a 0 C r e p , p + a 1 C m e a s
leading to:
C m e a s , m a x = C r e p , r   a 0 C r e p , p a 1
The constants a0 and a1 in Equations (10) and (11) can be derived for each different initial probability of depassivation, Pdep, as shown in Table 4.
From Figure 2, it can be seen how with the increase of initial probability of depassivation, Pdep, the maximum costs of measurement, Cmeas,max, become higher. In contrary, at first sight, it would be more expected that with the approaching of Pdep to the value of 1.0, the maximum cost of measurement, Cmeas,max, would decrease, since the value of information is not that high in the circumstances where depassivation is almost obvious. This can be explained by the fact that several events that reduce the value of measurement were taken into account in the analysis, these being the event of false indication of depassivation, the event of damage not occurring after accurate indication of depassivation, the event of unsuccessful repair, etc.
In the analysis, it was presumed that the actual chloride content approximately corresponds to the critical chloride content, and that that their margin (their difference) is relatively low. In this way, it was presumed that a bridge is being almost depassivated, and that the probability of correct measurement is relatively high. However, this does not have to be the case for other bridges. Hence, a further analysis was performed to check the influence of the probabilities of correct measurement on the results. The results of the analysis are presented in Figure 3, for which the parameters presented in Table 3 were used. The exceptions are the probability of depassivation that was set as Pdep = 0.6 and the probabilities of correct measurement, P (Dno-dep | Tno) and P (Ddep | Tyes), which varied from 0.5 to 0.9. Furthermore, the analysis was performed for the unit cost of measurement, i.e., Cmeas = 1. The results presented in Figure 3 can be explained as follows: When the probabilities of correct measurement of 0.5 are observed, if, to perform the measurement, the costs are € 1000 and the cost of proactive repair is also €1000, the cost of reactive repair, Crep,r, has to be above €5600 for the measurement to be cost effective. Otherwise, since the probabilities of correct measurement are low, the measurement is not cost effective. As it can be seen, with the increase of the probabilities of correct measurement, the minimum cost of reactive repair decreases, which is as expected.
Similar to the probabilities of correct measurement, the influence of the probability of damage given depassivation occurred, P (Dcrack | Ddep), was analyzed. The parameters given in Table 3 were used for the analysis, where additionally, the probability of depassivation was set as Pdep = 0.6 and the probabilities of damage given depassivation occurred, P (Dcrack | Ddep), varied from 0.5 to 0.9. Furthermore, the analysis was performed for the unit cost of measurement, i.e., Cmeas = 1. The results are presented in Figure 4, where one can easily notice the decrease of the minimum cost of reactive repair, Crep,r,min, with the increase of the probability of damage, P (Dcrack | Ddep). However, the decrease is more intensive than in Figure 3, thus emphasizing the high influence of the probabilities of damage once the depassivation occurred, P (Dcrack | Ddep), to the cost effectiveness of measurement.

8. Conclusions

The paper focused on the value of information (VoI) analysis for measurements of chloride content, performed before the occurrence of reinforcement depassivation. The VoI analysis was performed based on a decision theoretical framework built as part of very recent advances in the COST Action TU1402 on “Quantifying the Value of Structural Heath Monitoring” using the pre-posterior method of analysis. The pre-posterior analysis was applied taking into account different types of exposure situations and material properties. As a part of the analysis, a decision tree was formed, based on which all the possible outcomes of the process were obtained, accompanied with the associated probabilities and costs. From these investigations, the following conclusions were apparent:
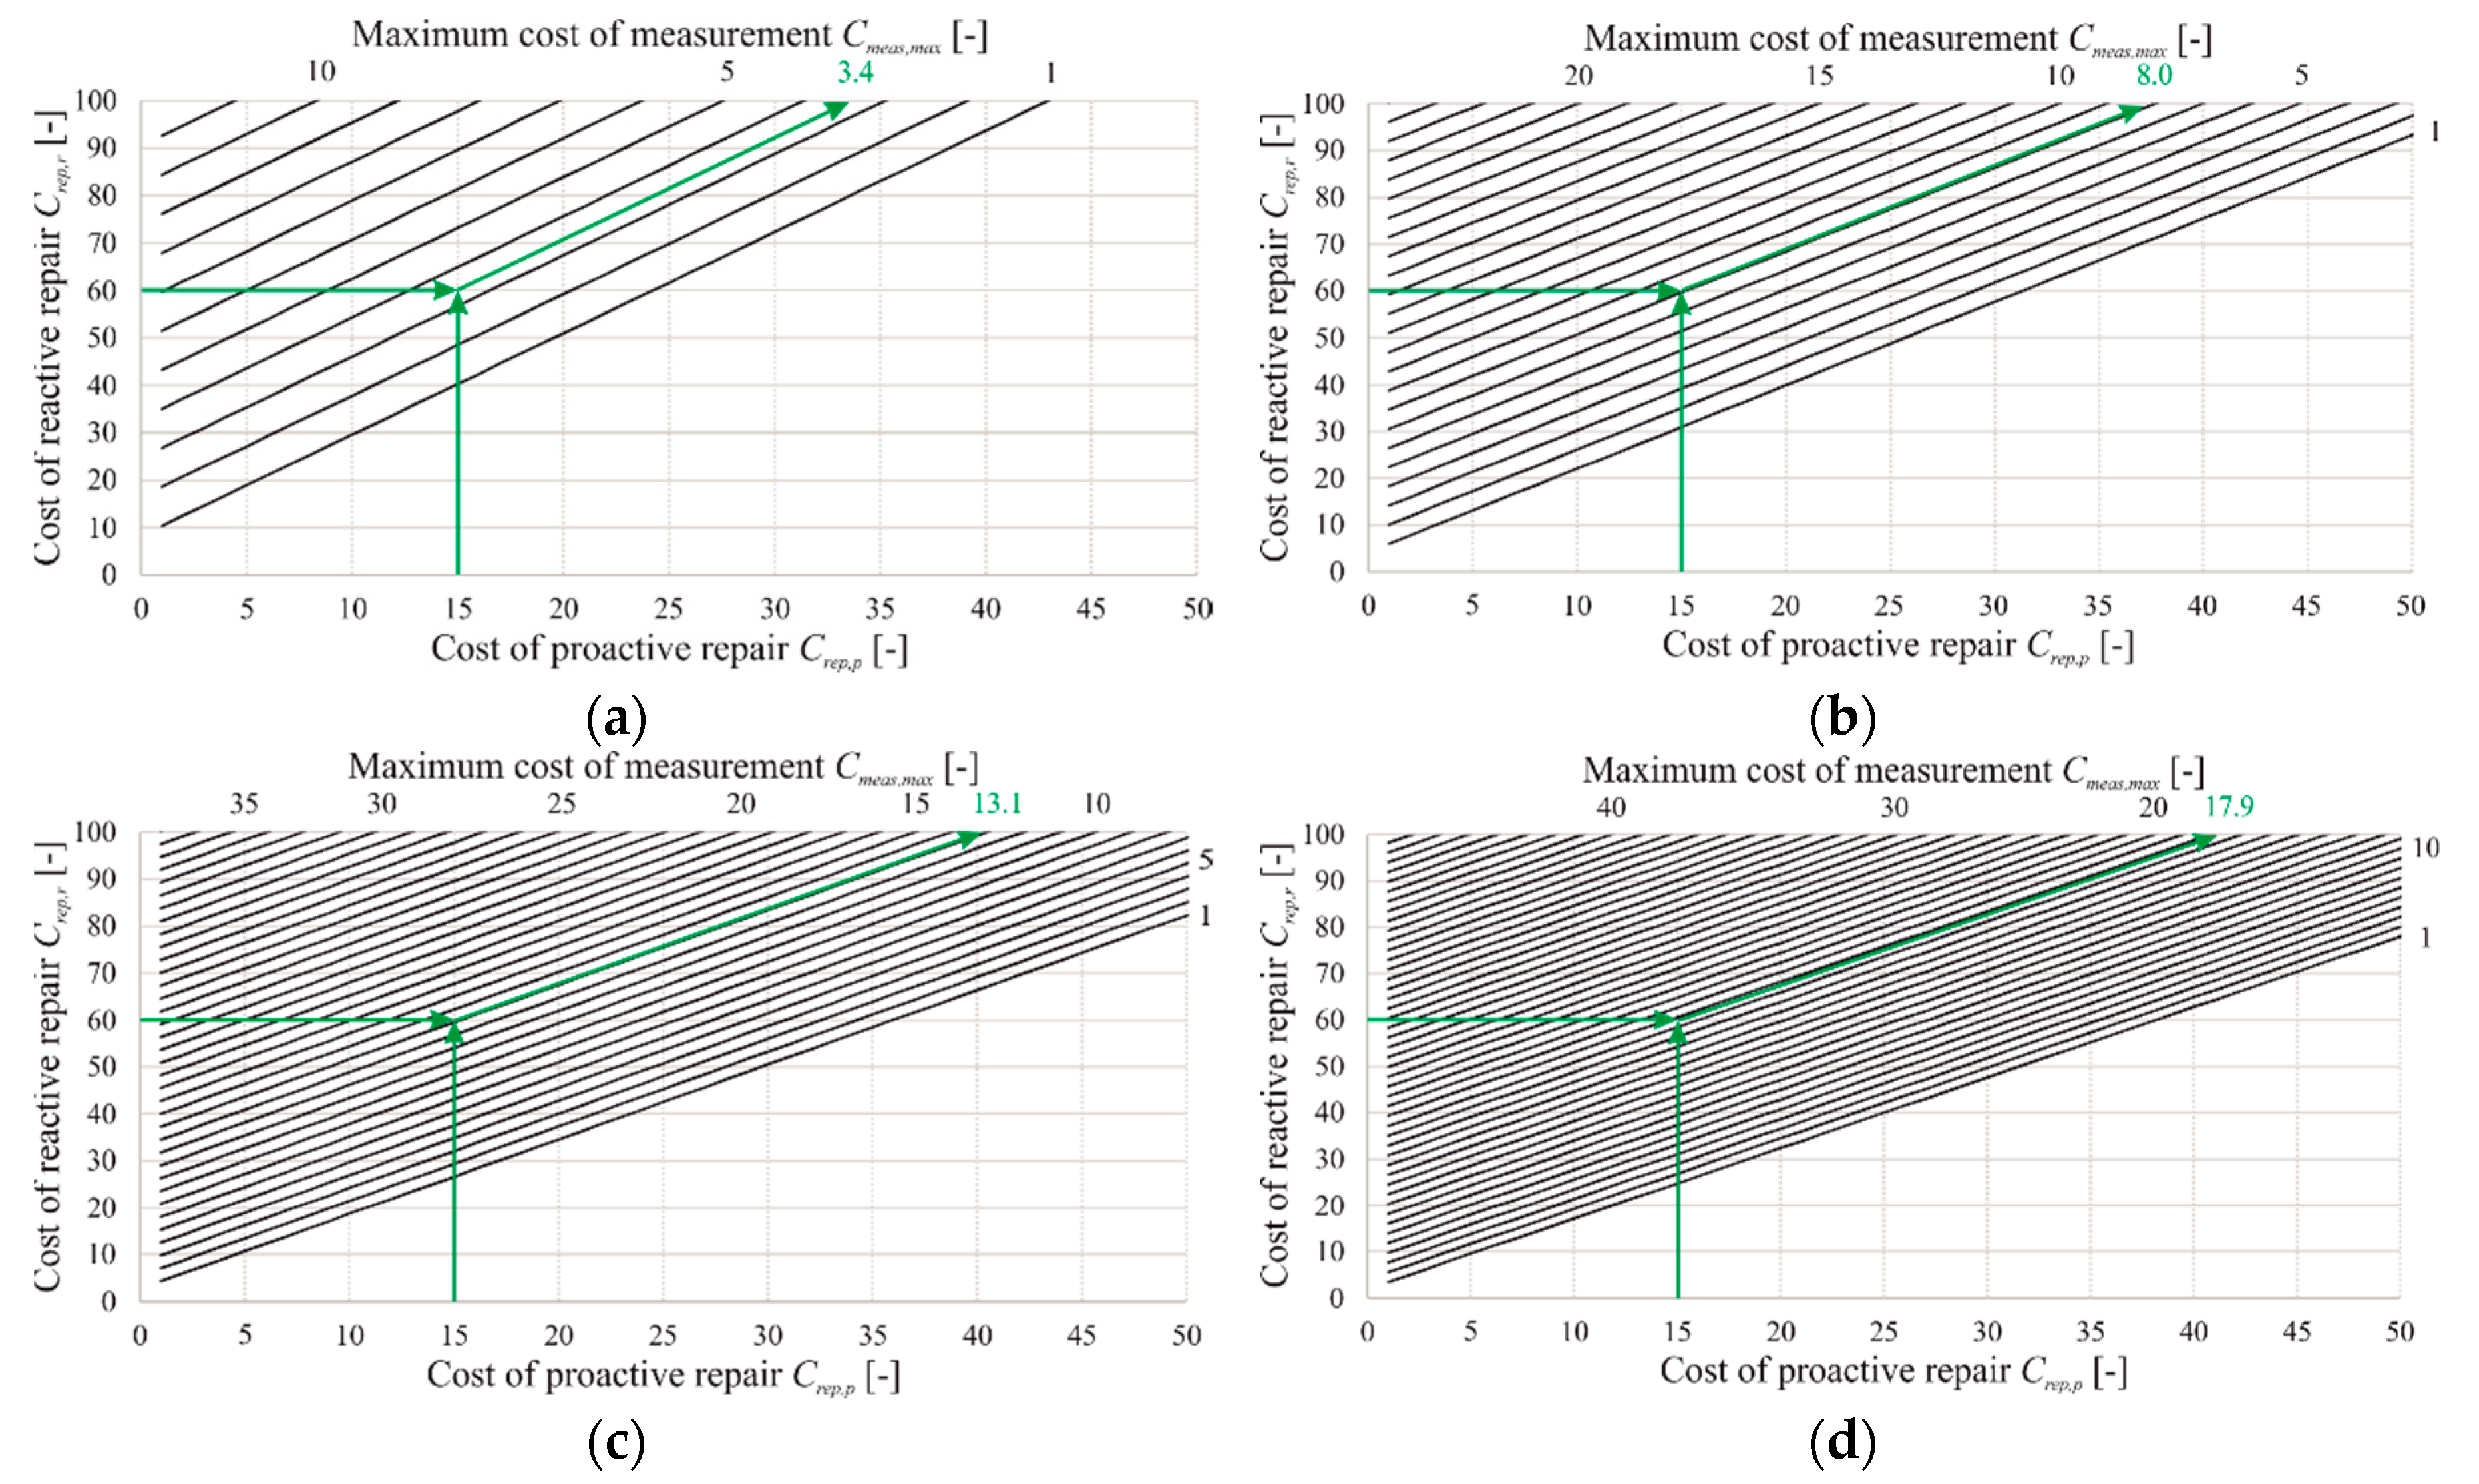
  • With the increase of the initial probability of depassivation, Pdep, the maximum cost of measurement, Cmeas,max, which is still cost effective, increases;
  • When observing the unit cost of measurement, Cmeas = 1, the minimum cost of reactive repair, Crep,r,min, which is still cost effective, slightly decreases with the increase in the probabilities of correct measurement, P (Dno-dep | Tno) and P (Ddep | Tyes); and
  • The same conclusion can be made when observing the increase in the probability of damage once depassivation occurred, P (Dcrack | Ddep), with a rate of decrease being more pronounced.
To broaden the analysis and to overcome some of the limiting presumptions employed in the paper, further actions should be taken:
  • The paper focused on presenting the general procedure of obtaining the VoI for chloride content measurements and the outcome was presented as a ratio of the costs; however, to obtain the VoI of a certain structure or structural element, the real costs of repair and measurements have to be known and analyzed. Furthermore, several measurement and repair strategies and methods should be reviewed and compared in the analysis;
  • The analysis should be broadened to include indirect costs related to the unavailability of the structure due to the repair activities, i.e., additional travel times and distances, together with associated environmental and social impacts;
  • The analysis was performed taking into account only one deterioration phenomenon; however, the analysis should be broadened to take into account all possible deterioration phenomena that can occur, considering the combined effect of certain phenomena;
  • The analysis in the paper did not focus on the exact bridge, bridge element, or exact location on the bridge; rather, the used parameters represent the holistic situation of a general case. However, to perform the analysis, a particular bridge element should be considered, in which the properties related to chloride ingress are homogeneous. In this way, an exact initial probability of depassivation, Pdep, could be determined;
  • Since the accuracy of the measurement method plays an important role in calculating the measurement’s cost-effectiveness, exact properties of the chosen measurement method should be known and considered. Furthermore, spatial variability should be reviewed and taken into account. Based on the accuracy of the measurement method and the spatial variability, the number of taken samples should be adapted;
  • The analysis was based on the decision tree presented in Figure 1. However, the presented decision tree is not definitive, and could be extended to include other events, which were not included here. This includes extending the decision tree to include events of the propagation phase, events of defective repair that can cause damage to the structure, events, such as unsuccessful reactive repair, etc.; and
  • The decision tree was observed as a stationary process, meaning that the probabilities and costs of events were not associated with their duration. However, the time component of all the processes in the decision tree could be taken into account, in order to further investigate in which way the duration of certain events influences the cost efficiency of the measurement.
The main aim of the paper was to present a holistic procedure for pre-posterior analysis in the quantification of the VoI for chloride content measurement, with an associated elaboration of the chloride parameter identification, measuring techniques, and repair methods. In other words, the intention was to show a procedure according to which infrastructure managers and operators can quantify the value and cost effectiveness of a certain step in the life-cycle process, such as measurement of the chloride content. Thus, as such, the paper forms a valuable basis for further research and enhancements in the area of pre-posterior analysis and VoI analysis for reinforced concrete structures affected by the ingress of chlorides.

Author Contributions

Conceptualization, I.Z. and M.P.S.A.; methodology, I.Z., J.C.e.M. and A.S.; software, I.Z.; validation, I.Z. and M.P.S.A., J.C.e.M. and A.S.; formal analysis, I.Z. and M.P.S.A.; investigation, I.Z.; resources, I.Z., J.C.e.M. and A.S.; data curation, I.Z. and M.P.S.A.; writing—original draft preparation, I.Z. and M.P.S.A.; writing—review and editing, I.Z.; visualization, I.Z. and M.P.S.A.; supervision, J.C.e.M. and A.S.; project administration, I.Z.; funding acquisition, I.Z. All authors have contributed substantially to the work reported. All authors have read and agreed to the published version of the manuscript.

Funding

This research received no external funding.

Acknowledgments

The author would like to acknowledge the financial and educational support from the COST TU 1402 Action (www.cost-tu1402.eu), received through the Training School grant.

Conflicts of Interest

The authors declare no conflict of interest.

References

  1. Zambon, I.; Vidović, A.; Strauss, A.; Matos, J.C.; Friedl, N. Prediction of the remaining service life of existing concrete bridges in infrastructural networks based on carbonation and chloride ingress. Smart Struct. Syst. 2018, 21, 305–320. [Google Scholar] [CrossRef]
  2. Zambon, I.; Vidović, A.; Strauss, A.; Matos, J. Condition Prediction of Existing Concrete Bridges as a Combination of Visual Inspection and Analytical Models of Deterioration. Appl. Sci. 2019, 9, 148. [Google Scholar] [CrossRef] [Green Version]
  3. Condition Control and Assessment of Reinforced Concrete Structures Exposed to Corrosive Environment (Carbonation/Chlorides); fib Bulletin 59; International Federation for Structural Concrete (fib): Lausanne, Switzerland, 2011.
  4. Torres-Luque, M.; Bastidas-Arteaga, E.; Schoefs, F.; Sanchez-Silva, M.; Osma, J.F. Non-destructive methods for measuring chloride ingress into concrete: State of-the-art and future challenges. Constr. Build. Mater. 2014, 68, 68–81. [Google Scholar] [CrossRef] [Green Version]
  5. Nilsson, L.-O. Prediction models for chloride ingress and corrosion initiation in concrete structures. In Proceedings of the Nordic Mini Seminar & fib TG 5.5 Meeting, Goteborg, Sweden, 22–23 May 2001. [Google Scholar]
  6. Teply, B.; Chroma, M.; Vořechovská, D.; Rovnanik, P. FReET-D Deterioration Module Program Documentation; Cervenka Consulting: Prague, Czech Republic, 2008. [Google Scholar]
  7. Stipanović Oslaković, I.; Bjegović, D.; Mikulić, D. Evaluation of service life design models on concrete structures exposed to marine environment. Mater. Struct. 2010, 43, 1397–1412. [Google Scholar] [CrossRef]
  8. Pradelle, S.; Thiery, M.; Baroghel-Bouny, V. Comparison of existing chloride ingress models within concretes exposed to seawater. Mater. Struct. 2016, 49, 4497–4516. [Google Scholar] [CrossRef] [Green Version]
  9. Model Code for Concrete Structures 2010; fib Model Code 2010; International Federation for Structural Concrete (fib): Lausanne, Switzerland, 2012.
  10. Model Code for Service Life Design of Concrete Structures; fib Bulletin 34; International Federation for Structural Concrete (fib): Lausanne, Switzerland, 2006.
  11. Benchmarking of Deemed-to-Satisfy Provisions in Standards: Durability of Reinforced Concrete Structures Exposed to Chlorides; fib Bulletin 76; DCC Document Competence Centre Siegmar Kästl e. K.: Ostfildern, Germany, 2015.
  12. Sandberg, P. Report: “Durability of Concrete in Saline Environment—Systematic Collection of Field Data for Service Life Prediction of Concrete Structures”; Cementa AB: Lund, Sweden, 1996. [Google Scholar]
  13. Nilsson, L.-O.; Sandberg, P.; Sørensen, H.E. HETEK Report No. 33: Chloride Penetration into Concrete, State-of-the-ART: Transport Processes, Corrosion Initiation, Test Methods and Prediction Models; Danish Road Directorate: Copenhagen, Denmark, 1996; Report No. 53; ISBN 87-7491-736-6. ISSN 0909-4288. [Google Scholar] [CrossRef]
  14. DuraCRETE. Report: Modelling of Degradation: Probabilistic Performance Based Durability Design of Concrete Structures; EU Project (Brite EuRam III) No. BE95-1347, Report No 4-5; CUR: Gouda, The Netherlands, 1998. [Google Scholar]
  15. Lay, S.; Schießl, P.; Cairns, J. Lifecon Deliverable D 3.2: Instructions on Methodology and Application of Models for the Prediction of the Residual Service Life for Classified Environmental Loads and Types of Structures in Europe, Life Cycle Management of Concrete Infrastructures for Improved Sustainability; (G1RD-CT-2000-00378); European Community; CBM—Technische Universität München: München, Germany, 2003. [Google Scholar]
  16. DARTS—Durable and Reliable Tunnel Structures. Project with Financial Support of the European Commission under the Fifth Framework Program; GROWTH 2000 Project GRDI-25633; COWI A/S: Holstebro, Denmark, 2004. [Google Scholar]
  17. Luping, T. CHLOROTEST, Resistance of Concrete to Chloride Ingress—From Laboratory Tests to In-Field Performance: Guidelines for Practical Use of Methods for Testing the Resistance of Concrete to Chloride Ingress; SP Swedish National Testing and Research Institute: Boras, Sweden, 2005. [Google Scholar]
  18. Life-365. Service Life Prediction Model and Computer Program for Predicting the Service Life and Life-Cycle Cost of Reinforced Concrete Exposed to Chlorides. Life 365 Consortium II. 2012. Available online: http://www.life-365.org/resources.html (accessed on 25 October 2019).
  19. Jung, H.; Park, H.M.; Kim, J.H.; Kim, G.; Kong, J.S. Development of a probabilistic life-cycle cost model for marine structures exposed to chloride attack based on Bayesian approach using monitoring data. KSCE J. Civ. Eng. 2013, 17, 1073–1082. [Google Scholar] [CrossRef]
  20. Tran, T.-B.; Bastidas-Arteaga, E.; Schoefs, F.; Bonnet, S. Bayesian updating for optimization of inspection schedules of chloride ingress into concrete. In Proceedings of the 2nd International Symposium on Uncertainty Quantification and Stochastic Modelling, Rouen, France, 23–27 June 2014; Available online: https://hal.archives-ouvertes.fr/hal-01100565 (accessed on 17 October 2019).
  21. Tran, T.-B.; Bastidas-Arteaga, E.; Schoefs, F. Improved Bayesian Network Configurations for Probabilistic Model Parameters from Accelerated Tests: Application to Chloride Ingress into Concrete. Struct. Infrastruct. Eng. 2016, 12, 1162–1176. [Google Scholar] [CrossRef] [Green Version]
  22. Tran, T.-B.; Bastidas-Arteaga, E.; Schoefs, F. Improved Bayesian network configurations for random variable identification of concrete chlorination models. Mater. Struct. 2016, 49, 4705–4718. [Google Scholar] [CrossRef] [Green Version]
  23. Tran, T.-B.; Bastidas-Arteaga, E.; Schoefs, F. Bayesian Network Framework for Statistical Characterisation of Model Parameters from Accelerated Tests: Application to Chloride Ingress into Concrete. Struct. Infrastruct. Eng. 2017, 14, 580–593. [Google Scholar] [CrossRef]
  24. Memarzadeh, M.; Pozzi, M. Integrated Inspection Scheduling and Maintenance Planning for Infrastructure Systems. Comput. Aided Civ. Infrastruct. Eng. 2016, 31, 403–415. [Google Scholar] [CrossRef]
  25. Straub, D. Value of information analysis with structural reliability methods. Struct. Saf. 2014, 49, 75–85. [Google Scholar] [CrossRef]
  26. Thöns, S. On the Value of Monitoring Information for the Structural Integrity and Risk Management. Comput. Aided Civ. Infrastruct. Eng. 2018, 33, 79–94. [Google Scholar] [CrossRef]
  27. Quantifying the Value of Structural Health Monitoring—COST Action TU 1402. The Action. Available online: http://www.cost-tu1402.eu/ (accessed on 18 December 2019).
  28. Raiffa, H.; Schlaifer, R. Applied Statistical Decision Theory; Harvard University Press: Boston, MA, USA, 1961; ISBN 0-87584-017-5. [Google Scholar]
  29. Thöns, S.; Stewart, M.G. On Decision Optimality of Terrorism Risk Mitigation Measures for Iconic Bridges. Reliab. Eng. Syst. Saf. 2019, 188, 574–583. [Google Scholar] [CrossRef]
  30. Sýkora, M.; Diamantidis, D.; Markova, J.; Masciotta, M.G. Optimising In-Situ Testing for Historic Masonry Structures: A Case Study. In Proceedings of the RILEM Spring Convention and Sustainable Materials, Systems and Structures Conference, Rovinj, Croatia, 18–22 March 2019. [Google Scholar]
  31. Howiacki, T.; Sieńko, R.; Sýkora, M. Reliability Analysis of Serviceability of Long Span Roof Using Measurements and FEM Model. In Proceedings of the International Conference on Numerical Analysis and Applied Mathematics, Rhodes, Greece, 13–18 September 2018; AIP Publishing: Melville, NY, USA, 2019. [Google Scholar]
  32. Giordano, P.F.; Miraglia, S.; Limongelli, M.P. The benefit of permanent monitoring for seismic emergency management. In Proceedings of the SHMII-9th International Conference on Structural Health Monitoring of Intelligent Infrastructures, St. Louis, MO, USA, 4–7 August 2019. [Google Scholar]
  33. Mendoza, J.; Köhler, J. Risk-based Design of an Offshore Wind Turbine using VoI Analysis. In Proceedings of the ICASP13—13th International Conference on Applications of Statistics and Probability in Civil Engineering, Seoul, Korea, 26–30 May 2019. [Google Scholar]
  34. Hunkeler, F. Corrosion in Reinforced Concrete Structures. In Corrosion in Reinforced Concrete: Processes and Mechanisms; Bohni, H., Ed.; Woodhead Publishing Limited: Cambridge, UK, 2005. [Google Scholar]
  35. Collepardi, M.; Marcialis, A.; Turriziani, R. Penetration of Chloride Ions into Cement Pastes. J. Am. Ceram. Soc. 1972, 55, 534–535. [Google Scholar] [CrossRef]
  36. Crank, J. The Mathematics of Diffusion; Calderon Press: Bristol, UK, 1956. [Google Scholar]
  37. Meijers, S.; Bijen, J.; de Borst, R.; Fraaij, A. Computational results of a model for chloride ingress in concrete including convection, drying-wetting cycles and carbonation. Mater. Struct. 2005, 38, 145–154. [Google Scholar] [CrossRef]
  38. Bastidas-Arteaga, E.; Stewart, M. Damage risks and economic assessment of climate adaptation strategies for design of new concrete structures subject to chloride-induced corrosion. Struct. Saf. 2015, 52, 40–53. [Google Scholar] [CrossRef] [Green Version]
  39. Gehlen, C. Probability-Based Service Life Design of Reinforced Concrete Structures—Reliability Studies for Prevention of Reinforced Corrosion; DAfStb Heft 510: Berlin, Germany, 2000. [Google Scholar]
  40. Zambon, I.; Vidovic, A.; Strauss, A.; Matos, J. Use of the chloride ingress model for condition assessment in bridge management. Civ. Eng. 2019, 71, 359–373. [Google Scholar] [CrossRef] [Green Version]
  41. Šomodíková, M.; Strauss, A.; Zambon, I.; Teplý, B. Quantification of parameters for modelling of chloride ion ingress into concrete. Struct. Concr. 2018, 20, 519–536. [Google Scholar] [CrossRef]
  42. Ferreira, R.M. Implications on RC structure performance of model parameter sensitivity: Effect on chlorides. J. Civ. Eng. Manag. 2010, 16, 561–566. [Google Scholar] [CrossRef] [Green Version]
  43. EN 206-1. Concrete—Part 1: Specification, Performance, Production and Conformity; CEN/TC 104 “Concrete and related products”; European Committee for Standardization: Brussels, Belgium, 2013. [Google Scholar]
  44. NT BUILD 443. Nordtest Method: Concrete, Hardened: Accelerated Chloride Penetration; The Nordic Council of Ministers: Copenhagen, Denmark, 1995. [Google Scholar]
  45. NT BUILD 492. Nordtest Method: Concrete, Mortar and Cement-Based Repair Materials: Chloride Migration Coefficient from Non-Steady-State Migration Experiments; The Nordic Council of Ministers: Copenhagen, Denmark, 1999. [Google Scholar]
  46. CEN/TS 12390-11. Testing Hardened Concrete—Part 11: Determination of the Chloride Resistance of Concrete, Unidirectional Diffusion; European Committee for Standardization: Brussels, Belgium, 2010. [Google Scholar]
  47. ISO 1920-11. Testing of Concrete—Part 11: Determination of the Chloride Resistance of Concrete, Unidirectional Diffusion; International Organization for Standardization: Geneva Switzerland, 2013. [Google Scholar]
  48. Atkins, C.; Carter, M.; Scantlebury, J. Sources of error in using silver/silver chloride electrodes to monitor chloride activity in concrete. Cem. Concr. Res. 2001, 31, 1207–1211. [Google Scholar] [CrossRef]
  49. Duffo, G.; Farina, S. Development of an embeddable sensor to monitor the corrosion process of new and existing reinforced concrete structures. Constr. Build. Mater. 2009, 23, 2746–2751. [Google Scholar] [CrossRef]
  50. Basheer, P.; Gilleece, P.; Long, A.; Carter, W. Monitoring electrical resistance of concretes containing alternative cementitious materials to assess their resistance to chloride penetration. Cem. Concr. Compos. 2002, 24, 437–449. [Google Scholar] [CrossRef]
  51. McPolin, D.; Basheer, P.; Long, A.; Grattan, K.; Sun, T. Obtaining progressive chloride profiles in cementitious materials. Constr. Build. Mater. 2005, 19, 666–673. [Google Scholar] [CrossRef]
  52. Li, H.; Li, D.S.; Song, G.B. Recent applications of fiber optic sensors to health monitoring in civil engineering. Eng. Struct. 2004, 26, 1647–1657. [Google Scholar] [CrossRef]
  53. Lam, C.; Mandamparambil, R.; Sun, T.; Grattan, K.; Nanukuttan, S.; Taylor, S.; Basheer, P. Optical fiber refractive index sensor for chloride ion monitoring. Sens. J. 2009, 9, 525–532. [Google Scholar] [CrossRef]
  54. Bonnet, S.; Schoefs, F.; Ricardo, J.; Salta, M. Effect of error measurements of chloride profiles on reliability assessment. In Proceedings of the 10th International Conference on Structural Safety and Reliability, Osaka, Japan, 13–17 September 2009. [Google Scholar]
  55. Bastidas-Arteaga, E.; Schoefs, F. Stochastic improvement of inspection and maintenance of corroding reinforced concrete structures placed in unsaturated environments. Eng. Struct. 2012, 41, 50–62. [Google Scholar] [CrossRef] [Green Version]
  56. RILEM TC 178-TMC. Analysis of total chloride content in concrete. Mater. Struct. 2002, 35, 583–585. [Google Scholar]
  57. Bonnet, S.; Schoefs, F.; Salta, M. Sources of uncertainties for total chloride profile measurements in concrete: Quantization and impact on probability assessment of corrosion initiation. Eur. J. Environ. Civ. Eng. 2017, 24, 232–247. [Google Scholar] [CrossRef] [Green Version]
  58. Matthews, S.; Bigaj-van Vliet, A.; Ueda, T. Conservation of concrete structures according to fib Model Code 2010. Struct. Concr. 2013, 14, 362–377. [Google Scholar] [CrossRef]
  59. EN1504-9:2005. Products and Systems for the Protection and Repair of Concrete Structures—Definitions, Requirements, Quality Control, and Evaluation of Conformity—Part 9: General Principles for the Use of Products and Systems; National Standards Authority of Ireland: Dublin, Ireland, 2008. [Google Scholar]
  60. Raupach, M.; Büttner, T. Concrete Repair to EN 1504: Diagnosis, Design, Principles and Practice; CRC Press—Taylor & Francis Group: Boca Raton, FL, USA, 2014. [Google Scholar]
  61. Matthews, S. CONREPNET: Performance-based approach to the remediation of reinforced concrete structures: Achieving durable repaired concrete structures. J. Build. Apprais. 2007, 3, 6–20. [Google Scholar] [CrossRef] [Green Version]
Figure 1. Decision tree for determining the value of information for chloride measurements, where: (a) represents the events in the decision tree; (b) represents the probabilities of occurrence and associated costs.
Applsci 10 00567 g001
Figure 2. Maximum cost-effective value of measurement, Cmeas,max, expressed for different costs of preventive and reactive repair; for probability of depassivation: (a) Pdep = 0.2; (b) Pdep = 0.4; (c) Pdep = 0.6; (d) Pdep = 0.8.
Applsci 10 00567 g002
Figure 3. Minimum cost of reactive repair, Crep,r,min, for different probabilities of correct measurements, P (Dno-dep | Tno) and P (Ddep | Tyes), given the cost of measurement, Cmeas = 1, and the probability of depassivation, Pdep = 0.6.
Applsci 10 00567 g003
Figure 4. Minimum cost of reactive repair, Crep,r,min, for different probabilities of damage once the depassivation occurred, P (Dcrack | Ddep), given the cost of measurement, Cmeas = 1, and the probability of depassivation, Pdep = 0.6.
Applsci 10 00567 g004
Table 1. Variables and probabilities used for the analysis.
Variable:Description:
PdepInitial probability of depassivation;
P (Dcrack | Ddep)Probability of damage (cracking) given that depassivation occurred;
P (Ddep | Tno)Probability of depassivation given that the measurements indicated no depassivation (inaccuracy of the test);
P (Dno-dep | Tno)Probability of no depassivation given that the measurements indicated no depassivation (accuracy of the test);
P (Ddep | Tyes)Probability of depassivation given that the measurements indicated depassivation (accuracy of the test);
P (Dno-dep | Tyes)Probability of no depassivation given that the measurements indicated depassivation (inaccuracy of the test);
PrepProbability of successful repair;
CmeasCost of measurement (test);
Crep,pCost of proactive repair;
Crep,rCost of reactive repair;
UiTotal cost.
Table 2. Mathematical formulation of the outcomes in the decision tree formulated in Figure 1.
Outcome:Formulation:
Outcome 1E1 = (1 − Pdep) ∗ U1
Outcome 2E2 = Pdep ∗ (1 − P (Dcrack | Ddep)) ∗ U2
Outcome 3E3 = PdepP (Dcrack| Ddep) ∗ U3
Outcome 4E4 = (1 − Pdep) ∗ P (Dno-dep | Tno) ∗ U4
Outcome 5E5= PdepP (Ddep|Tno) ∗ (1 − P (Dcrack | Ddep)) ∗ U5
Outcome 6E6= PdepP (Ddep|Tno) ∗ P (Dcrack | Ddep) ∗ U6
Outcome 7E7= (1 − Pdep) ∗ P (Dno-dep | Tyes) ∗ 1 ∗ U7
Outcome 8E8= PdepP (Ddep | Tyes) ∗ PrepU8
Outcome 9E9= PdepP (Ddep | Tyes) ∗ (1 − Prep) ∗ U9
Table 3. Values of the uncertainty in the decision tree used for the analysis (see Table 1).
Variable:Value [–]
Pdep0.2, 0.4, 0.6, 0.8
P (Dcrack | Ddep)0.80
P (Ddep | Tno)0.10
P (Dno-dep | Tno)0.90
P (Ddep | Tyes)0.90
P (Dno-dep | Tyes)0.10
Prep0.875
Table 4. Obtained constants a0 and a1 in Equations (10) and (11), for different probabilities of depassivation, Pdep.
Pdepa0a1
0.202.148.23
0.401.784.10
0.601.592.74
0.801.522.10

