Author Contributions
Conceptualization, H.W. and X.Y.; methodology, H.W., C.Z., X.Y. and Z.L.; writing, H.W., and X.Y.; project administration, Y.L., C.L., Y.H., X.M. and H.W. All authors have read and agreed to the published version of the manuscript.
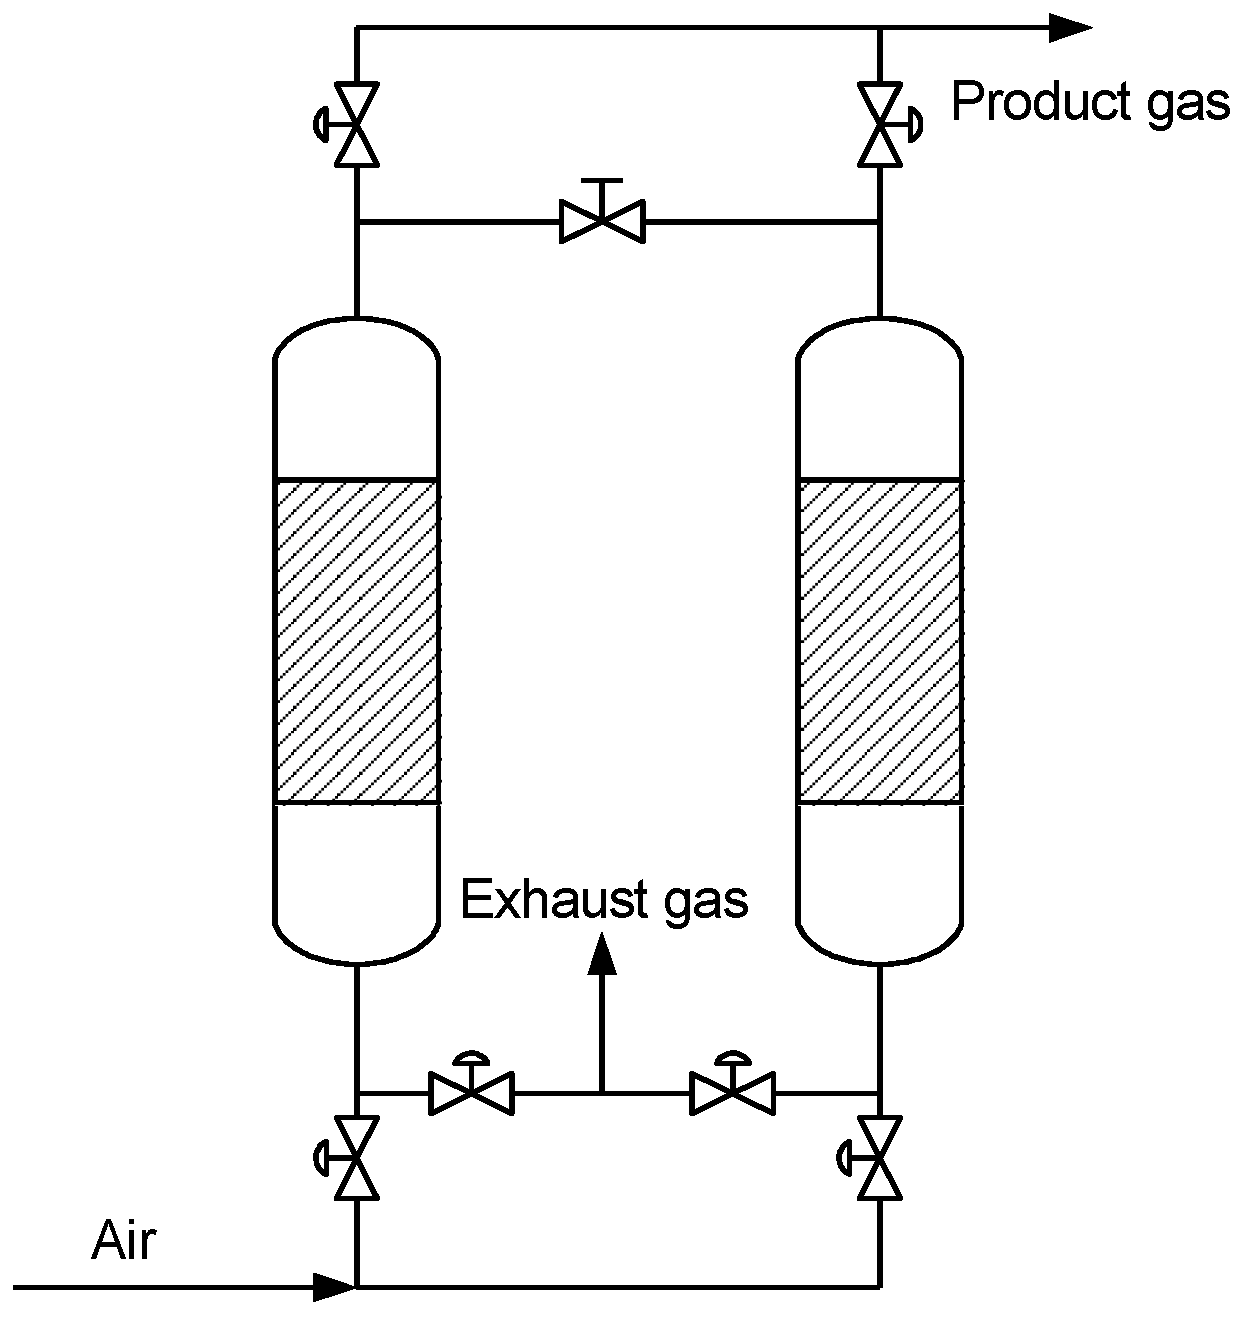
Figure 1.
Schematic of the Skarstrom cycle.
Figure 1.
Schematic of the Skarstrom cycle.
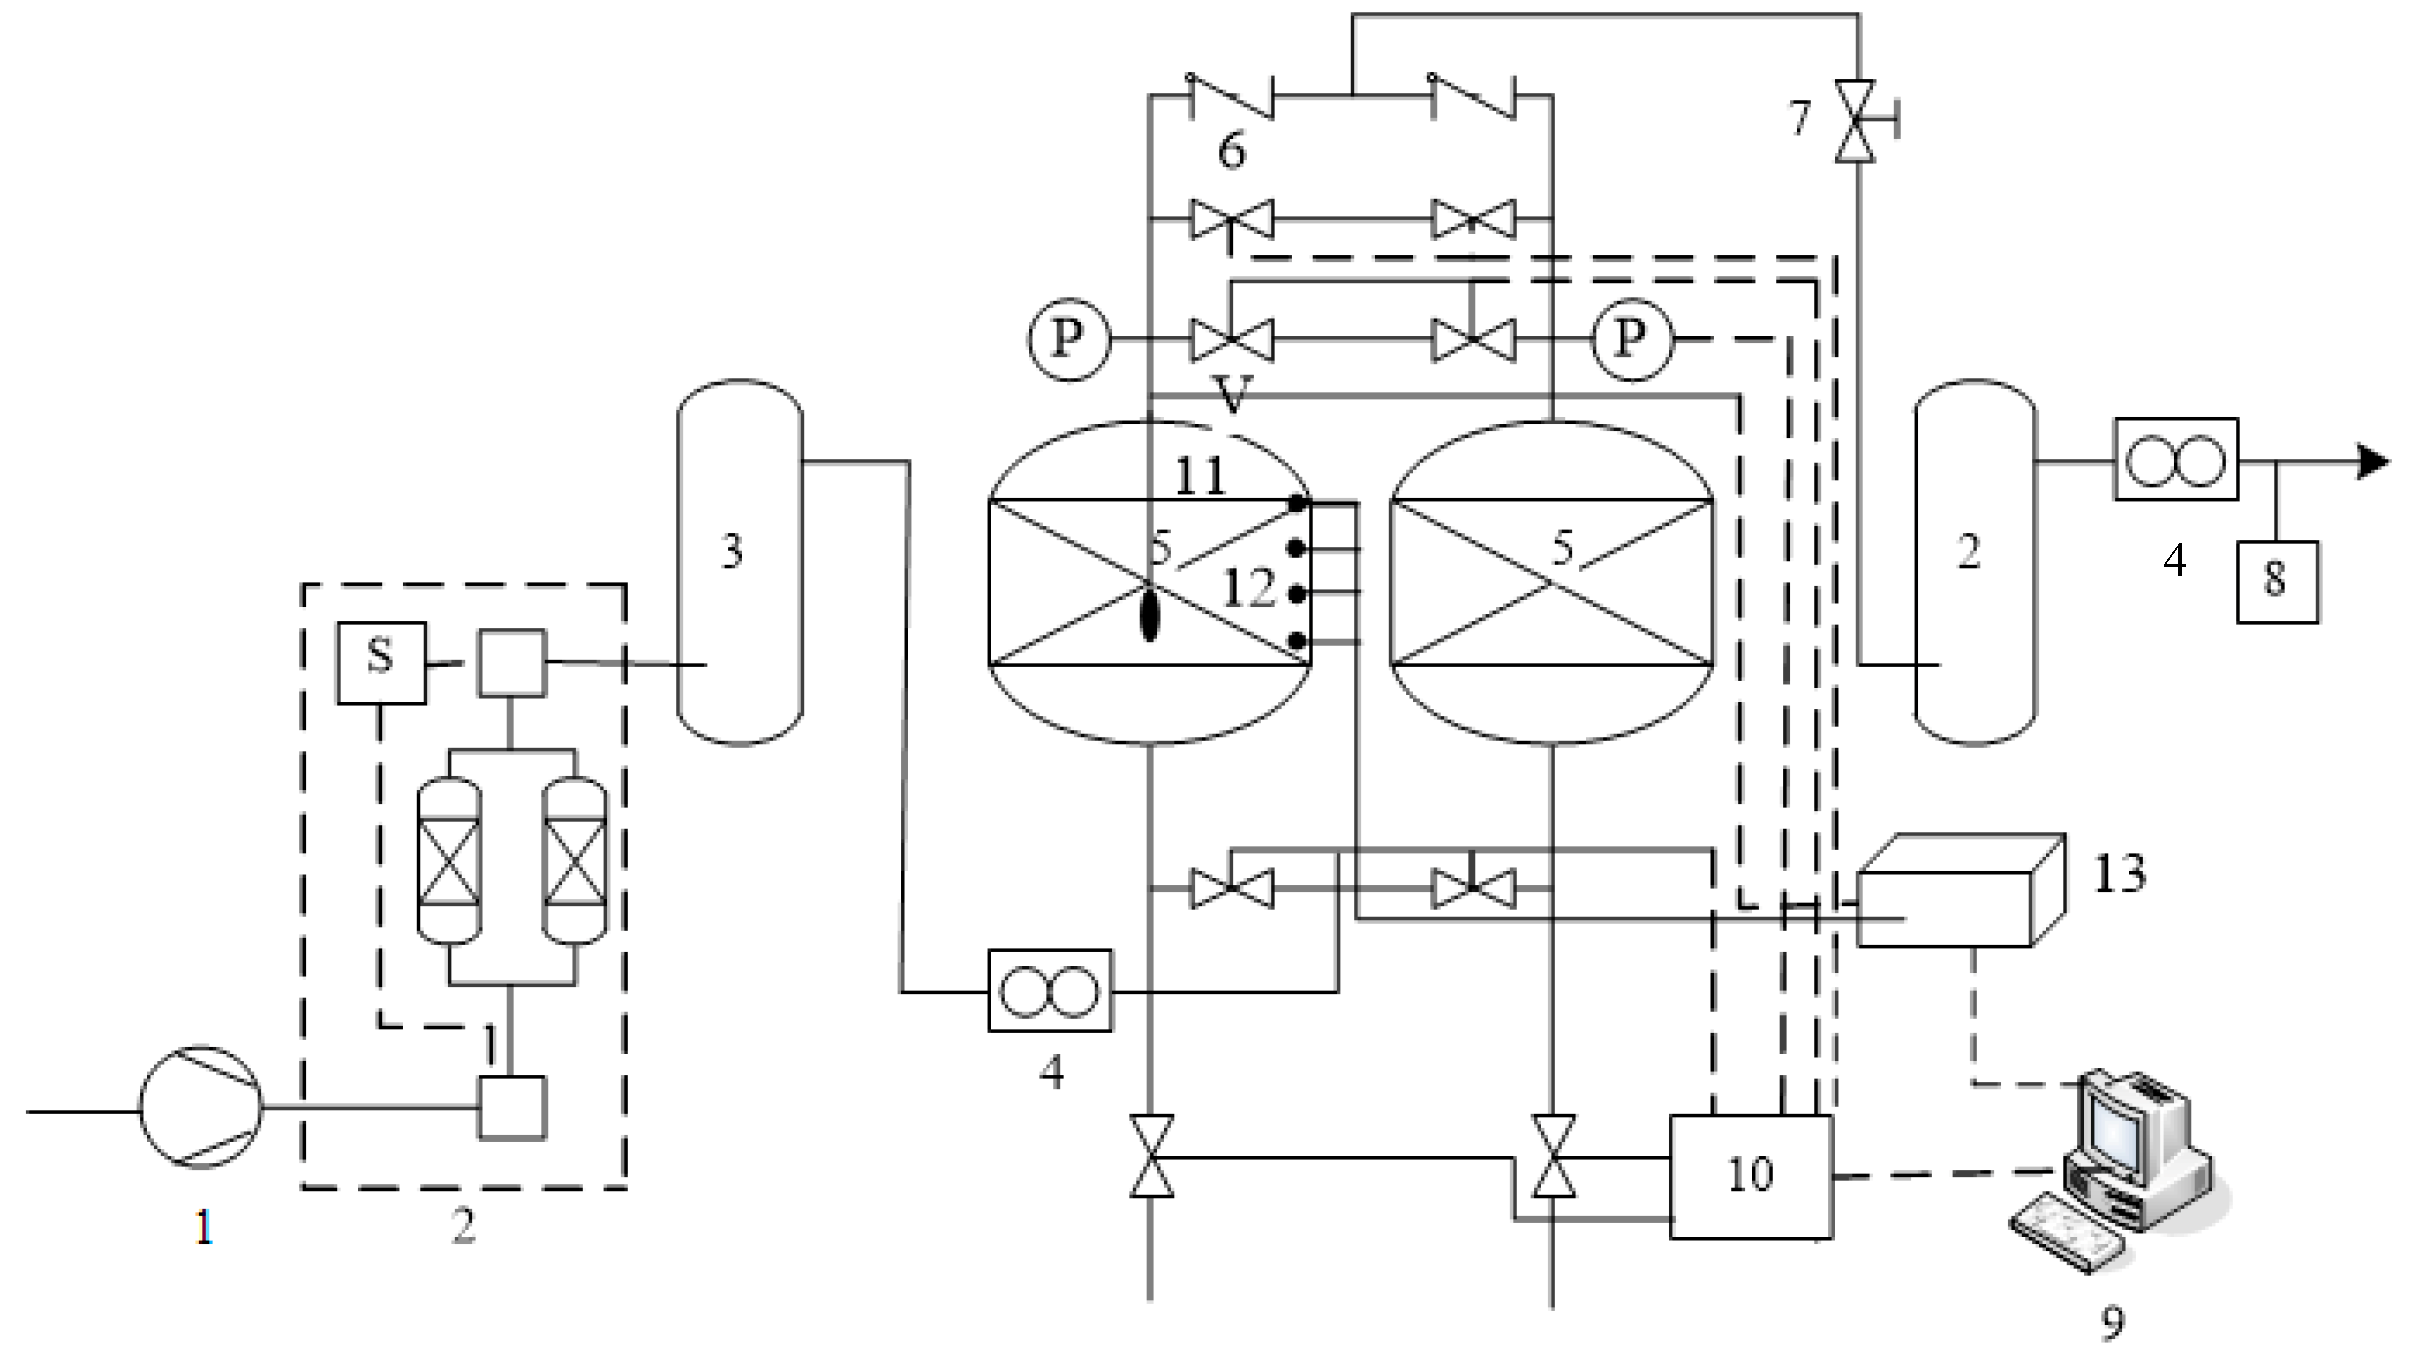
Figure 2.
Schematic of the pressure swing adsorption (PSA) experimental setup. 1—air compressor, 2—pretreatment system (alumina dehydration), 3—feed gas tank, V-solenoid valve, P—pressure sensor, 4—mass flow controller, 5—radial flow adsorber, 6—check valve, 7—throttle valve, 8—Zirconia oxygen analyzer, 9—computer, 10—PLC, 11—differential pressure sensor, 12—pressure sensor, 13—data acquisition system.
Figure 3.
Physical model of the radial flow adsorber of centripetal RFA (CP-π RFA), (a) structure of the CP-π RFA, (b) physical model of the CP-π RFA, (c) the schematic of the CP-π RFA.
Figure 3.
Physical model of the radial flow adsorber of centripetal RFA (CP-π RFA), (a) structure of the CP-π RFA, (b) physical model of the CP-π RFA, (c) the schematic of the CP-π RFA.
Figure 4.
Adsorption isotherms for pure O2 and N2 on LiX zeolite.
Figure 4.
Adsorption isotherms for pure O2 and N2 on LiX zeolite.
Figure 5.
Model grid: (a) overall meshing, (b) partial encryption.
Figure 5.
Model grid: (a) overall meshing, (b) partial encryption.
Figure 6.
Pressure changes in the outer channels of CP-π RFA at the cycle steady state.
Figure 6.
Pressure changes in the outer channels of CP-π RFA at the cycle steady state.
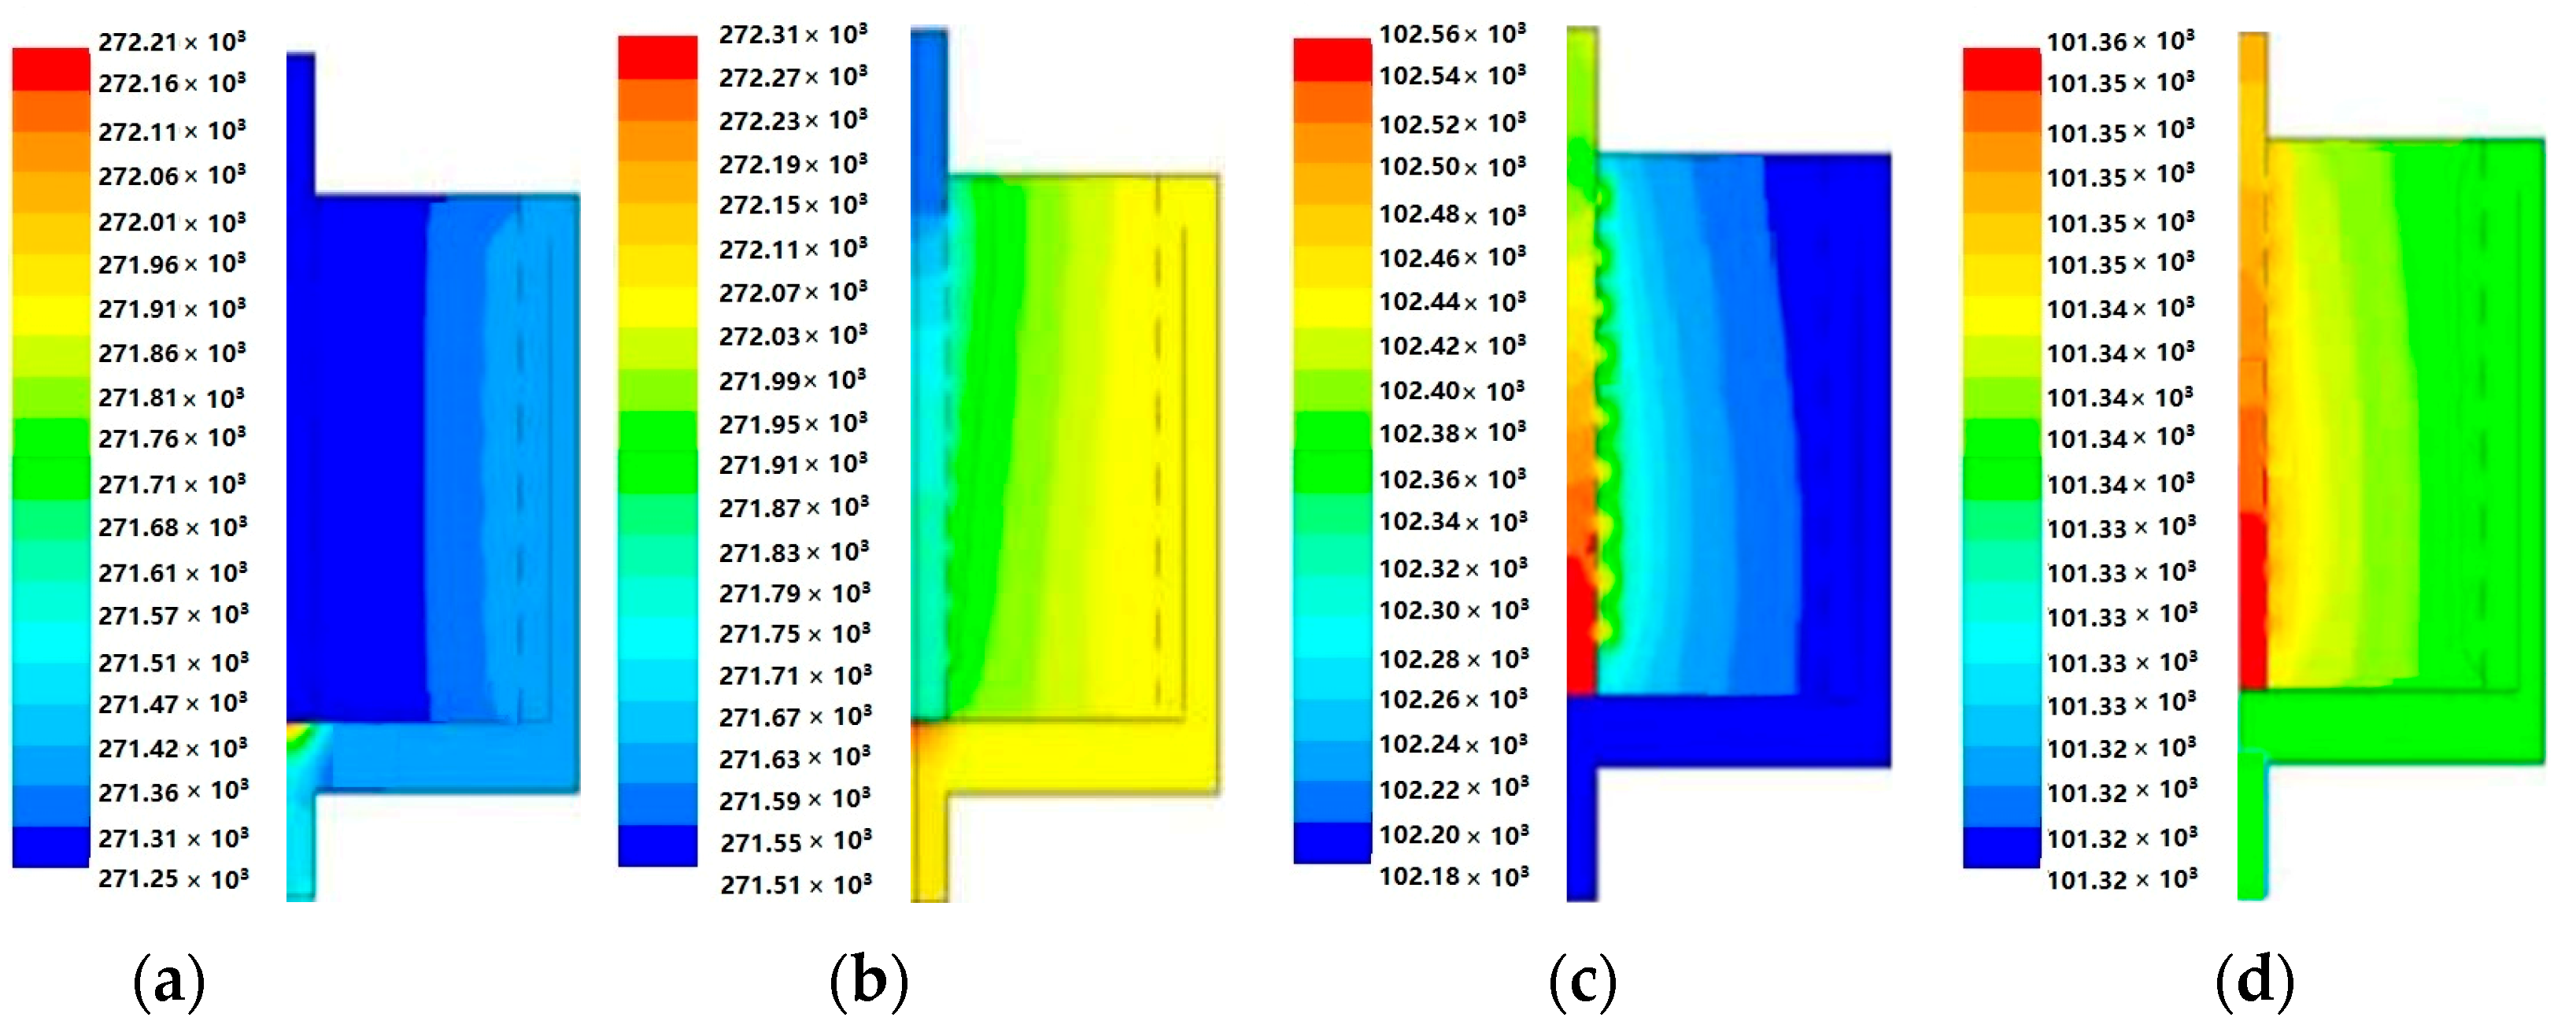
Figure 7.
Pressure changes in the CP-π RFA at the end of steps of the cycle steady state: (a) Pr, (b) Ad, (c) Cb, (d) Pu.
Figure 7.
Pressure changes in the CP-π RFA at the end of steps of the cycle steady state: (a) Pr, (b) Ad, (c) Cb, (d) Pu.
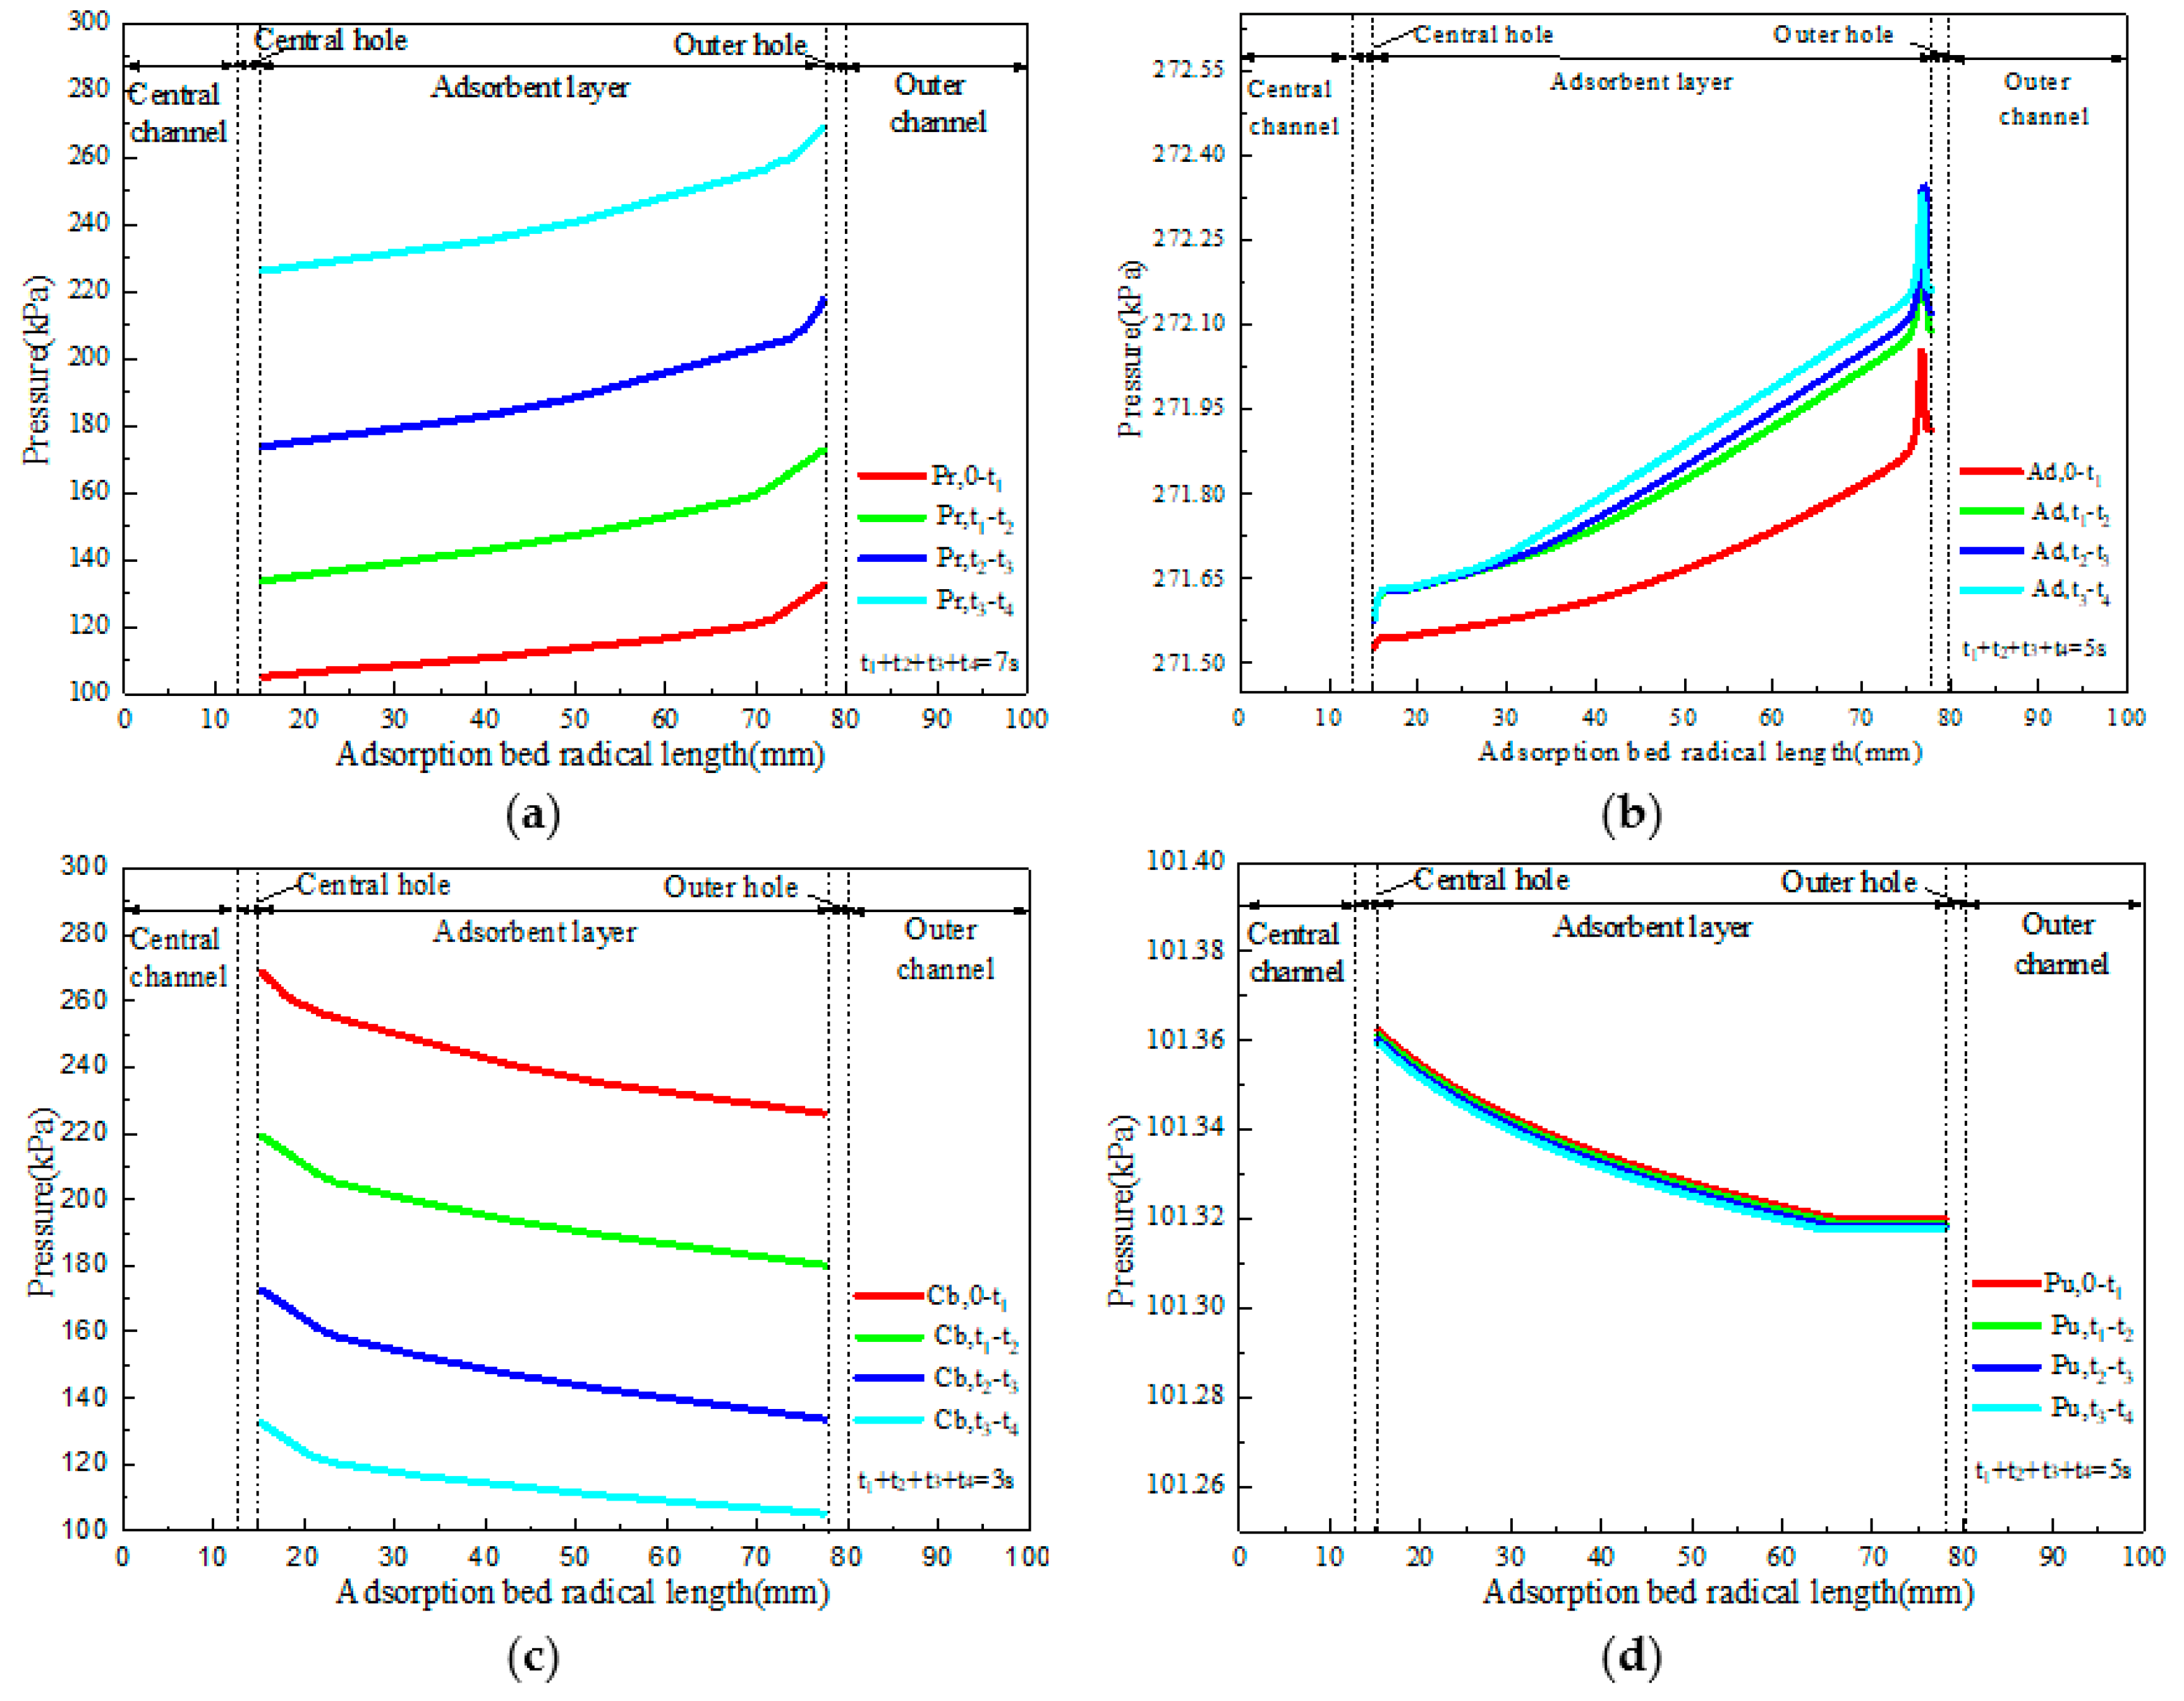
Figure 8.
Pressure profiles in the CP-π RFA in the process of each step of the cycle stead state at the axial central position: (a) Pr, (b) Ad, (c) Cb, (d) Pu.
Figure 8.
Pressure profiles in the CP-π RFA in the process of each step of the cycle stead state at the axial central position: (a) Pr, (b) Ad, (c) Cb, (d) Pu.
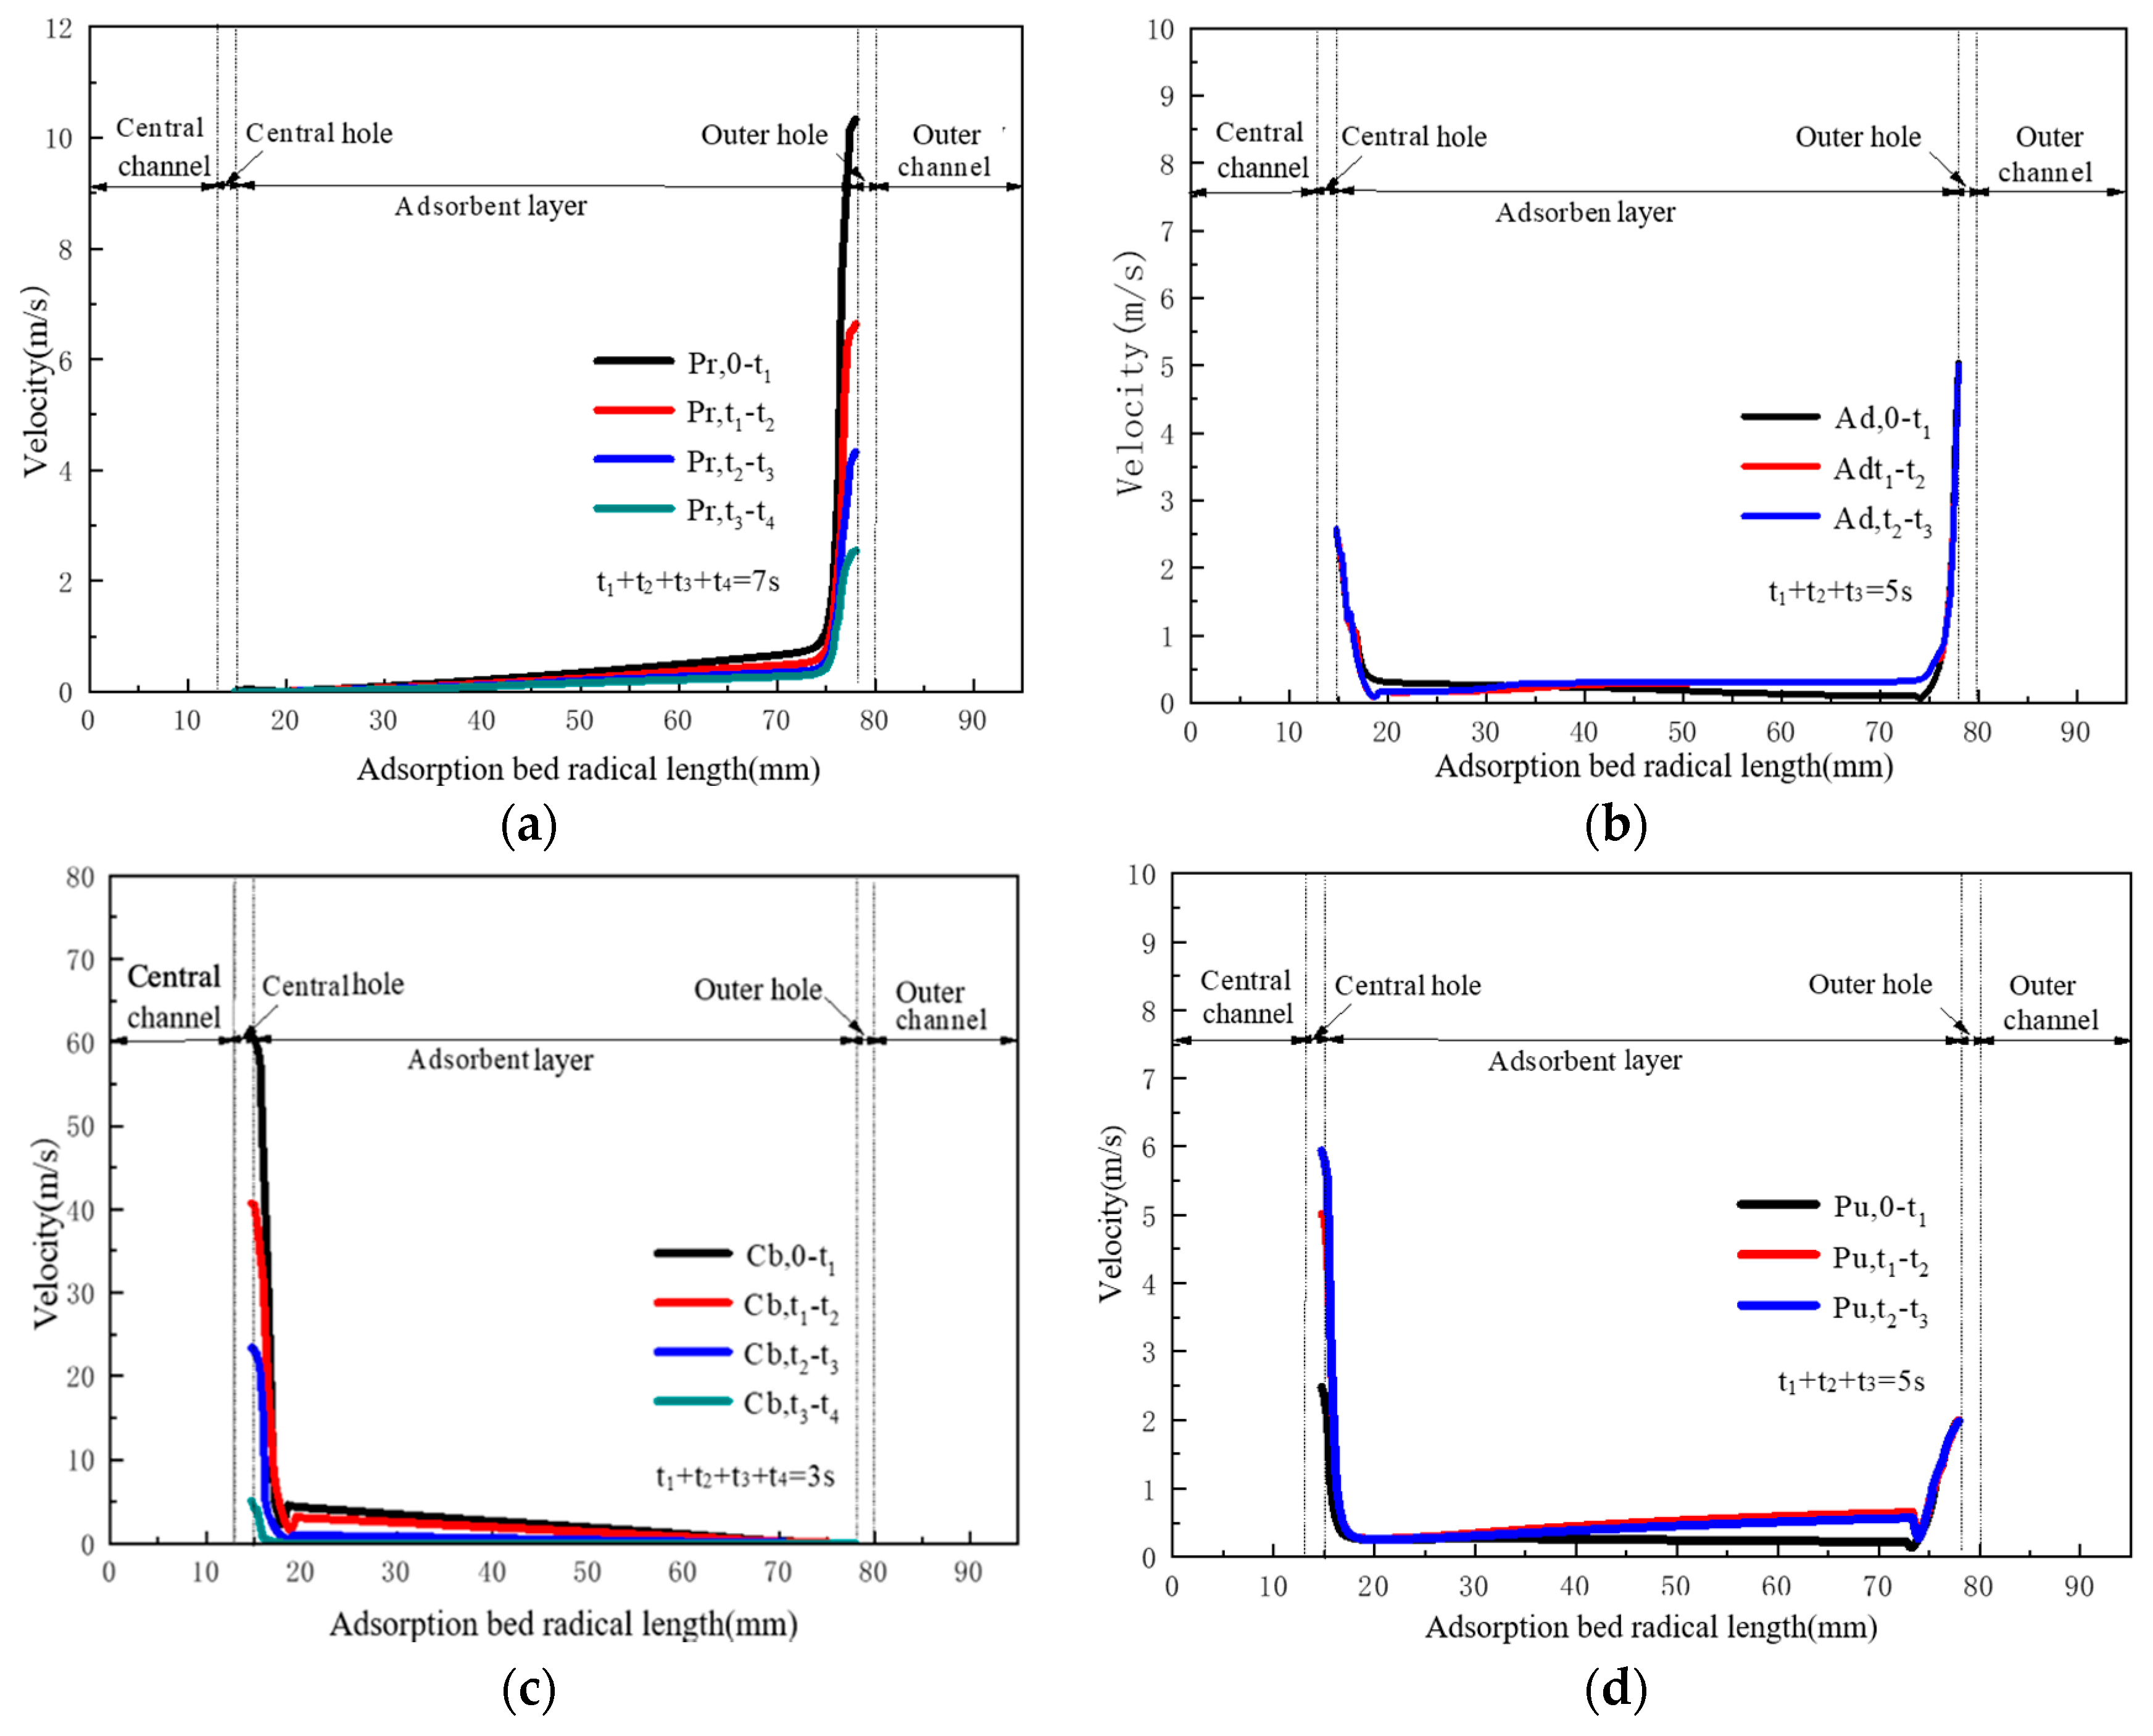
Figure 9.
Velocity profiles in the CP-π RFA in the process of each step of the cycle steady state at the axial central position:(a) Pr, (b) Ad, (c) Cb, (d) Pu.
Figure 9.
Velocity profiles in the CP-π RFA in the process of each step of the cycle steady state at the axial central position:(a) Pr, (b) Ad, (c) Cb, (d) Pu.
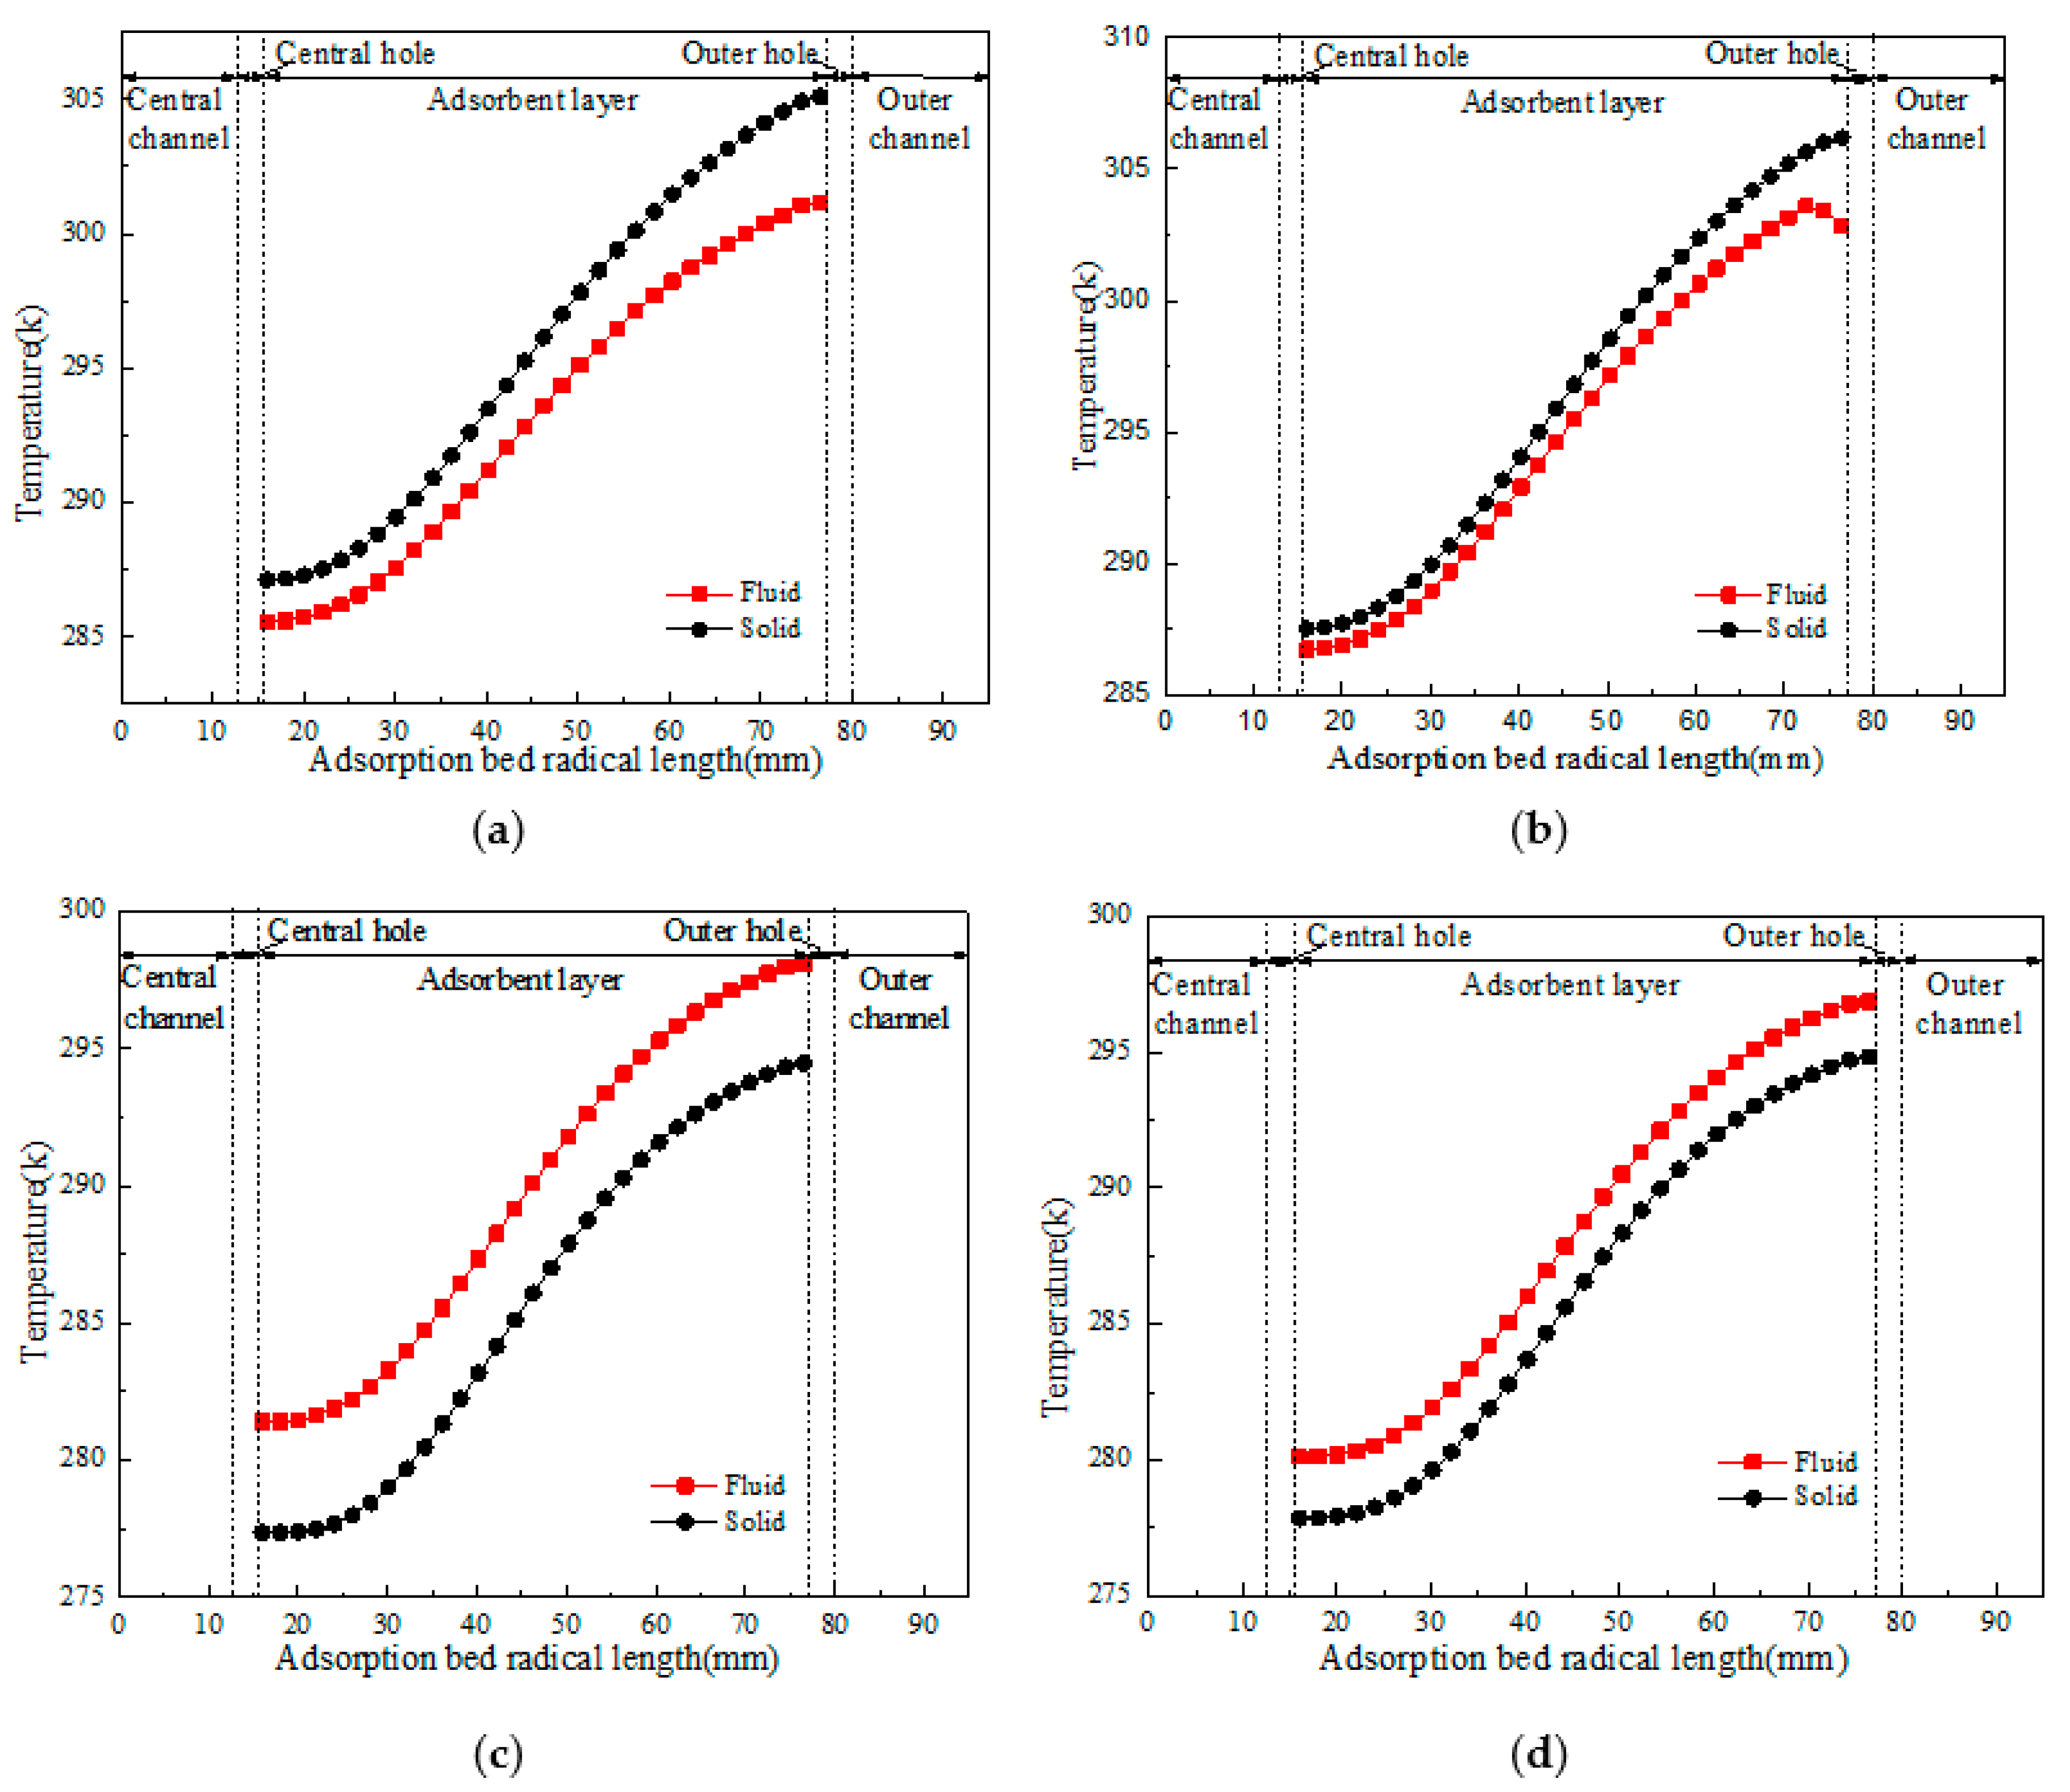
Figure 10.
Comparison of temperature profiles in the CP-π RFA at the end of the four steps of the cycle steady state at the axial central position:(a) Pr, (b) Ad, (c) Cb, (d) Pu.
Figure 10.
Comparison of temperature profiles in the CP-π RFA at the end of the four steps of the cycle steady state at the axial central position:(a) Pr, (b) Ad, (c) Cb, (d) Pu.
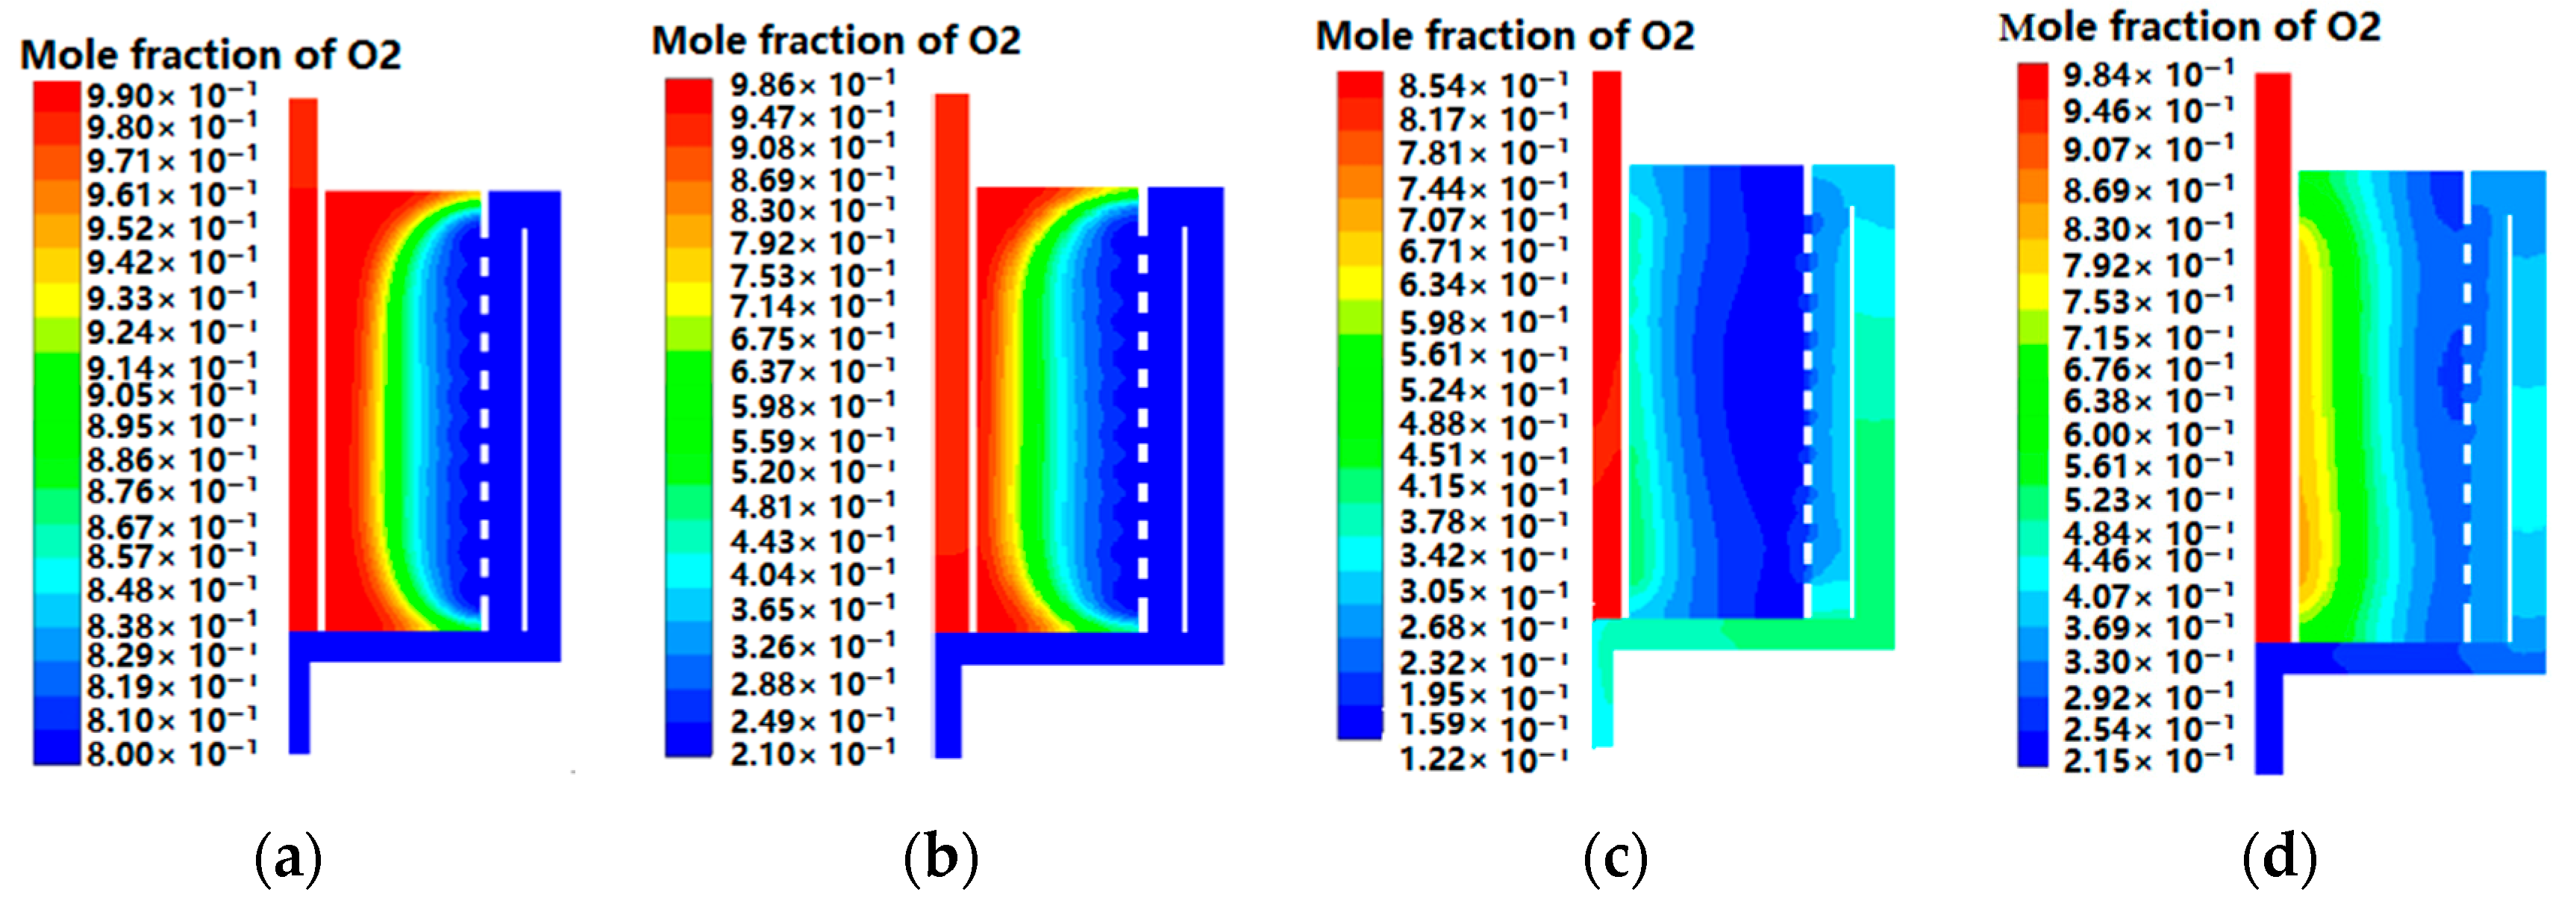
Figure 11.
Oxygen distribution in the CP-π RFA at the end of four steps of the cycle steady state: (a) Pr, (b) Ad, (c) Cb, and (d) Pu.
Figure 11.
Oxygen distribution in the CP-π RFA at the end of four steps of the cycle steady state: (a) Pr, (b) Ad, (c) Cb, and (d) Pu.
Figure 12.
Comparison of axial O2 purity profiles at the end of the 4 steps in the cycle steady state for the CP-π RFA:(a) Pr, (b) Ad, (c) Cb, (d) Pu.
Figure 12.
Comparison of axial O2 purity profiles at the end of the 4 steps in the cycle steady state for the CP-π RFA:(a) Pr, (b) Ad, (c) Cb, (d) Pu.
Figure 13.
Changes of cycle times and product flow rate for the CP-π RFA: (a) changes in oxygen purity with cycles times, (b) changes in oxygen purity with product flow rate.
Figure 13.
Changes of cycle times and product flow rate for the CP-π RFA: (a) changes in oxygen purity with cycles times, (b) changes in oxygen purity with product flow rate.
Table 1.
Parameters of adsorbent particle and adsorbent column.
Table 1.
Parameters of adsorbent particle and adsorbent column.
| Adsorbent | Values | Adsorbent Column | Values |
|---|
| Adsorbent | LiX(CECA-G500) | Bed external porosity | 0.4 |
| Type | Sphere | Dispersion coefficient (m2·s−1) | 5 × 10⁻⁵ [28] |
| Particle radius (mm) | 0.8 | LDF constant for oxygen, kO2 (s−1) | 62.0 [29] |
| Particle density (kg·m3) | 1035 | LDF constant for nitrogen, kN2 (s−1) | 19.7 [29] |
| Heat capacity (J·kg−1·K−1) | 1100 | Ambient temperature (K) | 298 |
| Thermal conductivity (W·m2·K) | 0.2 | | |
Table 2.
Parameters of the CP-π RFA.
Table 2.
Parameters of the CP-π RFA.
| Parameter | Values | Parameter | Values |
|---|
| Molar feed composition | O2-N2(21–79% by volume) | Inner diameter of adsorber (mm) | 211 |
| Diameter of adsorber (mm) | 219 | Adsorption bed width (mm) | 61.5 |
| Sorbent filling height (mm) | 187 | Outer channel width (mm) | 25 |
| Entrance radius (mm) | 12 | Central channel width (mm) | 13 |
| Entrance length (mm) | 40 | Flow distributor width (mm) | 3 |
| Opening ratio of outer channel (%) | 27% | Diameter of central channel hole (mm) | 2 |
| Opening ratio of central channel (%) | 17% | Diameter of outer channel hole (mm) | 8 |
| Vent length(mm) | 40 | Vent radius (mm) | 12 |
Table 3.
Adsorption isotherm parameters.
Table 3.
Adsorption isotherm parameters.
| Adsorbate | k1 (mol·kg−1·Pa−1) | k2 (K) | k3 (Pa−1) | k4 (K) | ΔH (kJ·mol−1) |
|---|
| O2 | 7.87 × 10⁻⁹ | 1541.211 | 6.79 × 10⁻¹⁰ | 1968.24 | 12 |
| N2 | 9.86 × 10⁻⁹ | 2010.908 | 1.67 × 10⁻⁹ | 2250 | 18 |
Table 4.
Initial conditions.
Table 4.
Initial conditions.
| Parameter | Values |
|---|
| Pressure (Pa) | 101,325 |
| Air-temperature (K) | 298 |
| Solid-temperature (K) | 298 |
| Mass fraction of O2 in the gas-phase | 0.233 |
| Amount of O2 adsorbed per unit mass of sorbent (mol·kg−1) | 0.0262832 |
| Amount of N2 adsorbed per unit mass of sorbent (mol·kg−1) | 0.6328067 |
Table 5.
Skarstrom cyclic sequence and boundary conditions for Adsorber 1.


 ,
, 


