Article

Comparison of Different Biofilter Media During Biological Bed Maturation Using Common Carp as a Biogen Donor

Department of Ichthyology and Aquaculture, University of Warmia and Mazury, Al. Warszawska 117A, PL 10-701 Olsztyn, Poland
*
Author to whom correspondence should be addressed.
Appl. Sci. 2020, 10(2), 626; https://doi.org/10.3390/app10020626
Submission received: 3 December 2019 / Revised: 5 January 2020 / Accepted: 7 January 2020 / Published: 15 January 2020

Abstract

:
This experiment analysed the operation of submerged and dripping biological filters with three types of filling: commercial fitting HXF12KLL (CF), two innovative polypropylene aggregates (PPA) and polyethylene screw caps for PET bottles (PSC). The experiment determined the time needed to reach full filter functionality at the maturation stage, the time needed to start successive stages of the nitrification process and the maximum concentration of each nitrogen compound in water in the recirculation systems. The filter operation characteristics after the maturation stage were also examined. These issues are crucial during the preparation and launch of new aquaculture facilities. A literature analysis indicated that the ability of biological filters to oxidise nitrogen compounds is affected by a number of factors. Studies conducted at various centres have covered selected aspects and factors affecting the effectiveness of biological filters. During this study, the model fish common carp (Cyprinus carpio) was used. The current experiment involved examination of biological filter maturation and operation during the carp fry rearing stage, which allowed the biofilter operation characteristics to be determined. At the third day of the experiment, the ammonium concentration reached approximately 3 mg NH4-N/dm3. It remained at this level for 10 days and later decreased below 0.25 mg NH4-N/dm3. The maximum nitrite concentration ranged from 11.7 mg/dm3 to 20.9 mg NO2-N/dm3 within 9 to 20 days and later decreased with time. Nitrate concentrations were seen to increase during the experiment. The all applied biofilter media showed possibility to be used in commercial aquaculture systems.

1. Introduction

Annual fish and seafood consumption has been increasing steadily. The amount of fish and seafood obtained globally is limited and annual output has remained at 90 million tonnes for the past decade. For this reason, any increase in the amount of fish and seafood is associated with aquaculture and its dynamic growth. The production of aquaculture accounted for 44% of the total output in 2014 [1,2]. Installations used for animal production can be classified in regard to the degree of water recirculation: (1) open/flow-through systems, in which water is used once; (2) semi-open/semi-closed systems, in which water is used multiple times before being removed from the system, and (3) closed systems, in which only water loss is replenished. Higher degrees of water recirculation require more complex systems to purify it. RAS denotes technologies of repeated water reuse in a closed system. However, water loss in breeding systems needs to be replenished for multiple reasons, not only because of evaporation. To minimise the need for replenishing water loss, RAS systems are equipped with complex water treatment and purification systems, including mechanical and biological filters, UV sterilisation devices, water ozonation systems and others [3,4]. The most important of these systems are biological filters, which control toxic nitrogen species and are necessary for RAS operation [3,4,5]. The fast increasing of aquaculture production in RAS is not possible without new developed technologies. One of the main focuses is media for biofilters, upon which the effectiveness of nitrification is dependant. This also an influence of biofilter costs, so new and cheaper biofilter media are necessary to involve in further aquaculture production growth [1,2,3,4,5].
The removal of toxic nitrogen from water is affected by nitrification, consisting of the biological oxidation of ammonium nitrogen to nitrite (III) nitrogen, followed by oxidation of the latter to nitrate (V) nitrogen. A crucial role in the nitrification process is played by Nitroso- (oxidation of ammonium to nitrite) and Nitro- (oxidation of nitrite to nitrate) nitrification bacteria [6,7]. Total ammonium nitrogen (TAN) is one of the major limiting factors in the design and operation of RAS systems [8] and is one of the metabolites which is formed in the digestion of proteins and the transformation of amino acids [9] given to fish with feed. It occurs as a sum of two species: dissociated (ammonium ion, NH4+) and undissociated (ammonia, NH3) [8,10]. Ammonium nitrogen in its dissociated form is relatively non-toxic, whereas the undissociated form is highly toxic [8,9,11,12,13,14,15,16,17]. For this reason, it must be controlled [17] and removed from the system or oxidised to a less toxic nitrogen form [8,18]. Ammonia levels in RAS systems are controlled by nitrification [17]. The NH4+/NH3 ratio depends mainly on the environment’s pH. The amount of toxic NH3 increases along with higher pH, depending on the temperature, pressure and salinity. Excessive amounts of ammonia lead to tremors in fish, coma and death [10]. The ammonia removal process is affected by a number of factors. The most important of them is the availability of oxygen (4.57 g of oxygen is needed to oxidise 1 g of ammonium nitrogen) and the rate of its diffusion into the biomembrane [8]. A decrease in water saturation with oxygen results in inhibition of ammonium nitrogen oxidation [19,20]. Important factors also include temperature, pH, salinity and organic matter burden on the biological filter [8]. Nitrite nitrogen are intermediate compounds in nitrification [6,7]. Due to their toxic effect on fish, they are an equally important factor in fish breeding as ammonium nitrogen [7,14,21,22] and are responsible for chronic diseases leading to fish death [7]. Nitrate nitrogen is the last step in the nitrification process [6,7] and has long been regarded as harmless. Recent studies have shown that it should be taken into account when optimising fish breeding. This nitrogen form is relatively harmless, but long-term exposure is suspected of having deadly toxic effects [21,23], although further studies are needed [23]. Analysis of the nitrification process gives the information if the biofilter is matured. In RAS equipped with such a biofilter, the level of ammonium and nitrite concentrations are low and stable [18]. It is especially important for finfish species, which are sensitive to toxic nitrogen compounds, like salmonids [4,6,7,11,12].
The kinetics of the reaction were not studied during the experiment, because the purpose of the study was to examine whether the applied experimental fillers for biological filters are useful in aquaculture. The reaction kinetics study is the next step after confirming the suitability of the filling used. The operation of modern aquaculture systems and their further dynamic growth requires the continuous development of new technologies [24]. It is equally important to keep in mind while developing new technologies or solutions that biological filter operation is affected by a number of factors, e.g., dissolved oxygen and the rate of its diffusion into the biomembrane, temperature, pH, salinity and organic matter burden on the biological filter, which is not always reflected in laboratory tests [7,25,26,27]. Considering the above, a two-step experiment was conducted on a semi-commercial scale, in which submerged and dripping biological filters with three different fillings were used, which are different from each other. CFs (commercial fitting HXF12KLL) have been designed to obtain the largest possible area in a unit of volume. In addition, their spatial structure allows the free flow of water through the centre of individual fittings, which effectively supports nitrification (nitrifiers have constant access to nitrogen compounds). PSCs (polyethylene screw caps for PET bottles) have more than three times smaller surface area per unit volume, but due to their shape, the inflow of nitrogen compounds to the biofilm is greatly facilitated. PPAs (polypropylene aggregate) have the least regular shape. A microscopic photograph reveals a lack of internal spaces on which a bacterial biofilm could develop. However, the outer structure has numerous recesses and protrusions, which are very diverse and provide favourable conditions for the development of nitrifiers. The main donor of nitrogen compounds were common carp Cyprinus carpio juveniles. The study examined the dynamics of nitrogen compound transformations during biological bed maturation and matured bed operation. Moreover, increasing the daily nutrient dose allowed the bed operation to be examined with increasing loads.
A system with submerged filters with commercial fillings was used as a control. During the experiment, the hypothesis was verified that the use of polypropylene aggregate and polyethylene screw caps for PET bottles as fillers for biological filters will achieve the same effects as the use of commercial fittings HXF12KLL.

2. Materials and Methods

The experiment lasted 60 days in the submerged biological bed variant (two days of fish acclimatisation and 58 days of the water parameter measurements) using tap water. The experiment lasted 45 days in the dripping biological bed variant (two days of fish acclimatisation and 43 days of the water parameter measurements). The biological bed maturated during this time, which allowed the dynamics of nitrogen compound transformations in a maturated bed system to be examined. Moreover, increasing the daily nutrient dose allowed the bed operation to be examined with an increasing load. Ammonium, nitrites and nitrates’ concentration in tap water at the beginning of the experiment was 0.045 mg N-NH4/dm3, 0.027 mg N-NO2/dm3 and 0.872 mg N-NO3/dm3.

2.1. Experimental Conditions
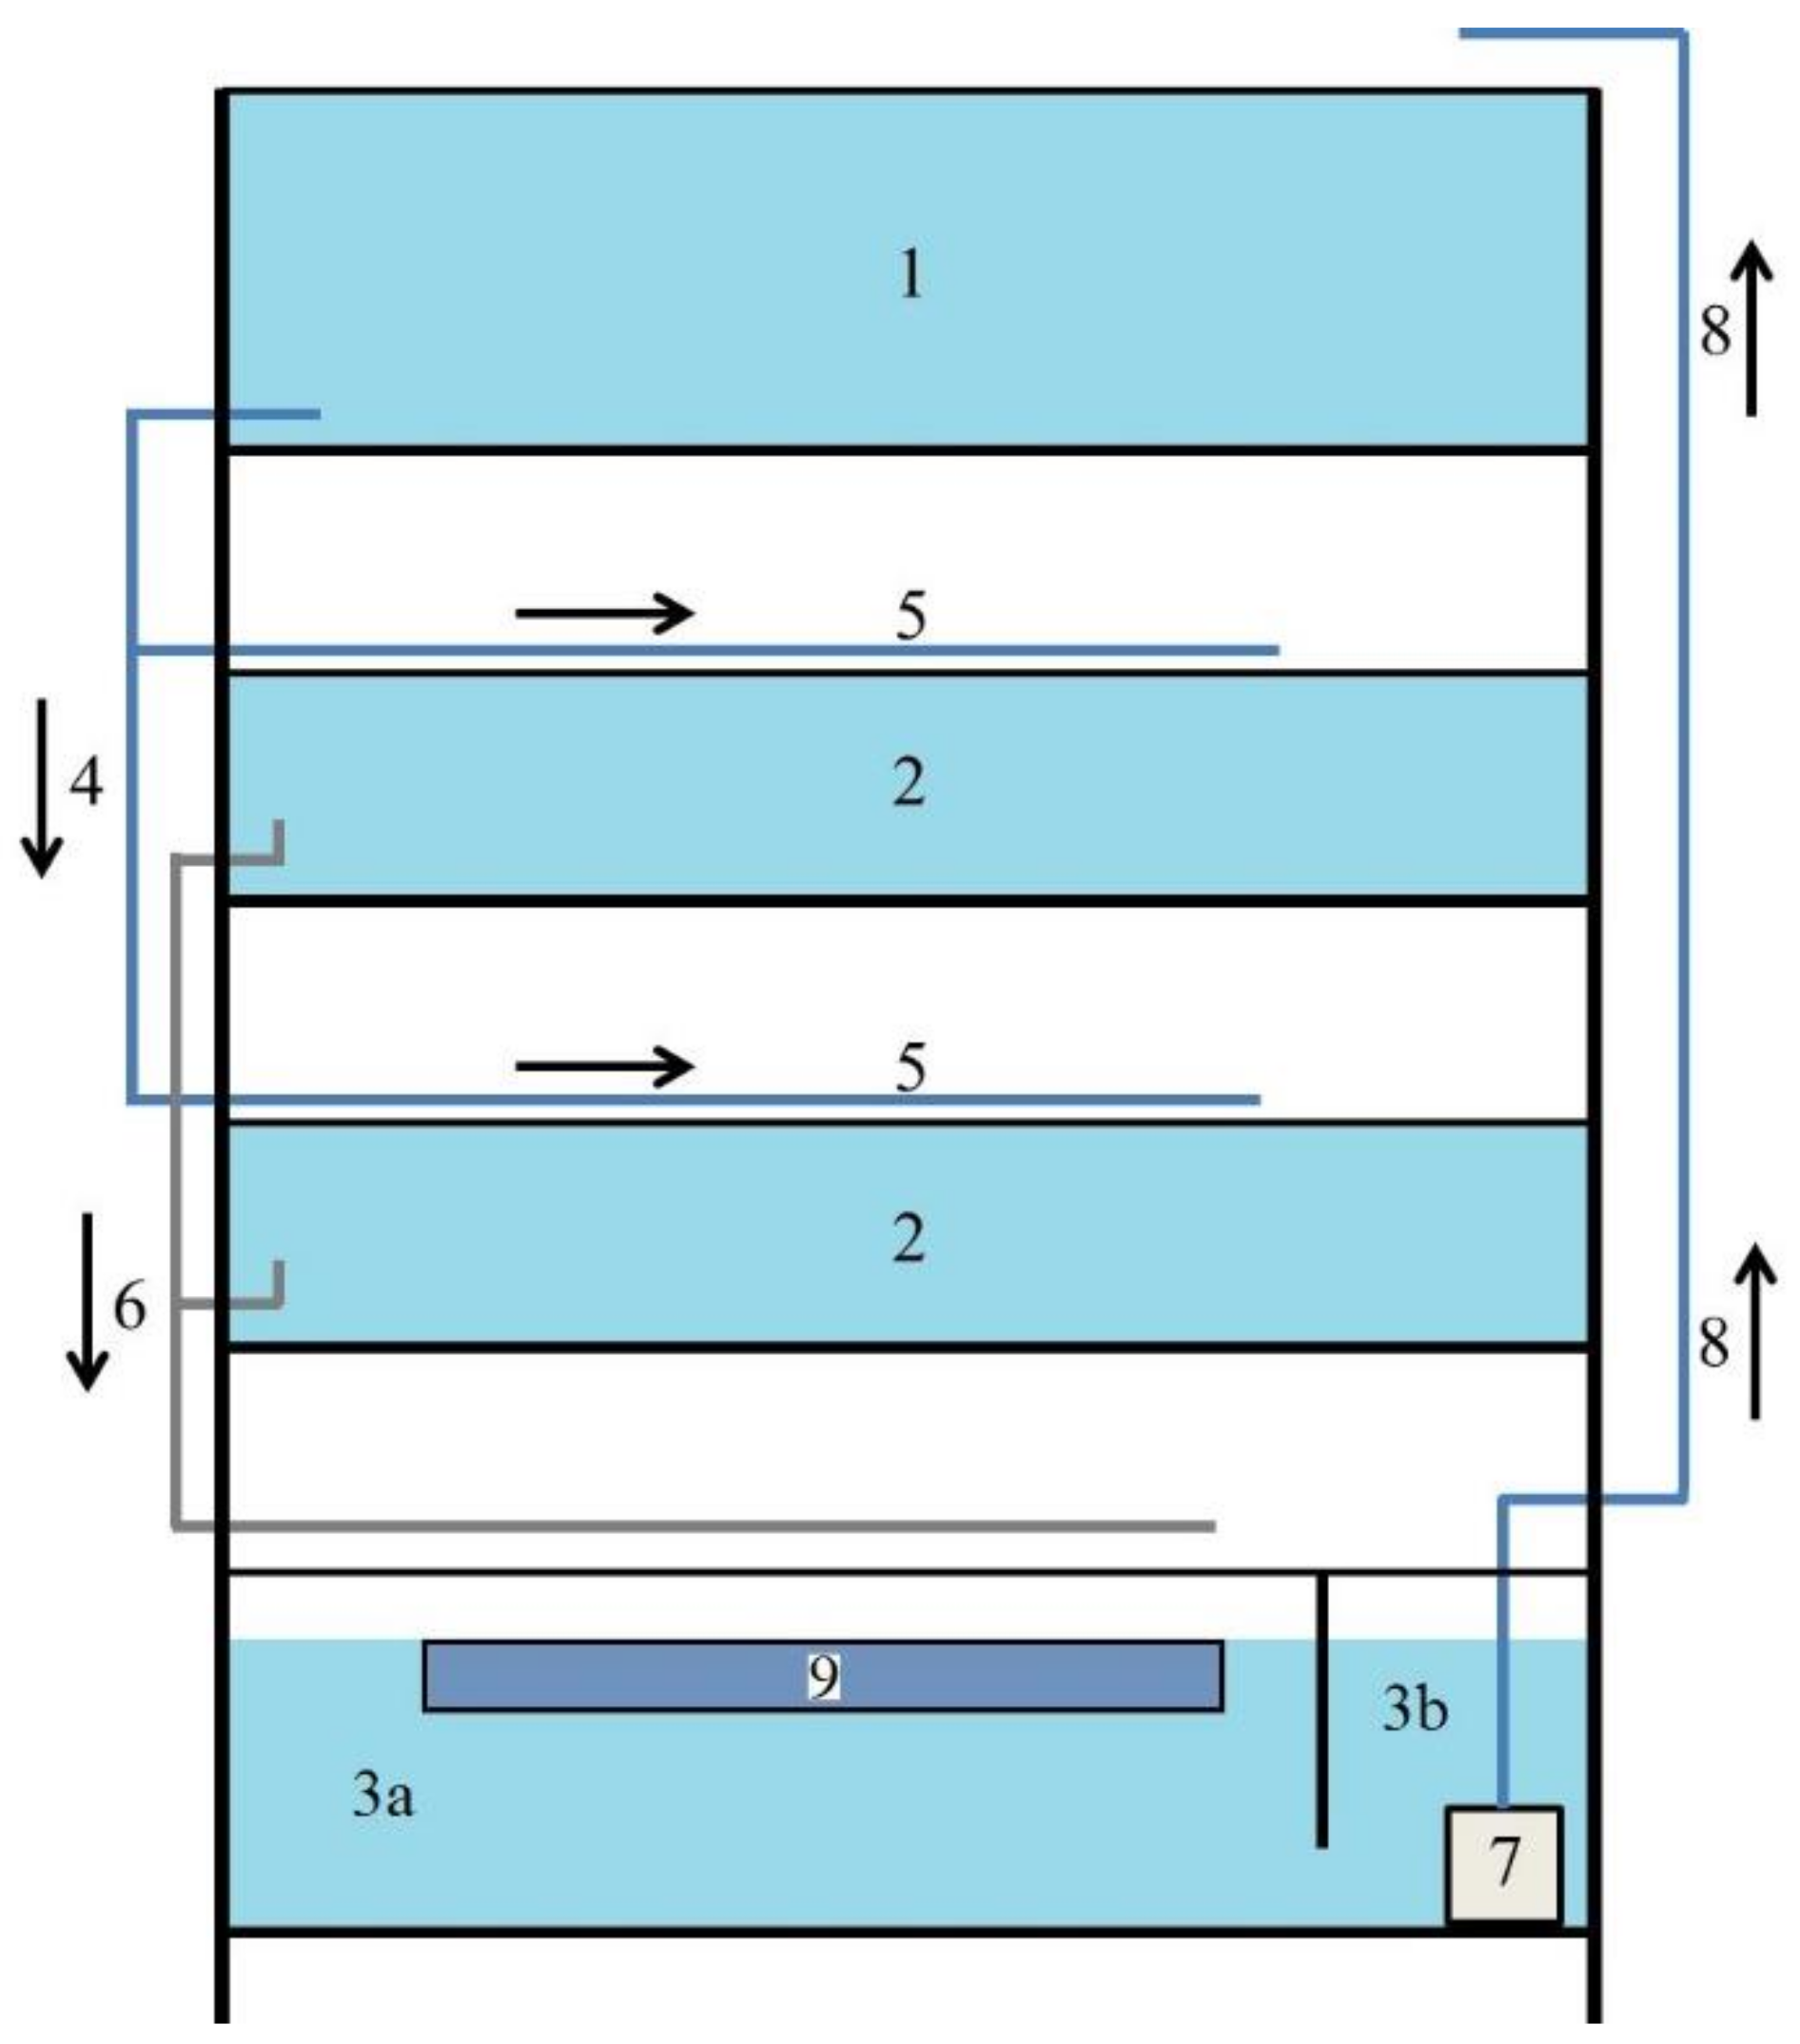
2.1.1. RAS Systems

The experiment was conducted in four identical semi-open RAS systems with 625 dm3 volumes each (daily refill—150 dm3) modelled on devices used by Sikora et al. [18]. Three types of biological filter fillings were examined:
-
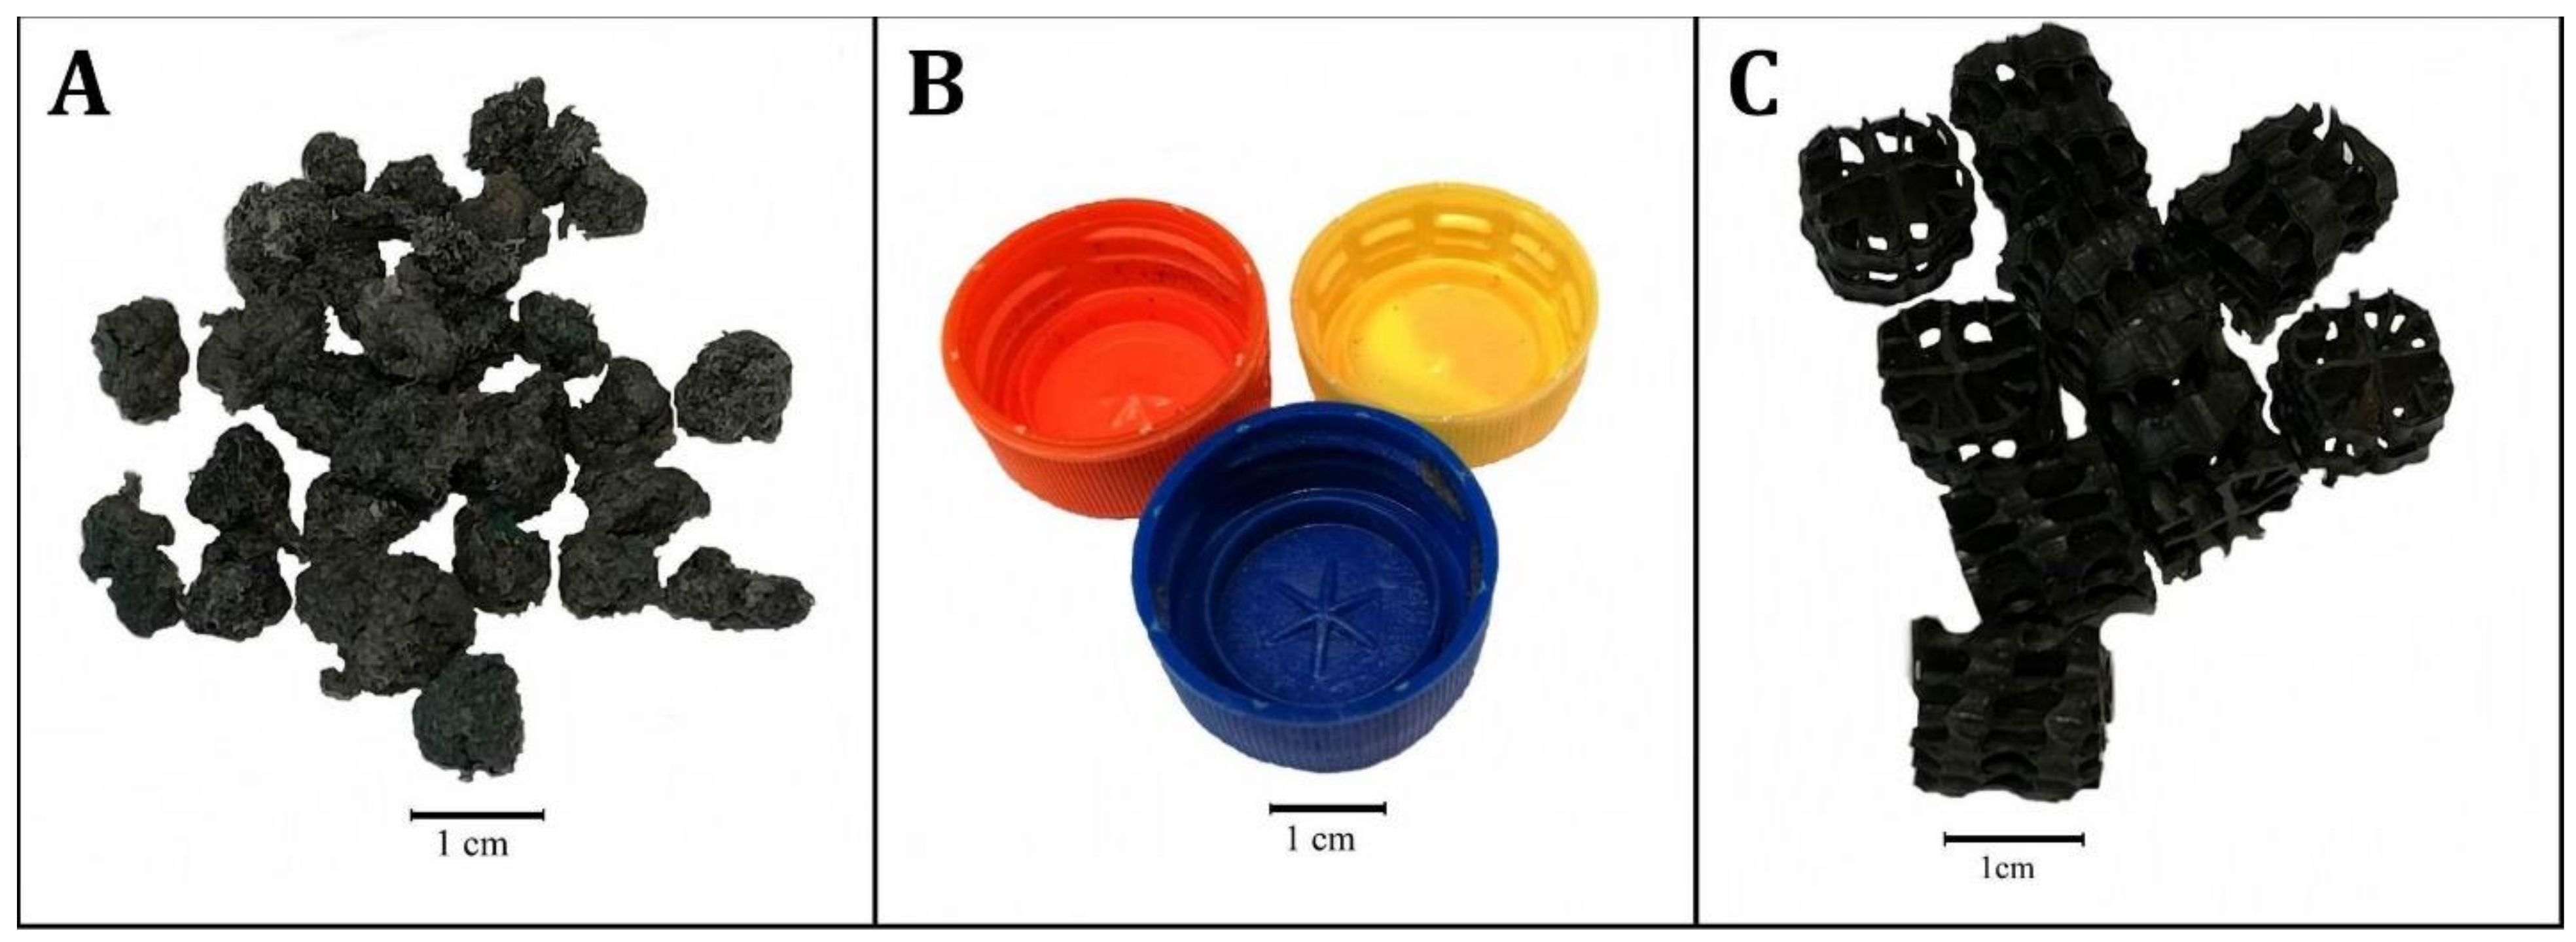
Polypropylene aggregate (PPA) (active surface area 300–500 m2/m3 —manufacturer’s data) (Figure 1A).
-
Polyethylene screw caps for PET bottles (PSC) (active surface area ca. 300 m2/m3) (Figure 1B).
-
Commercial fittings HXF12KLL (CF) (active surface area 859 m2/m3, Stöhr GmhH & Co. KG, Marktrodach, Germany) (Figure 1C).
Each RAS system consisted of: an upper retention reservoir, a two-chamber lower retention reservoir (sedimentation chamber, pump chamber) and two rearing tanks. The systems were also fitted out with heaters, thermostats and aeration systems. The biological filter filling volume was 30 dm3. The specifics surface area of the biological filters used was: PPA—ca. 12 m2, PSC—ca. 9 m2, CF—ca. 25.5 m2. For submerged filters (Figure 2), the filling was placed directly in the sedimentation chamber. The filling was suspended above the sedimentation chamber in the variant with dripping filter (Figure 3), which had sprinklers mounted above them.
The systems were started five days before the fish were put in them to stabilise the conditions in the recirculation systems. The circulating water temperature was 25.0 ± 0.1 °C. Before the experiment, the systems were first thoroughly dried, disinfected with potassium permanganate at 7.5 g per run and then rinsed with water from the water supply system for 24 h.

2.1.2. Fish

Common carp juvenile (Cyprinus carpio), bred at the Department of Lake and River Fisheries of the University of Warmia and Mazury in Olsztyn and cultured under controlled conditions, were used in all experiment as a source of nitrogen compounds. Out-of-season carp breeding was carried out in accordance with the methodology described by Kucharczyk et al. [28], with the insemination method modified by Kucharczyk et al. [29] for burbot (Lota lota), ide (Leuciscus idus) and asp (Aspius aspius). The carp larvae were reared in a recirculation system at 25 ± 0.1 °C and fed brine shrimp (Artemia salina) nauplii for the first 25 days. Artificial feed with a granulation of 0.5–1.1 (Skretting, Norway: raw protein content 54%, fat content 18%) was introduced after that time.
In the submerged biological bed variant, 1379 ± 49 g (average ± SD) of fry with a weight and unit length of 3.76 ± 1.55 g (average ± SD) and 59.00 ± 8.77 mm (average ± SD) were placed in the RAS systems. In the dripping biological bed variant, however, 1400.00 ± 0.00 g fry with a unit weight and length of 16.30 ± 4.80 g and 96.40 ± 9.65 mm were placed in the RAS systems. All fish used during the experiment are juvenile forms of common carp.
The fish (carp) were fed twice daily (at 8.30 and 15.00) during the experiment with an artificial feed with a granulation of 1.1 (Skretting, Norway: raw protein content 54%, fat content 18%) and 1.9 mm (Skretting, Norway: raw protein content 50%, fat content 20%), with a single feeding lasting 30 min. The feeding dose was set at 3% of the daily biomass (half of the daily feeding dose was provided in one feeding). Subsequently, the dose was increased daily by 3% of the initial fish biomass [30,31]. The initial daily feed dose was 20.9 ± 0.5 g (average ± SD).
Sodium chloride was added to circulating water beginning on the day the nitrite nitrogen concentration reached 1 mg N-NO2/dm3. Nitrite shows of affinity to the Cl-/HCO3- ion exchange. As a result, a part of the nitrite is taken up by fish instead of chloride. Increase of chloride concentration in the water reduces nitrite uptake by fish [32].

2.2. Water Quality Measurements

Water tests started two days after the fish were placed in the systems. The water in each system was examined at 11:00 (samples were taken from the sprinkler). Hach Lange cuvette tests with a dedicated DR 5000 spectrophotometer were used for the water testing [18]:
  • Ammonium—cuvette test LCK 304
  • Nitrite—cuvette test LCK 341
  • Nitrate—cuvette test LCK 340
Daily ammonium assays were conducted for the initial 17 days of the experiment. The aim of this test was to check whether the compound accumulates in the water in excessive amounts. After that time, measurements were conducted every three days to monitor the total ammonium concentration in the circulating water. The nitrite concentration was checked daily throughout the experiment to determine the time needed to start stage I of nitrification (oxidation of ammonia to nitrites). The nitrate concentration in the water was tested daily for the first 28 days, after which measurements were conducted every two days to determine the time needed to start stage II of nitrification (oxidation of nitrite nitrogen to nitrate nitrogen).
Moreover, the following water parameters in the bed were measured at 11.00:
-
pH—using a portable pH-meter manufactured by Oxyguard,
-
Oxygen concentration (mg O2/dm3, saturation)—using an oxygen probe, a portable Polaris 2 manufactured by Oxyguard,
-
Temperature—using an oxygen probe, a portable Polaris 2 manufactured by Oxyguard,
Moreover, the following water parameters were tested before the morning and afternoon feeding:
-
Temperature—a probe combined with a thermostat controlling heater work,
-
pH—using a portable pH-meter manufactured by Oxyguard,
-
Oxygen concentration (mg O2/dm3, saturation)—using an oxygen probe, connected with the Total Commander system manufactured by Oxyguard.

2.3. Fish Measurements

The fish were measured (average weight and average total length) at the beginning and end of the experiment. Thirty fish were collected randomly and weighed with an analytical balance (KERN & Sohn GmbH, Balingen, Germany) with an accuracy of 0.1 mg. The fish body lengths were measured with a calliper MEGA 20513 (Profix, Warsaw, Poland) with an accuracy of 0.01 mm. Due to the fish size, their bodies were measured after the experiment with a ruler with an accuracy of 1 mm. Moreover, the fish biomass was determined at both the beginning and end of the experiment (analytical balance KERN & Sohn GmbH, Germany). The fish were anaesthetised during the measurements with an MS222 anaesthetic at a concentration of 50 ppm.

2.4. Statistical Analysis

The dynamics of nitrogen compound (ammonia, nitrites, nitrates) transformations were examined with a Kruskal–Wallis ANOVA test on ranks (p > 0.05) and subsequently by multiple comparisons of mean ranks (p > 0.05) for all samples. The distribution normality was verified with the Shapiro–Wilk test (p > 0.05) before the ANOVA test was performed. All results were analysed statistically using Statistica 13.1 software (StatSoft, Tulsa, Oklahoma, USA). In addition, in order to analyse the nature of individual stages of nitrification, regression equations were performed and the correlation coefficient (R) was calculated.

3. Results

3.1. Variant I—Use of Submerged Biological Filter

3.1.1. Ammonium Nitrogen

At the beginning of the experiment, the ammonium concentration increased rapidly in all experimental RAS and was about 3 mg N-NH4/dm3 from day 3 (Figure 4).
High ammonia levels lasted for several days and then quickly decreased. After this period, until the end of the experiment, no major increases in ammonium were recorded in RAS circuits (Table 1).

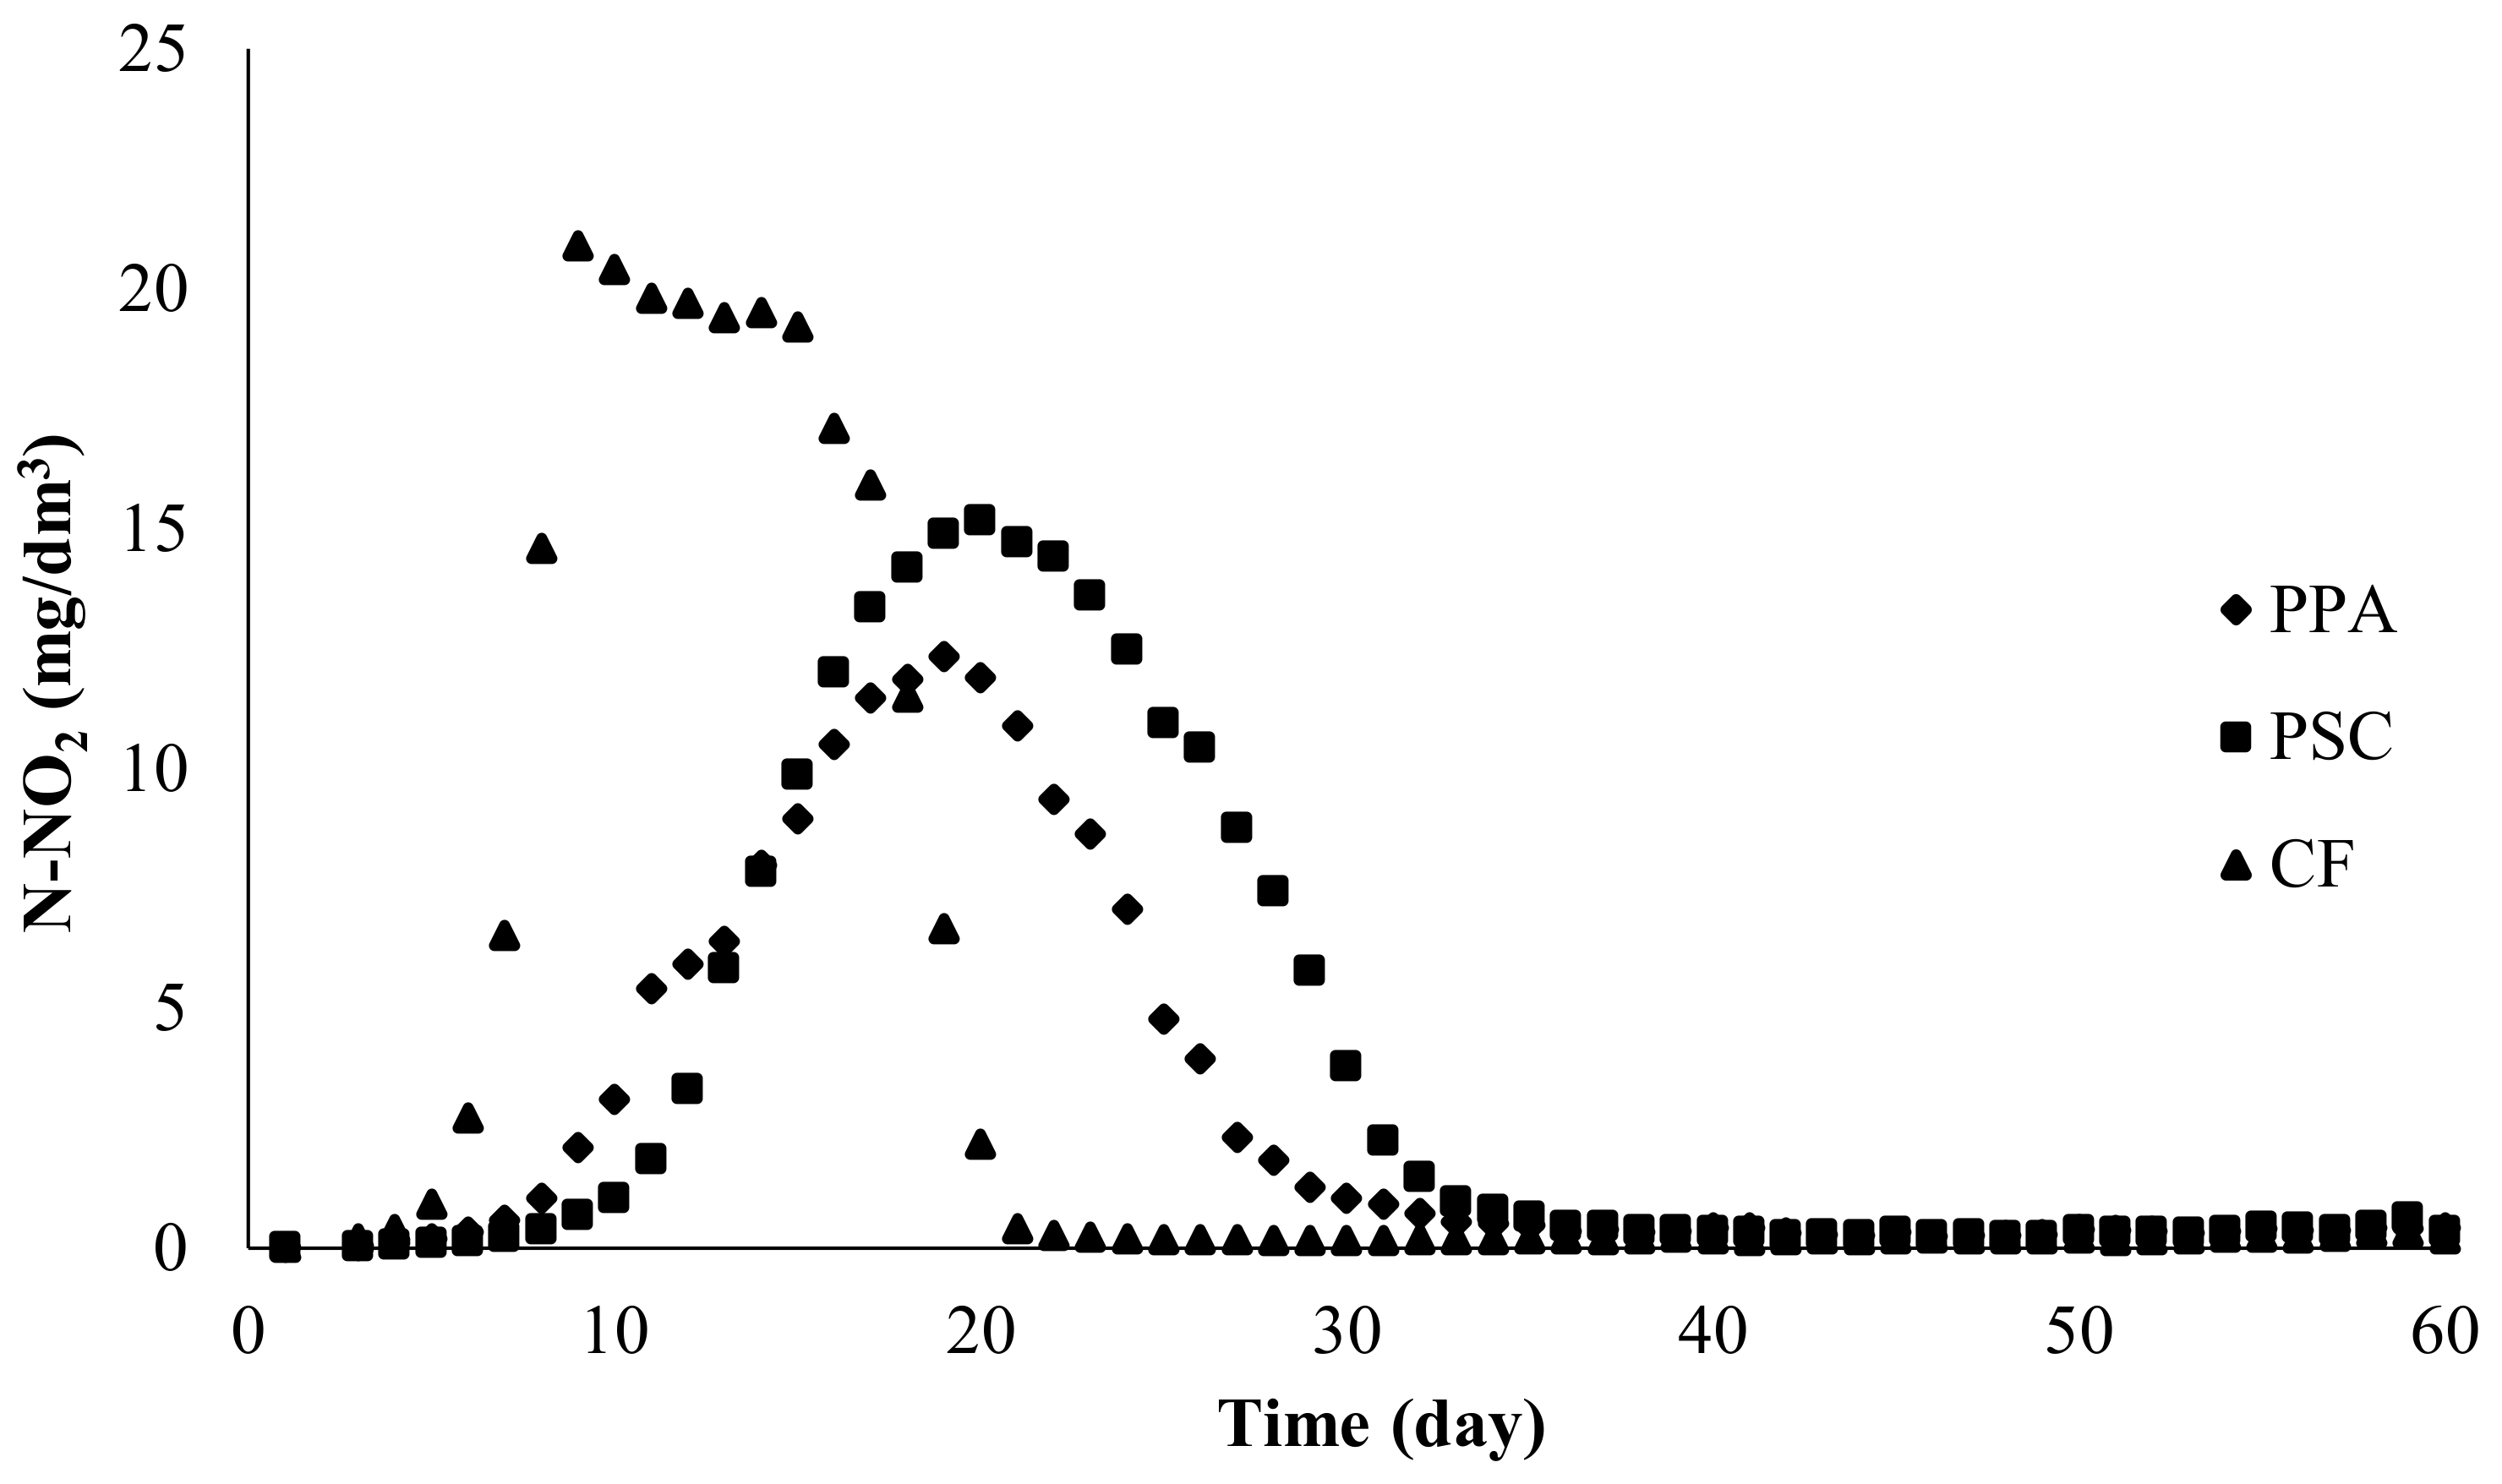
3.1.2. Nitrite Nitrogen

In all RAS, nitrite levels increased for several dozen days until the maximum concentration was reached. After this time, the concentrations decreased until they reached a relatively low and stable level, which remained until the end of the experiment (Figure 5; Table 2).

3.1.3. Nitrate Nitrogen

The nitrate concentration in the system with PPA as the biological filter filling increased until day 53 and reached 32.05 mg N-NO3/dm3. It began to decrease afterwards. A similar trend was observed in the other two experiment variants. The concentration in the PSC system also rose until day 53 to reach a similar level (34.35 mg N-NO3/dm3). The highest concentration in the system with CF filling was higher than in the other two systems (50.40 mg N-NO3/dm3) and it was measured during a shorter time (day 44) (Figure 6).

3.1.4. Other Water Parameters

The average water temperature in the system with PPA was 24.8 ± 0.4 °C, average pH—8.01 ± 0.15, whereas the average concentration of oxygen dissolved in water and saturation were 6.6 ± 0.7 mg O2/dm3 and 79.8 ± 8.7%, respectively. The same parameters in the PSC system were: water temperature 24.8 ± 0.3 °C, pH 8.03 ± 0.15, dissolved oxygen concentration 6.7 ± 0.7 mg O2/dm3, saturation 82.4 ± 8.6%. In the system with CF filling, the parameters were: water temperature 24.8 ± 0.6 °C, pH 8.06 ± 0.14, dissolved oxygen concentration 6.8 ± 0.6 mg O2/dm3 and saturation 81.6 ± 7.2%.

3.2. Variant II—Use of Dripping Filters

The system with a submerged filter with CF filling (CFsf) was used again as the control in the second part of the experiment with dripping filters. There was a failure and leak in the system with the dripping filter filled with CF during this part of the experiment. The system was restarted in accordance with the procedure presented in the methodology.

3.2.1. Ammonium Nitrogen

As in the case of submerged filters, the concentration of ammonium in the experimental RAS systems increased rapidly and from day 3 it was about 3 mg N-NH4/dm3 (Figure 7).
High ammonia levels lasted for several days and then quickly decreased. After this period, no significant increases in RAS ammonium were noted until the end of the experiment (Table 3).
Only in the system in which a failure occurred were other characteristics of ammonium concentrations noted. The highest concentration in the system with CF was recorded on day 3—1.230 mg N-NH4/dm3—and it decreased afterwards. The ammonium concentration decreased below 0.3 mg N-NH4/dm3 after day 8 and until the end of the experiment it fluctuated, with an average concentration of 0.188 ± 0.047 mg N-NH4/dm3 (Figure 7).

3.2.2. Nitrite Nitrogen

In all RAS, nitrite levels increased for several dozen days, until the maximum concentration was reached. After this time, the concentrations decreased until they reached a relatively low and stable level, which remained until the end of the experiment (Figure 8; Table 4).

3.2.3. Nitrate Nitrogen

The nitrate concentration in the system with PPA as the biological filter filling increased until day 44 and reached 32.150 mg N-NO3/dm3. It decreased slightly afterwards. A similar trend was observed in the system with PSC. The highest concentration of 30.00 mg N-NO3/dm3 was observed on day 40 and it decreased slightly afterwards. A different situation was observed in the system with CF. The concentration of nitrate nitrogen increased to 29.800 mg N-NO3/dm3 on day 36; afterwards it decreased until the end of the experiment, reaching 25.00 mg N-NO3/dm3 on the last day. In the system with CFsf, the nitrate concentration increased until day 32 and reached 32.15 mg N-NO3/dm3 and it decreased slightly afterwards (Figure 9).

3.2.4. Other Water Parameters

The average water temperature in the system with PPA was 24.9 ± 0.1 °C, average pH—8.84 ± 0.10, whereas the average concentration of oxygen dissolved in water and saturation was 7.3 ± 0.3 mg O2/dm3 and 88.9 ± 3.8%, respectively. The same parameters in the system with PSC were: water temperature 24.9 ± 0.2 °C, pH 8.82 ± 0.10, dissolved oxygen concentration 7.5 ± 0.4 mg O2/dm3, saturation 92.1 ± 3.9%. In the system with CF, the parameters were: water temperature 25.0 ± 0.3 °C, pH 8.83 ± 0.12, dissolved oxygen concentration 7.0 ± 0.4 mg O2/dm3 and saturation 85.7 ± 4.7%. The parameters in the control system (CFsf) were: water temperature 24.9 ± 0.1 °C, pH 8.74 ± 0.15, dissolved oxygen concentration 7.0 ± 0.3 mg O2/dm3 and saturation 86.1 ± 2.7%.

3.3. Statistical Analysis of Results

The results do not have a normal distribution (p < 0.05, Shapiro–Wilk test). A statistical analysis of the results using a Kruskal–Wallis ANOVA rank test revealed significant differences between the RAS systems (p < 0.05). Detailed results are provided in the table (Table 5).
Analysis of the results of ammonium concentrations in individual RAS allowed the determination of two periods of a different character for which regression equations take a different form. After placing the fish, the concentration of ammonium in individual systems increased. High levels of ammonium were noted from day 3, followed by low ones. There was one day of intermediate values between periods. Increases and decreases of ammonium concentration occurred rapidly. In the case of a system in which a failure occurred and it became necessary to restart it instead of a period with high concentrations, there was a period during which the concentration gradually decreased (Table 1 and Table 3).
The analysis of nitrite concentration resulting in individual RAS allowed the determination of four periods with a different nature of the course. These periods for different RAS systems have a different duration but show a similar nature. In the first period, the regression equation describing the increase in concentration takes the form of an exponential function. In the second period, the concentration initially rose, reached the maximum level and began to decline and the equation takes a polynomial form. In the third period, characterized by a decrease in concentration, the equation takes on a power form. In the fourth period, nitrite concentrations remain at the same level without significant decreases or increases, and the equation again takes on a polynomial form (Table 6a,b).
The concentration of nitrates in RAS systems show a similar tendency. After the initial slow increase in concentration, accelerated growth followed and was then inhibited. An analysis of the obtained results showed a decrease in nitrate concentration at the end of the experiment, which is reflected in the derived regression equations (Table 7).

3.4. Fish

During the experiment, no mortality was observed in the reared fish.

4. Discussion

In the experiment, the dynamics of changes in nitrogen compounds in the water used for rearing fish in semi-closed RAS were analysed in detail. The dynamics of nitrogen compounds (ammonium, nitrite, nitrate) during the maturation of biological filters as well as during the operation of mature filters were examined. Furthermore, the usefulness of PPA and PSC as fillings for biological filters was demonstrated. Due to the differences in construction, all three fillings have their own advantages and disadvantages. Therefore, when comparing fillings, the analysis was based on the analysis of changes in concentrations of nitrogen compounds in water and the time needed to achieve full filter functionality. Comparing structural parameters, especially similar in terms of the size of the active surface of PSC and PPA fillings, could be subjective. The impact of structural parameters should be examined at a later stage of the study, in which the impact of individual factors (e.g., oxygen, temperature, suspense solids, diffusion rate, etc.) would be analysed on the dynamics of the nitrification process. Water exchange is necessary in aquaculture farms using a closed water cycle equipped with biological filters without denitrification due to ever increasing level of nitrate. Denitrification is the process of reducing nitrates to gaseous nitrogen. It is an anaerobic process that can sometimes occur in biological filters overloaded by biogens. The amount of water needed varies depending on several factors. The most important is the increase in nitrate concentration, which in high concentrations shows adverse effects on aquatic organisms [21,23,33]. At the start-up stage of RAS facilities, water change is required for a similar reason. High concentrations of toxic forms of nitrogen occurring during the maturation of biological filters require the use of water changes not only to supplement evaporation. In the experiment, a one-time top-up of 150 dm3 daily was used. This allowed for the dilution of nitrogen compounds and while supplementing calcium compounds in water, it also allowed better observation of the dynamics of nitrogen compound transformation processes. An important factor was also the use of common carp—a model species which is considered to be relatively resistant to adverse environmental rearing conditions [34].
Mechanical and biological filters must work together for the proper functioning of aquatic organisms [7,26,27,35,36]. The importance of the filtration process becomes significant when the breeding facility is built in RAS technology [22,37,38,39,40,41,42]. For the proper course of biological purification in the nitrification process, the cooperation of two groups of microorganisms is required. The first group oxidizes ammonia to nitrites and the other group oxidizes the formed nitrites to nitrates [6,7,43,44,45]. By analysing the concentration of particular forms of nitrogen in the water used during the commissioning of breeding facilities, it is possible to observe individual stages of nitrification and thus determine whether the biological filter has gained functionality [18,45]. The unpredictability of the maturation process was shown in an experiment carried out by Pulkkinen et al. [46] illustrating the effect of the type of biological filter used (fixed and moving bed bioreactors) on nitrification in recirculating aquaculture systems. In that experiment, despite the use of filter fillings operating for six months, the faulty operation of the bed was observed, which was revealed by an initially high concentration of nitrites, whose low level was achieved only after about eleven weeks. According to these authors, such a situation was caused by disturbances in the bacterial composition produced by the shock of transportation to a laboratory. This indicates the exceptional sensibility of nitrifying bacteria to variable environmental conditions. Due to the high concentration of toxic nitrogen compounds, fish rearing in circuits with immature biological filters threatens the loss of fish being reared. This is especially true for salmonids [47]. Therefore, species resistant to elevated concentrations of nitrogen compounds should be used at the start-up stage of aquaculture facilities.
The experiment using fish as a source of compounds needed in the nitrification process allowed observation of the work of the biological filter in conditions simulating real fish breeding [18]. Research carried out in this way is very important to properly carry out the maturation process of the biological filter and obtain a filter adapted to the given conditions in RAS systems. A review of the literature has shown that this approach to the topic is rare [18,48]. Research using synthetic solutions with nitrogen compounds dominates the field [40,49,50]. In this experiment, carp was used as a model species [34] with high metabolism [31].
During the experiment, all systems noted a rapid increase in the ammonium content in water to approximately 3 mg N-NH4/dm3 (Figure 4 and Figure 7; Table 1 and Table 3). The increase in ammonium concentration resulted from placing the fish in the water cycle and starting feeding them. It should be emphasized that carp is a species with very high metabolism [31]. This level persisted from 4 days (submerged filter, CF) to 9 days (submerged filter, PSC) (Figure 4). In other filters, the duration of elevated ammonium concentration in the circuits was 7–8 days. After this period, there was a rapid, several-fold decrease in ammonium concentration in the RAS. It was assumed that the procedure involving the drying of the circuits and their disinfection through the use of potassium permanganate will eliminate nitrifying bacteria. The abrupt increase in ammonium has proved this assumption. Low concentrations persisted until the end of the experiment. In the system that was restarted, the distribution of ammonium concentrations was different (Figure 7). The first recorded results were about 60% lower than in other systems, and there was a rapid decrease in ammonium concentration. The fall curve was much milder. There is a discrepancy between the results obtained for two systems in which submerged filters filled with CF were used (Figure 4 and Figure 7). The duration of elevated ammonium concentration for these systems was four days and eight days. The results during the experiment are divergent from the experiment carried out by Sikora et al. [18], in which no increase in ammonia concentration was observed. Kuhn et al. [45] reported similar results. In their research, they compared the effects of biological filters that were inoculated with nitrifying bacterial cultures with uninoculated filters. In unvaccinated RAS systems, ammonium nitrogen concentrations quickly rose above 2.5 mg/dm3 and then decreased. The time in which the ammonium nitrogen concentration was increasing and decreasing differed for the studied filters. The curves of changes in concentration were also different. In the case of filters inoculated with bacterial cultures, the course was similar to that observed in the system, which was restarted. This example supports the suggestion that nitrifying bacterial cultures remain in this system despite disinfection with potassium permanganate. For studies based on nitrifiers immobilized in PVA (polyvinyl alcohol) and then adapted to the salty environment [51], the time needed to remove the elevated TAN concentration (initial concentration of TAN introduced into bioreactors was 10 mg/dm3) to nitrite ranged from 22 days (salinity 30 ppt) to 26 days (salinity 7.5 ppt). These are longer periods than obtained during the author’s experiment. In 2015, Hu et al. [52] conducted research on the removal of nitrogen compounds from tilapia culture (Oreochromis niloticus) using aquaponic crops (tomato Lycopersicon esculentum and pak choi Brassica campestris L. subsp. chinensis). In these studies, they used root systems of cultured plants as growth surfaces for nitrifying bacteria. During the study, the highest TAN concentrations were reached when the TAN concentrations peaked around day 7 and were around 25 mg/dm3 (tomato) and 32.5 mg/dm3 (pak choi). These concentrations are higher than those observed in the discussed experiment; moreover, they did not decrease to a similar degree in a comparable period of time. This difference is probably due to the smaller root surface area in relation to the effective surface of the applied biological filter medias.
According to Karpinski et al. [53], the increase in nitrite concentration is delayed in relation to the increase in ammonium concentration (Figure 4, Figure 5, Figure 7 and Figure 8; Table 1, Table 3 and Table 6a). In the conducted experiment, an increase in nitrite concentrations was observed from the beginning of the experiment (Figure 5 and Figure 8). Initially, these concentrations were relatively low compared to the observed concentrations of ammonium nitrogen, however, since the growth curve is exponential, the concentration of nitrite increased very quickly (Table 6a). Subsequently, the increase in nitrite concentration slowed down and slightly collapsed, followed by a reversal of the trend observed in the first period. Nitrite concentrations in all RAS systems dropped rapidly, reaching a relatively constant level (Figure 5 and Figure 8, Table 6a,b). This course of concentration changes was observed in all RAS systems except the system in which the failure occurred (Table 6a). In this system, the period of deceleration and collapse of the upward trend does not occur (Table 6b). Maximum concentration values were reached much faster and they began to decrease faster. This is reflected in the equations describing the course of nitrification (Table 6a,b). The time needed to stabilize the second phase of nitrification ranged from 15 to 33 days (Figure 5 and Figure 8). This is different from the results obtained by Kuhn et al. [45]. Despite the fact that measurements were carried out for 28 days, no downward trend was observed. This situation occurred in systems not inoculated with nitrifying bacteria. Different results were obtained in systems inoculated with nitrifiers—no increase in nitrite concentration was observed. In the research conducted by Sikora et al. [18], the time needed to stabilize the second phase of nitrification was 35 days, which is longer than the results observed in this article, although similar. Comparable times to those obtained during the experiment and to those obtained by Sikora et al. [18] were also obtained by Seo et al. [51] during an experiment with the acclimatization of nitrifiers to saltwater conditions. The acclimatization time of biological filters, and thus the time needed for nitrite oxidation to a safe level, was achieved after 33 days (salinity 7.5 and 15 ppt) and 39 days (salinity 30 ppt). Longer nitrite elimination times than observed during the experiment were also reported by Hu et al. [52]. The time needed for oxidation of nitrite to nitrate in aquaponic cultivation was about 40 and 50 days for tomato and pak choi respectively. As in the case of ammonia oxidation, the surface of the roots on which nitrifying bacteria developed was smaller than in the tested biological filter medias.
For nitrates, the recorded concentration values increased from the very beginning of the experiment. Initially, as with nitrites, this increase was slow to eventually accelerate. After a period of dynamic growth, nitrate concentrations stabilized (Figure 6 and Figure 9; Table 7). For CF, despite the similar nature of the increase curve, the concentrations were higher during the first part of the experiment. No similar trend was observed for the same type of filter in the second part of the experiment (Figure 6 and Figure 9). Higher values in the initial phase of growth in the second part of the experiment show the concentrations in the RAS system in which the failure occurred (Figure 9). The similar nature of the increase in nitrate concentration was reported by both Kuhn et al. [45] (circulation vaccinated with nitrifying bacteria) and Sikora et al. [18]. Kuhn et al. [45] did not observe an increase in the concentration of nitrates in the RAS system inoculated with nitrification, which was associated with the incomplete nitrification process. The nitrate concentration increase curve presented by Seo et al. [51] was comparable to the present experiment. At the end of the experiment, a decrease in nitrate concentration was observed in individual RAS systems. Probably this decrease was associated with the development of heterotrophic bacteria in the volume of water.
During this experiment, it was analysed how the concentrations of nitrogen forms in water are shaped in experimental RAS systems. On this basis, the course of the nitrification process was determined along with the time needed for the biological filter to mature. The maturation of the biological filter is largely dependent on the temperature at which the process takes place (Table 8). In systems using cool water, a mature filter can be obtained after a few months of its work, while this period is significantly shorter in systems developed for the needs of thermophilic species. Another factor that may affect the maturation of biological filters is the presence of the desired nitrifying bacteria. Biological filters inoculated with nitrifying bacteria, operating at 25 °C, show desirable properties after 53 days [54]. The use of water from tilapia culture (temperature 26.4 °C) allowed a functional biological filter to be obtained after 56 days [5]. These results do not reflect the information provided by Kolman [55], who states that at 18 °C, it takes 40 to 60 days to obtain a working biological filter. In addition, the periods given differ from those obtained by Sikora et al. [18]. Studies have shown that the time needed to mature a biological filter without inoculating the culture cycle with nitrifying bacteria cultures is 35 days at 23 °C.
The conducted tests showed that at 25 °C, without introducing nitrifying bacteria cultures into the RAS system, the time needed for the filter to mature is from 21 to 33 days. If nitrifying bacteria are present, this period may be shorter. In one of the RAS systems used for the experiment, a failure occurred. As a result of the failure, it was necessary to restart the RAS. This RAS was dried and disinfected in accordance with the adopted procedure. In this system (drip filter, CF), a functional biological filter was obtained on day 16.

5. Conclusions

The maturation of biological filters is, despite the overall repetitive pattern, a largely variable process. The time of individual stages of nitrification and their courses differ. It largely depends on the type of filter used and its filling and prevailing conditions. The obtained results showed the effectiveness of all tested biofilter media. The shortest time to biofilter maturation was when submerged CF was used. However, the maximum peak concentration of nitrite was also noted when it was used. For fish culture welfare, it is important that nitrite concentration should be as low as possible. Therefore, other tested biofilter media worked better from this point of view. New technologies are being sought, new materials are used as filter fillings and nitrification conditions are being modified. Increasingly, breeders want to increased production faster and faster. This involves the use of increasingly efficient filters that can be run faster. Research such as that described in this article is helpful, even necessary, in learning how the nitrification process works, the conditions that shape it and what should be done to obtain fully efficient biological filters.
In addition, the article describes an unorthodox approach to new materials useful as cartridges for biological filters. Both PPA and PSC are materials that are associated as a convenient intermediate, not a useful cartridge for biological filters. However, these materials proved to be effective within the assumed parameters.

Author Contributions

The following statements should be used “Conceptualization, M.S., D.K.; Methodology, M.S., J.N.; Software, M.S.; Validation, M.S., J.N.; Formal Analysis, M.S.; Investigation, M.S.; Resources, M.S., D.K., J.N.; Data Curation, M.S.; Writing-Original Draft Preparation, M.S.; Writing-Review & Editing, M.S., J.N., D.K.; Visualization, M.S.; Supervision, D.K.; Project Administration, D.K. All authors have read and agreed to the published version of the manuscript.

Funding

This research was funded by UWM Olsztyn, project No. 18.610.005-110 and the project was financially supported by Minister of Science and Higher Education in the range of the program entitled "Regional Initiative of Excellence" for the years 2019-2022, Project No. 010/RID/2018/19, amount of funding 12.000.000 PLN.

Conflicts of Interest

The authors declare no conflict of interest.

References

  1. FAO. HLEF2050 Global Agriculture. 2016. Available online: http://www.fao.org/fileadmin/templates/wsfs/docs/Issues_papers/HLEF2050_Global_Agriculture.pdf (accessed on 10 March 2016).
  2. FAO. The State of World Fisheries and Aquaculture, Contributing to Food Security and Nutrition for All; Food and Agriculture Organization of the United Nations: Rome, Italy, 2016. [Google Scholar]
  3. Timmons, N.; Timmons, M.B.; Ebeling, J.M. Recirculating Aquaculture System (RAS) Technologies. Aquac. Mag. 2006, 32, 32–39. [Google Scholar]
  4. Kristensen, T.; Åtland, Å.; Rosten, T.; Urke, H.A.; Rosseland, B.O. Important influent-water quality parameters at freshwater production sites in two salmon producing countries. Aquac. Eng. 2009, 41, 53–59. [Google Scholar] [CrossRef]
  5. Greiner, A.D.; Timmons, M.B. Evaluation of the nitrification rates of microbead and trickling filters in an intensive recirculating tilapia production facility. Aquac. Eng. 1998, 18, 189–200. [Google Scholar] [CrossRef]
  6. Chen, S.; Ling, J.; Blancheton, J.P. Nitrification kinetics of biofilm as affected by water quality factors. Aquac. Eng. 2006, 34, 179–197. [Google Scholar] [CrossRef]
  7. Emparanza, E.J.M. Problems affecting nitrification in commercial RAS with fixed-bed biofilters for salmonids in Chile. Aquac. Eng. 2009, 41, 91–96. [Google Scholar] [CrossRef]
  8. Eding, E.H.; Kamstra, A.; Verreth, J.A.J.; Huisman, E.A.; Klapwijk, A. Design and operation of nitrifying trickling filters in recirculating aquaculture: A review. Aquac. Eng. 2006, 34, 234–260. [Google Scholar] [CrossRef]
  9. Wicks, B.J.; Joensen, R.; Tang, Q.; Randall, D.J. Swimming and ammonia toxicity in salmonids: The effect of sub lethal ammonia exposure on the swimming performance of coho salmon and the acute toxicity of ammonia in swimming and resting rainbow trout. Aquat. Toxicol. 2002, 59, 55–69. [Google Scholar] [CrossRef]
  10. Randall, D.J.; Tsui, T.K.N. Ammonia toxicity in fish. Marine Pollut. Bull. 2002, 45, 17–23. [Google Scholar] [CrossRef]
  11. Thurston, R.V.; Russo, R.C. Acute toxicity of ammonia to rainbow trout. Trans. Am. Fish. Soc. 1983, 112, 696–704. [Google Scholar] [CrossRef]
  12. Thurston, R.V.; Russo, R.J.; Luedtke, R.J.; Smith, C.E.; Meyn, E.L.; Chakoumalos, C.; Wang, K.C.; Brown, C.J.D. Chronic toxicity of ammonia to rainbow trout. Trans. Am. Fish. Soc. 1984, 113, 56–73. [Google Scholar] [CrossRef]
  13. Wood, C.M. Toxic responses of the gill. In Target Organ Toxicity in Marine and Freshwater Teleosts; Schlenk, D., Benson, W.H., Eds.; Taylor & Francis: London, UK, 2001; Volume 1, pp. 1–89. [Google Scholar]
  14. Cheng, W.; Hsiao, I.S.; Chen, J.C. Effect of nitrite on immune response of Taiwan abalone Haliotis diversicolor supertexta and its susceptibility to Vibrio parahaemolyticus. Dis. Aquat. Org. 2004, 60, 157–164. [Google Scholar] [CrossRef] [PubMed]
  15. Miron, D.S.; Moraes, B.; Becker, A.G.; Crestani, M.; Spanevello, R.; Loro, V.L.; Baldisserotto, B. Ammonia and pH effects on some metabolic parameters and gill histology of silver catfish, Rhamdiaquelen (Heptapteridae). Aquaculture 2008, 277, 192–196. [Google Scholar] [CrossRef]
  16. Benli, A.C.K.; Köksal, G.; Özkul, A. Sublethal ammonia exposure of Nile tilapia (Oreochromis niloticus L.): Effects on gill, liver and kidney histology. Chemosphere 2008, 72, 1355–1358. [Google Scholar] [CrossRef] [PubMed]
  17. Hurtado, C.F.; Cancino-Madariaga, B. Ammonia retention capacity of nanofiltration and reverse osmosis membranes in a non-steady state system, to be use in recirculation aquaculture systems (RAS). Aquac. Eng. 2014, 58, 29–34. [Google Scholar] [CrossRef]
  18. Sikora, M.; Nowosad, J.; Biegaj, M.; Kucharczyk, D.; Dębowski, M. The possibility of application of agglomerate elastomers (EPP) as media for biological bed in aquaculture. Aquac. Res. 2018, 49, 2988–2994. [Google Scholar] [CrossRef]
  19. Zhu, S.; Chen, S. The impact of temperature on nitrification rate in fixed film biofilters. Aquac. Eng. 2002, 26, 221–237. [Google Scholar] [CrossRef]
  20. Suhr, K.I.; Pedersen, P.B. Nitrification in moving bed and fixed bed biofilters treating effluent water from a large commercial outdoor rainbow trout RAS. Aquac. Eng. 2010, 42, 31–37. [Google Scholar] [CrossRef]
  21. Hamlin, H.J. Nitrate toxicity in Siberian sturgeon (Acipenser baeri). Aquaculture 2006, 253, 688–693. [Google Scholar] [CrossRef]
  22. Malone, R.F.; Pfeiffer, T.J. Rating fixed-film nitrifying biofilters used in recirculating aquaculture systems. Aquac. Eng. 2006, 34, 389–402. [Google Scholar] [CrossRef]
  23. Camargo, J.A.; Alonso, A.; Salamanca, A. Nitrate toxicity to aquatic animals: A review with new data for freshwater invertebrates. Chemosphere 2005, 58, 1255–1267. [Google Scholar] [CrossRef]
  24. Badiola, M.; Mendiola, D.; Bostock, J. Recirculating Aquaculture Systems (RAS) analysis: Main issues on management and future challenges. Aquac. Eng. 2012, 51, 26–35. [Google Scholar] [CrossRef] [Green Version]
  25. Ling, J.; Chen, S. Impact of organic carbon on nitrification performance of different biofilters. Aquac. Eng. 2005, 33, 150–162. [Google Scholar] [CrossRef]
  26. Guedart, T.C.; Losordo, T.M.; Classen, J.J.; Osborne, J.A.; DeLong, D.P. An evaluation of commercially available biological filters for recirculating aquaculture systems. Aquac. Eng. 2010, 42, 38–49. [Google Scholar] [CrossRef]
  27. Guedart, T.C.; Losordo, T.M.; Classen, J.J.; Osborne, J.A.; De Long, D.P. Evaluating the effects of organic carbon on biological filtration performance in a large scale recirculating aquaculture system. Aquac. Eng. 2011, 44, 10–18. [Google Scholar] [CrossRef]
  28. Kucharczyk, D.; Targońska, K.; Hliwa, P.; Gomułka, P.; Kwiatkowski, M.; Krejszeff, S.; Perkowski, J. Reproductive parameters of common carp (Cyprinus carpio L.) spawners during natural season and out-of-season spawning. Reprod. Biol. 2008, 8, 285–289. [Google Scholar] [CrossRef]
  29. Kucharczyk, D.; Nowosad, J.; Łuczyński, M.J.; Targońska, K. New technique for fertilizing eggs of burbot, asp and ide under hatchery conditions. Anim. Reprod. Sci. 2016, 172, 143–147. [Google Scholar] [CrossRef]
  30. Nowosad, J.; Kucharczyk, D.; Biłas, M.; Palińska-Żarska, K.; Krejszeff, S. Optimization of feeding rate of juvenile common carp, (Cyprinus carpio L.), during short intensive rearing under controlled conditions. Experiment 2013, 15, 1056–1063. [Google Scholar]
  31. Nowosad, J.; Żarski, D.; Biłas, M.; Dryl, K.; Krejszeff, S.; Kucharczyk, D. Dynamics of ammonia excretion in juvenile common tench, Tincatinca (L.), during intensive rearing under controlled conditions. Aquac. Int. 2013, 21, 629–637. [Google Scholar] [CrossRef]
  32. Svobodová, Z.; Máchová, J.; Poleszczuk, G.; Hòda, J.; Hamáâková, J.; Kroupová, H. Nitrite poisoning of fish in aquaculture facilities with water-recirculating systems. Acta Vet. Brno 2005, 74, 129–137. [Google Scholar] [CrossRef] [Green Version]
  33. Kuhn, D.D.; Smith, S.A.; Boardman, G.D.; Angier, M.W.; Marsh, L.; Flick, G.J., Jr. Chronic toxicity of nitrate to Pacific white shrimp. Litopenaeus vannamei: Impacts on survival, growth, antennae length, and pathology. Aquaculture 2010, 309, 109–114. [Google Scholar] [CrossRef]
  34. Tanikawa, D.; Nakamura, Y.; Tokuzawa, H.; Hirakata, Y.; Hatamoto, M.; Yamaguchi, T. Effluent treatment in an aquaponics-based closed aquaculture system with single-stage nitrification–denitrification using a down-flow hanging sponge reactor. Int. Biodeterior. Biodegrad. 2018, 132, 268–273. [Google Scholar] [CrossRef]
  35. Losordo, T.M.; Hobbs, A.O. Using computer spreadsheets for water flow and biofilter sizing in recirculating aquaculture production systems. Aquac. Eng. 2000, 23, 95–102. [Google Scholar] [CrossRef]
  36. Crab, R.; Avnimelech, Y.; Defoirdt, T.; Bossier, P.; Verstraete, W. Nitrogen removal techniques in aquaculture for sustainable production. Aquaculture 2007, 270, 1–14. [Google Scholar] [CrossRef] [Green Version]
  37. Hargrove, L.L.; Westerman, P.W.; Losordo, T.M. Nitrification in three-stage and single-stage floating bead biofilters in a laboratory-scale recirculating aquaculture system. Aquac. Eng. 1996, 15, 67–80. [Google Scholar] [CrossRef]
  38. van Rijn, J. The potential for integrated biological treatment systems in recirculating fish culture. Rev. Aquac. 1996, 139, 181–201. [Google Scholar] [CrossRef]
  39. Ridha, M.T.; Cruz, E.M. Effect of biofilter media on water quality and biological performance of the Nile tilapia Oreochromis niloticus L. reared in a simple recirculating system. Aquac. Eng. 2001, 24, 157–166. [Google Scholar] [CrossRef]
  40. Zhu, S.; Chen, S. An experimental study on nitrification biofilm performances using a series reactor system. Aquac. Eng. 1999, 20, 245–259. [Google Scholar] [CrossRef]
  41. Żarski, D.; Kucharczyk, D.; Targoñska, K.; Chyła, B.; Dobrołowicz, A. Dynamics of changes in nitrogen and phosphorus compounds during intensive rearing of ide, leuciscusidus (L.), in a recirculating system. Arch. Pol. Fish. 2008, 16, 459–467. [Google Scholar] [CrossRef]
  42. Żarski, D.; Kucharczyk, D.; Targońska, K.; Krejszeff, S.; Czarkowski, T.; Babiarz, E.; Nowosielska, D.B. Dynamics of nitrogen and phosphorus in closed and semi-closed recirculating aquaculture systems during the intensive culture of goldfish, Carassius auratus auratus (L.), juveniles. Arch. Pol. Fish. 2010, 18, 187–193. [Google Scholar] [CrossRef]
  43. Ebeling, J. Biofiltration. In Presentation Notebook of the Aquacultural Engineering Society Workshop; Intensive Fin-fish Systems and Technologies: Orlando, FL, USA, 2001; pp. 47–56. [Google Scholar]
  44. Itoi, S.; Ebihara, N.; Washio, S.; Sugita, H. Nitrite-oxidizing bacteria, nitrospira, distribution in the outer layer of the biofilm from filter materials of a recirculating water system for the goldfish Carassius auratus. Aquaculture 2007, 264, 297–308. [Google Scholar] [CrossRef]
  45. Kuhn, D.D.; Drahos, D.D.; Marsh, L.; Flick, G.J., Jr. Evaluation of nitrifying bacteria product to improve nitrification efficacy in recirculating aquaculture systems. Aquac. Eng. 2010, 43, 78–82. [Google Scholar] [CrossRef]
  46. Pulkkinen, J.T.; Eriksson-Kallio, A.M.; Aalto, S.L.; Tiirola, M.; Koskela, J.; Kiuru, T.; Vielma, J. The effects of different combinations of fixed and moving bed bioreactors on rainbow trout (Oncorhynchus mykiss) growth and health, water quality and nitrification in recirculating aquaculture systems. Aquac. Eng. 2019, 85, 98–105. [Google Scholar] [CrossRef]
  47. Davidson, J.; Good, C.; Williams, C.; Summerfelt, S.T. Evaluating the chronic effects of nitrate on the health and performance of post-smolt Atlantic salmon Salmo salar in freshwater recirculation aquaculture systems. Aquac. Eng. 2017, 79, 1–8. [Google Scholar] [CrossRef]
  48. Hamlin, H.J.; Michaels, J.T.; Beaulaton, C.M.; Graham, W.F.; Dutt, W.; Steinbach, P.; Losordo, T.M.; Schrader, K.K.; Main, K.L. Comparing denitrification rates and carbon sources in commercial scale upflow denitrification biological filters in aquaculture. Aquac. Eng. 2008, 38, 79–92. [Google Scholar] [CrossRef]
  49. delos Reyes, A.A., Jr.; Lawson, T.B. Combination of a bead filter and rotating biological contactor in a recirculating fish culture system. Aquac. Eng. 1996, 15, 27–39. [Google Scholar] [CrossRef]
  50. Barak, Y.; van Rijn, J. Biological phosphate removal in a prototype recirculating aquaculture treatment system. Aquac. Eng. 2000, 22, 121–136. [Google Scholar] [CrossRef]
  51. Seo, J.-K.; Jung, I.-H.; Kim, M.-R.; Kim, B.J.; Nam, S.-W.; Kim, S.-K. Nitrification performance of nitrifiers immobilized in PVA (polyvinyl alcohol) for a marine recirculating aquarium system. Aquac. Eng. 2001, 24, 181–194. [Google Scholar] [CrossRef]
  52. Hu, Z.; Lee, J.W.; Chandran, K.; Kim, S.; Brotto, A.C.; Khanal, S.K. Effect of plant species on nitrogen recovery in aquaponics. Bioresour. Technol. 2015, 188, 92–98. [Google Scholar] [CrossRef]
  53. Karpiński, A.; Szkudlarek, M.; Zakęś, Z. Nitrification in recirculation systems. Practical remarks about maturation of the biologically active filter. Komunikaty Rybackie 1999, 3, 11–14. (In Polish) [Google Scholar]
  54. Sandu, S.I.; Boardman, G.D.; Watten, B.J.; Brazil, B.L. Factors influencing the nitrification efficiency of fluidized bed filter with a plastic bead medium. Aquac. Eng. 2002, 26, 41–59. [Google Scholar] [CrossRef]
  55. Kolman, R. Effectiveness of a biological shelf filter used to treat water in a recirculation system during trout rearing. Arch. Pol. Fish. 1992, 1 (Suppl. 1), 1–37. (In Polish) [Google Scholar]
Figure 1. Polypropylene aggregate (PPA)-specifics surface area—ca. 12 m2 (A); polyethylene screw caps for PET bottles (PSC)-specifics surface area—ca. 9 m2 (B); Commercial fittings HXF12KLL (CF)-specifics surface area—ca. 25.5 m2 (C).
Applsci 10 00626 g001
Figure 2. Recirculation aquaculture system with submerged filter scheme: 1 upper retention tank—0.251 m3, 2 rearing tank—2 × 0.096 m3, 3 lower retention tank (3a chamber with biofilter, 3b chamber with pump)—0.182 m3, 4 water inlets, 5 sprinklers, 6 water outlets, 7 pump, 8 water supply to upper retention tank, 9 submerged filter—0.030 m3.
Applsci 10 00626 g002
Figure 3. Recirculation aquaculture system with dripping filter scheme: 1 upper retention tank—0.251 m3, 2 rearing tank—2 × 0.096 m3, 3 lower retention tank (3a chamber with biofilter, 3b chamber with pump)—0.182 m3, 4 water inlets, 5 sprinklers, 6 water outlets, 7 pump, 8 water supply to upper retention tank, 9 dripping filter—0.030 m3.
Applsci 10 00626 g003
Figure 4. Ammonium nitrogen concentration in experimental systems using submerged biological filters: PPA—polypropylene aggregate, PSC—polyethylene screw caps for PET bottles, CF—commercial fittings HXF12KLL.
Applsci 10 00626 g004
Figure 5. Nitrite nitrogen concentration in experimental systems using submerged biological filters: PPA—polypropylene aggregate, PSC—polyethylene screw caps for PET bottles, CF—commercial fittings HXF12KLL.
Applsci 10 00626 g005
Figure 6. Nitrate nitrogen concentration in experimental systems using submerged biological filters: PPA—polypropylene aggregate, PSC—polyethylene screw caps for PET bottles, CF—commercial fittings HXF12KLL.
Applsci 10 00626 g006
Figure 7. Ammonium nitrogen concentration in experimental systems using dripping biological filters: PPA—polypropylene aggregate, PSC—polyethylene screw caps for PET bottles, CF—commercial fittings HXF12KLL, CFsf—control submerged filter for dripping filters, commercial fittings HXF12KLL.
Applsci 10 00626 g007
Figure 8. Nitrite nitrogen concentration in experimental systems using dripping biological filters: PPA—polypropylene aggregate, PSC—polyethylene screw caps for PET bottles, CF—commercial fittings HXF12KLL, CFsf—control submerged filter for dripping filters, commercial fittings HXF12KLL.
Applsci 10 00626 g008
Figure 9. Nitrate nitrogen concentration in experimental systems using dripping biological filters: PPA—polypropylene aggregate, PSC—polyethylene screw caps for PET bottles, CF—commercial fittings HXF12KLL, CFsf—control submerged filter for dripping filters, commercial fittings HXF12KLL.
Applsci 10 00626 g009
Table 1. Ammonium nitrogen concentration in RAS, in which various tested fillings (PPA—polypropylene aggregate, PSC—polyethylene screw caps for PET bottles, CF—commercial fittings HXF12KLL) were used for two separated stages, Stage I (high ammonium concentration) and Stage II (low concentrations ammonium) separated by a period of rapid drop in ammonium (break down).
Filling Stage IBreak DownStage II
PPAAverage ± SD
(N-NH4/dm3)
2.971 ± 0.0590.9600.100 ± 0.022
Duration (d)3–101112–60
PSCAverage ± SD
(N-NH4/dm3)
2.996 ± 0.0560.8600.133 ± 0.031
Duration (d)3–111213–60
CFAverage ± SD
(N-NH4/dm3)
2.906 ± 0.0290,6750.118 ± 0.040
Duration (d)3–678–60
Table 2. Nitrite nitrogen concentration in RAS, in which various tested fillings (PPA—polypropylene aggregate, PSC—polyethylene screw caps for PET bottles, CF—commercial fittings HXF12KLL) were used for two separated stages, Stage I (high nitrite concentration) and Stage II (low nitrite concentration).
FillingStage IStage II
Increase (d)Maximum Concentration
(N-NO2/dm3)
Decrease (d)Average ± SD
(N-NO2/dm3)
Duration (d)
PPA1–1912.34019–310.404 ± 0.13714
PSC1–2015.18020–330.412 ± 0.16912
CF1–920.9009–210.211 ± 0.04924
Table 3. Ammonium nitrogen concentration in RAS, in which test fillings (PPA—polypropylene aggregate, PSC—polyethylene screw caps for PET bottles, CFsf—control submerged filter for dripping filters, commercial fittings HXF12KLL) were used for two separated stages: Stage I (high ammonium concentration) and Stage II (low ammonium concentrations) separated by a period of rapid drop in ammonium concentration (break down).
Filling Stage IBreak DownStage II
PPAAverage ± SD
(N-NH4/dm3)
2.996 ± 0.0330.7990.162 ± 0.048
Duration3–91011–45
PSCAverage ± SD
(N-NH4/dm3)
3.010 ± 0.0550.3130.209 ± 0.033
Duration3–101112–45
CFsfAverage ± SD
(N-NH4/dm3)
2.986 ± 0.0330.8840.120 ± 0.019
Duration3–91011–45
Table 4. Nitrite nitrogen concentration in RAS, in which test fillings (PPA—polypropylene aggregate, PSC—polyethylene screw caps for PET bottles, CF—commercial fittings HXF12KLL, CFsf—control submerged filter for dripping filters, commercial fittings HXF12KLL) were used for two separated stages: Stage I ((high nitrite concentration) and Stage II (low nitrite concentration).
FillingStage IStage II
Increase (d)Maximum Concentration
(N-NO2/dm3)
Decrease (d)Average ± SD
(N-NO2/dm3)
Duration (d)
PPA1–1712.50017–270.480 ± 0.13918
PSC1–1912.90019–300.438 ± 0.13715
CF1–85.7808–150.385 ± 0.12630
CFsf1–1711.70017–26 0.261 ± 0.17819
Table 5. Analysis of concentrations of nitrogen compounds using Kruskal-Wallis ANOVA test on ranks (p > 0.05) showed differences between individual RAS systems. Results of a multiple comparison test of mean ranks for all samples: PPA—polypropylene aggregate, PSC—polyethylene screw caps for PET bottles, CF—commercial fittings HXF12KLL, CFsf—control submerged filter for dripping filters, commercial fittings HXF12KLL. Data marked with the same letter in rows did not differ statistically.
Submerged FilterDripping Filter
PPAPSCCFPPAPSCCFCFsf
Ammoniumababccbcab
Nitritebcdbcdacddabcab
Nitratebcbcabcabbc
Table 6. (a) Nitrite nitrogen concentration analysis in experimental RAS systems using regress equation (Reg.) and correlation coefficients (R): PPA—polypropylene aggregate, PSC—polyethylene screw caps for PET bottles, CF—commercial fittings HXF12KLL, CFsf—control submerged filter for dripping filters, commercial fittings HXF12KLL. (b) Nitrite nitrogen concentration analysis in experimental RAS systems (dripping, CF) using regress equation (Reg.) and correlation coefficient (R).
(a)
Type of Filter,
Filling
Stage
IIIIIIIV
Submerged,
PPA
Reg.y = 0.0137e0.5439xy = −0.1324x2 + 4.8955x − 33.778y = 6E + 10x−7.218y = 0.0007x2 − 0.0651x + 1.8372
(R)0.99880.95380.99160.6644
Duration (d)1–1111–2424–3636–60
Submerged,
PSC
Reg.y = 0.0117e0.4586xy = −0.16x2 + 6.5599x − 52.287y = 5E + 16x−10.96y = 0.0013x2 - 0.1243x + 3.1995
(R)0.98940.99090.99310.7628
Duration (d)1–1313–2727–3636–60
Submerged,
CF
Reg.y = 0.0115e0.8991xy = −0.24x2 + 5.8161x − 14.642y = 7E + 26x−20.47y = 0.0002x2 − 0.0119x + 0.4015
(R)0.99910.90310.98170.6522
Duration (d)1–88–1818–2222–60
Dripping,
PPA
Reg.y = 0.0109e0.6266xy = −0.1126x2 + 3.5649x – 16.232y = 6E + 09x−6.821y = −0.0002x2 − 0.0057 + 0.4272
(R)0.99530.92160.99140.4423
Duration (d)1–1111–1919–3131–45
Dripping,
PSC
Regy = 0.0151e0.5446xy = −0.0698x2 + 2.5974x – 11.5y = 5E + 14x−9.983y = 0.002x2 − 0.1489x + 3.1431
(R)0.99790.98070.99130.9381
Duration (d)1–1212–2222–3333–45
Submerged,
CFsf
Reg.y = 0.0127e0.6536xy = −0.0698x2 + 2.1765x – 5.6077y = 2E + 12x−8.719y = 0.0013x2 − 0.1001x + 2.1323
(R)0.99950.93900.99140.9199
Duration (d)1–1010–1919–2929–45
(b)
Type of Filter,
Filling
Stage
IIIIII
Dripping,
CF
Reg.y = −0.0351x3 + 0.469x2 – 0.8346x + 0.4202y = 18770x−3.647y = 0.001x2 – 0.067x + 1.4065
(R)0.99980.99170.8223
Duration (d)1–99–2121–45
Table 7. Nitrate nitrogen concentration analysis in each experimental system using regress equation and correlation coefficients (R): PPA—polypropylene aggregate, PSC—polyethylene screw caps for PET bottles, CF—commercial fittings HXF12KLL, CFsf—control submerged filter for dripping filters, commercial fittings HXF12KLL.
Type of Filter,
Filling
Regress EquationCorrelation Coefficients (R)
Submerged,
PPA
y = −0.0005x3 + 0.0392x2 − 0.1142x + 0.1350.9844
Submerged,
PSC
y = −0.0005x3 + 0.0425x2 − 0.3631x + 1.57470.9946
Submerged,
CF
y = −0.0006x3 + 0.0367x2 + 0.5992x − 2.11530.9797
Dripping,
PPA
y = −0.0017x3 + 0.1118x2 − 1.1623x + 3.9310.9884
Dripping,
PSC
y = −0.0015x3 + 0.1082x2 − 1.3589x + 4.8080.9882
Submerged,
CFsf
y = −0.0005x3 + 0.0174x2 + 0.9072x − 1.3550.9968
Dripping,
CF
y = −0.0015x3 + 0.1052x2 − 1.1256x + 3.73110.9926
Table 8. Comparison of time needed to mature biological filter in accordance with temperature on the example of literature data and conducted experiment: PPA—polypropylene aggregate, PSC—polyethylene screw caps for PET bottles, CF—commercial fittings HXF12KLL, CFsf—control submerged filter for dripping filters, commercial fittings HXF12KLL.
Temperature (°C)Time (d)°DSource of Biogens
Sandu, et al., 200225.0531325No data
Greiner and Timmons, 199826.4561478.4Fish
Kolman, 200218.040–60720–1080No data
Sikora et al. 201823.035805Fish
This paperSubmerged, PPA25.035875Fish
Submerged, PSC25.036900Fish
Submerged, CF25.021525Fish
Dripping PPA25.037924Fish
Dripping PSC25.032800Fish
Submerged CFsf25.018700Fish
Dripping CF25.018450Fish

