Research on Dynamic Risk Assessment and Active Defense Strategy of Active Distribution Network under Ice Weather
Abstract
Featured Application
Abstract
1. Introduction
- The multisource situational awareness method is used to analyze the internal operation situation of the distribution network in this paper, define the network topology situation, the power supply situation, the defense resource, the power flow situation, and cascading fault factor, thus the comprehensive vulnerability rate model is established.
- An ice hazard dynamic risk assessment index system concluding the ice-covered dynamic intrusion index, ice disaster-resistance capability index and demand response potential index is proposed in this paper so that it can monitor the current operating status of the distribution network in real time. In order to evaluate the risk status of different distribution lines at a certain moment and determine whether a certain line needs to take active defense plan at the current moment, the concept of risk threshold is proposed in this paper.
- Making full use of the transfer capacity of the tie-lines and the flexible controllability of distributed energy such distributed generations (DGs) and energy storage system (ESS), an evolutionary process of coordinated active defense strategy (CADS) based on fault prediction which involves load transfer with DGs connected in active distribution network (ADN), island operation, and load shedding is established in this paper. The minimum amount of load shedding is considered as an optimization goal while considering various constraints, the active defense scheme is more realistic and the practicality of the active defense strategy is improved.
2. The Comprehensive Vulnerability Rate Model
2.1. Ice Accretion Model
2.2. Ice Accretion Failure Rate Model
2.3. Multisource Situational Awareness Analysis
2.3.1. Network Topology Situation
2.3.2. Power Supply Situation
- (1)
- Conventional power supply
- (2)
- Distributed generations (DGs)
- (3)
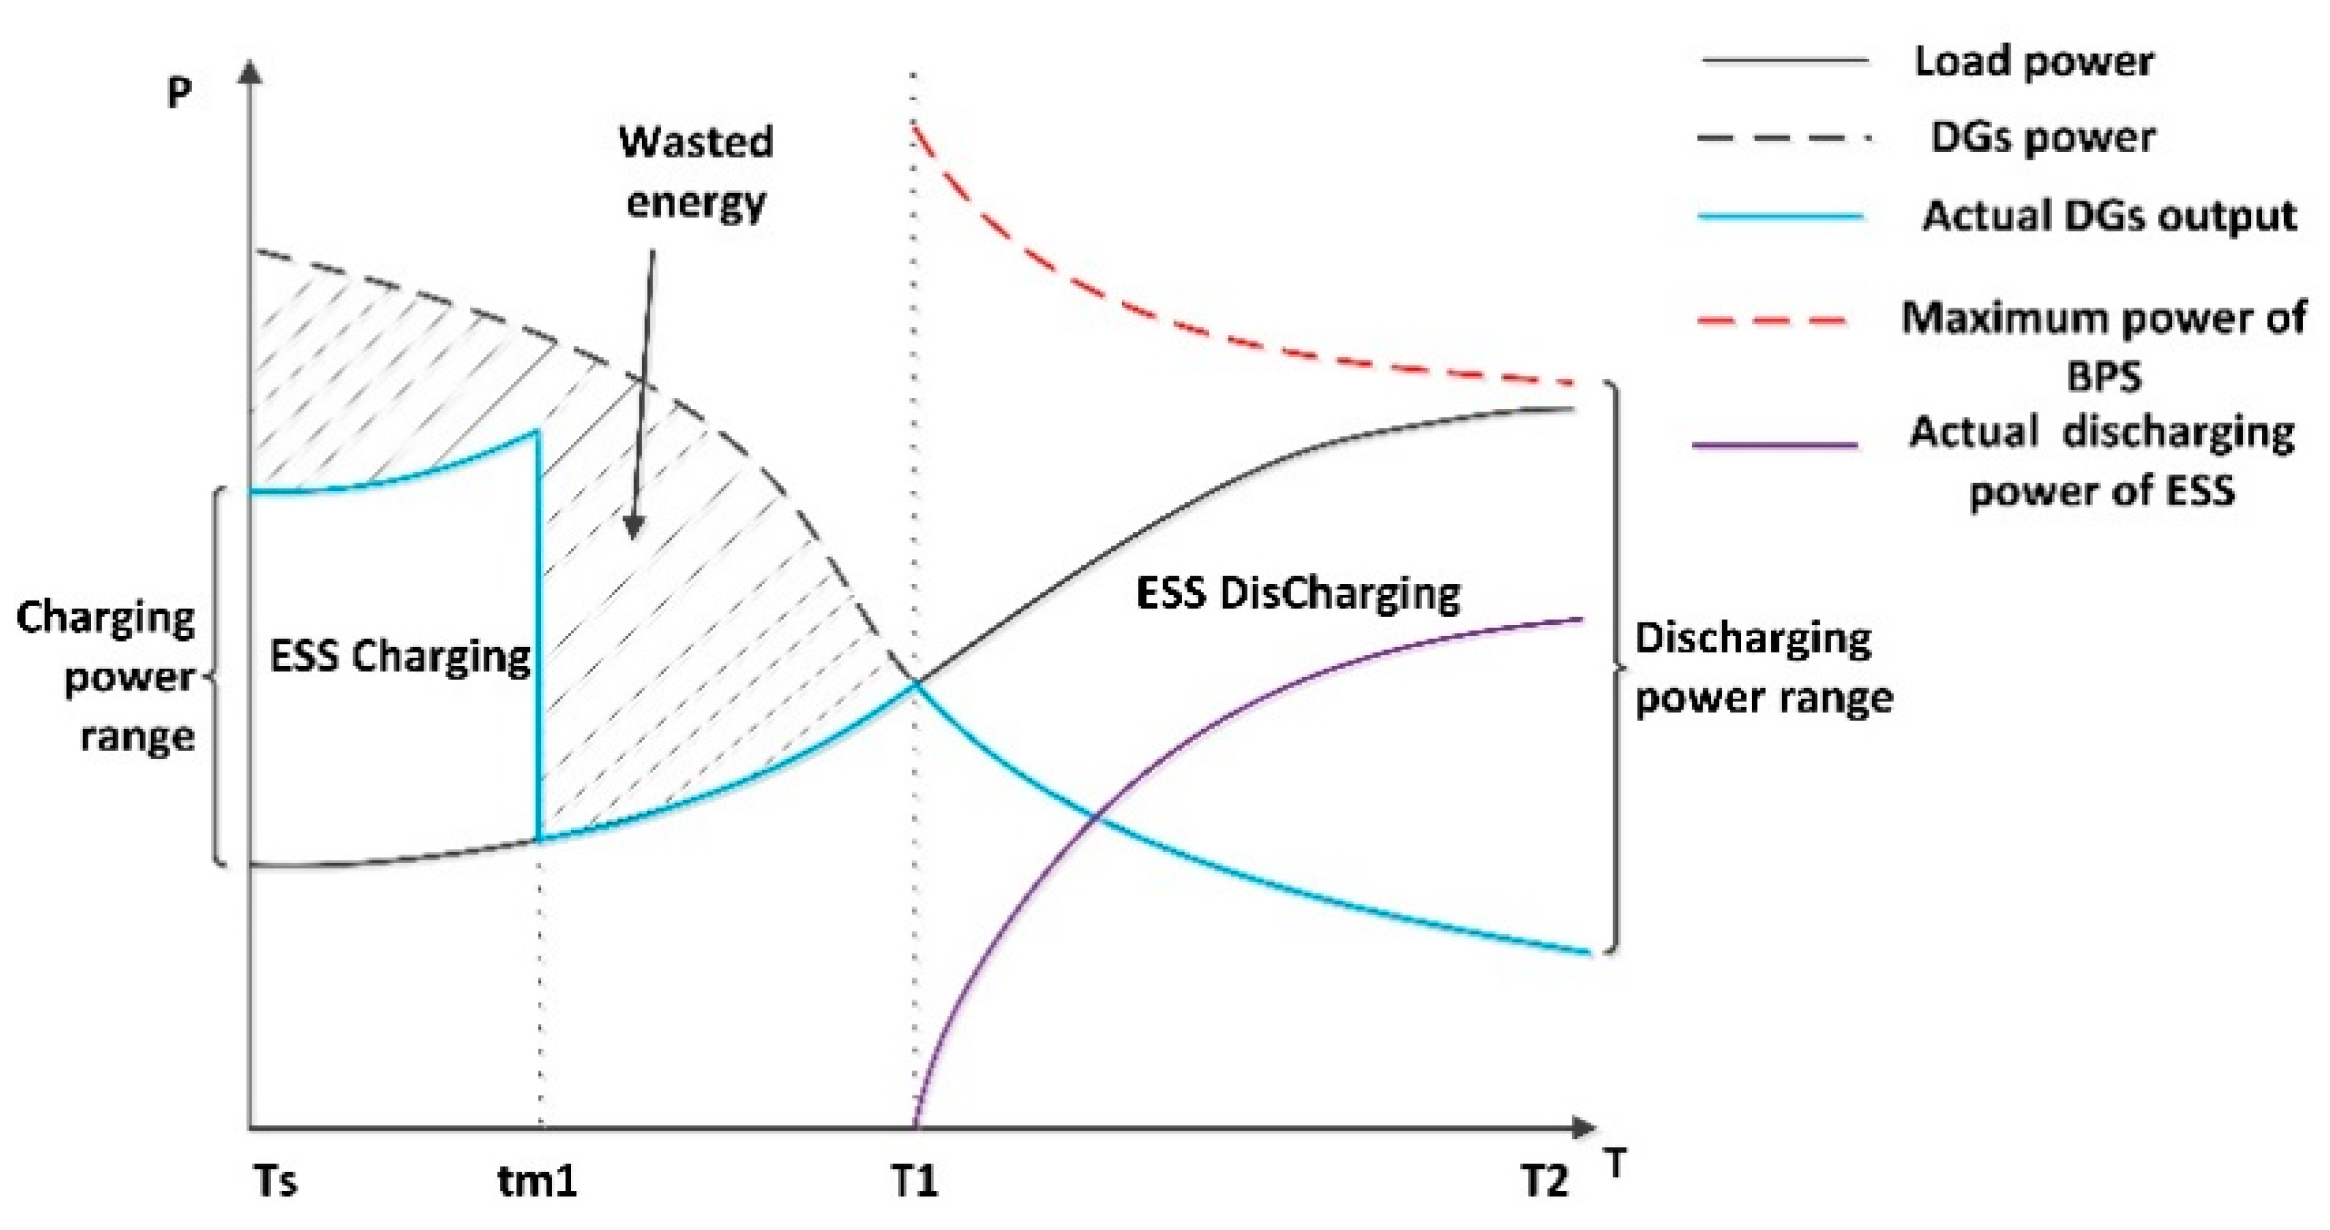
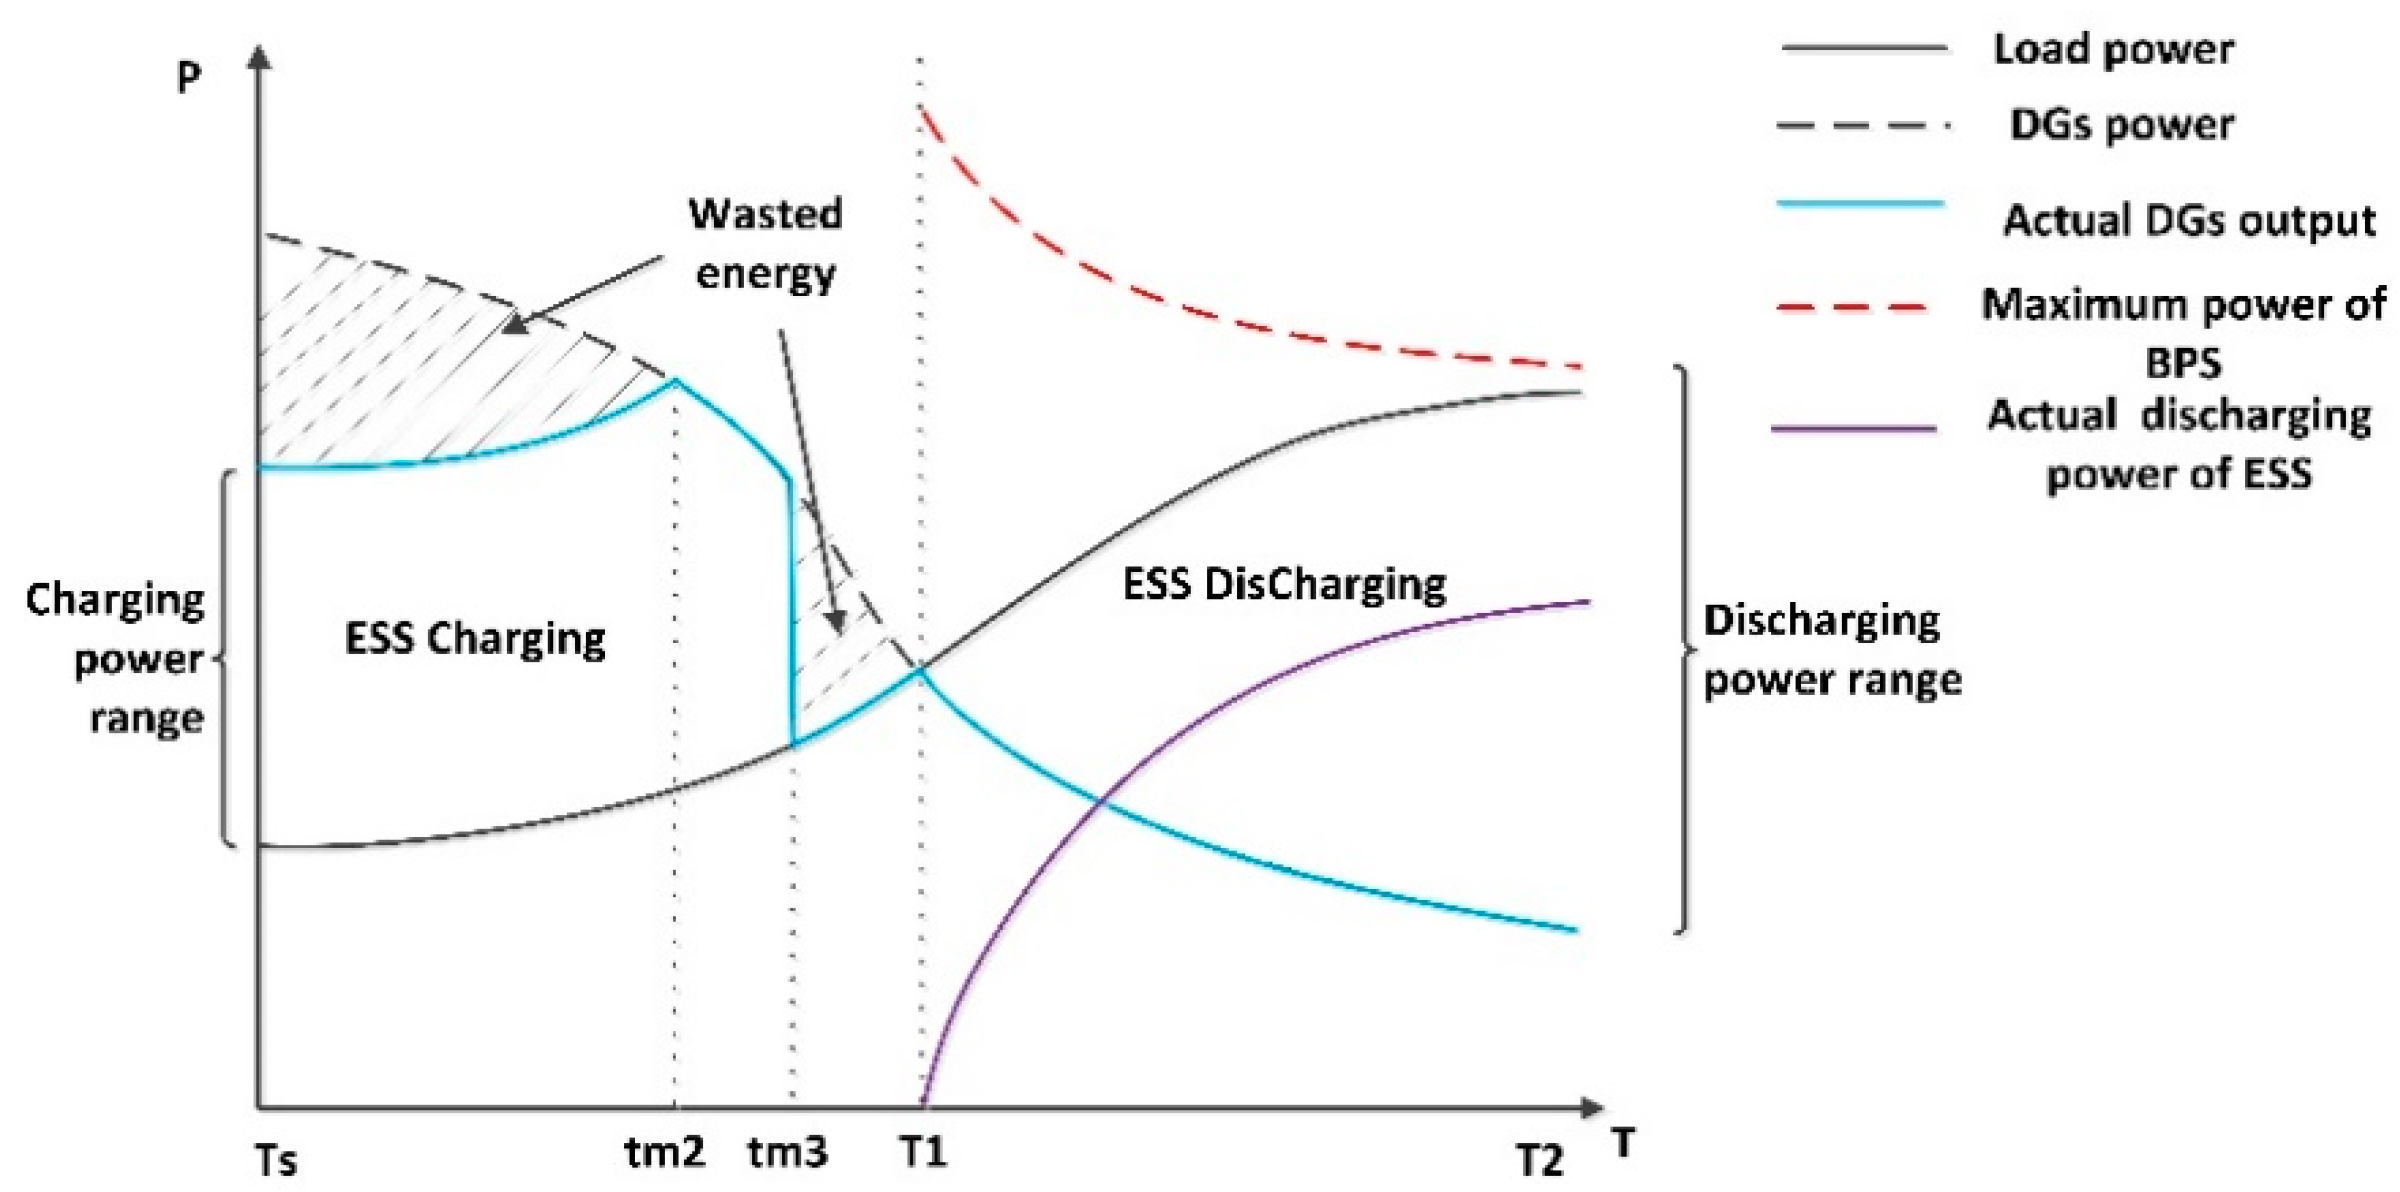
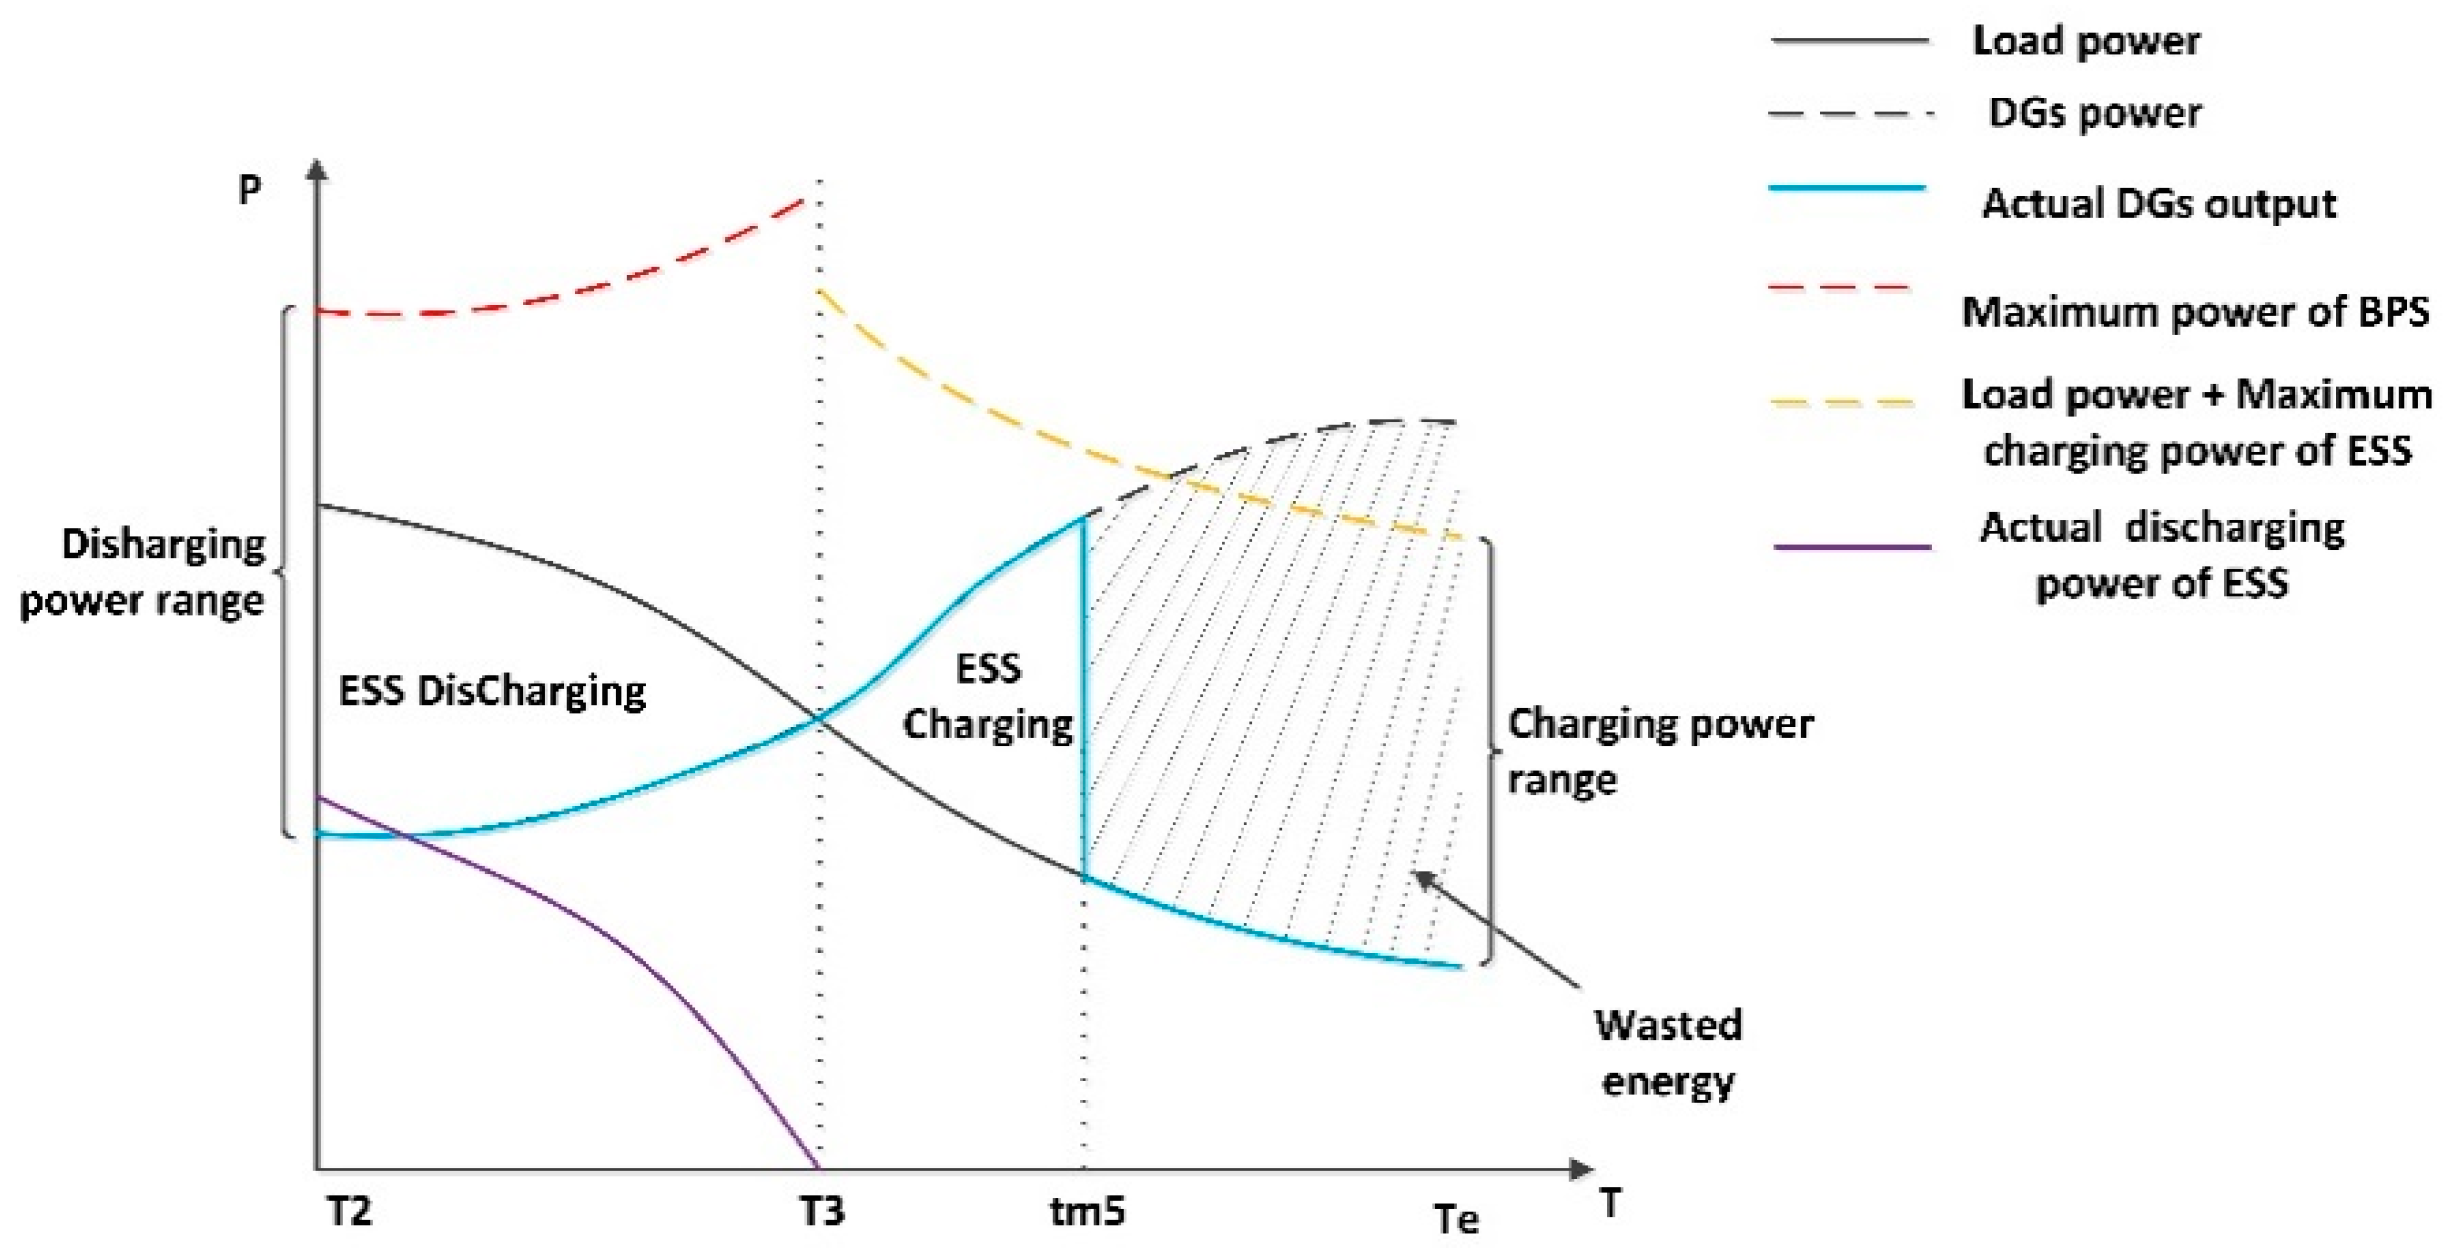
- Energy storage system (ESS)
2.3.3. Defense Resources
2.3.4. Power Flow Situation
2.3.5. Cascading Faults Factor
2.4. Comprehensive Vulnerability Rate
3. Multi-Angle Dynamic Risk Assessment
3.1. Ice-Covered Dynamic Intrusion Index
3.2. Ice Disaster-Resistance Capability Index
3.3. Demand Response Potential Index
3.4. Dynamic Risk Assessment Model
3.5. Risk Threshold
4. CADS
4.1. Load Transfer with DGs Connected in ADN
4.2. Island Operation
- (1)
- A high-risk line is directly connected to the root node of the island and the direction of the power flow is from the root node to the high-risk line.
- (2)
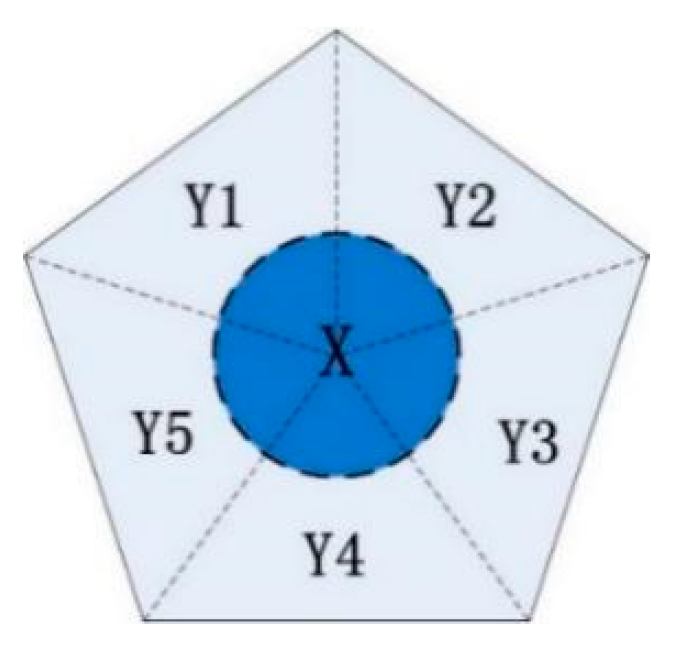
- During the entire active defense process, DGs and ESS are unavailable. That is, is less than the minimum power support capability.
4.3. CADS Evolution Process
- (1)
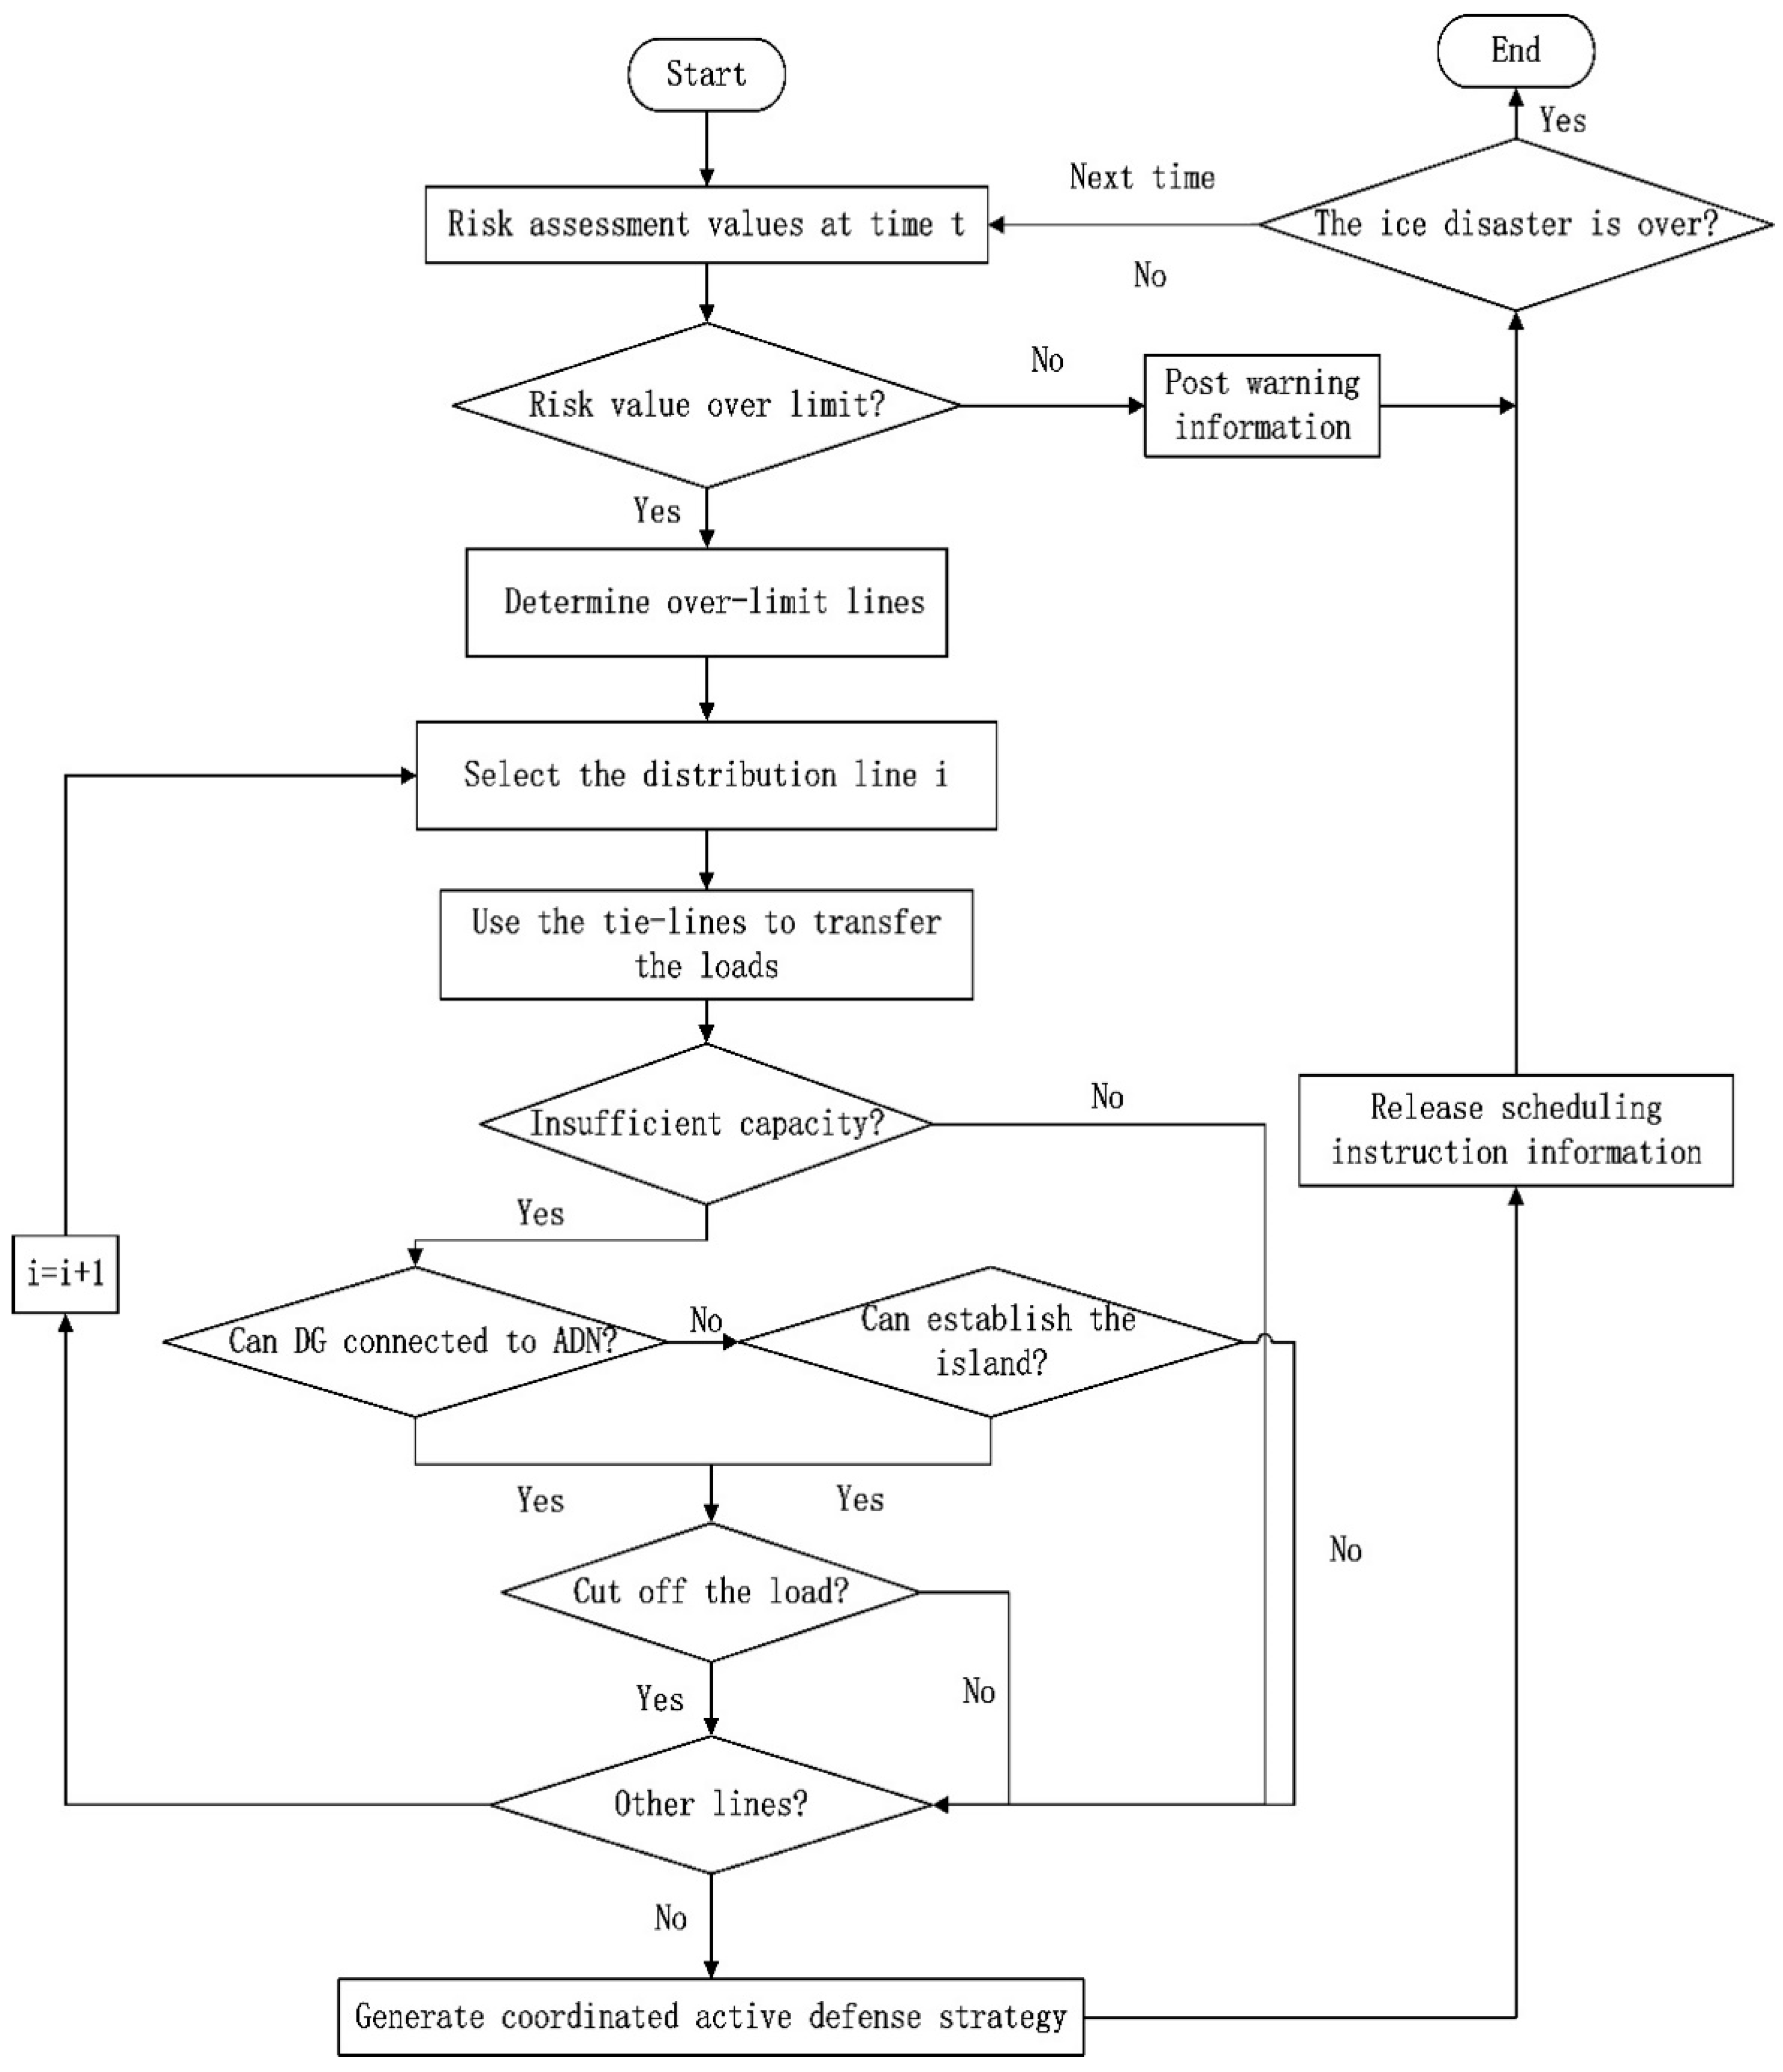
- Search for high-risk distribution lines and determine the defense order according to the difference between the threshold and the risk value. At the same time, find all available interconnection switches and section switches for the distribution line;
- (2)
- Transfer the load using an interconnection switch. This step attempts to use a interconnection switch to transfer all loads of the distribution line, if it can be achieved, go to step (6), otherwise go to step (3);
- (3)
- Transfer the load by using another interconnection switch. If only one interconnection switch cannot transfer all the loads of the distribution line, this step attempts to use other interconnection switches to transfer the remaining loads of the distribution line. If it can be realized, go to step (6), otherwise go to step (4);
- (4)
- Look for other defense strategies to make up for the shortcomings of a single solution. If the power flow direction of DG and the tie-line are the same, the DG can be used to assist when the loads cannot be completely transferred by the tie-lines, and if there are still no transfer loads, the island mode is used. If the island can be achieved, go to step (5);
- (5)
- If it can achieve complete defense, go to step (7), otherwise go to step (6);
- (6)
- If the ability of the active defense plan is exceeded after the above process, part of the loads must be cut off in order to ensure the safety constraints of the distribution network;
- (7)
- If there are other high-risk lines, go to step (1), otherwise, go to step (8);
- (8)
- Get an active defense evolution plan and release dispatch instructions to the next moment until the end of the disaster;
- (9)
- Determine if the ice disaster is over. If it is not over, go to step (1), otherwise the process end.
5. Simulation Analysis
5.1. Distribution Network Vulnerability Analysis
- (1)
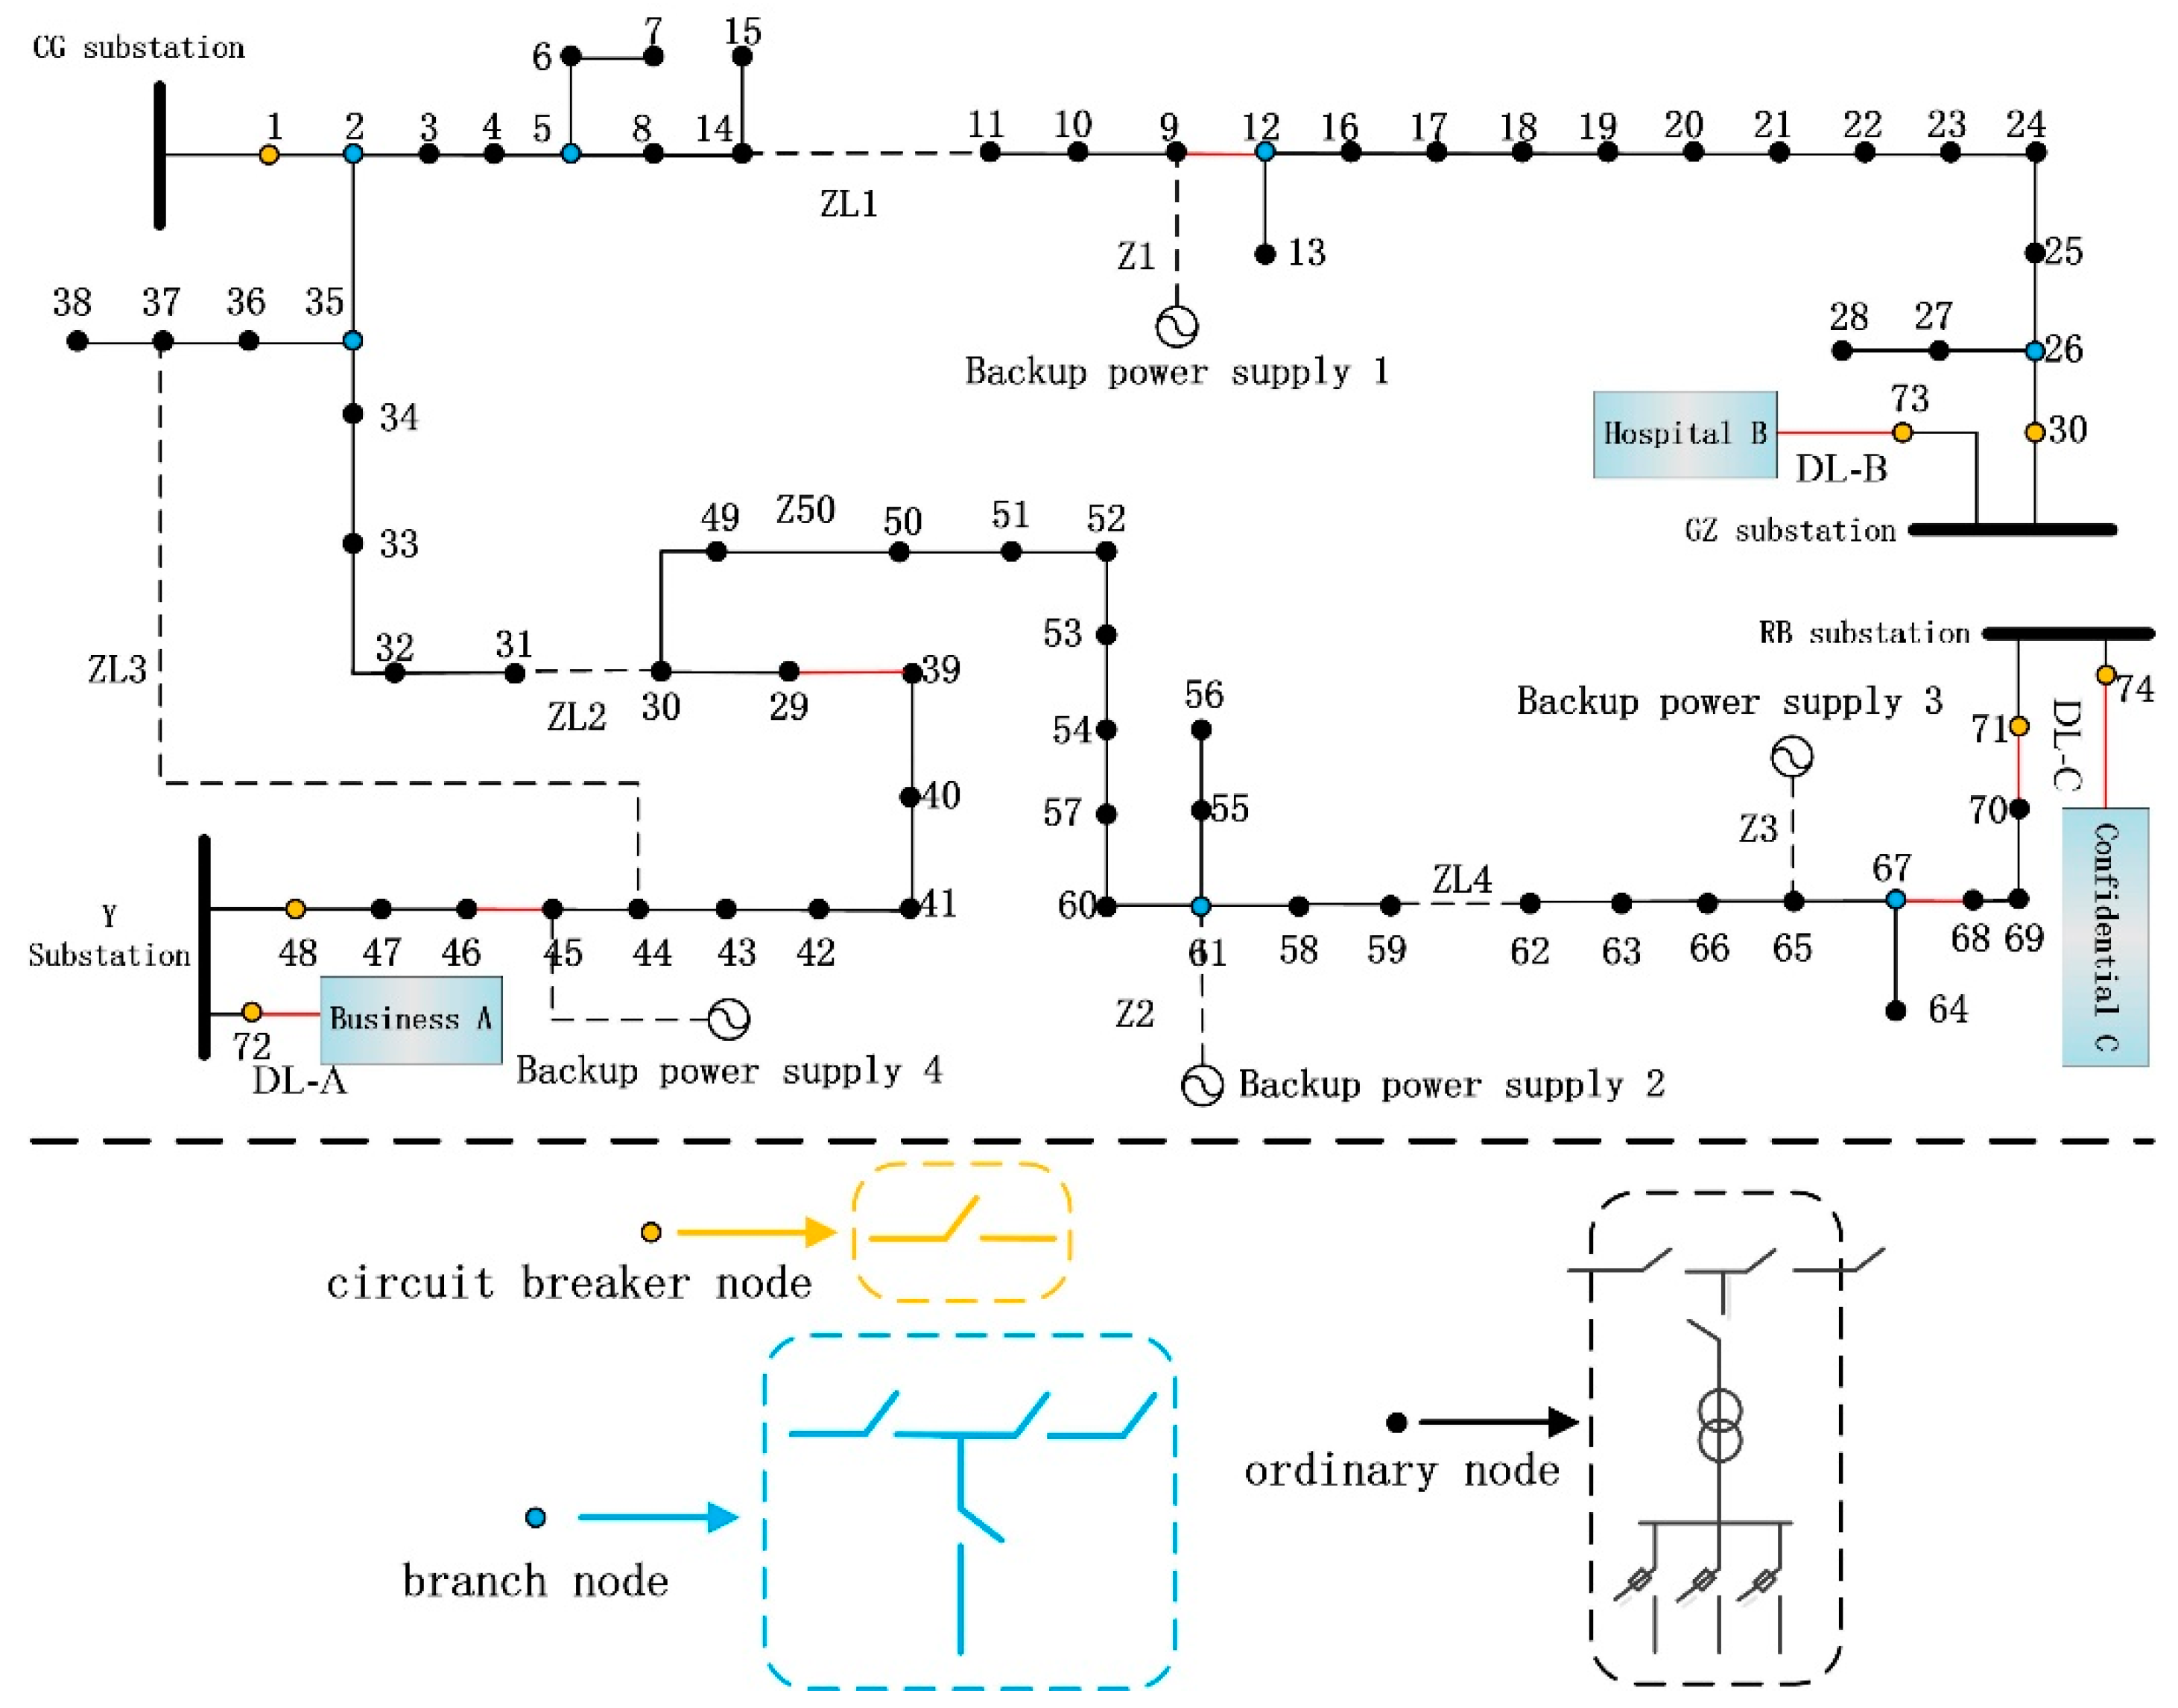
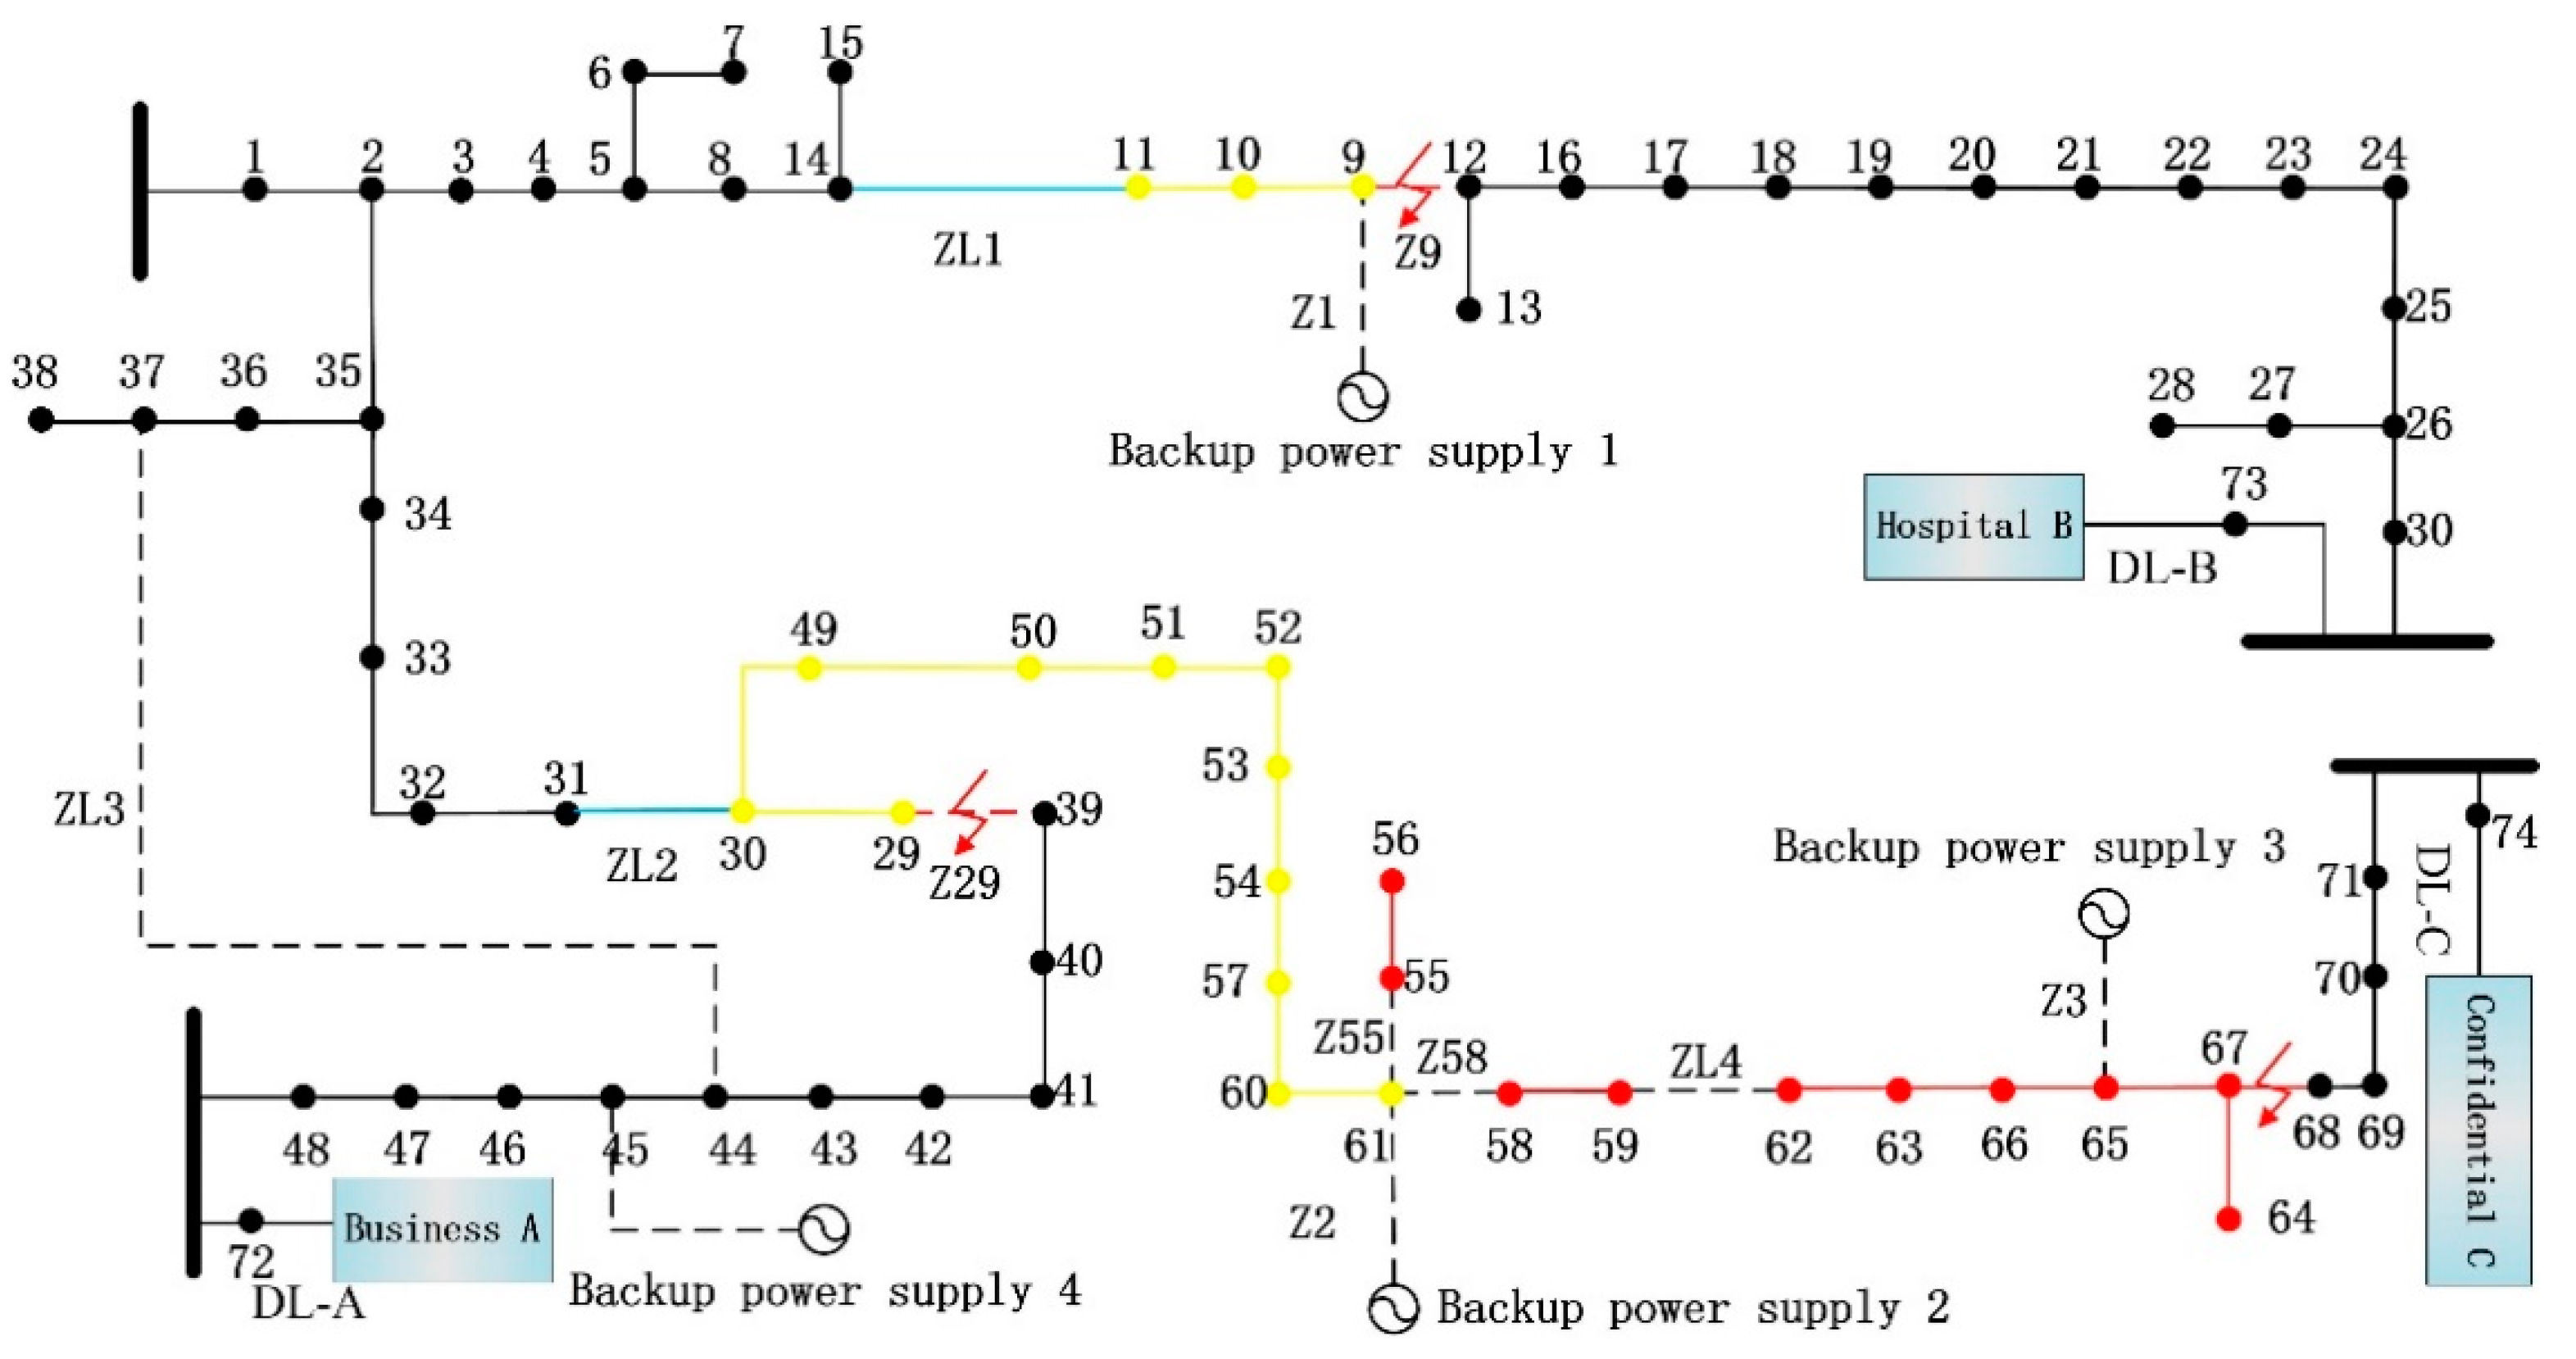
- It can be seen from Table 2 that and are the highest. , , , and are greatly affected by the ice weather. The distribution lines 45–46 and 9–12 contain the BPS which and are obviously high.
- (2)
- As shown in Table 2, and are obviously insufficient. , , and are obviously high which indicates that the fault propagation of these three lines degree is large and easy to cause cascading faults. At the same time, distribution lines 67–68 and 29–39 occupy important positions in the topology, so and are also high.
- (3)
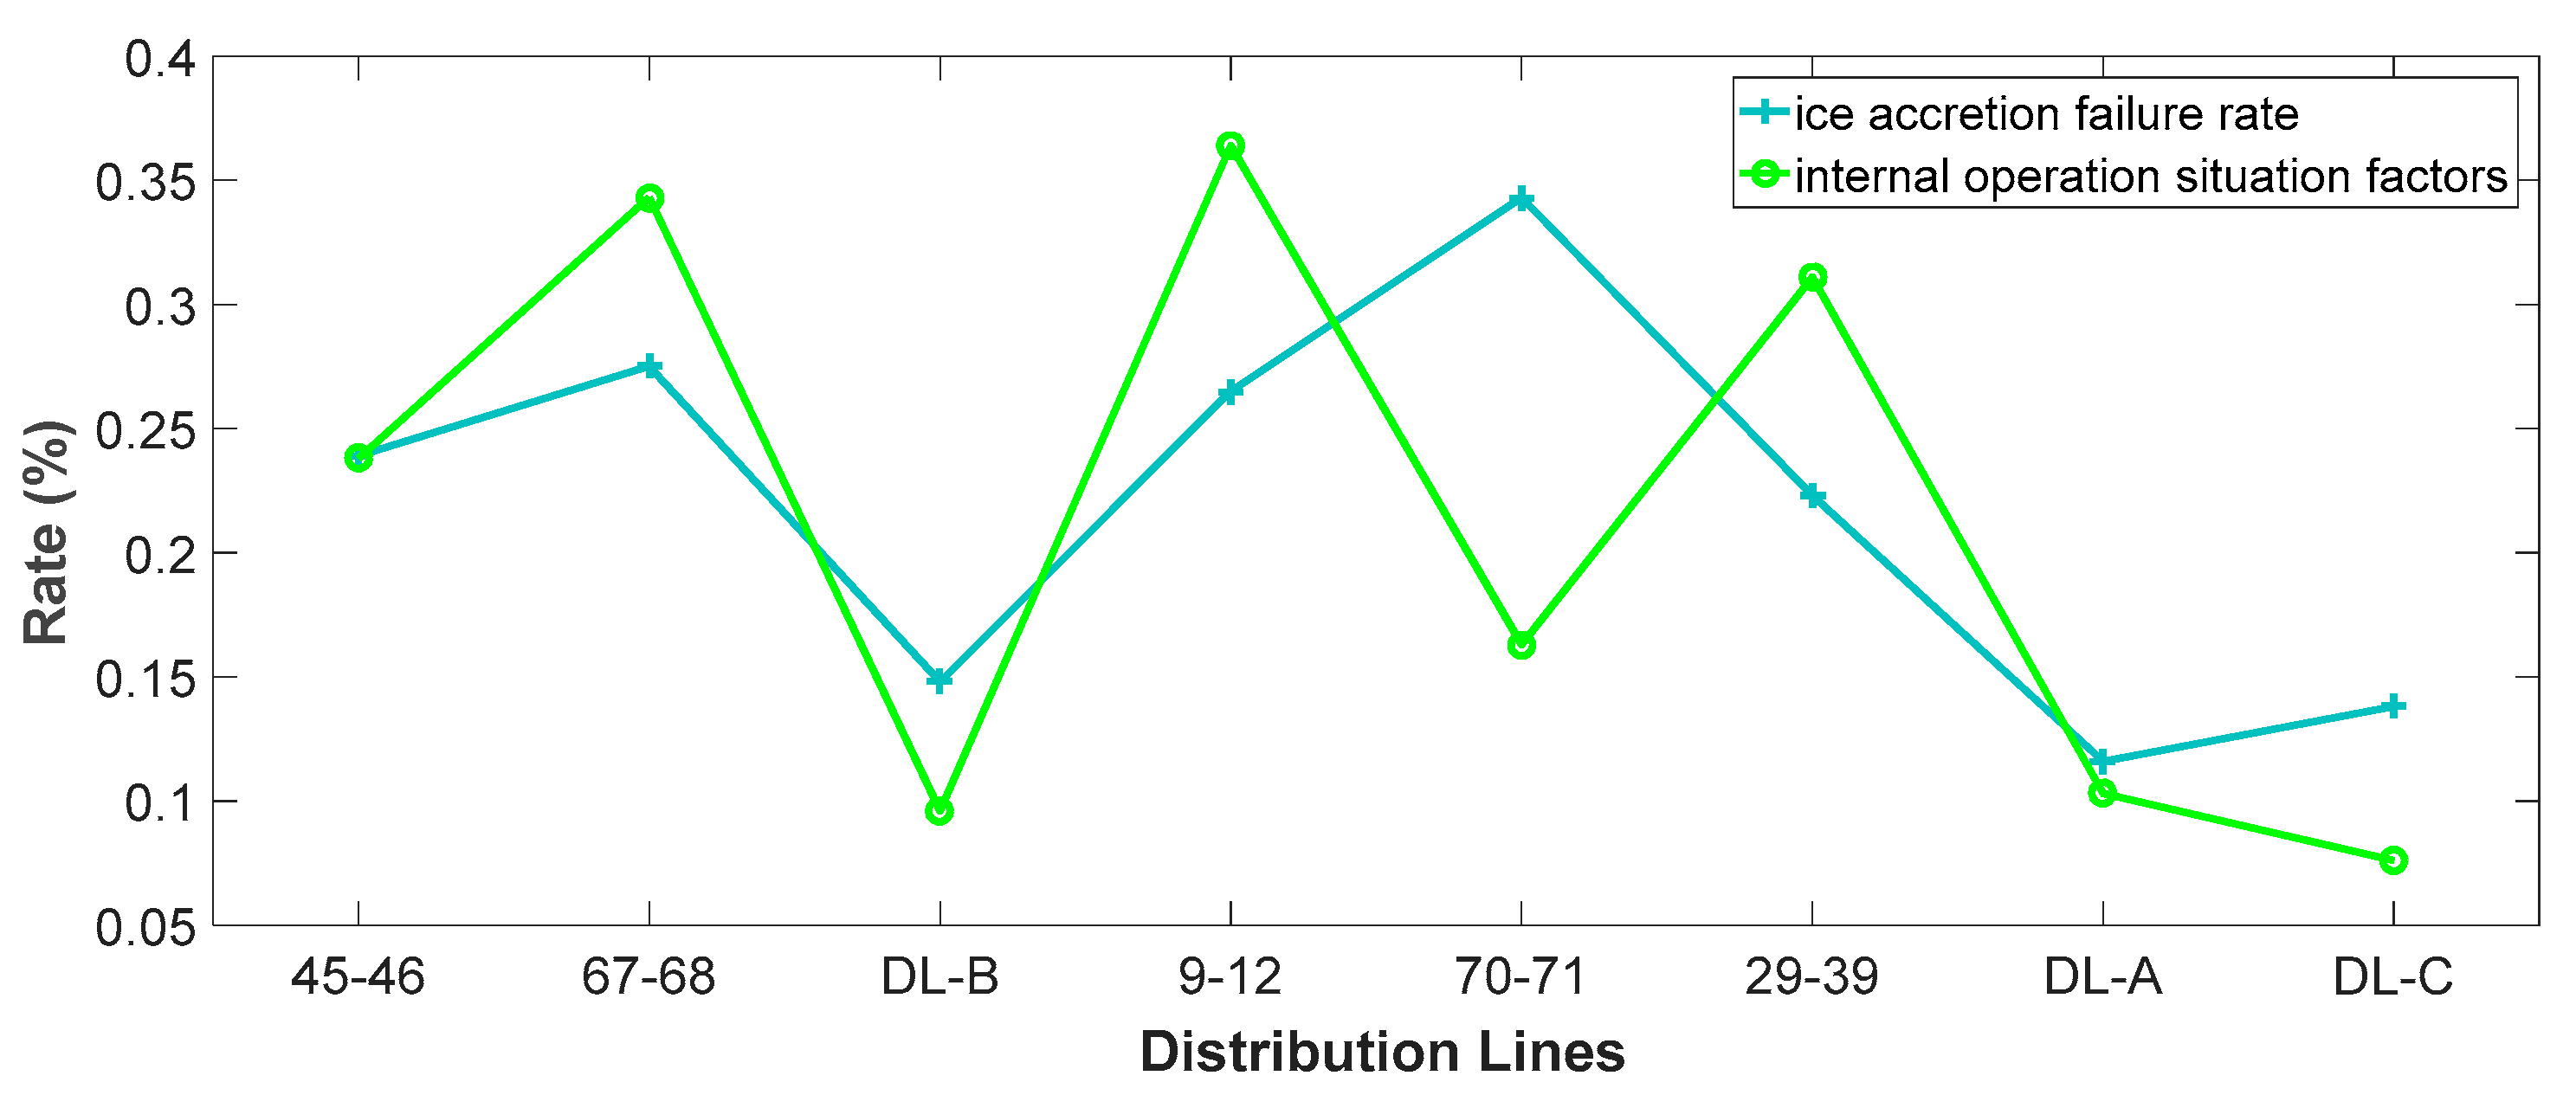
- and are shown in Figure 6. Among them, the is the highest, but the is not the highest. It indicates that the failure rate of the distribution line in the ice disaster is not only affected by the external environment such as ice accretion, but also the internal operation situation of the distribution network is an important factor that affects the stable operation of the distribution line. Therefore, the comprehensive vulnerability rate is more reasonable.
5.2. Risk Assessment Simulation
- (1)
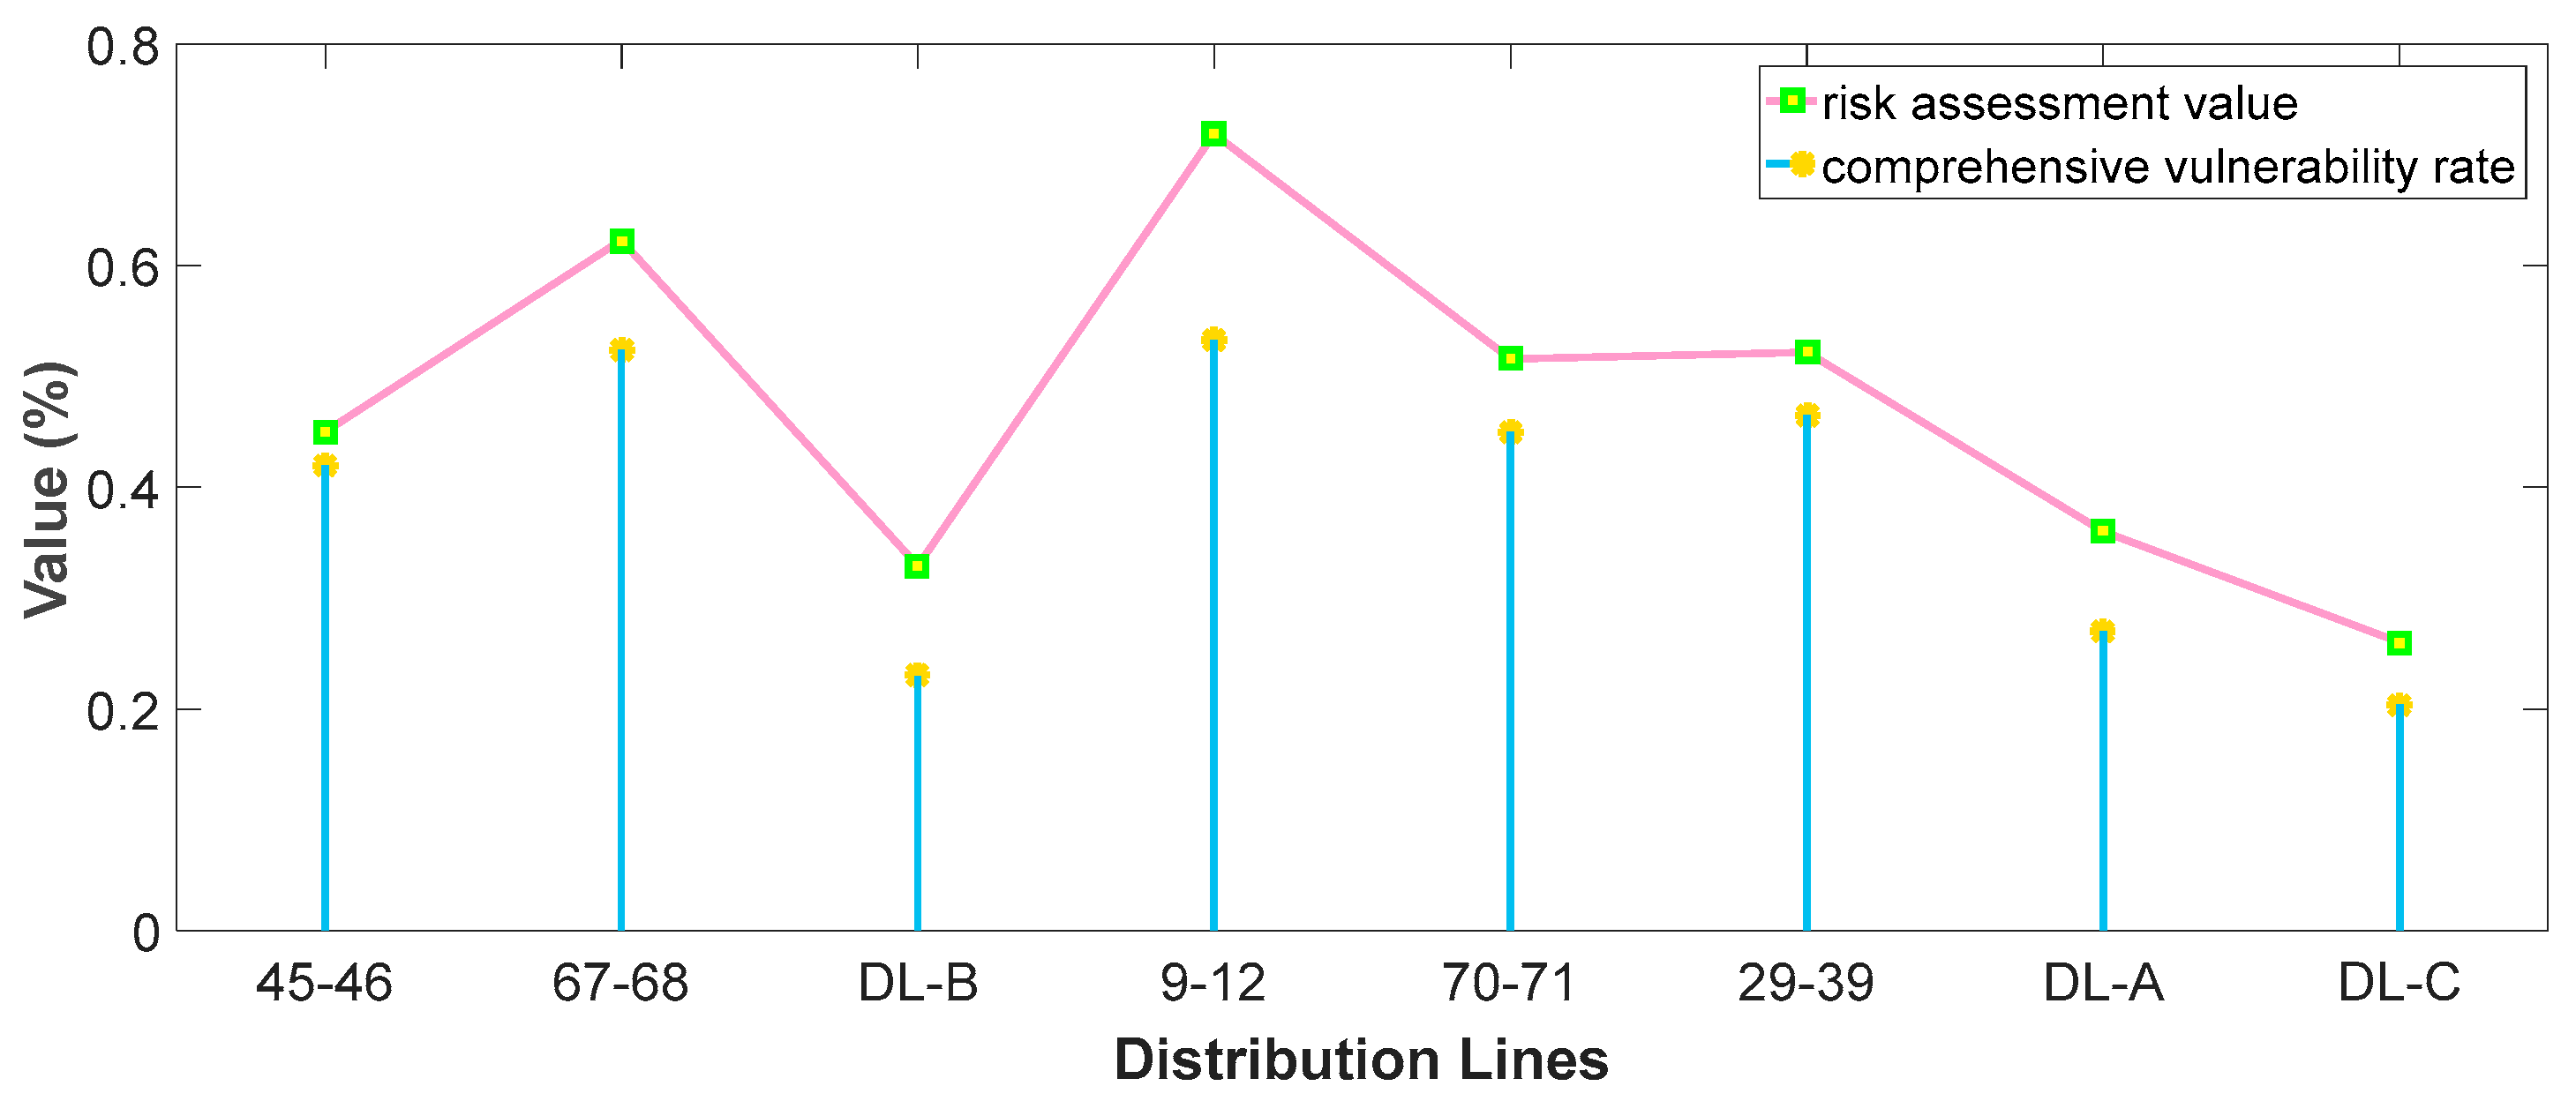
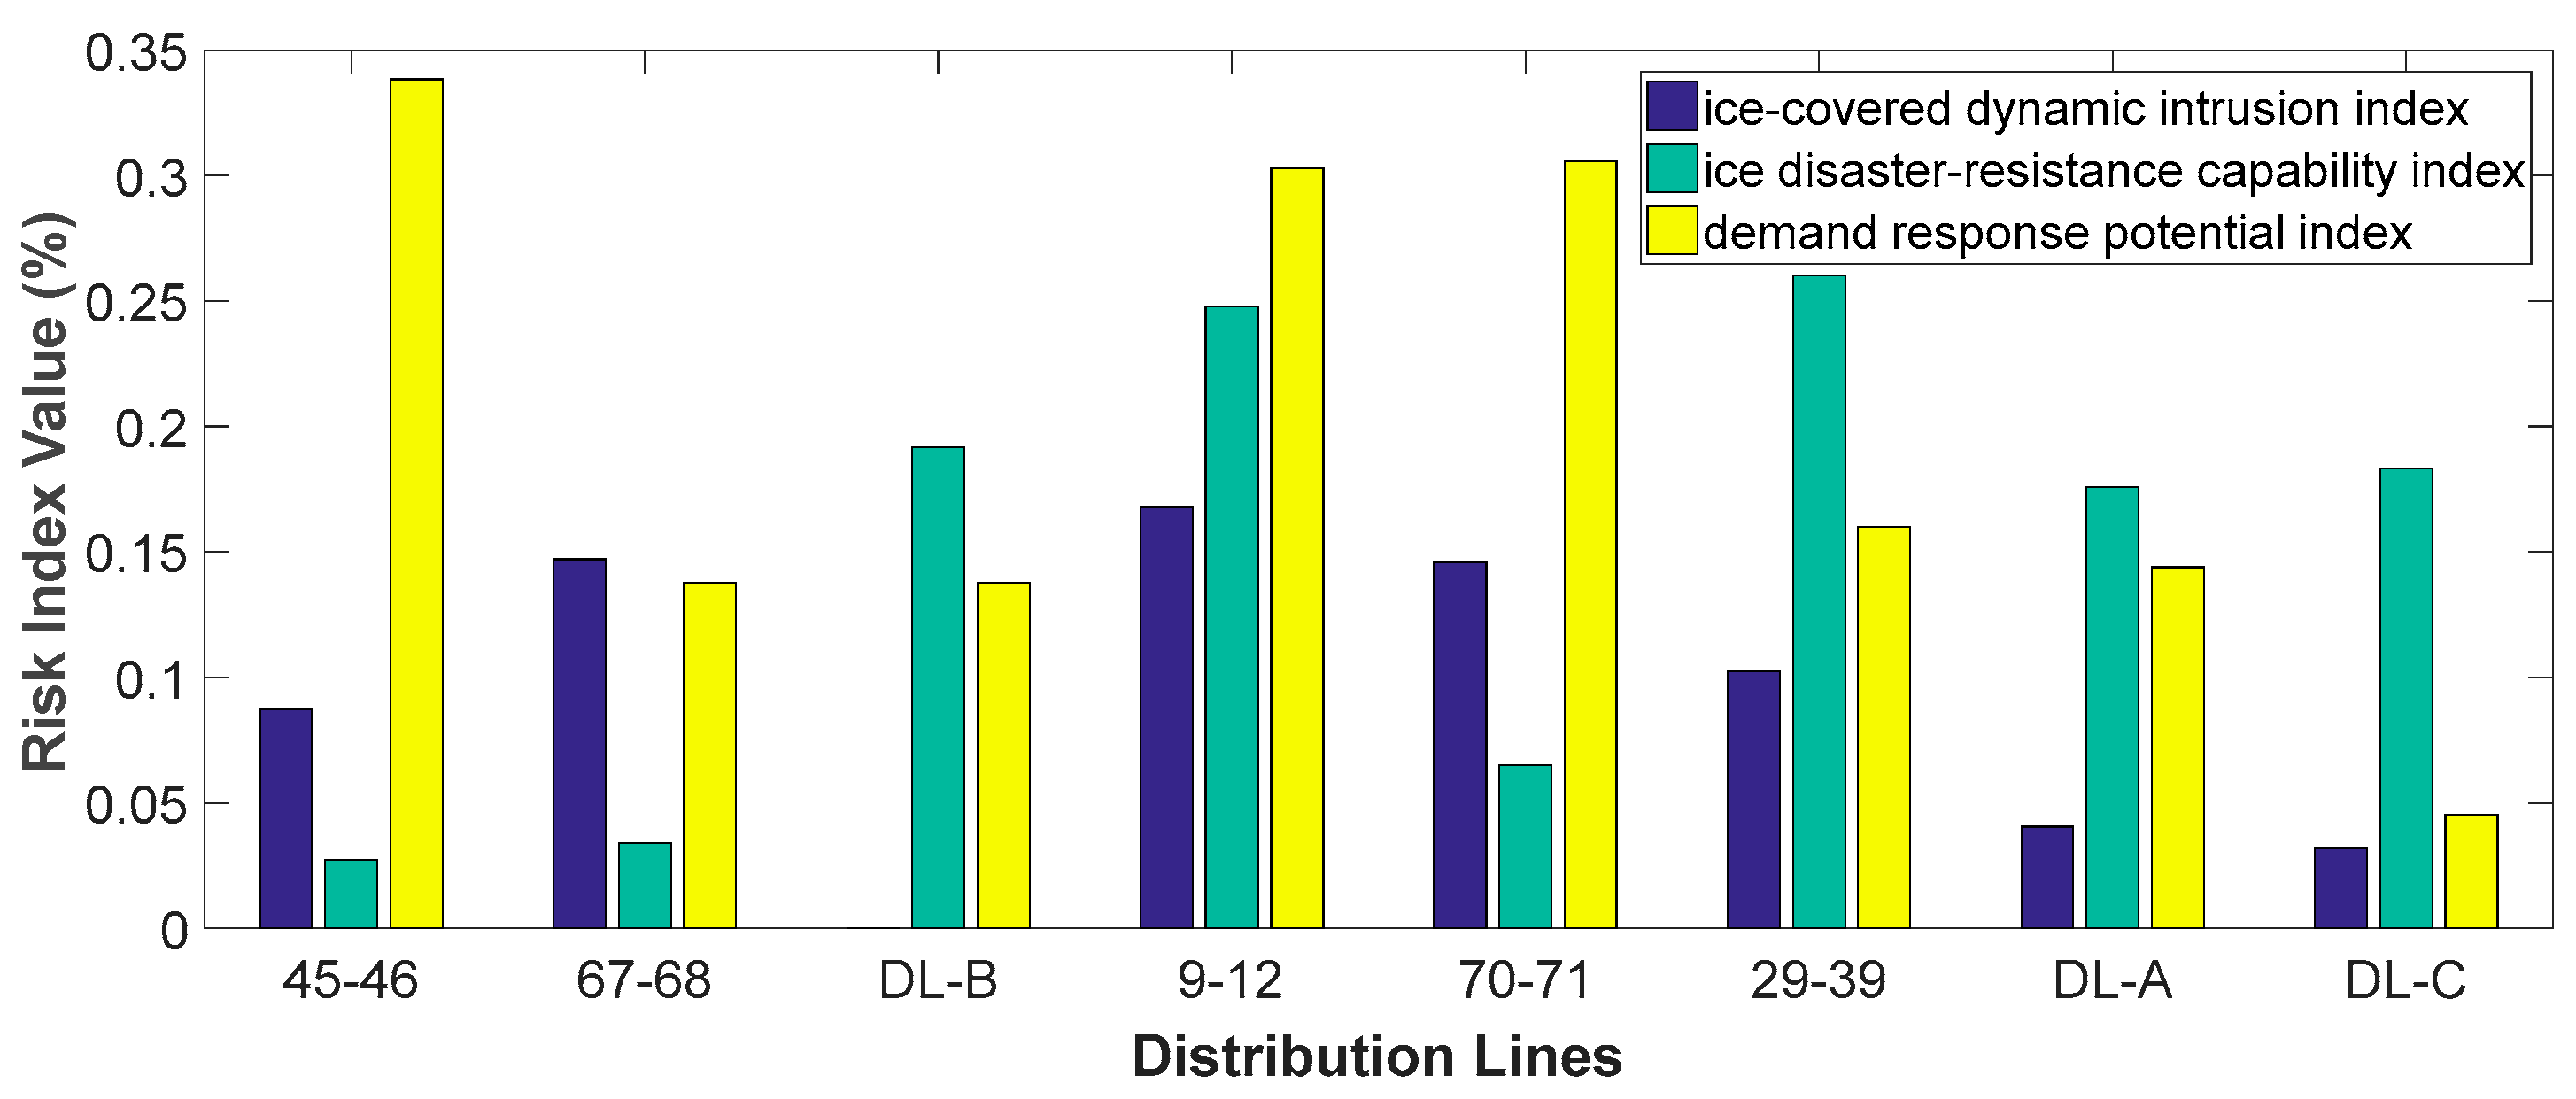
- It can be seen from Figure 7 that is positively correlated with the , and the difference in is more obvious than . The result of Figure 8 is calculated through a standardized process that shows the different impact of these three risk indicators on each distribution line. Therefore, different indicators can obtain a more comprehensive risk prediction result and achieve more accurate analysis of the operating conditions in the distribution network.
- (2)
- It can be seen from Table 3 that , , and are smaller than others, which are 0.360, 0.329, and 0.260 respectively. While , , and are larger than others which are 0.623, 0.719, and 0.522, respectively. It is necessary to adopt the defense strategy in time because it was verified that these three risk values exceeded the threshold.
- (3)
- It can systematically perceive the status of distribution network in real-time by using the risk assessment method proposed in this paper, and gain valuable time for the staff to take the active defense strategy.
5.3. Defense Strategy Simulation
6. Conclusions
Author Contributions
Funding
Conflicts of Interest
Appendix A
Appendix B

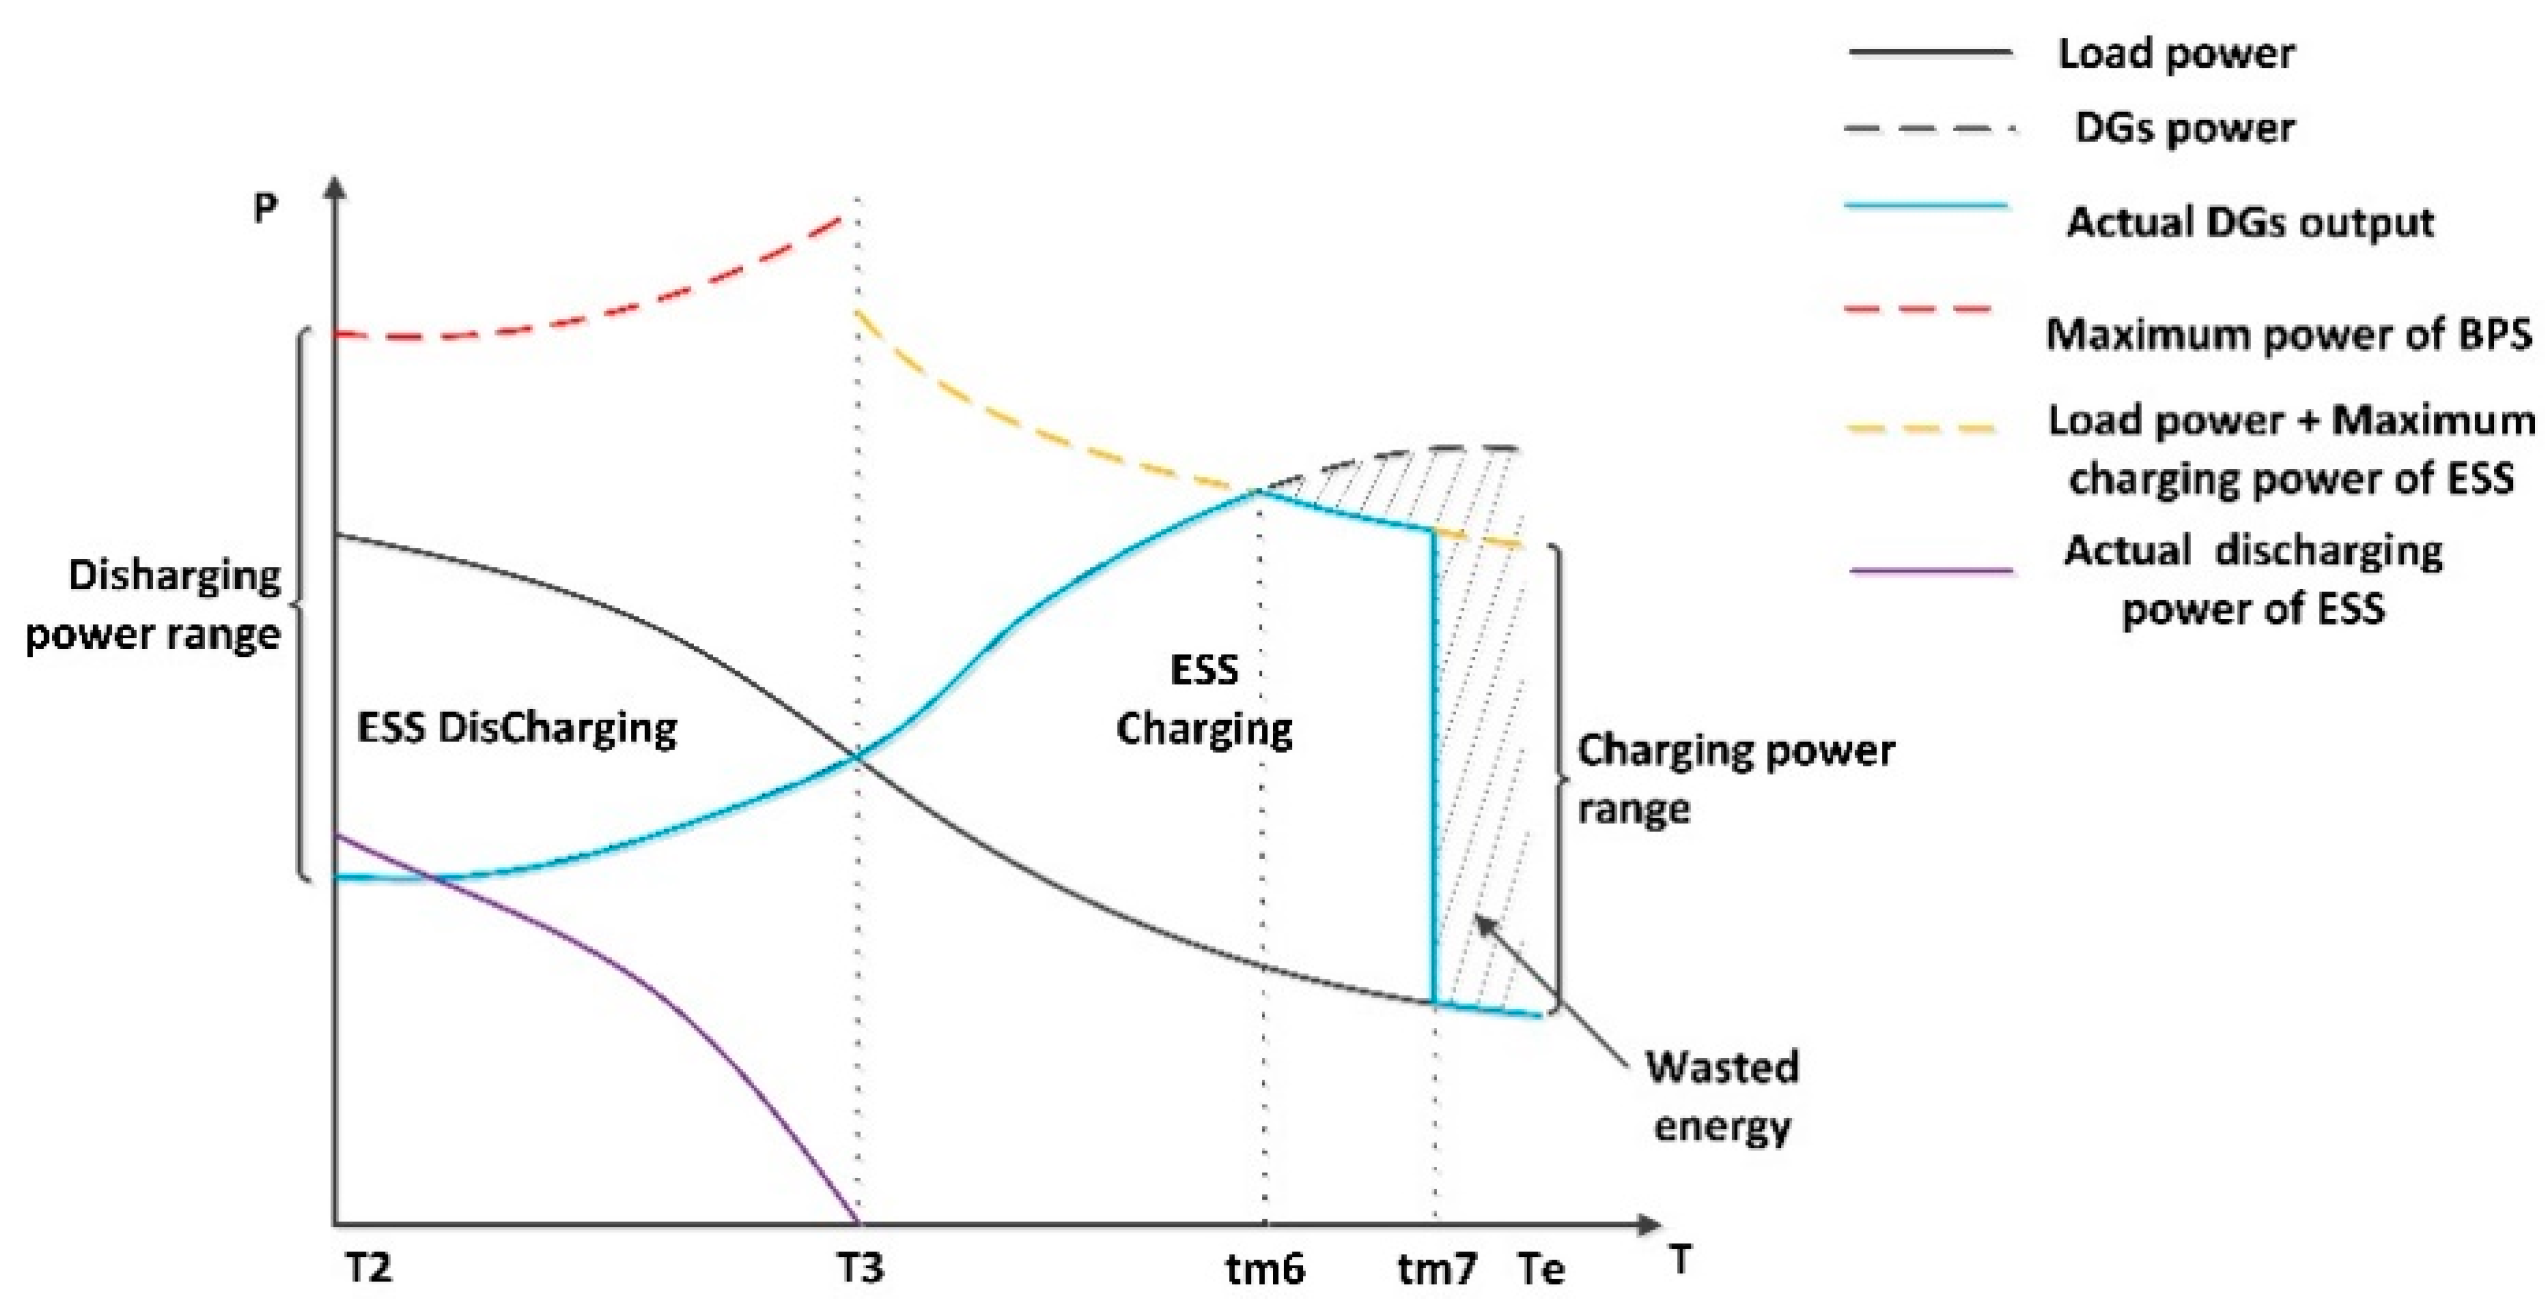
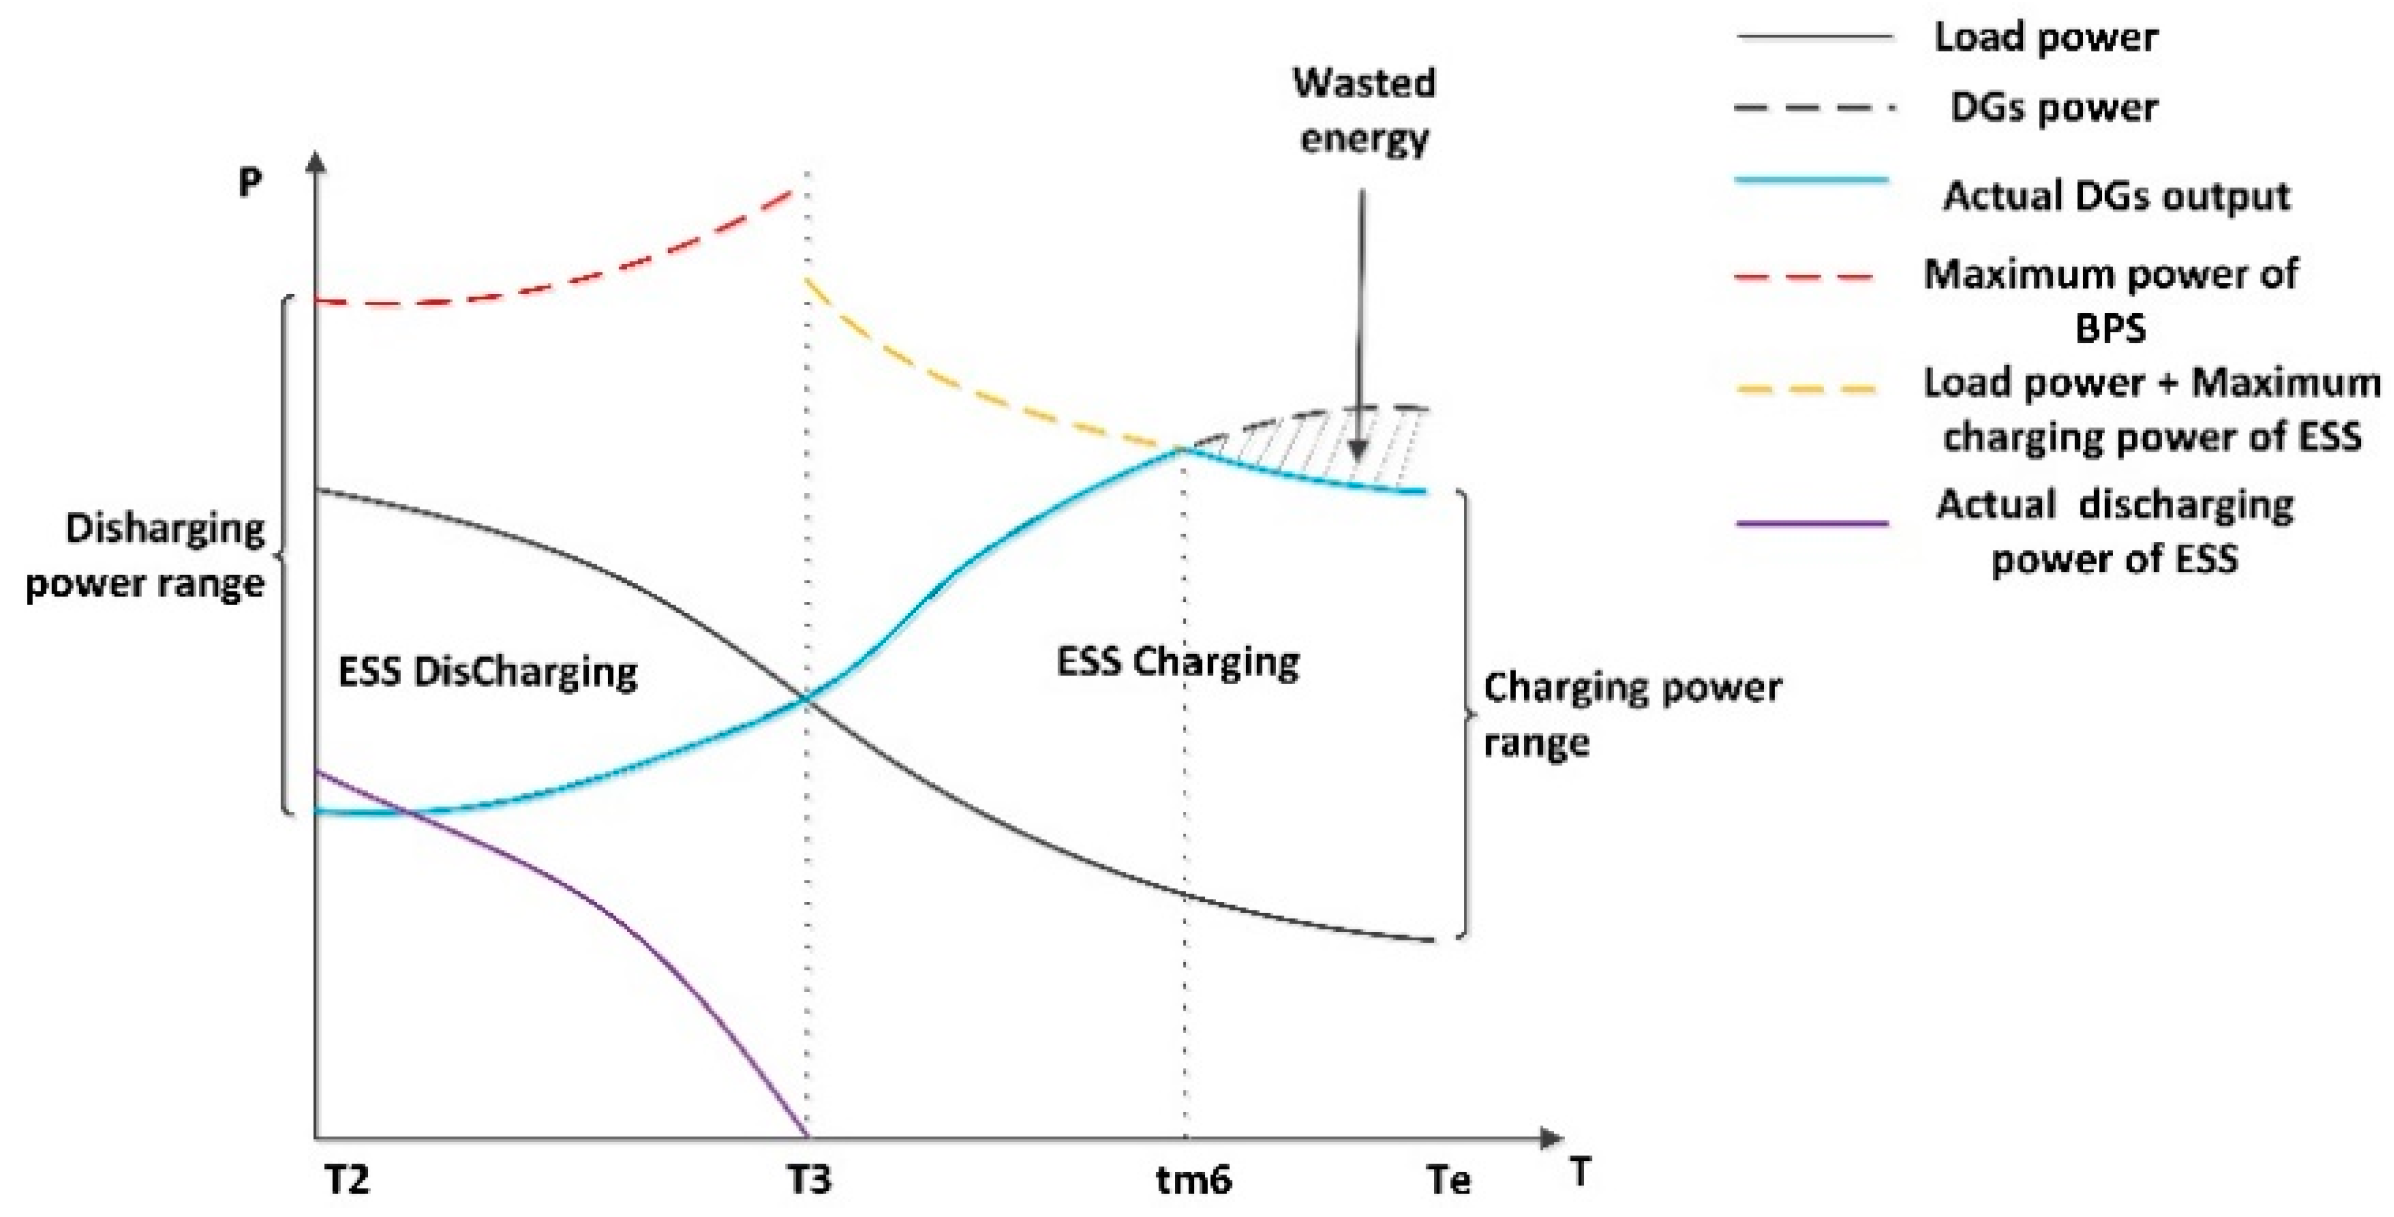
Appendix C
| Lines | Important User Corresponding Node | Length (m) | Line Type | Wire Cross-Sectional Area (mm2) |
|---|---|---|---|---|
| 45–46 | 45 (confidential A) | 481 | JKLYJ-120 | 120 |
| 67–68 | 67 (confidential B) | 506 | JKLYJ-240 | 240 |
| DL-B | 73 (hospital B) | Dedicated line | ||
| 9–12 | 9 (hospital A) | 278 | JKLYJ-240 | 240 |
| 70–71 | 70 (confidential D) | 215 | JKLYJ-120 | 120 |
| 29–39 | 29 (financial A) | 450 | JKLYJ-150 | 150 |
| DL-A | 72 (business A) | Dedicated line | ||
| DL-C | 74 (confidential C) | Dedicated line | ||
References
- Andersson, G.; Donalek, P. Causes of the 2003 major grid blackouts in North America and Europe and recommended means to improve system dynamic performance. IEEE Trans. Power Syst. 2005, 20, 1922–1928. [Google Scholar] [CrossRef]
- Ruszczak, B.; Tomaszewski, M. Extreme Value Analysis of Wet Snow Loads on Power Lines. IEEE Trans. Power Syst. 2015, 30, 457–462. [Google Scholar] [CrossRef]
- Hines, P.; Apt, J.; Talukdar, S. Trends in the history of large blackouts in the United States. In Proceedings of the IEEE Power and Energy Society General Meeting-Conversion and Delivery of Electrical Energy in the 21st Century, Pittsburgh, PA, USA, 20–24 July 2008; pp. 1–8. [Google Scholar]
- Kollar, L.E.; Farzaneh, M.; Van Dyke, P. Modeling ice shedding propagation on transmission lines with or without interphase spacers. IEEE Trans. Power Del. 2013, 28, 261–267. [Google Scholar] [CrossRef]
- Brostrom, E.; Ahlberg, J.; Soder, L. Modelling of Ice Storms and their Impact Applied to a Part of the Swedish Transmission Network. In Proceedings of the IEEE Lausanne Power Tech, Lausanne, Switzerland, 1–5 July 2007. [Google Scholar]
- Newman, D.E.; Carreras, B.A.; Lynch, V.E. Exploring complex systems aspects of blackout risk and mitigation. IEEE Trans. Reliab. 2011, 60, 134–143. [Google Scholar] [CrossRef]
- Kirschen, D.S.; Jayaweera, D. Comparison of risk-based and deterministic security assessments. Gener. Transm. Distrib. IET 2007, 1, 527. [Google Scholar] [CrossRef]
- Chen, L.; Jing, L.; Jing, C. Research of risk-based security assessment of power system. In Proceedings of the 4th International Conference on Electric Utility Deregulation and Restructuring and Power Technologies (DRPT), Weihai, China, 6–9 July 2011. [Google Scholar]
- Pei, C.; Zhang, Z.; Yin, X. Index system and methods for urban power grid operation risk assessment. In Proceedings of the IEEE PES Asia-Pacific Power and Energy Engineering Conference (APPEEC), Xi’an, China, 25–28 October 2016. [Google Scholar]
- Pan, Z.; Zhang, Y. Index system and method for structure strength assessment of urban power network. Proc. Chin. Soc. Electr. Eng. 2015, 35, 3999–4005. [Google Scholar]
- Li, J.; Chen, L.; Luo, Y.; Zhao, J.; Ma, N. Power system on-line risk assessment and decision support based on weighting fault possibility model. In Proceedings of the International Conference on Transportation, Mechanical, and Electrical Engineering (TMEE), Changchun, China, 16–18 December 2011; pp. 1058–1061. [Google Scholar]
- Zhao, T.; Lu, D.; Wang, D.; Zeng, Y.; Liu, Y. A risk assessment approach for power system based on a comprehensive fault probabilistic model. In Proceedings of the 5th International Conference on Electric Utility Deregulation and Restructuring and Power Technologies (DRPT), Changsha, China, 26–29 November 2015; pp. 574–577. [Google Scholar]
- Sun, Y.; Wang, X.; Bie, Z.; Wang, X. Characteristics Analysis and Risk Modeling of Ice Flashover Fault in Power Grids. IEEE Trans. Power Deliv. 2012, 27, 1301–1312. [Google Scholar] [CrossRef]
- Niu, G.; Zhou, L.; Qi, Z. A novel fault self-recovery strategy for distribution network with distributed generation. In Proceedings of the China International Conference on Electricity Distribution (CICED), Xi’an, China, 10–13 August 2016; pp. 1–6. [Google Scholar]
- Rao, R.S.; Ravindra, K.; Satish, K. Power loss minimization in distribution system using network reconfiguration in the presence of distributed generation. IEEE Trans. Power Syst. 2013, 28, 317–325. [Google Scholar] [CrossRef]
- Jazebi, S.; Hadji, M.M.; Naghizadeh, R.A. Distribution network reconfiguration in the presence of harmonic loads: Optimization techniques and analysis. IEEE Trans. Smart Grid 2014, 5, 1929–1937. [Google Scholar] [CrossRef]
- Lin, Y.; He, J.; Xu, X.; Shan, Z. Research on Fault Recovery Coordination Strategy of Transmission and Distribution Network Based on Multi-Source Data. In Proceedings of the China International Conference on Electricity Distribution (CICED), Tianjin, China, 17–19 September 2018; pp. 1086–1089. [Google Scholar]
- Guan, X.; Ma, Y.; Shao, Z.; Zhang, B. Research on Collaborative Defense Model of Power Grid Security. In Proceedings of the 8th International Conference on Electronics Information and Emergency Communication (ICEIEC), Beijing, China, 15–17 June 2018; pp. 270–273. [Google Scholar]
- Hu, X.; Tang, W.; Liu, H.; Zhang, D.; Lian, S.; He, Y. Construction of bulk power grid security defense system under the background of AC/DC hybrid EHV transmission system and new energy. In Proceedings of the IECON 2017-43rd Annual Conference of the IEEE Industrial Electronics Society, Beijing, China, 29 October–1 November 2017; pp. 5713–5719. [Google Scholar]
- Tang, Y.; Yan, M.; Sha, Q. Security defence system for smart grid. In Proceedings of the 4th International Conference on Electric Utility Deregulation and Restructuring and Power Technologies (DRPT), Weihai, Shandong, China, 6–9 July 2011; pp. 189–193. [Google Scholar]
- Chen, L.; Zhang, H.; Wu, Q. A Numerical Approach for Hybrid Simulation of Power System Dynamics Considering Extreme Icing Events. IEEE Trans. Smart Grid 2017, 9, 5038–5046. [Google Scholar] [CrossRef]
- Yang, H.; Chung, C.Y.; Zhao, J. A Probability Model of Ice Storm Damages to Transmission Facilities. IEEE Trans. Power Deliv. 2013, 28, 557–565. [Google Scholar] [CrossRef]
- U.S.-Canada Power System Outage Task Force. Final Report on the 14 August 2003 Blackout in the United States and Canada: Causes and Recommendations. Available online: https://www3.epa.gov/region1/npdes/merrimackstation/pdfs/ar/AR-1165.pdf (accessed on 12 October 2019).
- Karimi, E.; Ebrahimi, A. Inclusion of blackouts risk in probabilistic transmission expansion planning by a multi-objective framework. IEEE Trans. Power Syst. 2015, 30, 2810–2817. [Google Scholar] [CrossRef]
- Su, D.; Tian, J.; Liu, J. Self-organized criticality analysis of power grids based on electric structure-load entropy. In Proceedings of the International Conference on Power System Technology (POWERCON), Chengdu, China, 20–22 October 2014; pp. 427–432. [Google Scholar]
- Lei, J.; Sun, L.; Zhu, Q.; Lu, J. Research on evaluation system of operation risk assessment and application in Henan Power Gird. In Proceedings of the IEEE PES Asia-Pacific Power and Energy Engineering Conference (APPEEC), Hong Kong, China, 7–10 December 2014; pp. 1–5. [Google Scholar]
- Xie, M.; Yin, Y.; Lu, E.; Hu, S. Study on human factor risk quantification and evaluation model in power grid dispatching risk assessment. In Proceedings of the China International Conference on Electricity Distribution (CICED), Xi’an, China, 10–13 August 2016; pp. 1–5. [Google Scholar]
- Yuan, L.; Dong, R. A Novel Risk Assessment Algorithm for Accounting Information System Using Analytic Hierarchy Process. In Proceedings of the 8th International Conference on Intelligent Computation Technology and Automation (ICICTA), Nanchang, China, 14–15 June 2015; pp. 61–64. [Google Scholar]
- Ma, C.; Ling, W.; Wu, J.; Wang, K.; Ding, J. Dynamic Load Transfer of Active Distribution Network Based on Prediction Information. In Proceedings of the China International Conference on Electricity Distribution (CICED), Tianjin, China, 17–19 September 2018; pp. 960–966. [Google Scholar]
- Zhang, K.; Liu, K.; Yao, N.; Jia, Y.; Li, W.; Qin, L. The impact of distributed generation and its parallel operation on distribution power grid. In Proceedings of the 5th International Conference on Electric Utility Deregulation and Restructuring and Power Technologies (DRPT), Changsha, China, 26–29 November 2015; pp. 2041–2204. [Google Scholar]
- Zhang, H.; Chen, L.; Wang, H.; Zhao, Y.; Chen, L.; Duan, B. Island Partition of Distribution Network with Microgrid and Distributed Generation Based on Floyd-Warshall Algorithm. In Proceedings of the International Conference on Smart Grid and Electrical Automation (ICSGEA), Changsha, China, 9–10 June 2018; pp. 29–33. [Google Scholar]


| Constraints | Charging State | Discharging State |
|---|---|---|
| Island Power Balance | ||
| Charge and discharge power constraints | ||
| Island load demand | ||
| State of charge (SOC) constraints |
| Lines | ||||||||||||
|---|---|---|---|---|---|---|---|---|---|---|---|---|
| 45–46 | 0.125 | 0.04 | 0.027 | 0.009 | 0.239 | 0.25 | 0.459 | 0.214 | 0.425 | 0.3 | 0.238 | 0.420 |
| 67–68 | 0.150 | 0.045 | 0.027 | 0.004 | 0.275 | 0.625 | 0.307 | 0.214 | 0.54 | 0.525 | 0.343 | 0.518 |
| DL-B | 0.063 | 0.045 | 0.021 | 0.003 | 0.148 | 1 | 0.18 | 0.539 | 0.18 | 0.05 | 0.096 | 0.230 |
| 9–12 | 0.178 | 0.045 | 0.023 | 0.0096 | 0.265 | 0.325 | 0.395 | 0.388 | 0.74 | 0.5 | 0.364 | 0.534 |
| 70–71 | 0.240 | 0.039 | 0.029 | 0.0091 | 0.343 | 0.25 | 0.231 | 0.257 | 0.27 | 0.175 | 0.163 | 0.450 |
| 29–39 | 0.147 | 0.034 | 0.019 | 0.0037 | 0.223 | 0.375 | 0.325 | 0.366 | 0.45 | 0.47 | 0.311 | 0.465 |
| DL-A | 0.058 | 0.020 | 0.013 | 0.007 | 0.116 | 1 | 0.187 | 0.429 | 0.18 | 0.075 | 0.103 | 0.207 |
| DL-C | 0.071 | 0.039 | 0.015 | 0.005 | 0.138 | 1 | 0.151 | 0.217 | 0.18 | 0.075 | 0.076 | 0.204 |
| Index | Weights | Line 45–46 | Line 67–68 | Line DL-B | Line 9–12 | Line 70–71 | Line 29–39 | Line DL-A | Line DL-C |
|---|---|---|---|---|---|---|---|---|---|
| 0.064 | 10.37 | 18.69 | 5.25 | 20.98 | 17.71 | 13.64 | 7.89 | 7.16 | |
| 0.056 | 35.86 | 17.44 | 177.2 | 10.28 | 15.93 | 27.88 | 96.85 | 110.74 | |
| 0.048 | 0.479 | 0.64 | 0.364 | 0.705 | 0.656 | 0.493 | 0.383 | 0.378 | |
| 0.076 | 0.0204 | 0.0648 | 0.0216 | 0.077 | 0.015 | 0.038 | 0.027 | 0.025 | |
| 0.076 | 8.19 | 16.5 | 3.77 | 20.1 | 5.69 | 14.8 | 4.92 | 4.57 | |
| 0.076 | 3.25 | 10.6 | 4.49 | 3.75 | 7.83 | 9.26 | 3.88 | 5.03 | |
| 0.096 | 0.025 | 0.052 | 0.046 | 0.043 | 0.027 | 0.047 | 0.041 | 0.041 | |
| 0.096 | 0.091 | 0.169 | 0.252 | 0.136 | 0.094 | 0.159 | 0.246 | 0.245 | |
| 0.078 | 0.0146 | 0.027 | 0.024 | 0.027 | 0.0135 | 0.0405 | 0.0276 | 0.0675 | |
| 0.066 | 0.01 | 0.029 | 0.034 | 0.015 | 0.011 | 0.019 | 0.038 | 0.038 | |
| 0.066 | 0.35 | 0.22 | 0.41 | 0.27 | 0.5 | 0.18 | 0.38 | 0.45 | |
| 0.066 | 0.37 | 0.11 | 0.53 | 0.17 | 0.36 | 0.2 | 0.66 | 0.42 | |
| 0.068 | 0.009 | 0.018 | 0.018 | 0.009 | 0.009 | 0.018 | 0.018 | 0.018 | |
| 0.068 | 0.021 | 0.053 | 0.053 | 0.021 | 0.021 | 0.053 | 0.053 | 0.053 |
| Defense Strategies | Switching Action Process | Number of Switching Operations | Loss of Load (10,000 kW) |
|---|---|---|---|
| no strategy | no | 0 | 29.432 |
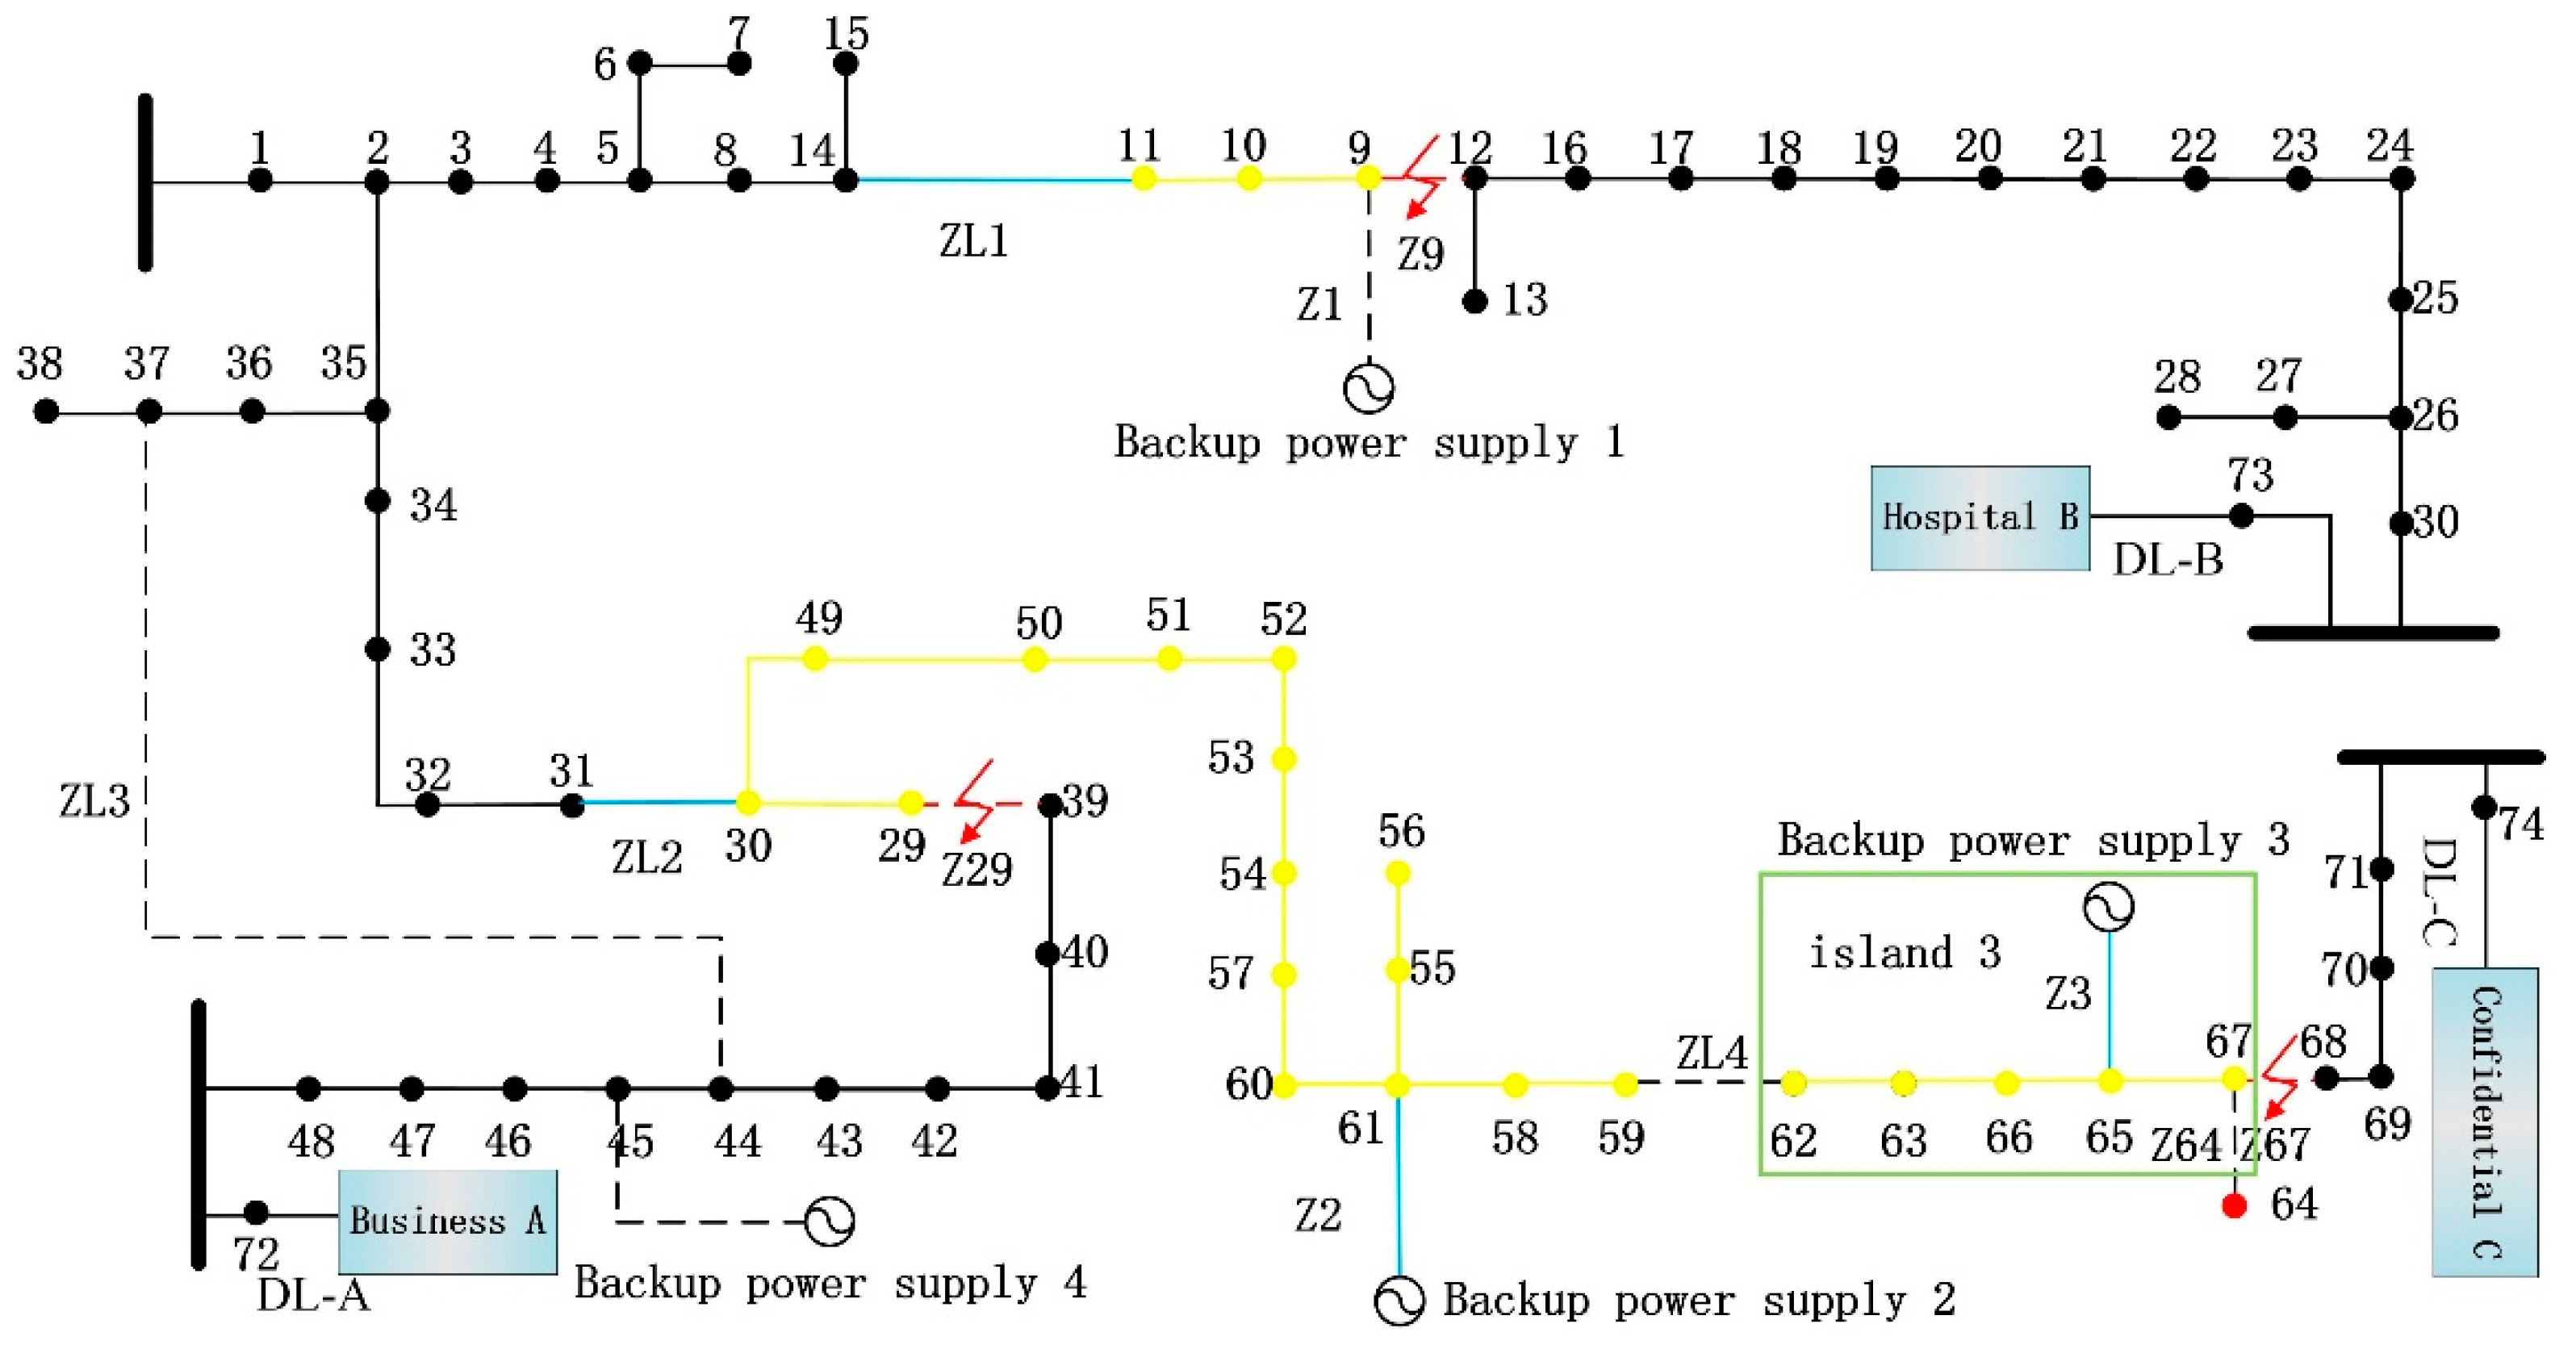
| only the load transfer strategy | close ZL1, ZL2; disconnect Z9, Z29, Z55, Z58. | 6 | 16.514 |
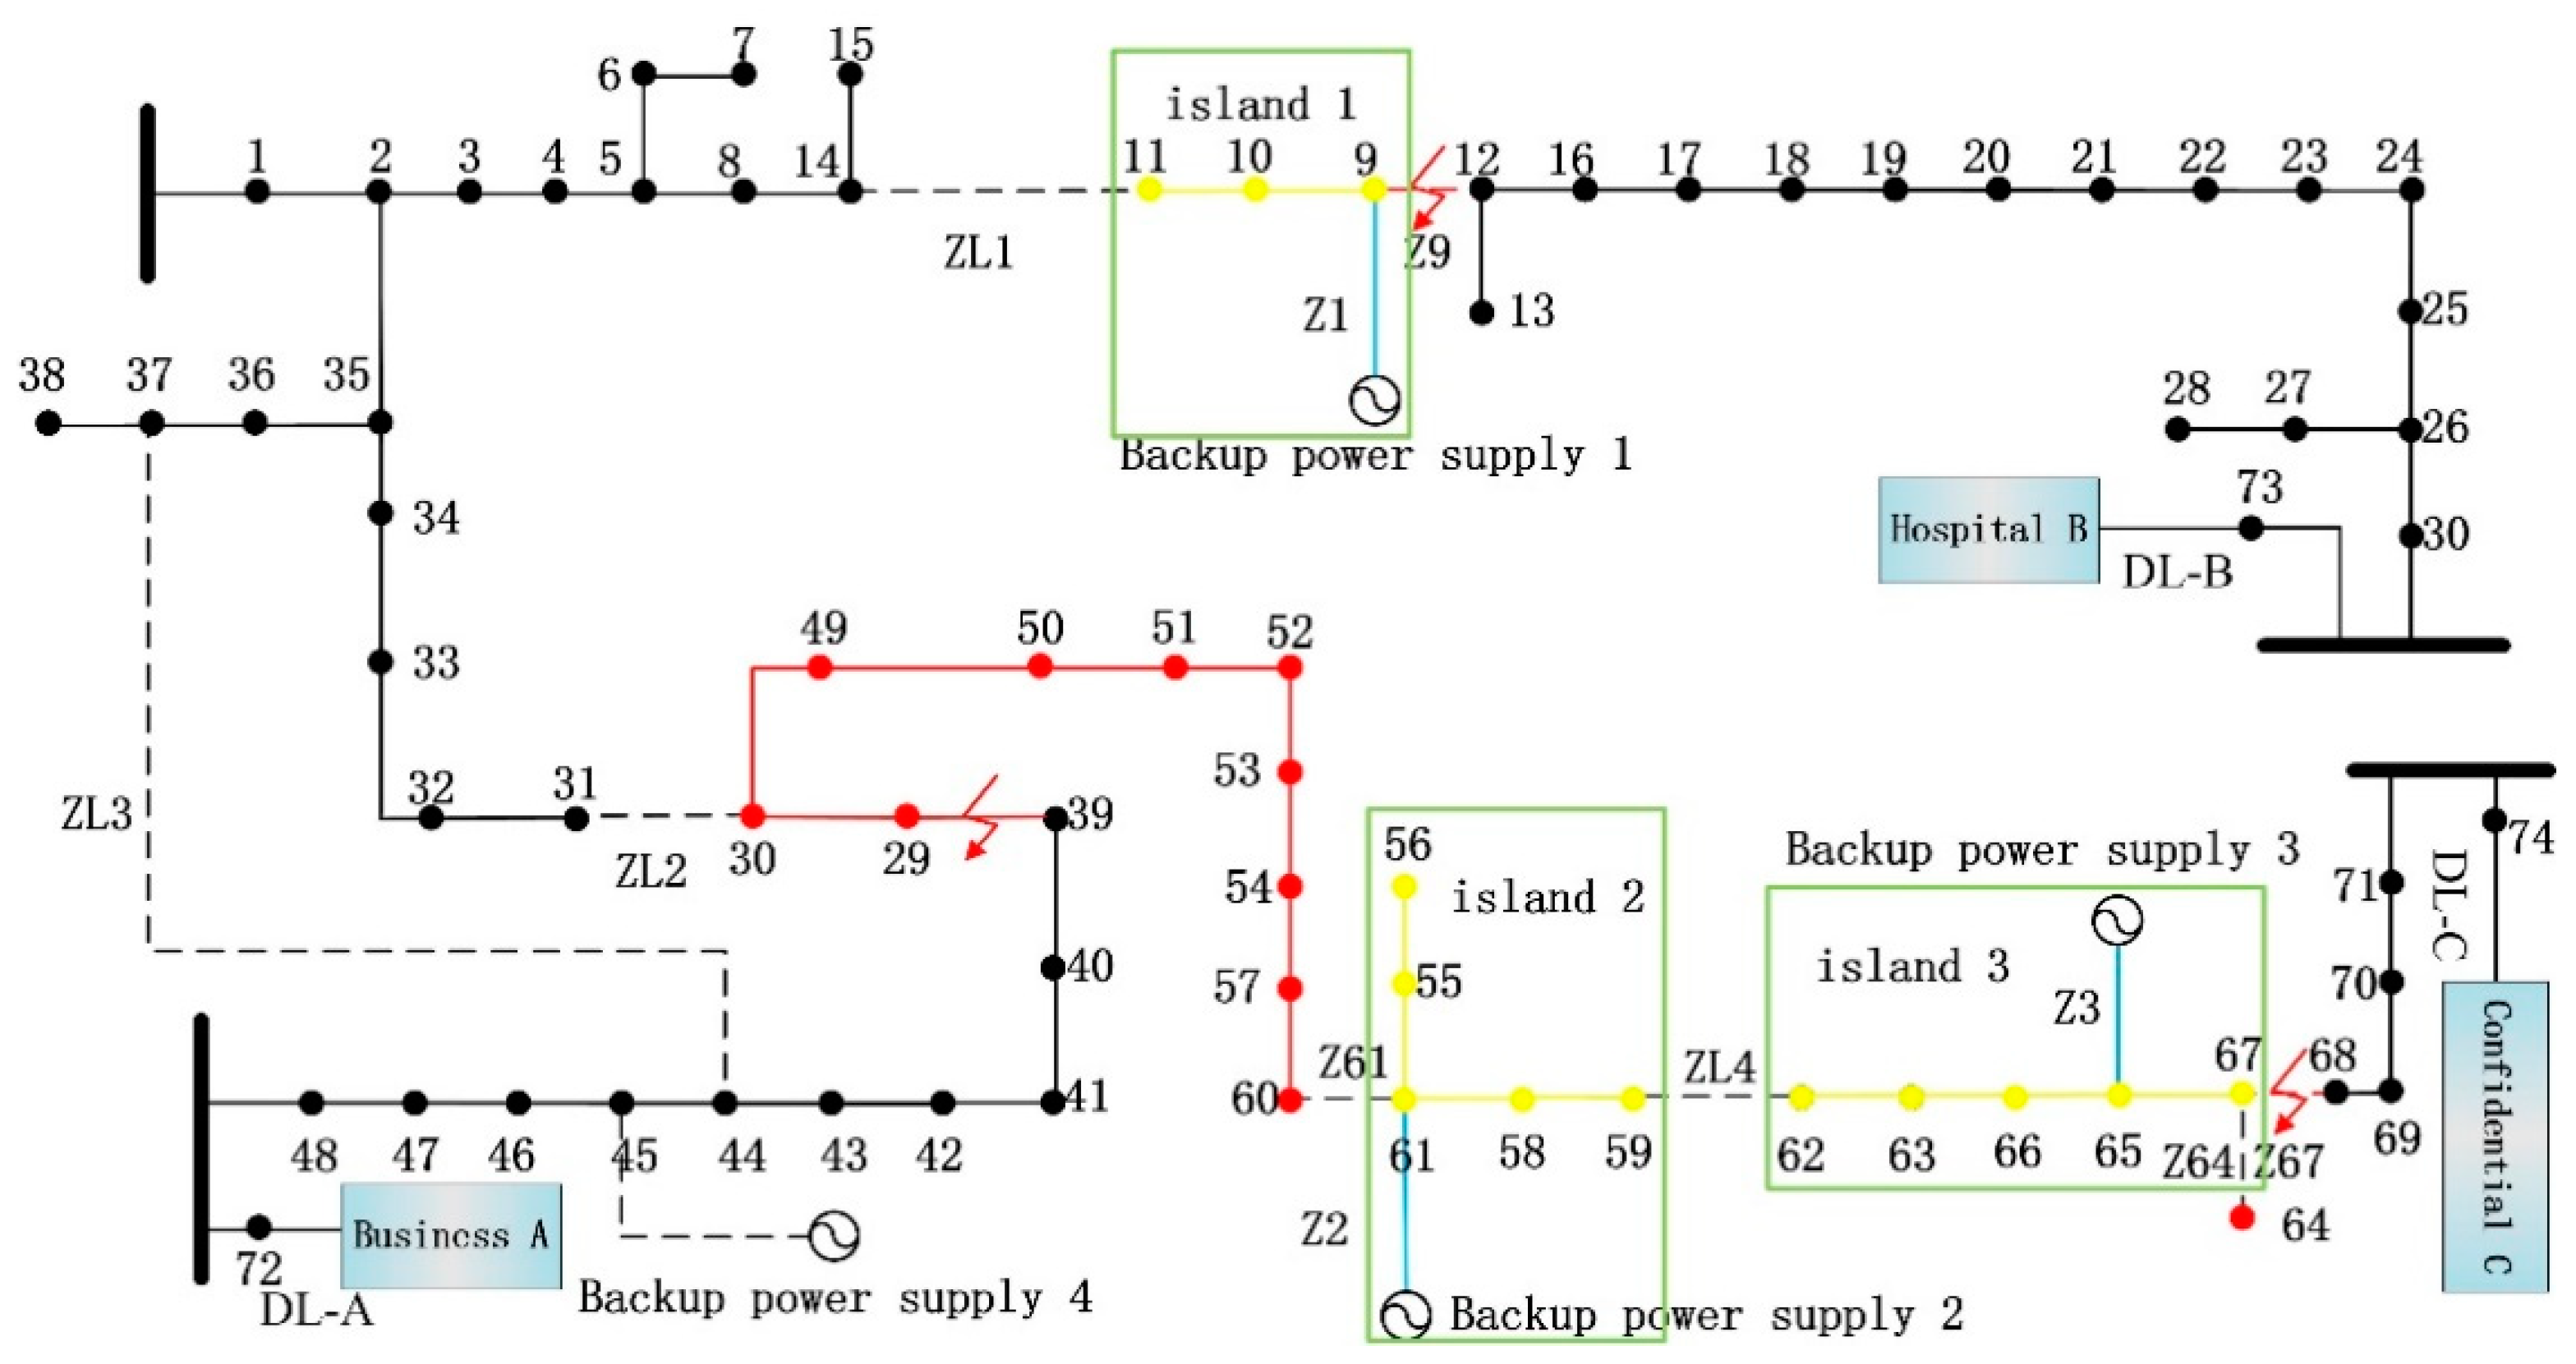
| only the island strategy | access Z1, Z2, Z3; disconnect Z9, Z61, Z64, Z67. | 7 | 18.875 |
| coordinated active defense strategy (CADS) | access Z2, Z3; close ZL1, ZL2; disconnect Z9, Z29, Z64, Z67. | 8 | 1.61 |
© 2020 by the authors. Licensee MDPI, Basel, Switzerland. This article is an open access article distributed under the terms and conditions of the Creative Commons Attribution (CC BY) license (http://creativecommons.org/licenses/by/4.0/).
Share and Cite
Liu, X.-R.; Wang, H.; Sun, Q.-Y.; Jin, P. Research on Dynamic Risk Assessment and Active Defense Strategy of Active Distribution Network under Ice Weather. Appl. Sci. 2020, 10, 672. https://doi.org/10.3390/app10020672
Liu X-R, Wang H, Sun Q-Y, Jin P. Research on Dynamic Risk Assessment and Active Defense Strategy of Active Distribution Network under Ice Weather. Applied Sciences. 2020; 10(2):672. https://doi.org/10.3390/app10020672
Chicago/Turabian StyleLiu, Xin-Rui, Hao Wang, Qiu-Ye Sun, and Peng Jin. 2020. "Research on Dynamic Risk Assessment and Active Defense Strategy of Active Distribution Network under Ice Weather" Applied Sciences 10, no. 2: 672. https://doi.org/10.3390/app10020672
APA StyleLiu, X.-R., Wang, H., Sun, Q.-Y., & Jin, P. (2020). Research on Dynamic Risk Assessment and Active Defense Strategy of Active Distribution Network under Ice Weather. Applied Sciences, 10(2), 672. https://doi.org/10.3390/app10020672


