Article

Novel Gradation Design of Porous Asphalt Concrete with Balanced Functional and Structural Performances

1
College of Civil Engineering, Nanjing Forestry University, Nanjing 210037, China
2
Zhong Jiao Jian Ji Jiao Expressway Investment Development Co., Ltd., Shijiazhuang 050000, China
*
Author to whom correspondence should be addressed.
Appl. Sci. 2020, 10(20), 7019; https://doi.org/10.3390/app10207019
Submission received: 7 September 2020 / Revised: 29 September 2020 / Accepted: 30 September 2020 / Published: 9 October 2020
(This article belongs to the Special Issue Asphalt Materials II)

Abstract

:
To improve the permeability of porous asphalt concrete (PAC) with a small nominal maximum aggregate size (NMAS) of 10 mm (PAC10), a novel gradation design by excluding the 0.075–3 mm aggregate was developed. This study aims to evaluate the functional and structural performances of the novel PAC10 with various mineral filler contents, using the conventional PAC10 and 13 mm NMAS PAC (PAC13) as reference, and develop the optimum gradation of the novel PAC10. The performance properties evaluated include moisture susceptibility, durability, high-temperature stability, low-temperature cracking resistance and permeability. The results indicated that for the two conventional PACs with the same fine aggregate and mineral filler content, PAC10 had worse permeability and rutting resistance, similar moisture susceptibility and durability, and better low-temperature cracking resistance, compared with the PAC13. The novel PAC10 showed better permeability than the conventional PAC10. With the increase of the mineral filler content, the structural performance of the novel PAC10 is improved, but its permeability is decreased. With a mineral filler content of 6%, the novel PAC10 can have balanced functional and structural performances, which are equivalent to those of the conventional PAC13.

1. Introduction

Porous asphalt concrete (PAC) has been widely used as a road surfacing material because of its various beneficial functions, such as low traffic noise, good visibility and better friction, obtained by the drainage capability of the mixture and by the macro-texture that is created due to the gradation in rainy days [1,2,3,4,5,6,7]. These attractive functions are mainly attributed to its high air void content (typically 15−20%) that allows water to penetrate into the material and absorbs noise. However, the high air void content also decreases durability of PAC, because water and oxygen have larger contact surface area with the mixture [8,9,10]. Thus, it is important to balance the functional performance (i.e., permeability) and structural performance of PAC in mixture design [11].
Many researches have been carried out to improve the overall performance of PAC. It has been reported that some measures were effective in improving the structural performance of PAC, such as using high-viscosity binder, fiber and so on [12,13], while aggregate gradation plays an important role in both the structural and functional performance of PAC [14,15]. Aggregate gradation is very important for PAC, because it controls the porosity of the aggregate structure, which in turn affects the permeability of PAC.
PAC13 which has a nominal maximum aggregate size (NMAS) of 13.2 mm is now widely used in the permeable surface layer, which is typically 40 mm thick, in China [16]. Because of its excellent surface characteristics, there is increasing demand on using PAC in overlays for highway maintenance projects in recent years, and PAC with smaller NMAS is desired for thin overlays. However, a smaller NMAS may reduce the permeability of PAC [17]. In China, the asphalt mixtures used in the surface layer are typically composed of aggregate with four aggregate size ranges, including 1#: 10 to 15 mm, 2#: 5 to 10 mm, 3#: 3 to 5 mm, and 4#: 0.075–3 mm, and the 3# aggregate is typically excluded in PAC to meet the requirement of open-graded gradation. In this study, to improve the permeability of the small NMAS PAC, a novel PAC with 10 mm aggregate size (PAC10) was proposed by excluding the 4# aggregate, instead of 3#. However, removing 4# aggregate may negatively affect the durability of PAC, and using more mineral filler to create more mastic coating the coarse aggregate might be a solution to compensate such effect. To this end, this study aims to evaluate the effects of gradation composition, especially the mineral filler content, on both the structural and functional performances of PAC10. For comparison, two conventional PACs, PAC10-C (conventional PAC10) and PAC13 (PAC with 13 mm NMAS) were also evaluated as reference.

2. Materials and Test Methods

2.1. Material

2.1.1. Binder

A Styrene–butadiene–styrene (SBS) modified asphalt binder with a Superpave performance grade of PG 76−22 was chosen in this study. Its properties are presented in Table 1.

2.1.2. Aggregate

The aggregate selected in this study was crushed basalt, which is widely used in the surface layers of highways in China. Table 2 lists the properties of the coarse and fine aggregate, which all meet the Chinese specification requirement.

2.1.3. Mineral Filler

The mineral filler used in this study was from limestone; its properties are presented in Table 3.

2.1.4. Additives

A common type of high viscosity additive (HVA) and polyester fiber were used to improve the durability of PAC. The HVA is a kind of polymer modifier, which can improve the kinetic viscosity of bitumen at 60 °C obviously. The HVA content was 8% weight of binder, and the dosage of the fiber was 0.25% by weight of aggregate.

2.2. Gradations

To select the PAC gradations for research purpose, some specifications and previous studies were used as reference [19,21,22]. Five gradations, including one PAC13 and four PAC10s, as shown in Table 4 were selected based on the following considerations: (1) PAC13 and PAC10-C have the same fine aggregate and mineral filler content, but different NMAS; (2) PAC10-C has the same NMAS as PAC10-I4, PAC10-I6, and PAC10-I8, but different fine aggregate contents; (3) PAC10-I4, PAC10-I6, and PAC10-I8 are the novel PACs with 4%, 6%, and 8% mineral filler, respectively.

2.3. Optimum Asphalt Content

According to the design method of PAC in China, the allowable range of asphalt content is determined based on the results of the Cantabro abrasion test and Schellenberg binder draindown test. The trial asphalt content was determined based on the assumed asphalt film thickness of 13 um and total aggregate surface area. Five trial mixtures of varying asphalt contents in 0.5% increment were prepared for the two tests, and each test was repeated three times at each trial asphalt content. As Figure 1 illustrates, the minimum asphalt content is determined as the content corresponding to the inflection point of the Cantabro loss curve, and the maximum asphalt content is determined as the content corresponding to the inflection point of the draindown ratio curve [12].
Typically, the optimum asphalt content (OAC) of the PAC mixture is selected between the minimum and maximum asphalt contents. However, to provide better durability, the maximum asphalt content can be selected to produce larger asphalt film thickness. In addition, the PAC should also meet the mixture design requirements, such as the minimum Marshall stability of 3.5 kN, the minimum tensile strength ratio (TSR) of 75%, and the target air void content, which was 21% in the study.

2.4. Mixture Performance Testing

2.4.1. Schellenberg Binder Draindown Test

Since PAC has very few fine particles, too much asphalt will leads it to flow off the aggregates, which known as draindown. Therefore, the Schellenberg binder draindown tests were carried out on mixes at a mixing temperature of 185 °C to evaluate the binders’ draindown potential according to T0732-2011 (JTG E20-2011) [18].

2.4.2. Cantabro Abrasion Test

The Cantabro abrasion test is widely used to evaluate the durability of PAC [12]. The mass loss during this test is defined as the Cantabro mass loss, which is calculated as follows:
Δ S = m 0 m 1 m 0 × 100
where ΔS = Cantabro mass loss, %; m0 = sample weight before test, g; and m1 = sample weight after test.
The Cantabro test was conducted in accordance with the Chinese specifications T0733-2011 (JTG E20-2011) [18], and the specimens were conditioned in the following three ways in this study:
  • Standard Cantabro test: specimens were tested after being immersed at 20 °C water for 20 h;
  • Immersion Cantabro test: specimens were tested after being immersed at 60 °C water for one, two, and three days;
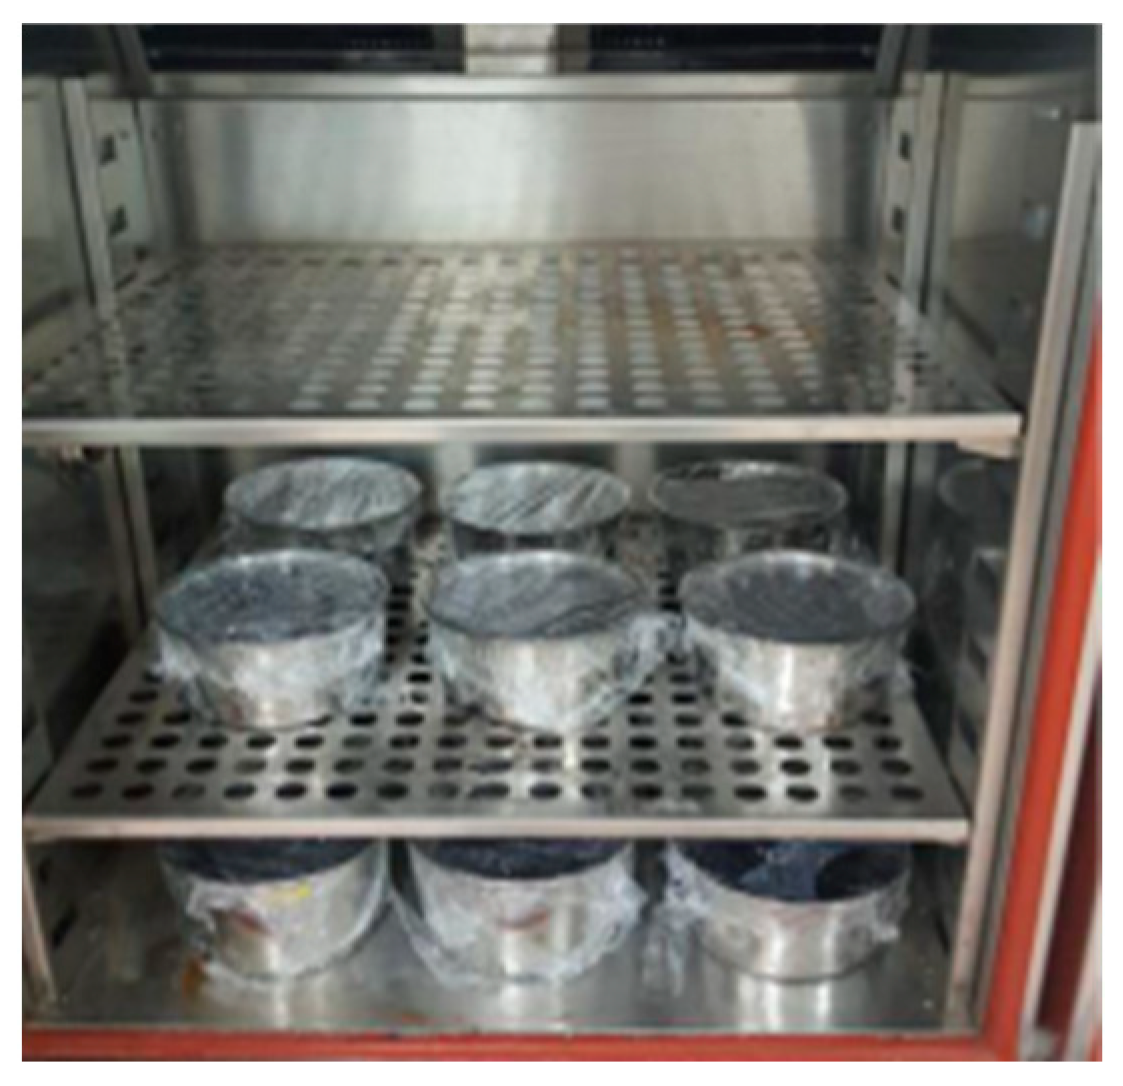
  • Freeze–thaw Cantabro test: specimens were tested after one, two, and three freeze–thaw cycles. For the freeze–thaw condition, the immersed specimens are placed in a programmable high and low temperature test chamber, as shown in Figure 2. One cycle temperature condition is that the temperature in the chamber is at 60 °C for 12 h and then at −18 °C for 12 h.
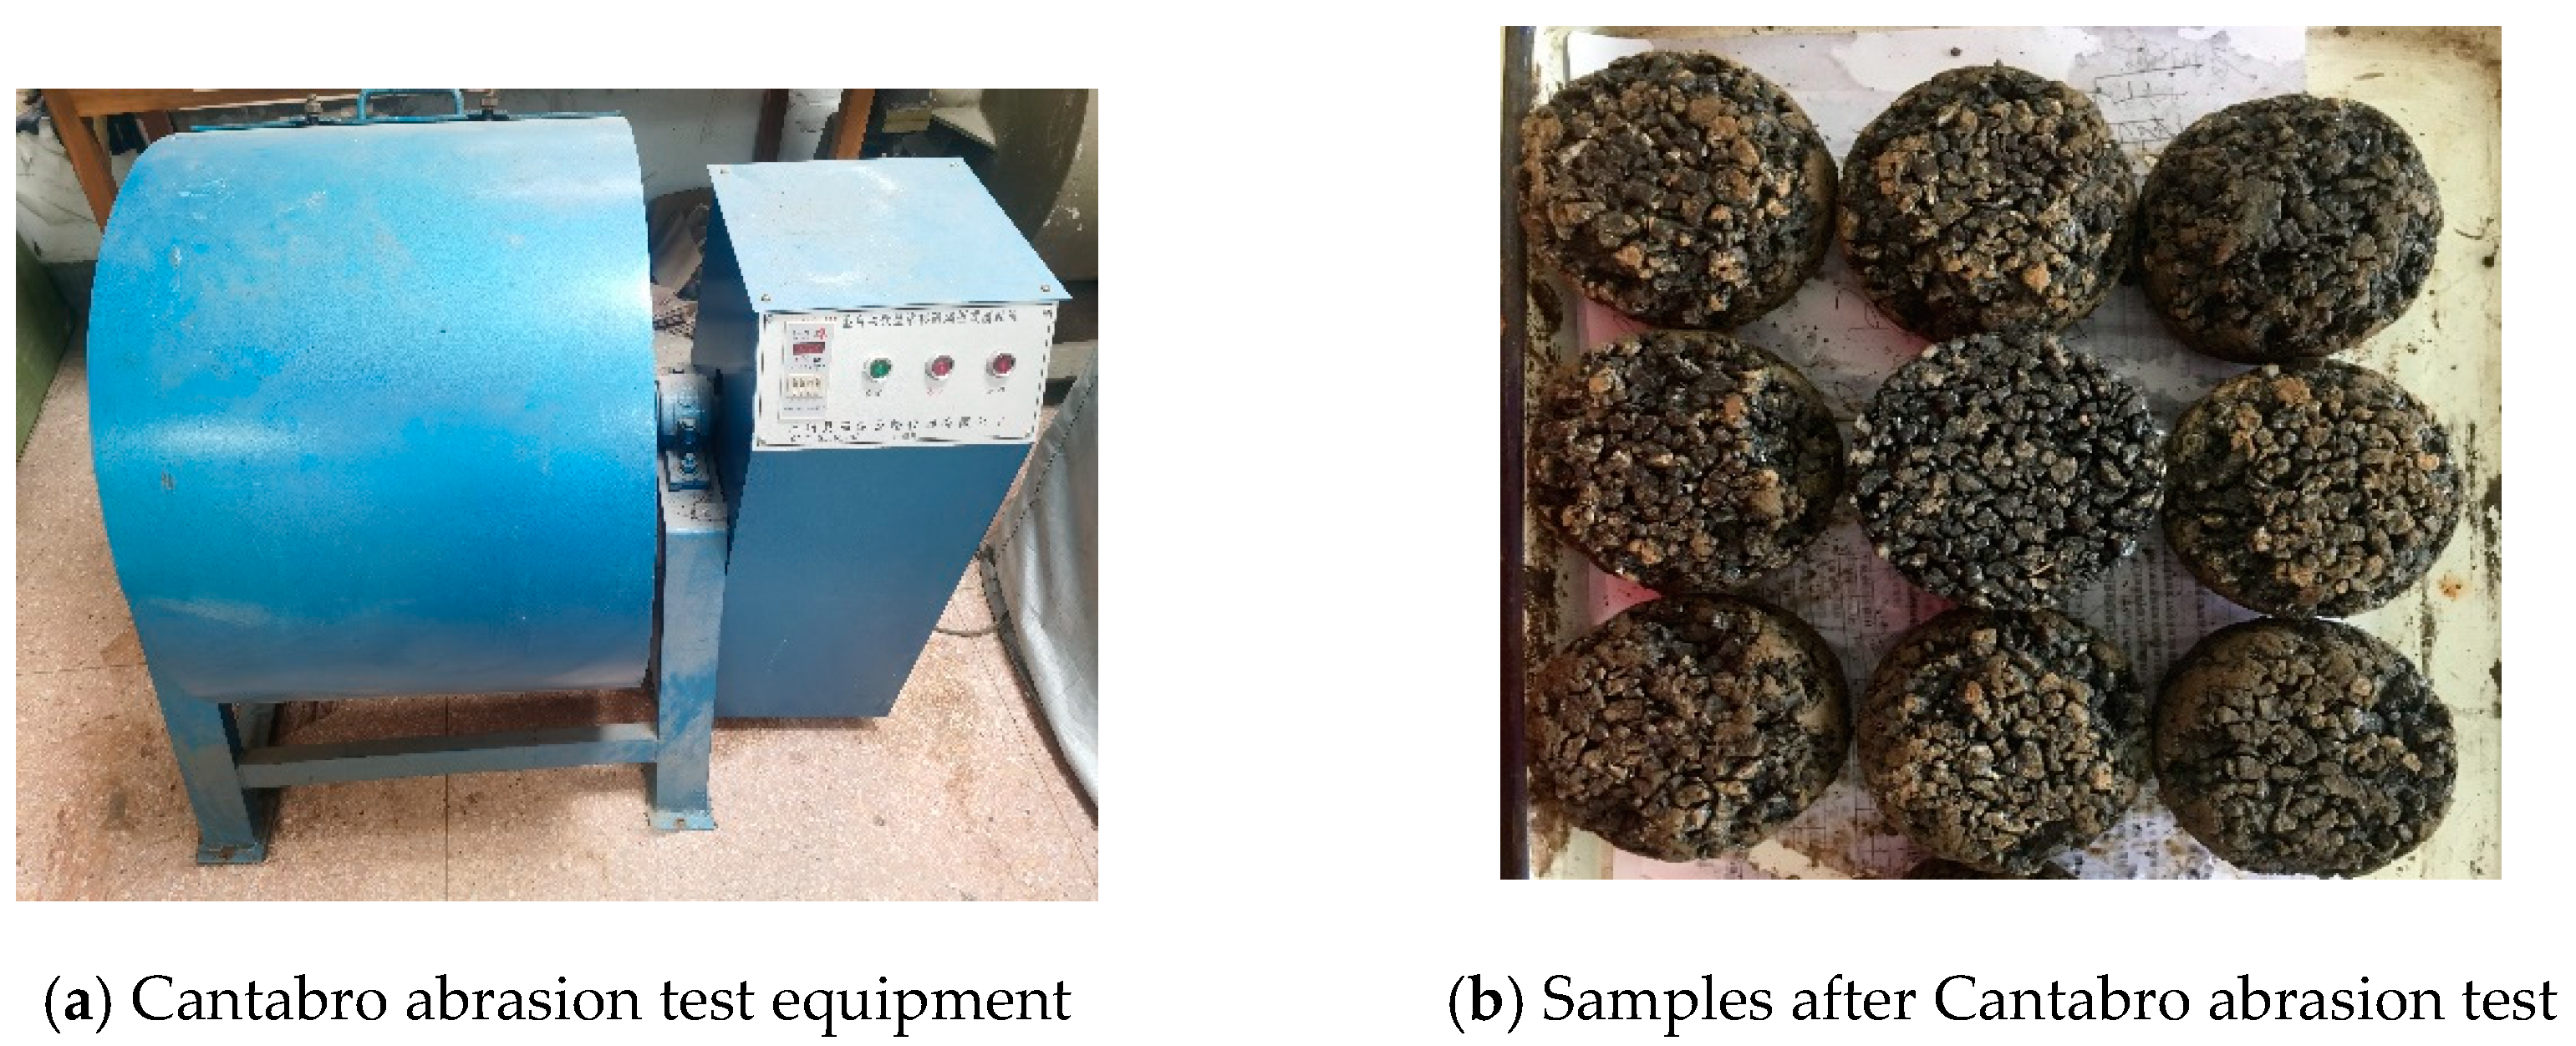
In this study, the standard Cantabro test was used to determine the minimum asphalt content of PAC, while the immersion and freeze–thaw Cantabro tests were used to evaluate the durability of PAC. The Cantabro abrasion test equipment and samples after Cantabro abrasion test are shown in Figure 3.

2.4.3. Moisture Susceptibility Test

The moisture resistances of PAC10 mixtures were evaluated by the TSR test according to the modified AASHTO T283 [23]. More specifically, the freeze–thaw condition in AASHTO T283 was modified to that for the aforementioned freeze–thaw Cantabro test, and the TSR tests were carried out after one, two, and three freeze–thaw cycles.

2.4.4. High-Temperature Permanent-Deformation Test

The high-temperature rutting resistances of the PCA10 mixtures were studied by the wheel tracking test in accordance with T0719-2011 (JTG E20-2011) [18]. The test slab has a dimension of 300 × 300 × 50 mm, and the wheel tracking tests were conducted under the standard condition, i.e., loading pressure of 0.7 MPa and testing temperature of 60 °C. The rutting resistance of each mixture was characterized by dynamic stability, which can be calculated as the following equation:
D S = ( t 2 t 1 ) × N d 2 d 1
where DS = dynamic stability of PAC, cycle/mm; t1 = time 1 (min), 45 min in this study; t2 = time 1 (min), 45min in this study; d1 = deformation at time 1, mm; d2 = deformation at time 2, mm; and N = speed of the test wheel, 42 cycle/min in this study.

2.4.5. Low-Temperature Cracking Resistance Test

A three-point flexural beam test was conducted to evaluate the cracking resistance of the PAC mixtures at low temperature in accordance with the Chinese test specification T0715-2011 (JTG E20-2011) [18]. The test beam has a dimension of 250 ± 2.0 mm in length, 30 ± 2.0 mm in width, and 35 ± 2.0 mm in thickness, and the three-point flexural beam tests were conducted under the standard condition, i.e., loading rate of 50 mm/min and testing temperature of −10 °C. The testing parameters were calculated as follows:
R B = 3 × L × P B 2 × b × h 2
  ε B = 6 × h × d L 2  
  S B = R B ε B  
where RB = the flexural strength at failure, MPa; ε B   = the flexural strain at failure, μ ε   ; SB = the flexural stiffness at failure, MPa; L = the span of the beam, mm; b = the width of the cross-section at mid-span, mm; h = the height of the cross-section at mid-span, mm; PB = the peak load at failure, N; and d = the disturbance of mid-span at failure, mm.

2.4.6. Permeability Test

Permeability was measured with a developed constant water-head permeability test equipment. As Figure 4 shows, the equipment can measure the vertical permeability coefficient and transverse permeability coefficient of the same specimen by changing components. The cubic specimen (length of each side is 15 cm) is compacted by static loading using a custom-designed device. To calculate the vertical permeability, the vertical baffles of the equipment were removed, and the water flowing from the cross section in the transverse direction. The same principle that the horizontal baffles were removed to calculated transverse permeability. According to the Darcy law [24], permeability coefficient was calculated as follows:
K = Q ρ w t A i = Q L ρ w t Δ h
where K = permeability coefficient of mixture, cm/s; Q = seepage quality of water, g; ρ w = density of water, g/cm3; L = seepage length, cm; A = area of specimen, cm2; Δh = water-head, cm; and t = seepage time, s.
Based on a previous study [24], a hydraulic gradient of no more than 0.03 will meet the requirement of the Darcy law.

3. Test Results and Discussion

3.1. Mix Design Properties

Table 5 shows the final mix design properties of the five PAC mixtures, which all meet the design requirement for PAC in China [19]. Testing data presented in this paper are the average values of three replicate specimens, except the permeability test. It can be seen that among various mixtures, PAC13 has the lowest optimum asphalt content (OAC). For different novel PAC10s, with the increasing content of the mineral fillers, the OAC and the stability value increased, indicating that more mineral filler needs more asphalt binder to form the asphalt mastic and more asphalt mastic leads to higher Marshall stability. However, more asphalt mastic also decreased the air void content of PAC10.

3.2. Moisture Susceptibility

Figure 5 shows the results from the moisture susceptibility tests of the PAC mixtures. It can be seen that after one freeze–thaw cycle, all the five mixtures showed good moisture resistance, with TSR values larger than 85%, and the differences in TSR among mixtures are small, implying that all PAC mixtures have excellent moisture resistance at the early stage of moisture effect. However, after two freeze–thaw cycles, the TSR value of PAC10-I4 became obviously smaller than the others, and after three freeze–thaw cycles, PAC10-I4 could not meet the minimum TSR requirement of 75%.
Among the three novel PAC10s, the TSR value increased with the increasing content of the mineral fillers. After three freeze–thaw cycles, increasing the mineral filler content of PAC10 from 4% to 8% increased the TSR value by more than 10%. This can be attributed to more asphalt mastic, which improved the moisture resistance of PAC10, and such effect became more significant with longer moisture conditioning. After three freeze–thaw cycles, PAC13, PAC10-C, PAC10-I6 and PAC10-I8 showed similar TSR, which all met the minimum TSR requirement.

3.3. Durability

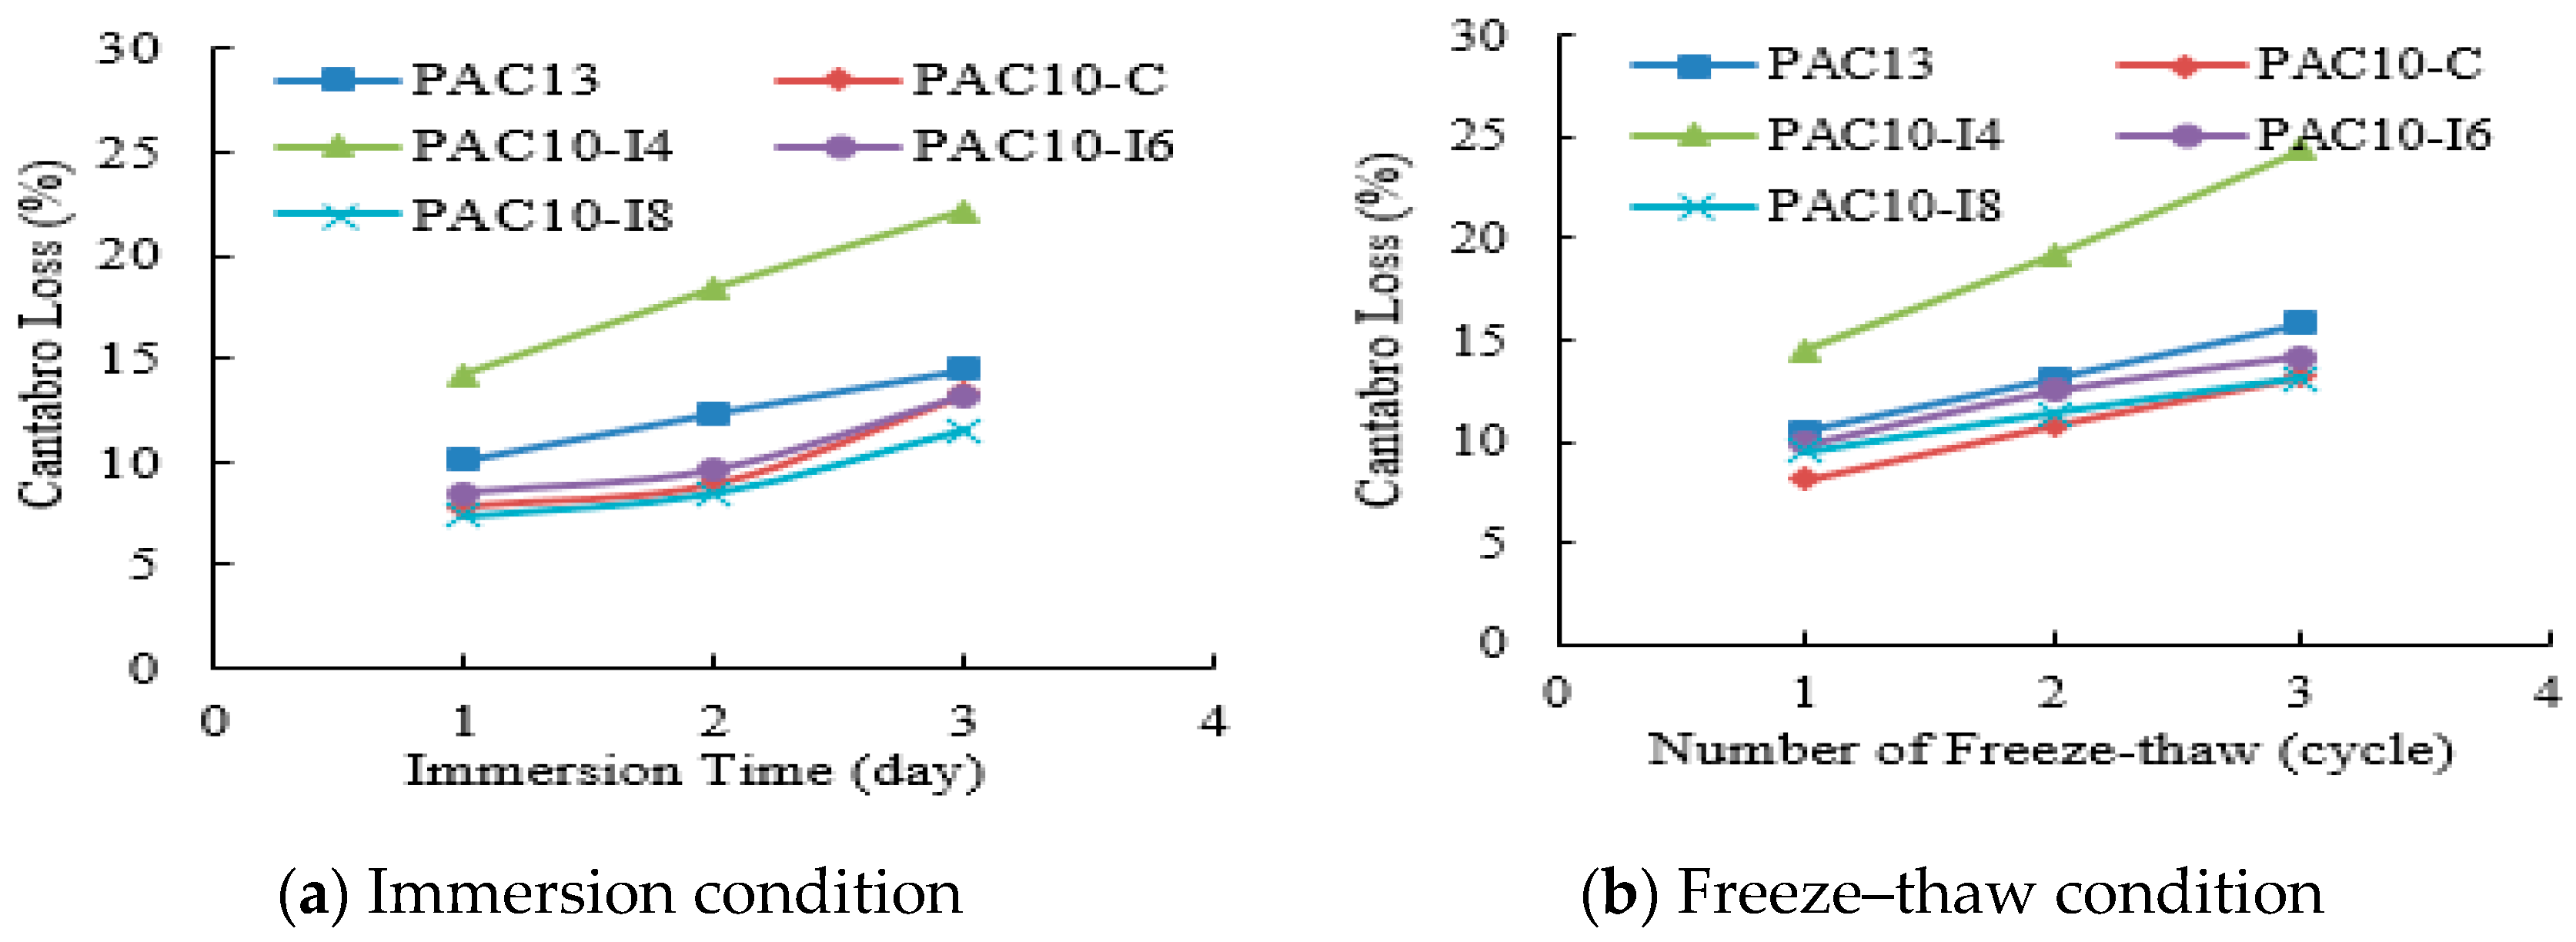
Figure 6 presents the Cantabro test results of PAC mixtures under immersion and freeze–thaw conditions. Both conditions had similar effect on the durability of PAC mixtures: i.e., as the number of conditioning cycles increases, the Cantabro loss becomes larger. Among various mixtures, the Cantabro loss of PAC10-I4 is obviously larger, and those of the others are relatively close. For the three novel PAC10s, the Cantabro loss decreased with the increasing content of the mineral fillers, but the Cantabro loss of PAC10-I8 is slightly smaller than that of PAC10-I6, indicating that increasing the mineral filler content can improve the durability of novel PAC10 mixture, but when the mineral filler content reaches a certain level, further increase of mineral filler content might not be effective in improving the durability of PAC. In other words, for the three mineral filler contents considered in this study, 6% is the optimum value in terms of the durability of the novel PAC10.

3.4. High-Temperature Permanent Deformation

Table 6 presents the average results of the wheel tracking rutting resistance tests. It can be seen that the DS values of all mixtures met the minimum acceptance criterion of 3000 passes/mm commonly adopted in China [19]. PAC13 had better high-temperature stability than PAC10-C. For the novel PAC10 mixtures, with the increasing content of the mineral fillers, the rutting depth was significantly reduced, and the DS value was obviously increased. The novel PAC10-I6 mixture showed better high-temperature stability than the conventional PAC10-C mixture.
It is worth noting that rutting development of a mixture is dependent on various factors, such as aggregate gradation, asphalt content, and binder properties. Although PAC13 and PAC10-C have the same fine aggregate content, PAC13 showed better high-temperature stability than PAC10-C, because the former had a larger NMAS. The three novel PAC10s had the same aggregate structure and binder properties. So, a higher mineral filler content mixture led to more asphalt binder and asphalt mastic, which may serve as an “extender” lubricating the aggregate structure. But the softening point of SBS modified binder is much more than 60 °C, and the HVA additive further increases the softening point of binder [12]. The Marshall stability results at 60 °C also indicated that more asphalt mastic improved the stiffness and strength of the novel PAC10s. So, the stiffening effect of more asphalt mastic was more significant than the increased lubrication effect, which resulted in stiffer mixtures. Therefore, with the increasing content of the mineral fillers, the novel PAC10 mixtures showed better high-temperature stability.

3.5. Low-Temperature Cracking Resistance

Table 7 shows the low-temperature bending test results of PAC mixtures. As can be seen from this table, PAC13 had the lowest flexural strain at failure, while PAC10-C had the largest flexural strain at failure. The mixture has larger NMAS may be more brittle than that has smaller NMAS at −10 °C. Fine aggregate can improve the low-temperature cracking resistance of PAC10, so conventional PAC10-C mixture had larger flexural strain at failure than the novel PAC10 mixtures. For the three novel PAC10 mixtures, with the increasing content of the mineral fillers, the flexural strength and flexural strain at failure increased, but their flexural stiffness at failure are similar. This means increasing the mineral filler content can improve the low-temperature cracking resistance of PAC10 mixture, because more asphalt mastic improves the strength and toughness of the mixture.

3.6. Permeability

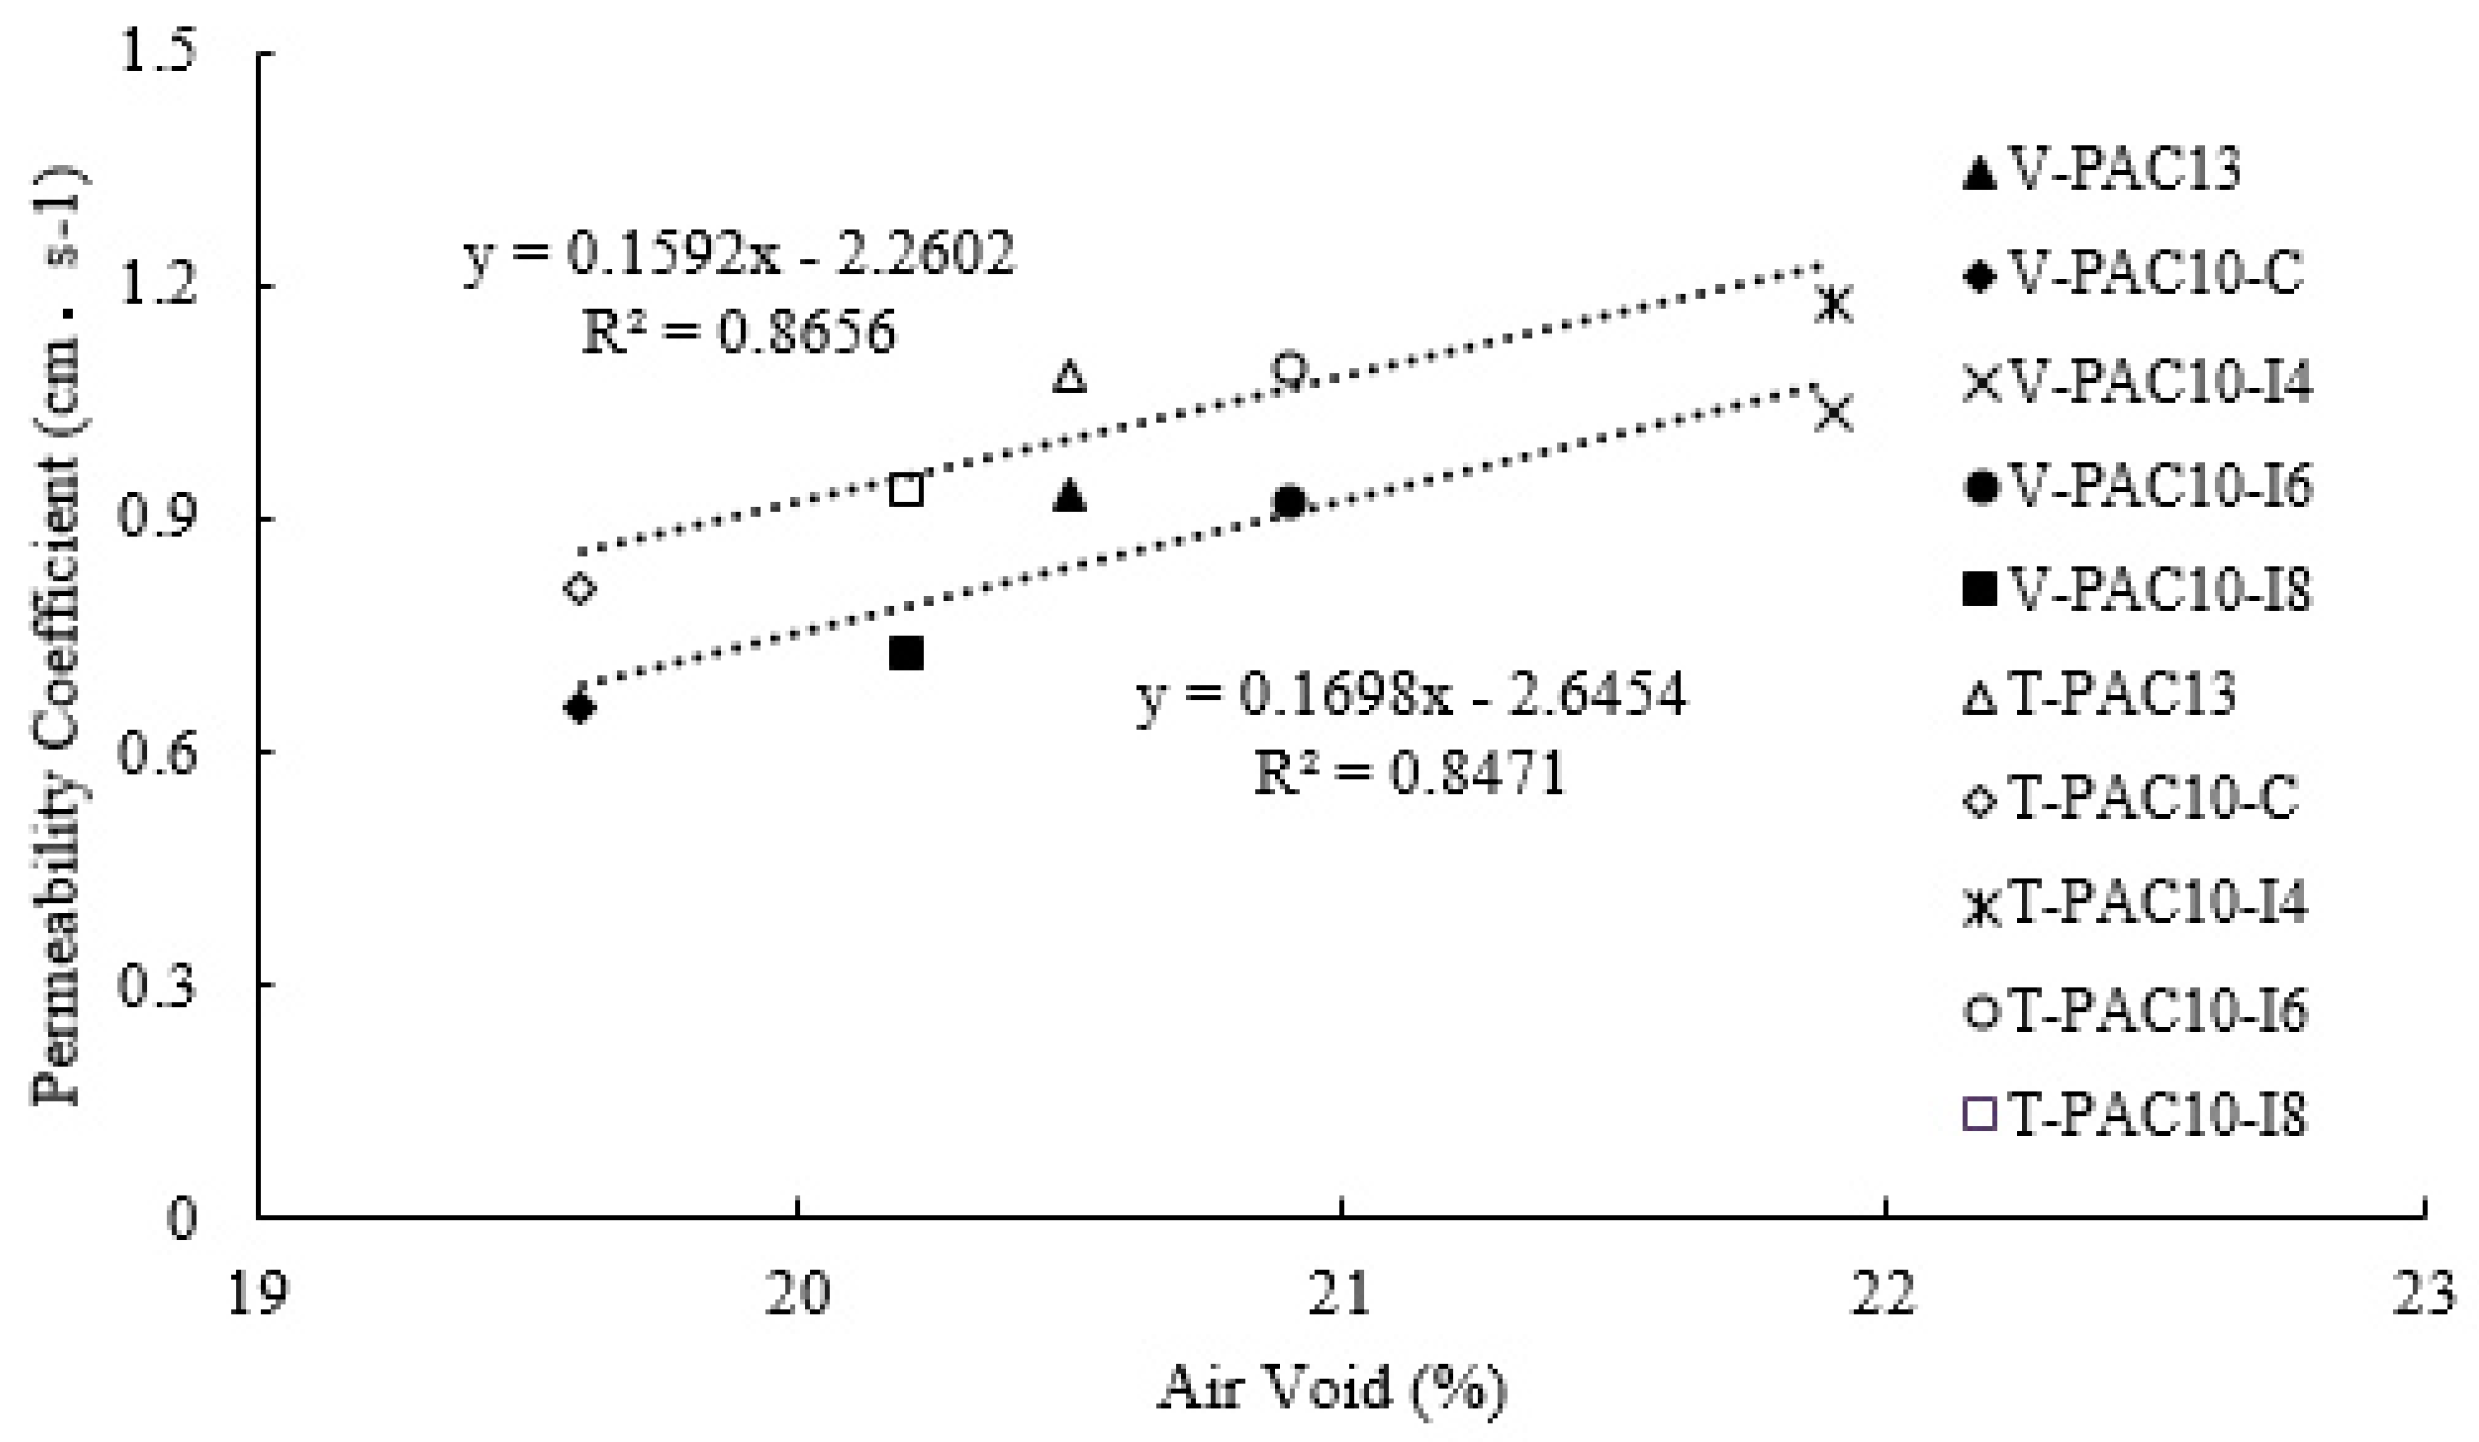
To evaluate the permeability of the PAC mixtures, permeability coefficients in both transverse and vertical directions of the same specimen were measured in this study. From the test results (average for two replicates) shown in Figure 7, it can be seen that there is a positive correlation between permeability coefficient and air void and the transverse permeability coefficient (T) is larger than vertical permeability coefficient (V). The points of four kinds of PAC10 mixture close to the regression line, but the point of PAC-13 above regression line obviously, means that use of smaller aggregate size may reduce the mixture permeability. The PAC10-I4 had the largest permeability coefficient in both vertical and transverse directions, while PAC10-C had the smallest permeability coefficient. Compared with the conventional PAC10-C mixture, the three novel PAC10 mixtures showed better permeability. However, the permeability of the novel PAC10 mixtures decreases with the increasing content of the mineral fillers. Under the condition of optimum asphalt content, the permeability of PAC10-I6 in both vertical and transverse directions are close to those of PAC13.

3.7. Determination of Mineral Filler Content

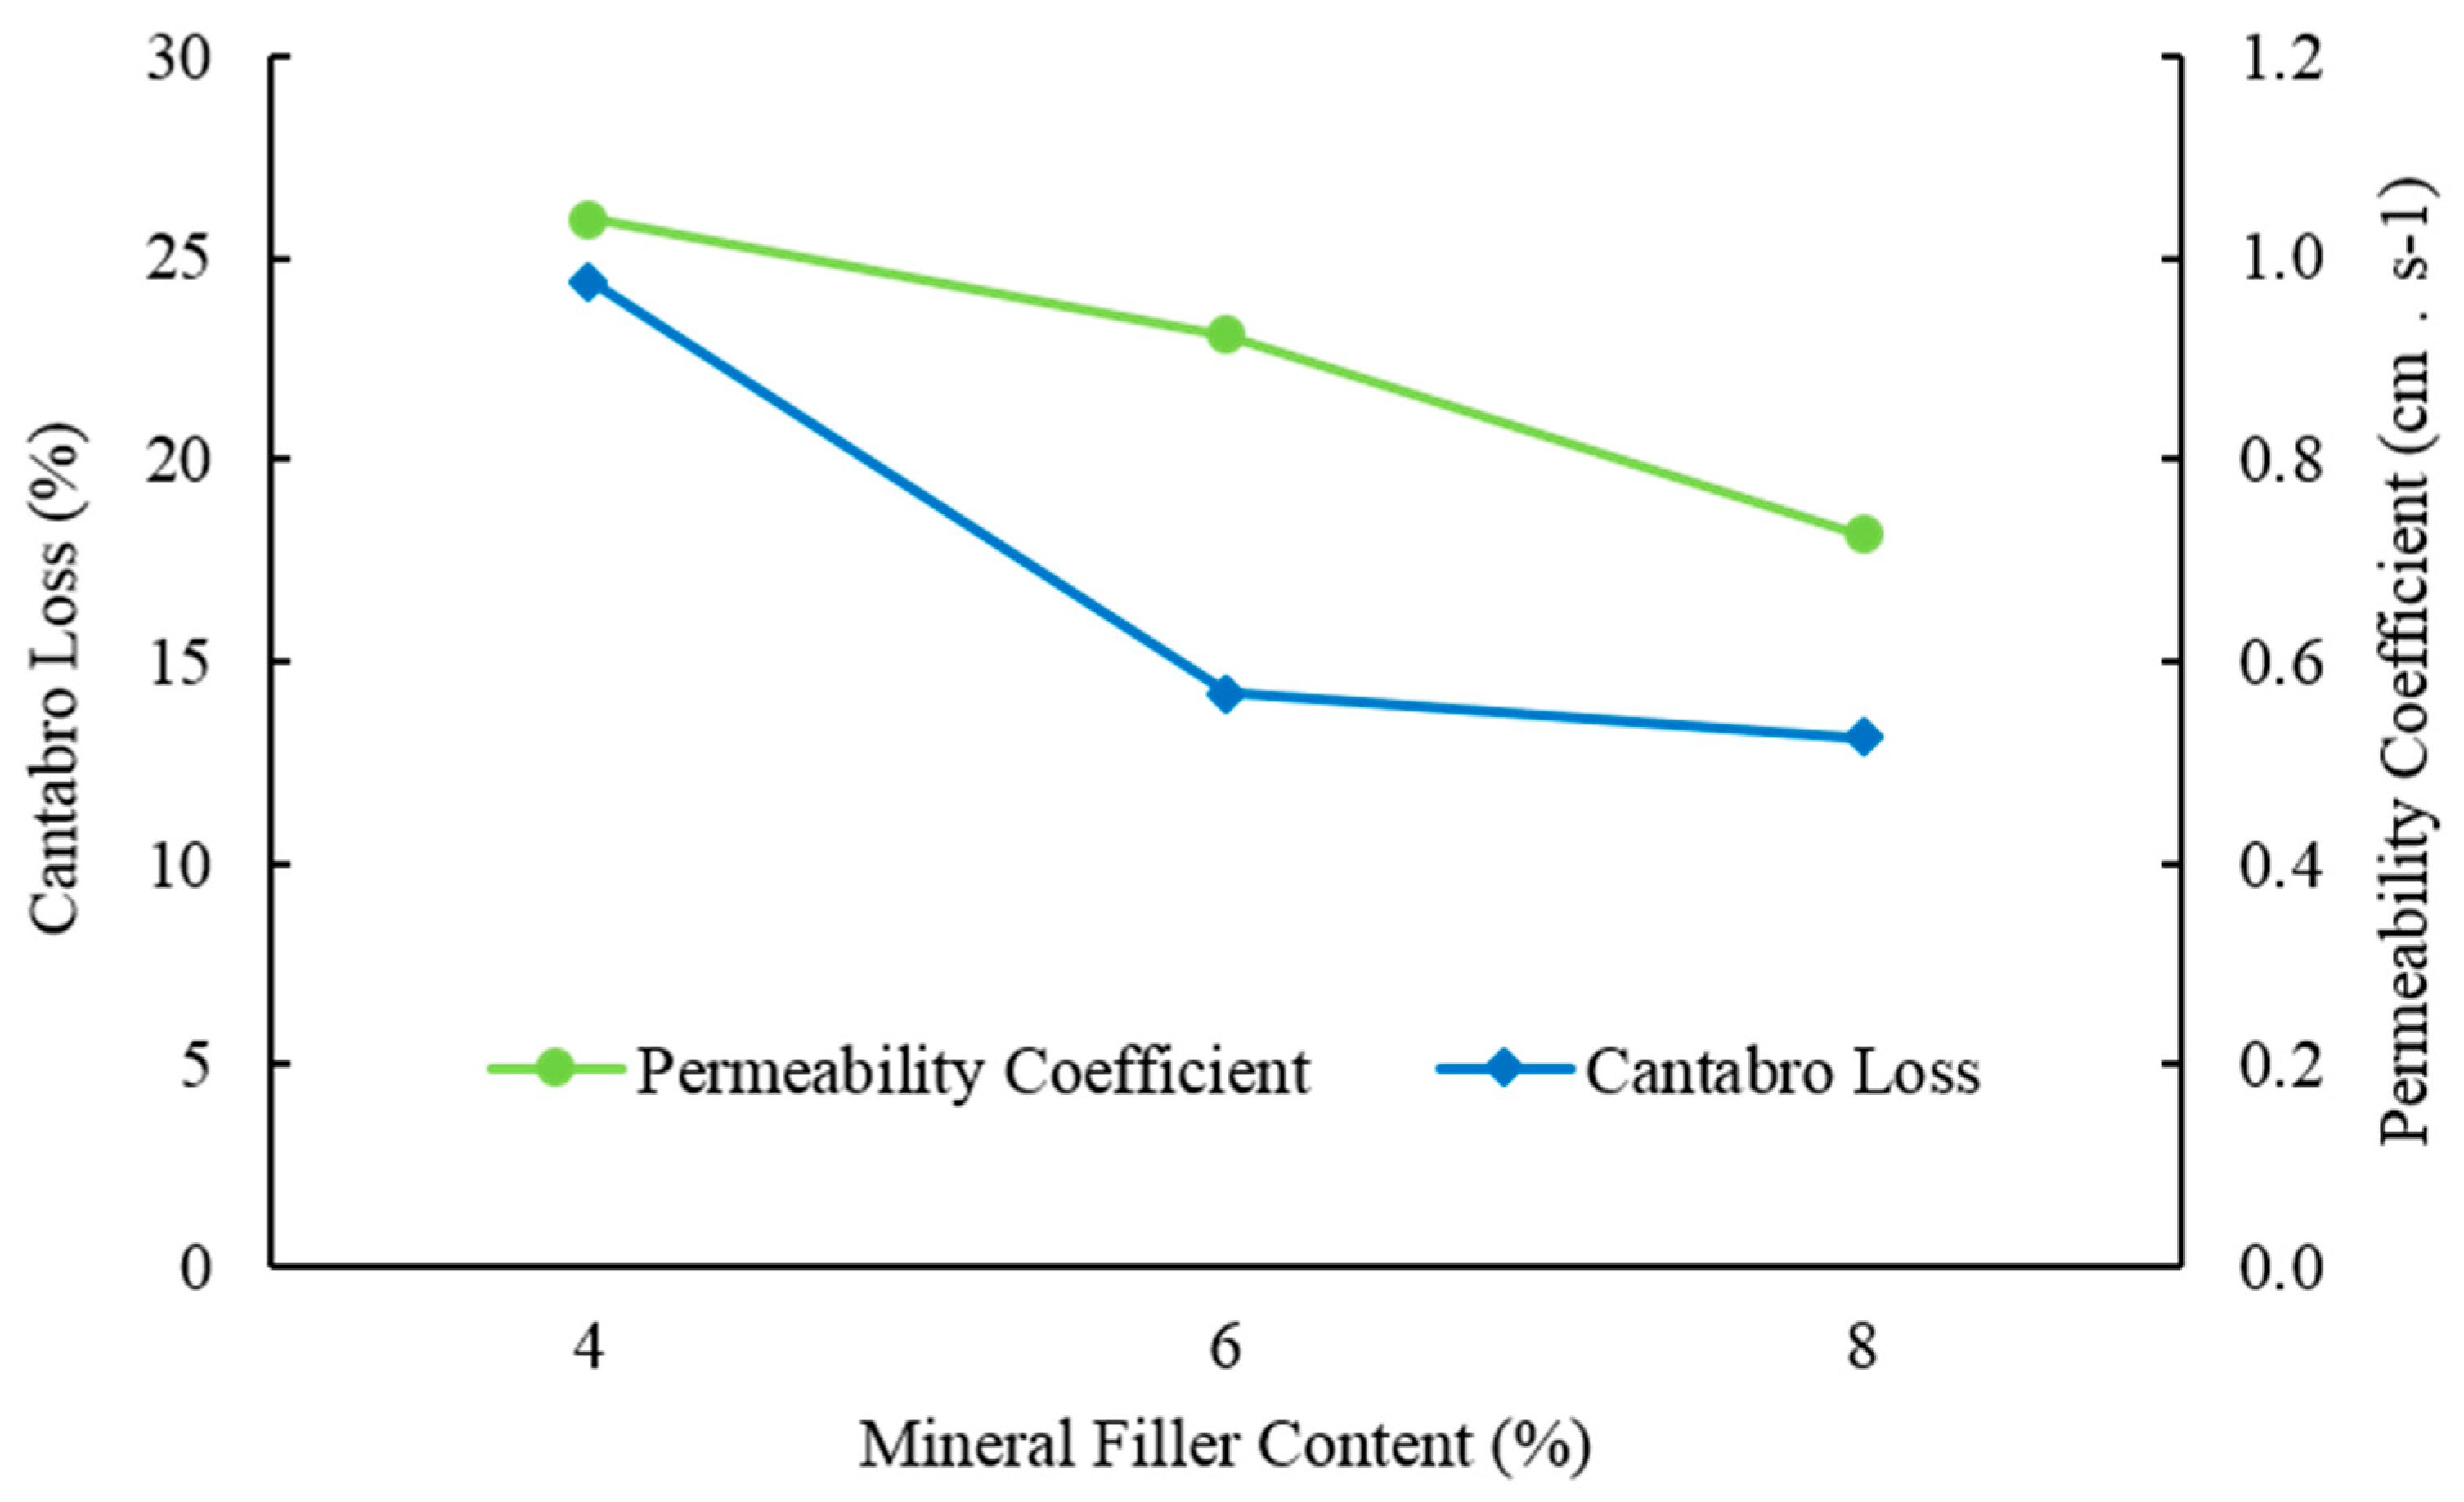
Based on the above test results, it is obviously that with the increasing content of the mineral fillers, the durability increases but the permeability decreases. Therefore, careful selection of the mineral filler content would be required to keep the balance of durability and functionality for the novel gradation PAC10 mixture. In Figure 6, it was shown that Cantabro loss of freeze–thaw Cantabro test after three cycle condition is maximum for all the test condition of this study, and Figure 7 shows that the vertical permeability coefficient is smaller than transverse permeability coefficient. The Cantabro loss of freeze–thaw Cantabro test after three cycle condition is used to represent the durability and the vertical permeability coefficient is used to represent the functionality. Figure 8 presents the interaction between durability and functionality of PAC10 mixtures with different mineral filler content.
As shown in the Figure 8, increasing the mineral filler content from 4% to 6%, the Cantabro loss will decrease significantly, but further increase of mineral filler content to 8% has little effect on durability. At the same time, with the increasing content of the mineral fillers, the permeability coefficient decreases, and when increasing the content of the mineral filler from 6% to 8%, the permeability coefficient decreases more significantly than when increasing the content of the mineral filler from 4% to 6%. Therefore, the novel PAC10 mixture containing 6% mineral filler can better balance durability and functionality, and 6% mineral filler is recommended for the novel gradation design.

4. Conclusions

This study evaluated the effects of the gradation, especially mineral filler content, on the structural and functional performances of PAC through comprehensive laboratory tests. Based on the outcome of this study, the following findings can be obtained:
  • When the mineral filler content is increased, more asphalt binder is needed to form the asphalt mastic, which can improve the strength of PAC10 mixtures.
  • Novel PAC10 (without 0.075–3 mm aggregate) with 6% mineral filler can have equivalent moisture susceptibility and durability compared with conventional PAC13.
  • PAC13 showed better rutting resistance than the conventional PAC10, but the high-temperature stability of the novel PAC10 can be equivalent to or even better than PAC13 by increasing the mineral filler content.
  • Conventional PAC10 showed better low-temperature cracking resistance than PAC13. The low-temperature performance of PAC10 is compromised when 0.075–3 mm aggregate is excluded, but it can be improved by increasing the mineral filler content.
  • The permeability of the conventional PAC10 is obviously worse than PAC13, but excluding the 0.075–3 mm aggregate from PAC10 is effective in improving the permeability of PAC10.
  • Six percent mineral filler is recommended for the novel gradation design to keep the balance of durability and functionality.
For PAC mixtures, it is important to balance their structural performance and permeability. To achieve such balance, this study developed a novel gradation for PAC10 by considering the following two facts: on one hand, the permeability of PAC is improved by excluding the aggregate in the size range of 0.075–3 mm; and on the other hand, the durability of PAC10 is maintained by increasing the mineral filler content. The results of this study indicated that the novel PAC10 mixture containing 6% mineral filler could provide equivalent durability and permeability compared with the conventional PAC13 mixture, making PAC10-I6 a suitable porous mixture especially suitable for thin overlays. With increasing the mineral filler content, the OAC of PAC10 increases, and the price of asphalt mixture is closely related to the OAC. Therefore, compared with the conventional PAC10-C, the recommended PAC10-I6 will increase the cost slightly. In the study, several kinds of PAC mixtures with different gradation were compared. However, the type of bitumen has significant influence on the performance properties of PAC mixture, this is the further research will be conducted in future work.

Author Contributions

Conceptualization, X.M. and P.Z.; methodology, X.M.; validation, X.M. and H.W.; formal analysis, H.W.; investigation, H.W. and P.Z.; data curation, X.M.; writing—original draft preparation, X.M. and P.Z.; writing—review and editing, X.M. All authors have read and agreed to the published version of the manuscript.

Funding

The research is supported by the Hebei Provincial Transportation Scientific Research Project (NO. TH1-202013) and the Priority Academic Program Development of Jiangsu Higher Education Institutions in China.

Conflicts of Interest

The authors declare no conflict of interest.

References

  1. Takahashi, S. Comprehensive study on the porous asphalt effects on expressways in Japan: Based on field data analysis in the last decade. Road Mater. Pavement Des. 2013, 14, 239–255. [Google Scholar] [CrossRef]
  2. Hsu, T.-W.; Chen, S.-C.; Hung, K.-N. Performance Evaluation of Asphalt Rubber in Porous Asphalt-Concrete Mixtures. J. Mater. Civ. Eng. 2011, 23, 342–349. [Google Scholar] [CrossRef]
  3. Chen, J.-S.; Lee, C.-T.; Lin, Y.-Y. Influence of Engineering Properties of Porous Asphalt Concrete on Long-Term Performance. J. Mater. Civ. Eng. 2017, 29, 04016246. [Google Scholar] [CrossRef]
  4. Zhao, Y.; Zhu, Y.-T. Metals Leaching in Permeable Asphalt Pavement with Municipal Solid Waste Ash Aggregate. Water 2019, 11, 2186. [Google Scholar] [CrossRef] [Green Version]
  5. Zhu, Y.; Zhao, Y.; Zhao, C.; Gupta, R. Physicochemical characterization and heavy metals leaching potential of municipal solid waste incinerated bottom ash (MSWI-BA) when utilized in road construction. Environ. Sci. Pollut. Res. 2020, 1–14. [Google Scholar] [CrossRef] [PubMed]
  6. Liu, Y.; Cheng, X.; Yang, Z. Effect of Mixture Design Parameters of Stone Mastic Asphalt Pavement on Its Skid Resistance. Appl. Sci. 2019, 9, 5171. [Google Scholar] [CrossRef] [Green Version]
  7. Pérez-Acebo, H.; Gonzalo-Orden, H.; Findley, D.J.; Rojí, E. A skid resistance prediction model for an entire road network. Constr. Build. Mater. 2020, 262, 120041. [Google Scholar] [CrossRef]
  8. Mansour, T.N.; Putman, B.J. Influence of Aggregate Gradation on the Performance Properties of Porous Asphalt Mixtures. J. Mater. Civ. Eng. 2013, 25, 281–288. [Google Scholar] [CrossRef]
  9. Li, Q.; Zhang, Z.; Zhang, S. Performance Evaluation of Warm-Mix Recycled Asphalt Binders after Long-Term Aging. J. Test. Eval. 2019, 47, 2889–2904. [Google Scholar] [CrossRef]
  10. Ma, X.; Zhou, P.; Jiang, J.; Hu, X. High-temperature failure of porous asphalt mixture under wheel loading based on 2D air void structure analysis. Constr. Build. Mater. 2020, 252, 119051. [Google Scholar] [CrossRef]
  11. Nekkanti, H.; Putman, B.J.; Danish, B. Influence of Aggregate Gradation and Nominal Maximum Aggregate Size on the Performance Properties of OGFC Mixtures. Transp. Res. Rec. 2019, 2673, 240–245. [Google Scholar] [CrossRef]
  12. Ma, X.; Li, Q.; Cui, Y.-C.; Ni, A.-Q. Performance of porous asphalt mixture with various additives. Int. J. Pavement Eng. 2016, 19, 355–361. [Google Scholar] [CrossRef]
  13. Liu, Q.; Cao, D. Research on Material Composition and Performance of Porous Asphalt Pavement. J. Mater. Civ. Eng. 2009, 21, 135–140. [Google Scholar] [CrossRef]
  14. Takahashi, S.; Partl, M. Improvement of mix design for porous asphalt. Road Mater. Pavement Des. 2001, 2, 283–296. [Google Scholar] [CrossRef]
  15. Chen, M.J.; Wong, Y.D. Gradation design of porous asphalt mixture (PAM) for low-strength application in wet environment. Int. J. Pavement Eng. 2016, 19, 611–622. [Google Scholar] [CrossRef]
  16. Yu, B.; Jiao, L.; Ni, F.; Yang, J. Long-term field performance of porous asphalt pavement in China. Road Mater. Pavement Des. 2014, 16, 214–226. [Google Scholar] [CrossRef]
  17. Qian, Z.; Lu, Q. Design and laboratory evaluation of small particle porous epoxy asphalt surface mixture for roadway pavements. Constr. Build. Mater. 2015, 77, 110–116. [Google Scholar] [CrossRef]
  18. Ministry of Transport of the People’s Republic of China. JTJ E20-2011: Standard Test Methods of Bitumen and Bituminous Mixtures for Highway Engineering; Ministry of Transport of the People’s Republic of China: Beijing, China, 2011.
  19. Ministry of Transport of the People’s Republic of China. JTG F40–2004: Technical Specification for Construction of Highway Asphalt Pavement; Ministry of Transport of the People’s Republic of China: Beijing, China, 2004.
  20. Ministry of Transport of the People’s Republic of China. JTG E42-2005: Test Methods of Aggregate for Highway Engineering; Ministry of Transport of the People’s Republic of China: Beijing, China, 2005.
  21. South Carolina Department of Transportation. Supplemental Specification: Open Graded Friction Course; South Carolina Department of Transportation: Columbia, SC, USA, 2016.
  22. Leng, Z. The Design on the Gradation and Research on the Performance of the Porous Asphalt. Master’s Thesis, Southeast University, Nanjing, China, 2003. [Google Scholar]
  23. American Association to State Highway and Transportation Officials. AASHTO T 283: Resistance of Compacted HMA to Moisture-Induced Damage. Standard Specifications for Transportation Materials and Methods of Sampling and Testing; AASHTO: Washington, DC, USA, 2010. [Google Scholar]
  24. Ma, X.; Ni, F.; Wang, Y.; Chen, R. Test and analysis on permeability of porous asphalt mixture. J. Build. Mater. 2009, 12, 168–172. [Google Scholar]
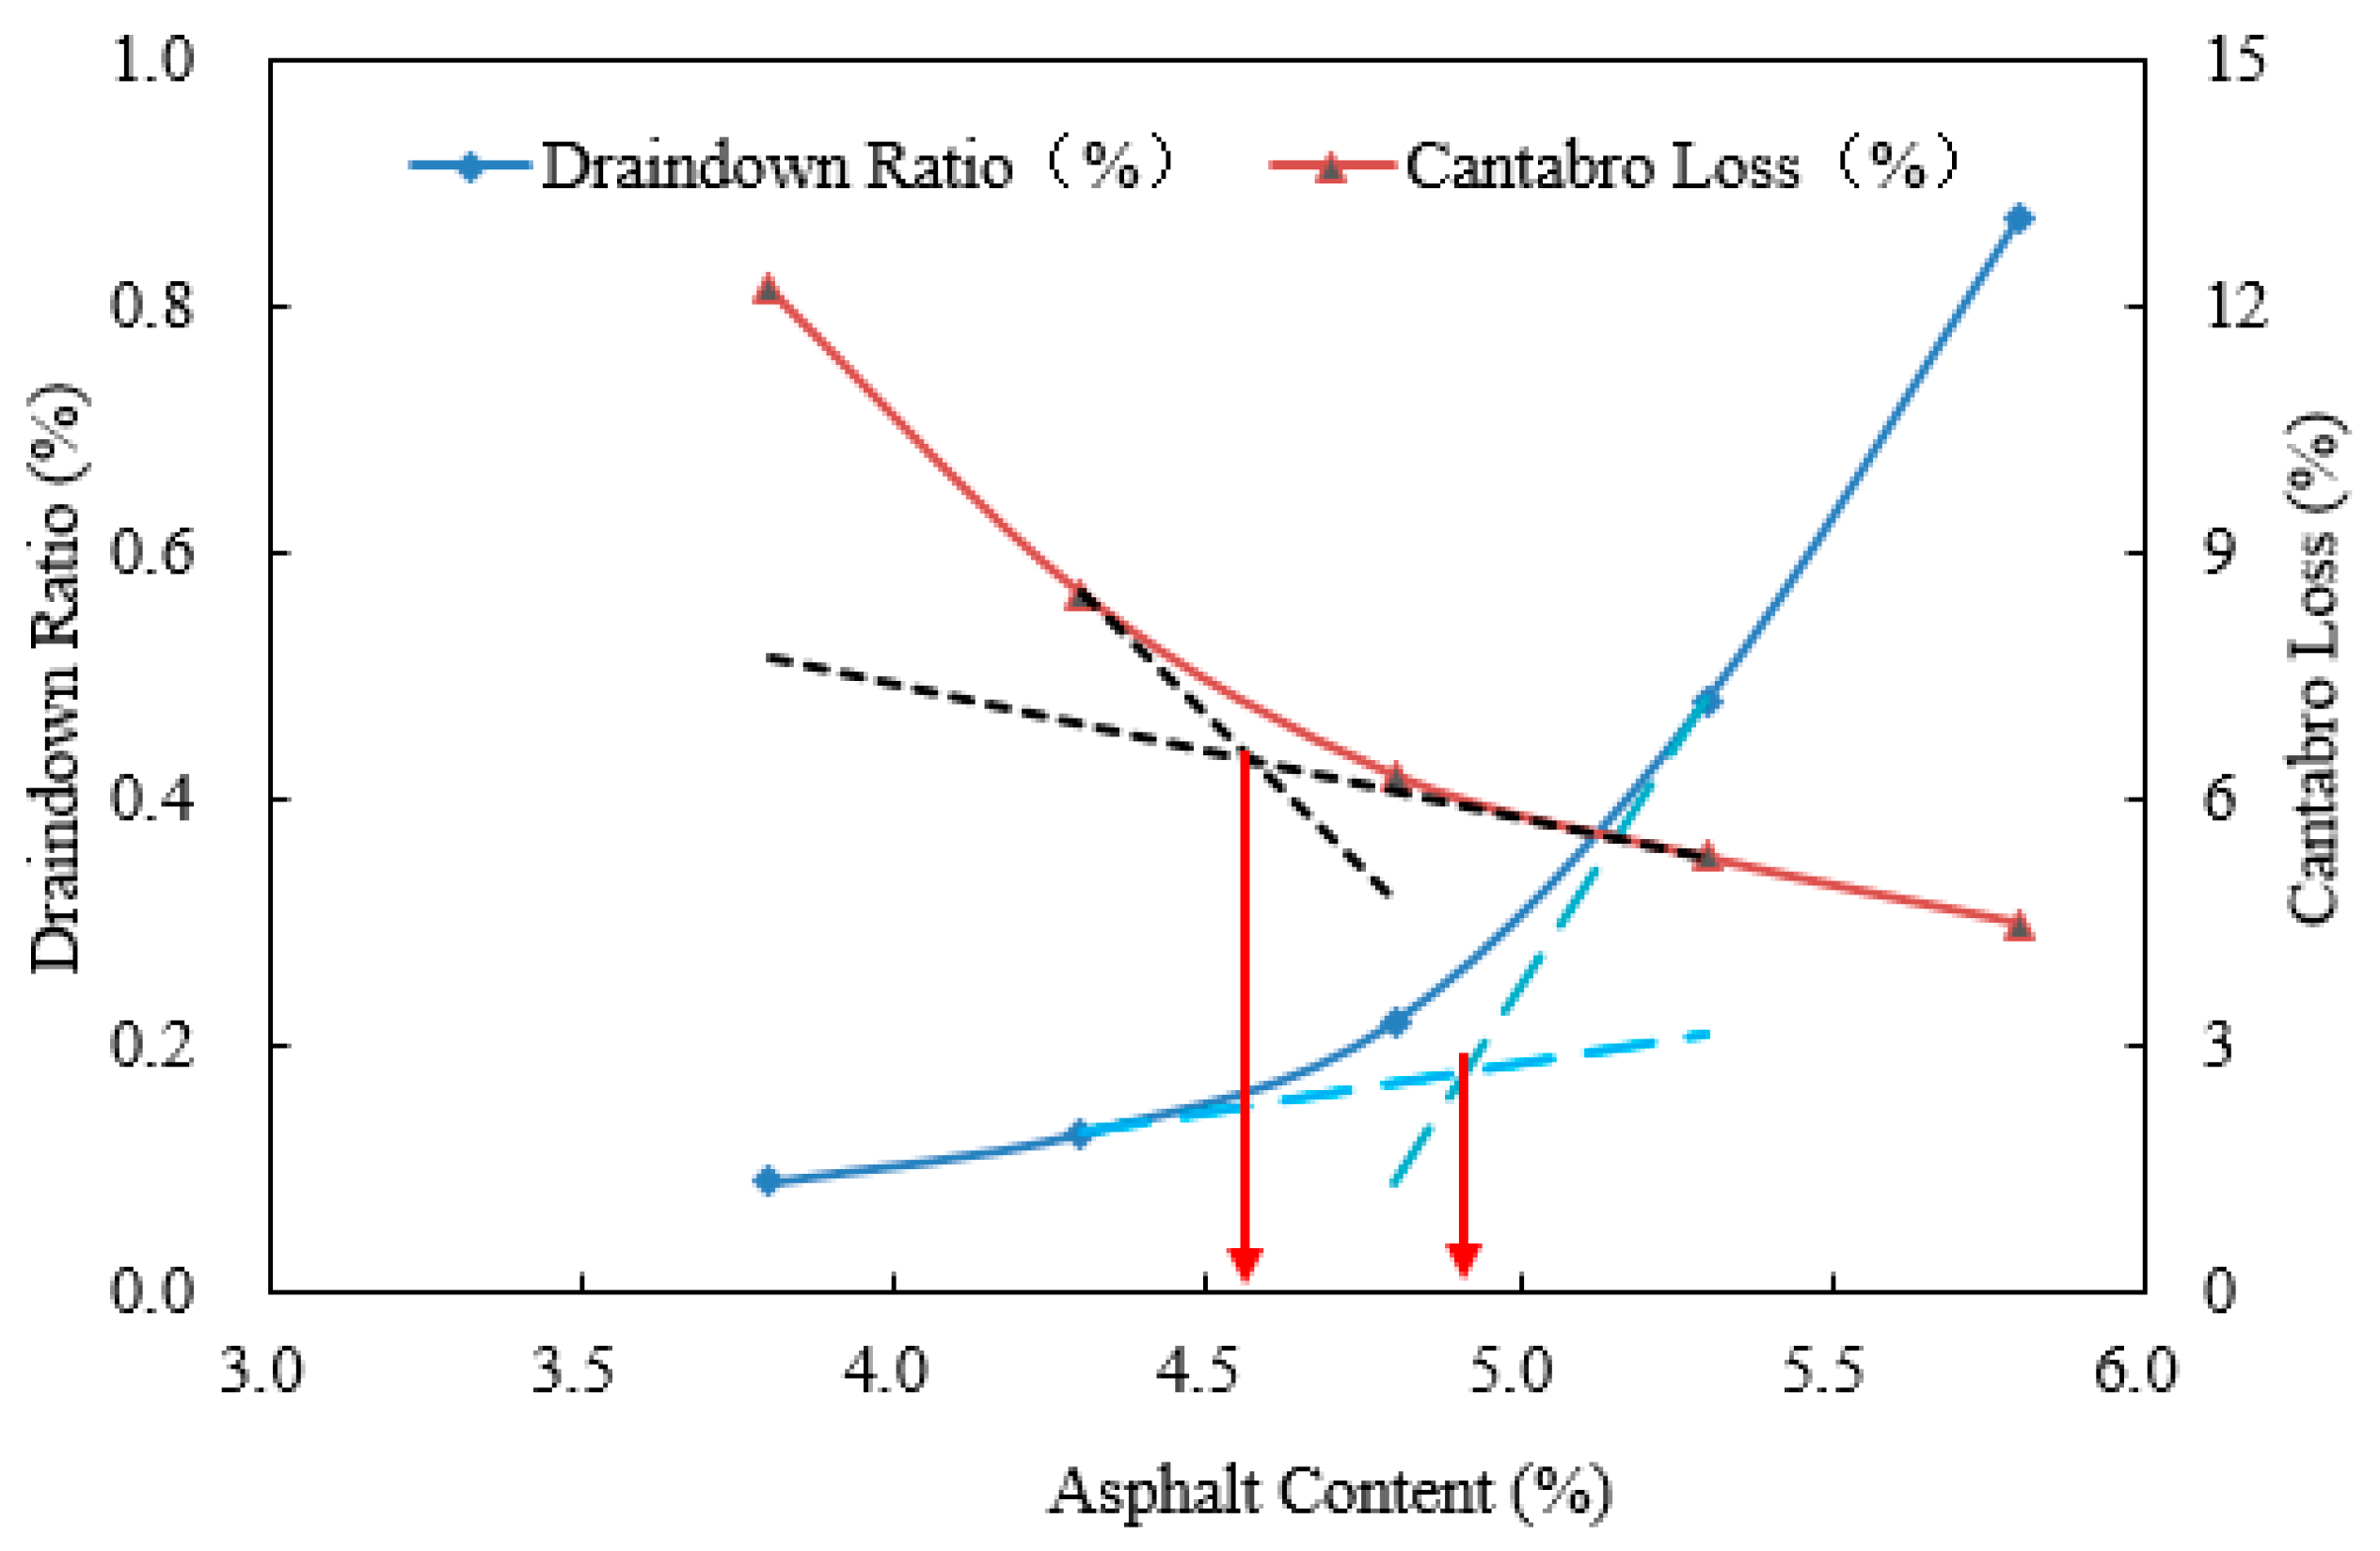
Figure 1. Asphalt content range determination based on draindown ratio and Cantabro loss.
Applsci 10 07019 g001
Figure 2. Freeze–thaw condition chamber.
Applsci 10 07019 g002
Figure 3. Cantabro abrasion test equipment and samples.
Applsci 10 07019 g003
Figure 4. Permeability test.
Applsci 10 07019 g004
Figure 5. TSR for moisture susceptibility of mixtures.
Applsci 10 07019 g005
Figure 6. Cantabro losses of PAC mixtures.
Applsci 10 07019 g006
Figure 7. Results of permeability tests.
Applsci 10 07019 g007
Figure 8. Cantabro abrasion and permeability test results of PAC10 with different mineral filler content.
Applsci 10 07019 g008
Table 1. Properties of styrene–butadiene–styrene (SBS) modified binder.
PropertiesTest ResultsSpecification Method [18]
Penetration (25 °C, 100 g, 5 s) (0.1 mm)53T 0604
Ductility (5 °C, 5 cm/min) (mm)32T 0605
Softening point (°C)84T 0606
Viscosity (135 °C, Pa.s)2.35T 0625
Kinetic viscosity (60 °C, Pa.s)15790T 0620
Table 2. Properties of aggregate.
Aggregate TypesPropertiesTest ResultsTechnical
Requirement [19]
Specification
Method [20]
Coarse aggregateApparent specific gravity2.934≥2.6T 0304
LA abrasion (%)12.5≤28T 0317
Crush value (%)11.4≤26T 0316
Absorption (%)1.13≤2.0T 0307
Fine aggregateApparent specific gravity2.853≥2.5T 0328
Sand equivalent value (%)71≥60T 0334
Table 3. Properties of mineral filler.
PropertiesTest ResultsTechnical
Requirement [19]
Specification
Method [20]
Apparent specific gravity2.726≥2.5T 0352
Water content (%)0.24≤1.0T 0352
Hydrophilic coefficient0.71<1.0T 0354
Gradation (% passing)<0.6 mm100.0100T0351
<0.15 mm93.090−100
<0.075 mm87.670−100
Table 4. PAC gradations for evaluation.
ItemsPAC13PAC10-CPAC10-I4PAC10-I6PAC10-I8
Aggregate Composition (%)1# (10−15 mm)440000
2# (5−10 mm)4084757575
3# (3−5 mm)00211917
4# (0.075−3 mm)1212000
Mineral filler44468
Percent Passing (%)16 mm100100100100100
13.2 mm91.0100100100100
9.5 mm62.199.199.299.299.2
4.75 mm21.427.132.032.332.5
2.36 mm13.313.45.06.98.8
1.18 mm10.110.14.26.28.2
0.6 mm7.57.54.06.08.0
0.3 mm5.85.84.06.08.0
0.15 mm4.84.83.75.67.4
0.075 mm3.93.93.34.96.5
Table 5. Mix design property results of PAC.
Mixture PropertyType of PACTechnical
Requirement [22]
PAC13PAC10-CPAC10-I4PAC10-I6PAC10-I8
OAC (%)4.75.04.85.35.5
Air void content (%)20.519.621.920.920.218–25
Marshall stability (kN)5.85.44.75.56.1Min. 3.5
Marshall flow (0.1 mm)30.430.827.428.231.520–40
Draindown ratio (%)0.170.180.180.140.22Max. 0.3
Cantabro loss 1 (%)9.88.314.38.87.4Max. 20
1 At Standard Cantabro test condition.
Table 6. Rutting test results.
MixturesRutting Depth at 45 min
(mm)
Rutting Depth at 60 min
(mm)
DS
(mm−1)
Average ValueCOV 1 (%)
PAC131.6421.739649510.7
PAC10-C1.8211.94351648.4
PAC10-I42.0352.17245999.5
PAC10-I61.6791.786588810.2
PAC10-I81.4241.51966315.4
1 COV is the abbreviation of coefficient of variation.
Table 7. Low-temperature bending test results.
MixturesFlexural Strength
(MPa)
Flexural Strain at Failure
(10−3)
Flexural Stiffness at Failure (MPa)
Average ValueCOV (%)Average ValueCOV (%)Average ValueCOV (%)
PAC137.028.426329.5266710.2
PAC10-C6.619.834197.819338.4
PAC10-I45.738.528358.420227.1
PAC10-I66.046.629407.220558.1
PAC10-I86.576.932555.920177.3