Article

Dynamic Characteristics of a Gear System with Double-Teeth Spalling Fault and Its Fault Feature Analysis

1
College of Mechanical Engineering, Zhejiang University of Technology, Hangzhou 310023, China
2
Key Laboratory of Special Purpose Equipment and Advanced Processing Technology, Ministry of Education and Zhejiang Province, Zhejiang University of Technology, Hangzhou 310023, China
3
Shuanghuan Driveline Co., Ltd., Electrical and Industrial Zone, Yuhuan County, Taizhou 317600, China
*
Author to whom correspondence should be addressed.
Appl. Sci. 2020, 10(20), 7058; https://doi.org/10.3390/app10207058
Submission received: 24 August 2020 / Revised: 23 September 2020 / Accepted: 8 October 2020 / Published: 11 October 2020
(This article belongs to the Section Mechanical Engineering)

Abstract

:
Tooth spalling is one of the most destructive surface failure models of the gear faults. Previous studies have mainly concentrated on the spalling damage of a single gear tooth, but the spalling distributed over double teeth, which usually occurs in practical engineering problems, is rarely reported. To remedy this deficiency, this paper constructs a new dynamical model of a gear system with double-teeth spalling fault and validates this model with various experimental tests. The dynamic characteristics of gear systems are obtained by considering the excitations induced by the number of spalling teeth, and the relative position of two faulty teeth. Moreover, to ensure the accuracy of dynamic model verification results and reduce the difficulty of fault feature analysis, a novel parameter-adaptive variational mode decomposition (VMD) method based on the ant lion optimization (ALO) is proposed to eliminate the background noise from the experimental signal. First, the ALO is used for the self-selection of the decomposition number K and the penalty factor â of the VMD. Then, the raw signal is decomposed into a set of Intrinsic Mode Functions (IMFs) by applying the ALO-VMD, and the IMFs whose effective weight kurtosis (EWK) is greater than zero are selected as the reconstructed signal. Combined with envelope spectrum analysis, the de-nosing ability of the proposed method is compared with that of the method known as particle swarm optimization-based variational mode decomposition (PSO-VMD), the fixed-parameter VMD, the empirical mode decomposition (EMD), and the local mean decomposition (LMD), respectively. The results indicate that the proposed dynamic model and background elimination method can provide a theoretical basis for spalling defect diagnosis of gear systems.

1. Introduction

Gear systems commonly exist in mechanical equipment, such as wind turbines, shearer, and the motor vehicle [1]. Due to the excessive load, poor lubrication, and other harsh operating conditions, faults often occur in the gear systems. The faults may generate serious economic losses and even casualties. Specifically, damages (e.g., pitting, cracking, and spalling) on the gear teeth are the main causes of system failure, and they usually impact the dynamic characteristics of gear devices [2,3,4,5]. Background noise often occurs in actual fault detection. It is difficult to extract fault feature accurately when background noise is involved [6]. Therefore, it is essential to effectively obtain the dynamic characteristics of gear systems and eliminate the noise for identifying faults because they play an important role in improving reliability and reducing the maintenance cost of gear systems.
Dynamical modeling is a useful way to obtain the dynamic characteristics of gear systems, and there are many studies about the dynamic modeling [7,8,9,10,11,12]. To effectively obtain the dynamic characteristics of gear systems, researchers either increase the degrees of freedom from single to multi degrees, or consider various practical phenomena such as backlash, tooth friction, manufacturing eccentric errors, etc. Kahraman et al. [13] proposed a simplified purely torsional mechanical model of a gear pair, which was supported by rigid mounts with backlash and time-varying mesh stiffness. Mohammed et al. [14] modelled a one-stage reduction gear by using three different dynamic models, which consider the gear mesh friction. Ren et al. [15] considered manufacturing eccentric errors and tooth profile errors, and generalized a bending-torsional-axial coupled dynamical model to investigate the dynamic floating performances. Dynamical modeling of gear systems with faults is also an important topic for understanding the dynamic characteristics of the gear fault. Spalling is one of the most destructive surface failure models of gear faults [16]. Until now, many researchers have modeled the tooth spalling and investigated its effect on dynamic characteristics of the gear systems [17]. According to their research, tooth spalling was regarded as different shapes (e.g., rectangle, circular, and V-shape), and the influence of the spalling on time-vary mesh stiffness (TVMS) of gear was explored [18,19,20]. Luo et al. [21] proposed a curved bottom shape method to model the geometric features of gear tooth spalls and studied the effect of different shapes and severity conditions time-vary mesh stiffness by finite element analysis. Chen et al. [22] presented a new two-dimensional Gaussian distribution model to depict pitting distribution. In their analysis, the overlaps of the pits and pits in the boundary of the tooth surface were considered in the computation of TVMS. Furthermore, Luo et al. [23] built a dynamic model that includes tooth surface roughness changes and geometric deviations because of the pitting and spalling of gear teeth. This model was validated by comparison with experiments under different rotational speed and fault conditions. Abouel-seoud et al. [24] proposed a 12-degree-of-freedom lumped parameter model to simulate the effects of tooth crack, breakage, and spalling on the dynamic response of wind turbine gearbox with spur gears. Jiang et al. [25] proposed a 6-degree-of-freedom approach to investigate the dynamic characteristics of a pair of helical gears under sliding friction with spalling faults. The previously mentioned studies only focus on a single tooth spalling fault. In fact, tooth spalling, which is caused by excessive local Hertzian contact fatigue stress, may distribute over multiple teeth [26,27]. In term of this phenomenon, Liang et al. [28] modeled a gear system with double-teeth spalling fault, and simulated its effect on vibration characteristics. However [28], only the phenomenon where the tooth spalling occurs on two adjacent teeth is considered. According to Reference [28], this paper will further explore the influence of the relative position of two faulty teeth on the dynamic characteristics of gears.
The accuracy of the dynamic model needs to be verified by the experimental signal. However, the experimental signal has the background noise caused by the sensor’s location (e.g., the bearing pedestal or the gearbox housing), which will affect the results of dynamic model accuracy verification. Moreover, the fault features hidden in the experimental signal are also susceptible to the background noise and become weaker, which increase the difficulty of fault feature analysis. It is of great significance for dynamic model validation and fault feature analysis to eliminate the background noise in the experimental signal. To tackle the complex background, several signal processing methods such as Wavelet Transform (WT) [29,30], Empirical Mode Decomposition (EMD) [31,32], and Local Mean Decomposition (LMD) [33,34] have been applied. However, the treatment effect of these methods is often not satisfactory because of the inherent limitations. The WT method needs to empirically choose wavelet basis function. The EMD method decomposes any signal into a set of intrinsic mode functions (IMFs), but its efficiency is restricted by the problems of end effects and mode mixing. The LMD method is confined by the decomposition level. In recent years, a novel adaptive signal processing method called Variational Mode Decomposition (VMD) is presented [35]. By determining the relevant bands of the fault feature and dividing the signal into several IMFs, the VMD can effectively avoid the end effects and mode mixing [36,37]. In addition, Zhang et al. [38] and An et al. [39] proved that the VMD performs better than the EMD. With the merits, many novel signal processing methods around the VMD have been proposed [40,41,42,43]. However, the performance effectiveness of the VMD is mainly affected by the penalty factor â and the decomposed mode number K, which are obtained empirically at present. Ant lion optimization (ALO) is a novel intelligent algorithm, which mainly solves the optimization of the parameters by imitating the hunting mechanism of antlions [44]. Compared with other intelligent algorithms such as a genetic algorithm (GA) and particle swarm optimization (PSO), the ALO has the merit of fewer control variables and high convergence precision in the classical optimization problem [45,46]. With the merit, we adopt the ALO to search the optimal parameters (i.e., the penalty factor â and the decomposed mode number K) in the VMD, which ensures the decomposition performance of the VMD.
Generally, gear system dynamic characteristics and fault feature analysis that considers the double-teeth spalling fault have not been well studied in existing research. To make this gap, a new dynamic model of gear systems considering the double-teeth spalling fault is established in this paper. This dynamic model is validated by various experimental tests, and could supply more realistic dynamic environment for extraction of a gear double-teeth fault feature. Then, the dynamic characteristics considering the effect of the number of spalling teeth, and the relative position of two faulty teeth are analyzed. In addition, to ensure the accuracy of dynamic model verification results and reduce the difficulty of fault feature analysis, a novel parameters-adaptive VMD based on the ALO is proposed to eliminate the background noise in the experimental signal. The optimal parameters K and â of the VMD is obtained by the ALO. Moreover, the raw signal acquired from gear systems is decomposed into several IMFs by using the ALO-VMD method, and the IMFs with effective weight kurtosis (EWK) are summed as a reconstructed signal. Then, envelope spectrum analysis is applied to filter the reconstructed signal and carried out to extract the features of the faults.
The main contributions of this paper are summarized as follows: ① a new dynamical model that considers double-teeth spalling fault is proposed, and the dynamic characteristics considering the effect of the relative position of two faulty teeth are investigated. This investigation is proposed for the first time in previous studies ② by integrating the VMD and the ALO, a novel parameter-adaptive VMD is proposed to eliminate the strong noise. The ALO is used to search for the optimal combination value of VMD’s parameters K and â, which ensures the decomposition effectiveness of the VMD.
The rest of the paper is organized as following. The TVMS calculation method considering the double-teeth spalling fault is introduced in Section 2. In Section 3, the new dynamical model is proposed. In Section 4, the effectiveness of the dynamic model is validated by analyzing the dynamic characteristics of the gear system and some influencing factors are discussed. In Section 5, the background elimination method based on the ALO-VMD is detailed. Conclusions are provided in Section 6.

2. Mesh Stiffness Calculation of Gears

There are five critical points (i.e., B1, C, P, D, and B2) in the gear meshing process, as shown in Figure 1. The position B1 is the contact point where a tooth pair just enters the meshing zone, and the position B2 is the contact point when the second tooth pair exits the meshing zone. The position P denotes the pitch point where the tooth surface friction force changes its direction. During the meshing process, the single tooth pair is in contact between CD, and the double teeth pairs are in contact between B2C and DB1. The mesh stiffness of the gear will change abruptly when the double toothed meshing zone (between CD) and single toothed meshing zone (between B2C and DB1) alternate.

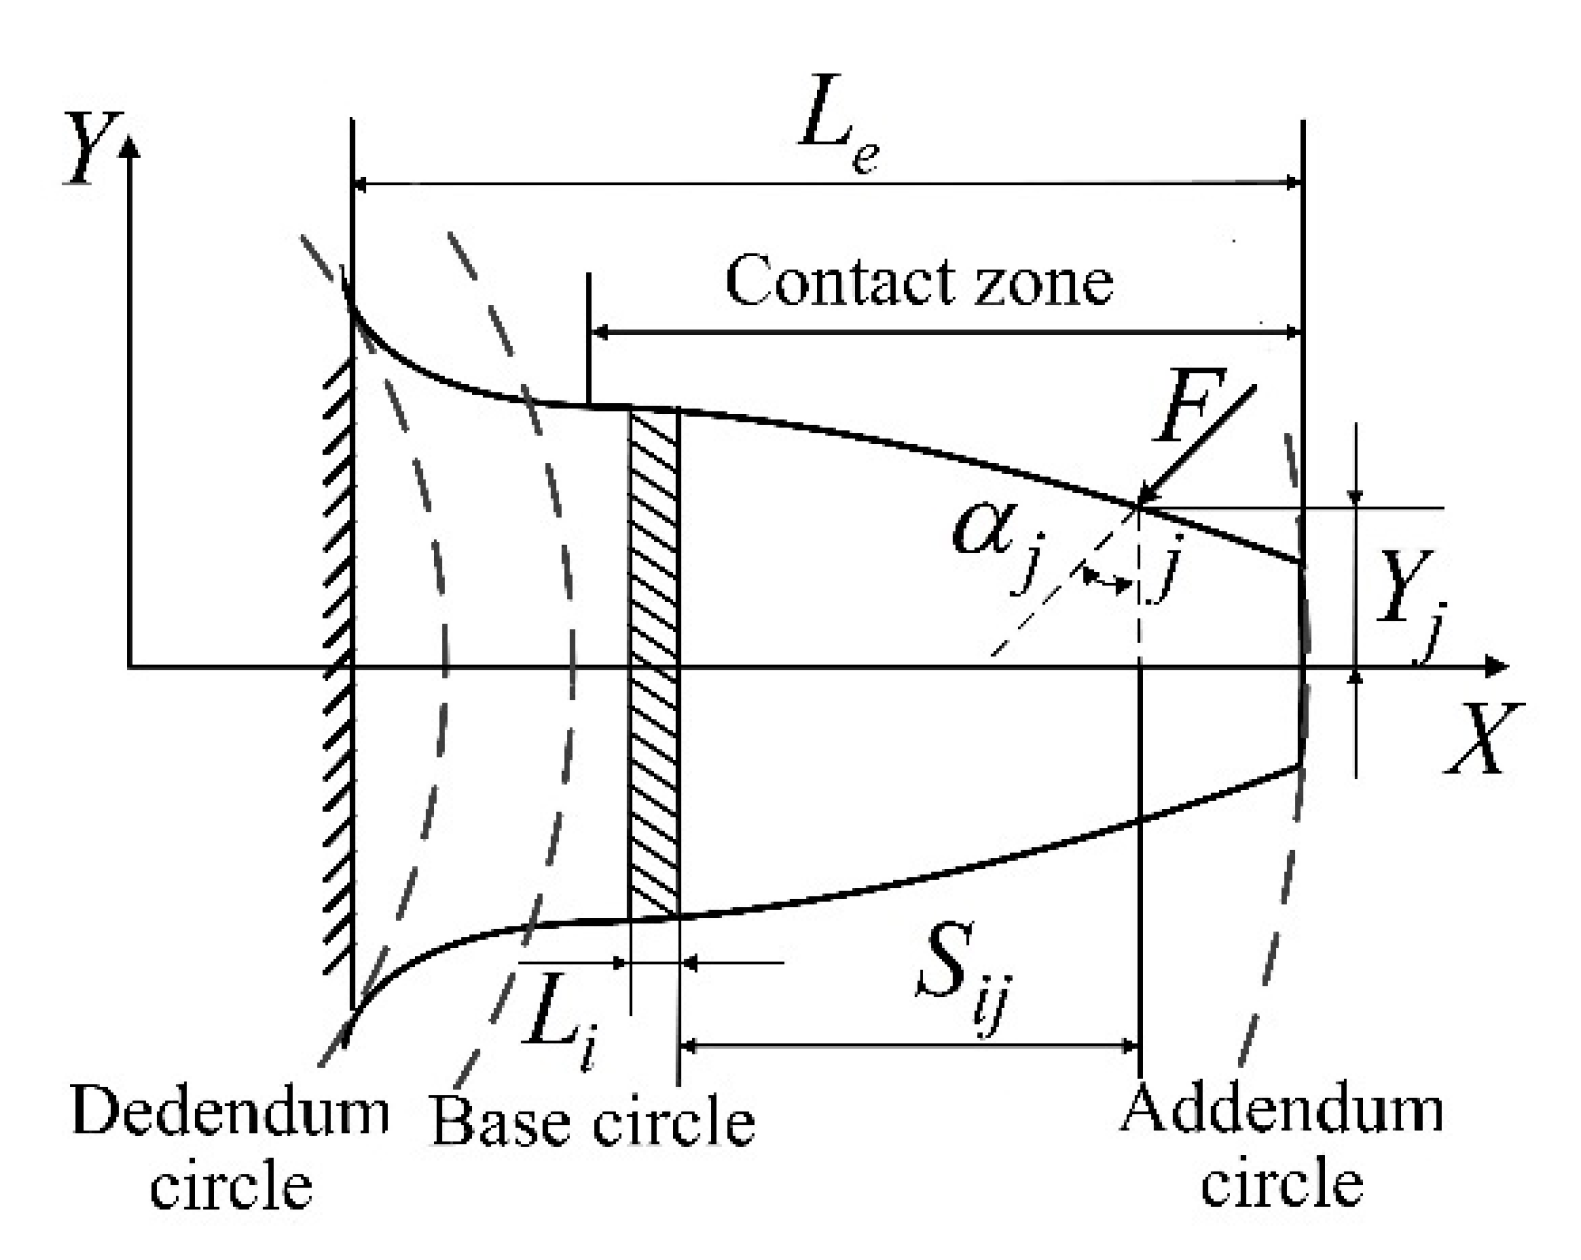
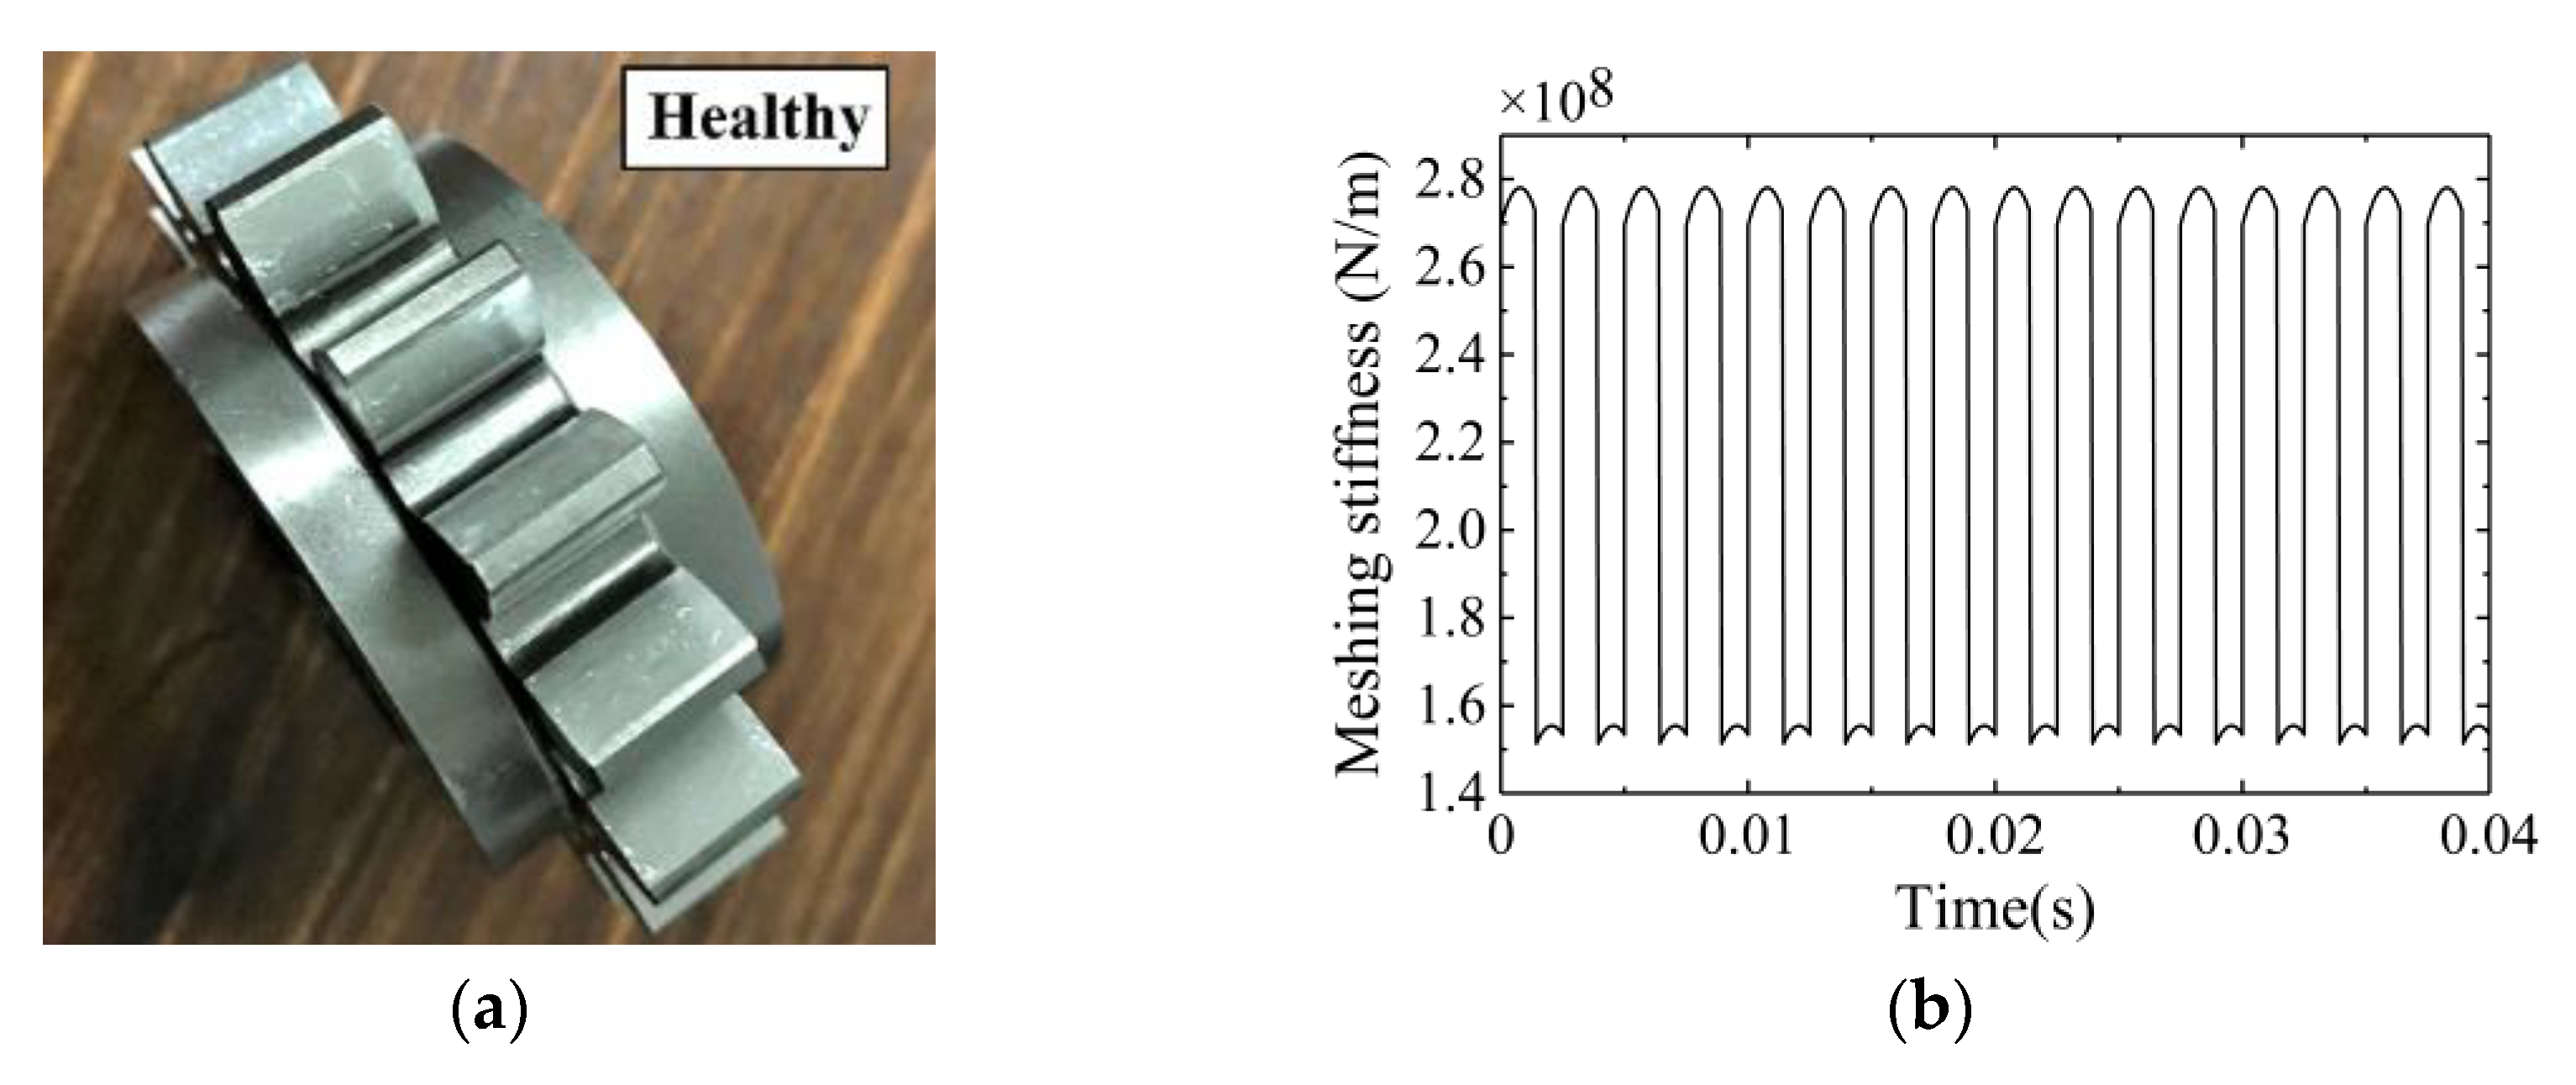
2.1. Mesh Stiffness Calculation of Gears with Healthy Teeth

Mesh stiffness is a time-varying parameter that can reflect the meshing conditions of gears. In this paper, the meshing stiffness of one tooth is calculated from defections caused by bending, axial compressive, shear, and contact deflection. According to Reference [47], in order to calculate the deflections of a tooth, the tooth is considered as a non-uniform cantilever beam with an effective length Le and under applied force F. Meanwhile, the tooth is divided into n segments, as shown in Figure 2.
On the basis of the Timoshenko’s beam theory [48], the stiffness of the tooth bending, shear, and axial compressive are given as follows.
1 k b j = i = 1 n 1 E e ( L i 3 + 3 L i 2 S i j + 3 L i S i j 2 3 I j cos 2 a j L i 2 Y j + 2 L i Y j S i j 2 I j cos a j sin a j + 12 ( 1 + v ) L i 5 A j cos 2 a j + L i A j sin 2 a j )
where Li and aj represent the thickness of a microelement and the pressure angle of the contact point j, respectively. Sij is the distance between a micro-element and the contact point in the X direction. Yj is the corresponding half tooth thickness. Aj and Ij denote the cross-sectional areas and area moments of inertia, respectively. The Aj and Ij could be expressed by Equations (2) and (3).
A j = 2 B Y j
I j = 1 12 B ( 2 Y j ) 3
Ee represents the effective-Young’s modulus, which can be expressed as:
E e = { E B H p < 5 E 1 v 2 B H p 5
in which E and v are the Young’s modulus and the Poisson’s ratio, respectively. B is the teeth width, and Hp is the thickness on the pitch circle.
The Hertzian contact stiffness is calculated by Equation (5).
1 k h j = 4 ( 1 v 2 ) π B E
For a single-tooth-pair meshing duration, the total effective stiffness is defined by the equation below [28].
k p g = 1 1 k h + 1 k b p + 1 k b g
where p and g are pinion and gear, respectively.
For a double-tooth-pair meshing duration, there are two pairs of gears meshing at the same time. Therefore, the total effective stiffness is defined as [28]:
k t = k p g 1 + k p g 2 = f = 1 2 1 1 k h , f + 1 k b p , f + 1 k b g , f
where f = 1 for the first pair and f = 2 for the second pair of meshing teeth.

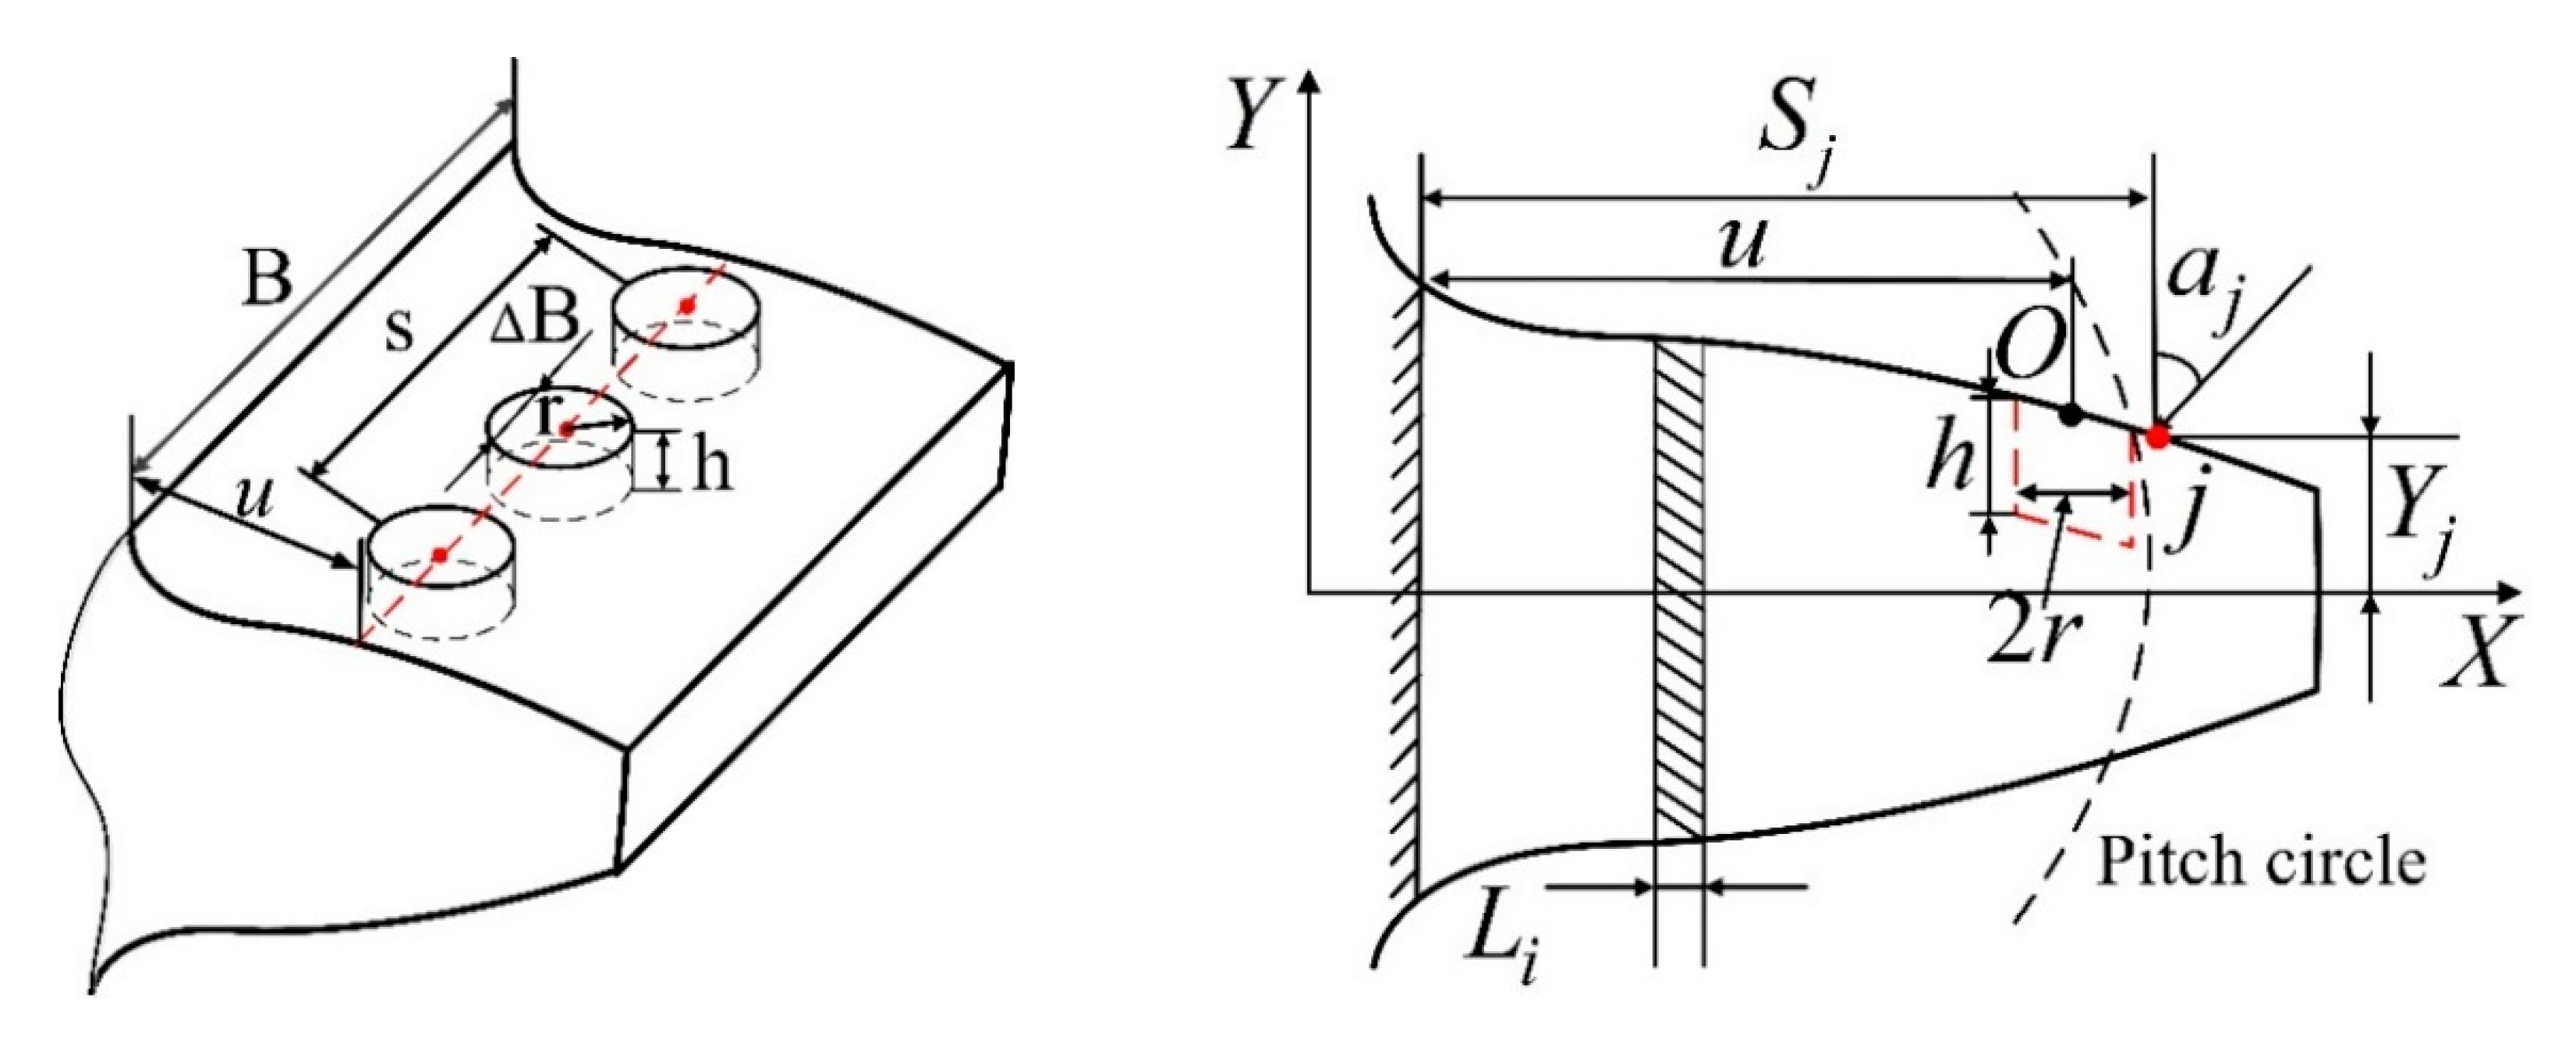
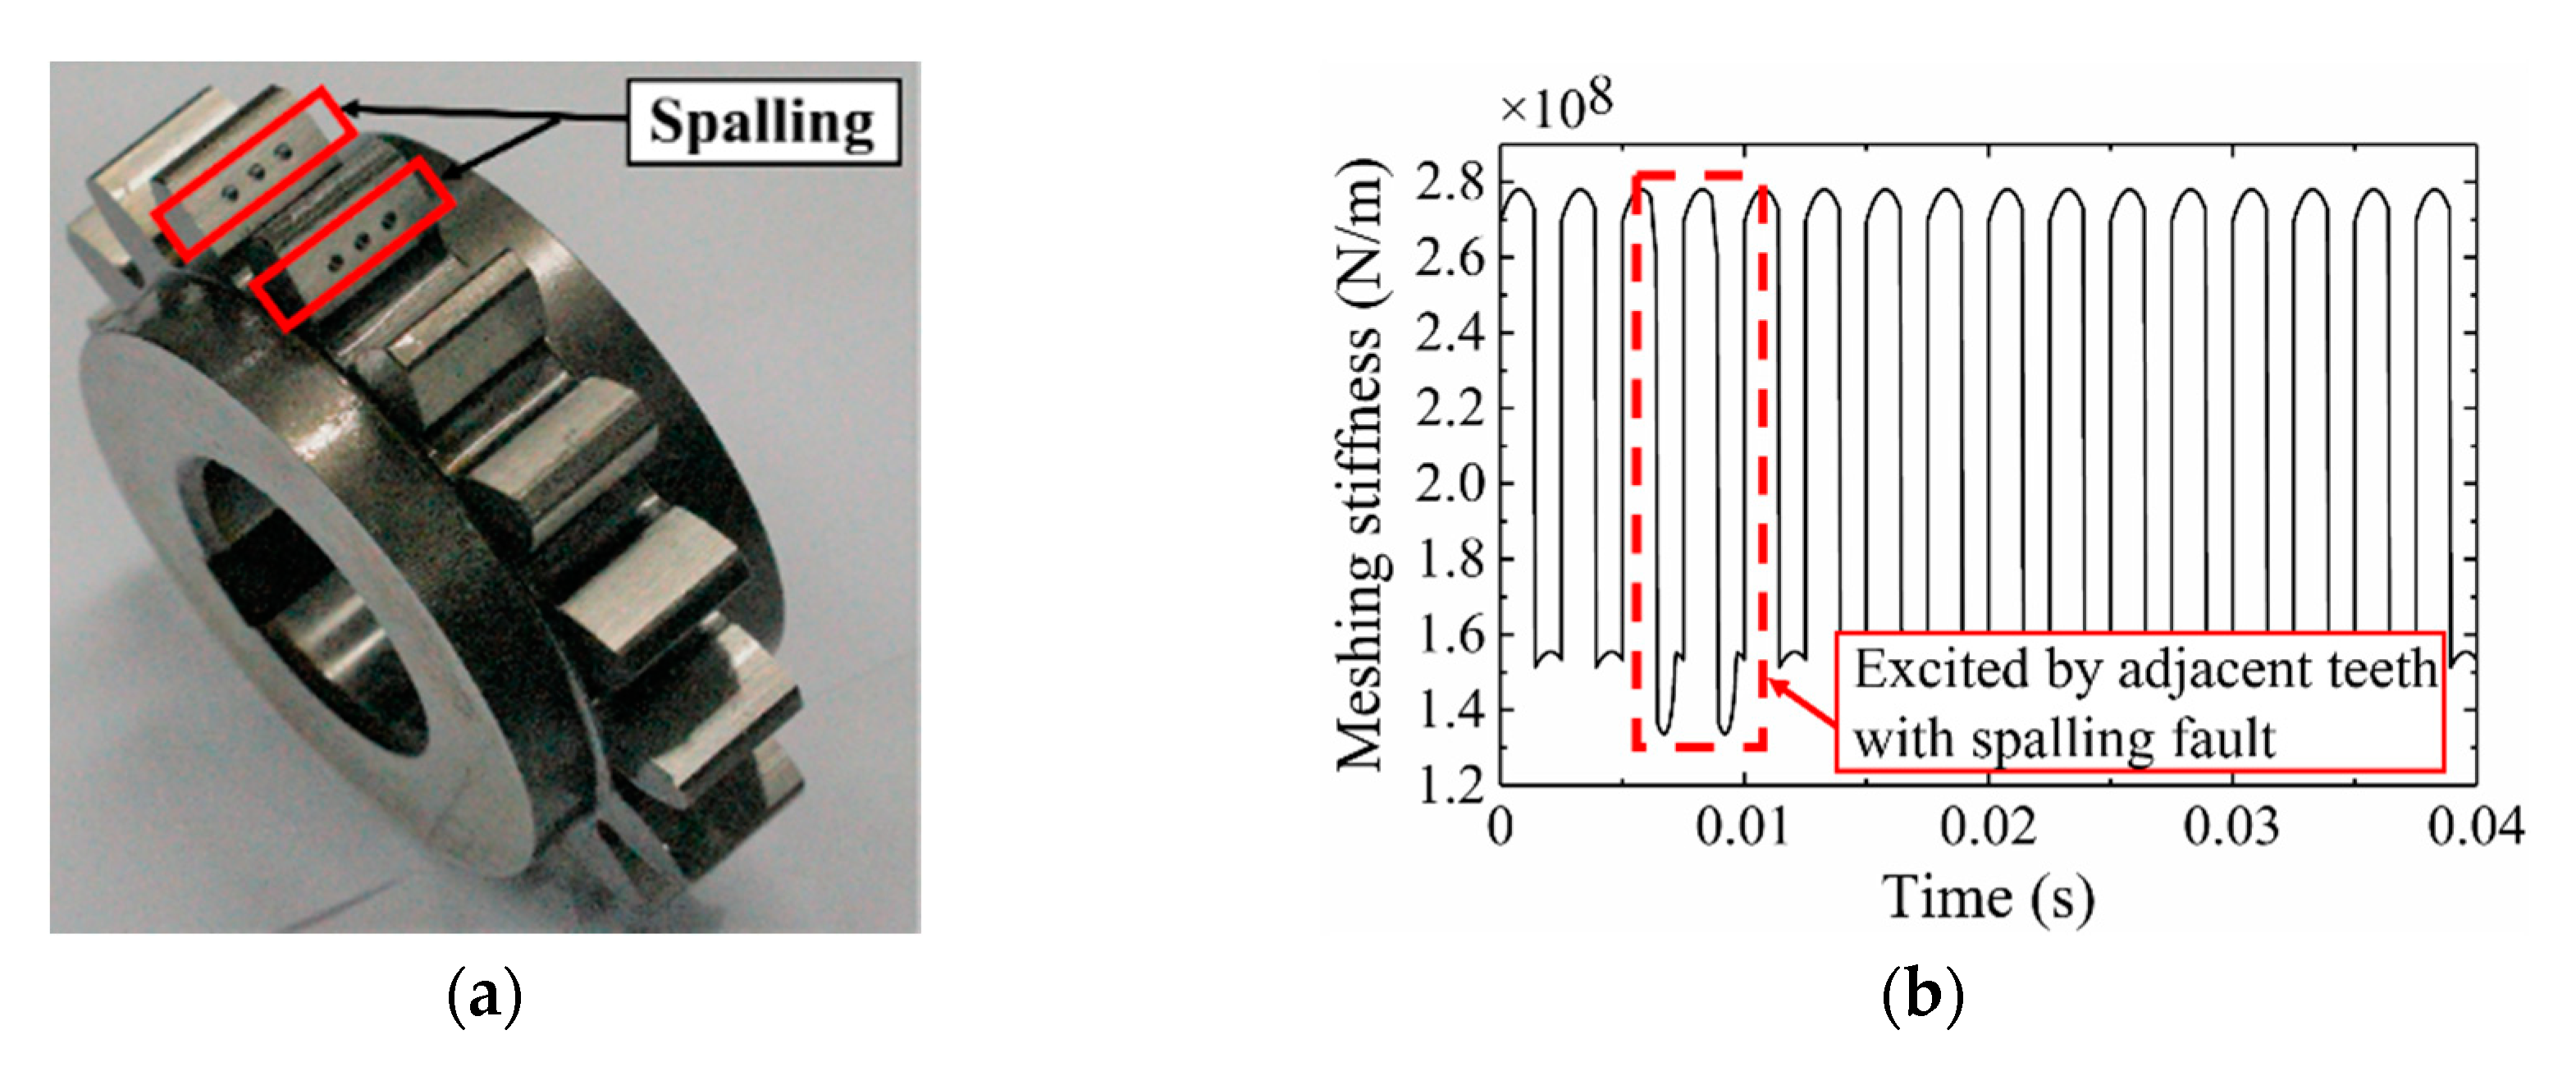
2.2. Mesh Stiffness Calculation of Gears with Tooth Spalling

The calculation method of mesh stiffness of gears with spalling teeth is similar to that of healthy gears. Both of these calculation methods consider the axial compressive stiffness, shear stiffness, bending stiffness, and Hertzian contact stiffness. According Reference [20], spalling is molded as a circular shape and occurred near the gear pitch line of the pinion, as shown in Figure 3.
For a gear tooth with spalling, the value of B, Aj, and Ij are reduced. Here, ΔB, ΔAj, and ΔIj represent the reduction of tooth contact width, area, and area moment of inertia of the tooth spalling section, respectively, which are given as follows.
Δ B j = { 2 r 2 [ u s j ] 2 , x j [ u r ,   u + r ] 0 , o t h e r s
Δ A j = { s h Δ B j , x j [ u r , u + r ] 0 , o t h e r s
Δ I j = { 1 12 s Δ B j h 3 + A j Δ A j ( Y j h / 2 ) 2 A j Δ A j , x j [ u r ,   u + r ] 0 , o t h e r s
where r, h, and s are the radius, depth, and number of spalling points, respectively. u is the distance between the center point of spalling and the tooth root. sj denotes the distance between the gear contact point and the tooth root. Details of u and sj could be found [20].
Here, B j , A j , and I j denote the tooth contact width, area, and area moment of inertia of the tooth spalling section, respectively. They can be expressed as follows.
B j = B Δ B j
A j = A j Δ A j
I j = I j Δ I j
Substituting Equations (2) to (4), (8) to (10), (11) to (13) into Equation (1), the stiffness of the tooth bending, shear, and axial compressive of gear with spalling can be obtained as follows.
1 k b j = i = 1 n 1 E e ( L i 3 + 3 L i 2 S i j + 3 L i S i j 2 3 ( I j Δ I j ) cos 2 a j L i 2 Y j + 2 L i Y j S i j 2 ( I j Δ I j ) cos a j sin a j + 12 ( 1 + v ) L i 5 ( A j Δ A j ) cos 2 a j + L i ( A j Δ A j ) sin 2 a j )
Substituting Equations (2) to (4), (8) to (10), (11) to (13) into Equation (5), the Hertzian contact stiffness of gear with spalling can be obtained as follows.
1 k h j = 4 ( 1 v 2 ) π E ( B Δ B j )
Substituting Equations (14) and (15) into Equation (6), the total effective stiffness is expressed as the following.
k p g = 1 1 k h + 1 k b p + 1 k b g

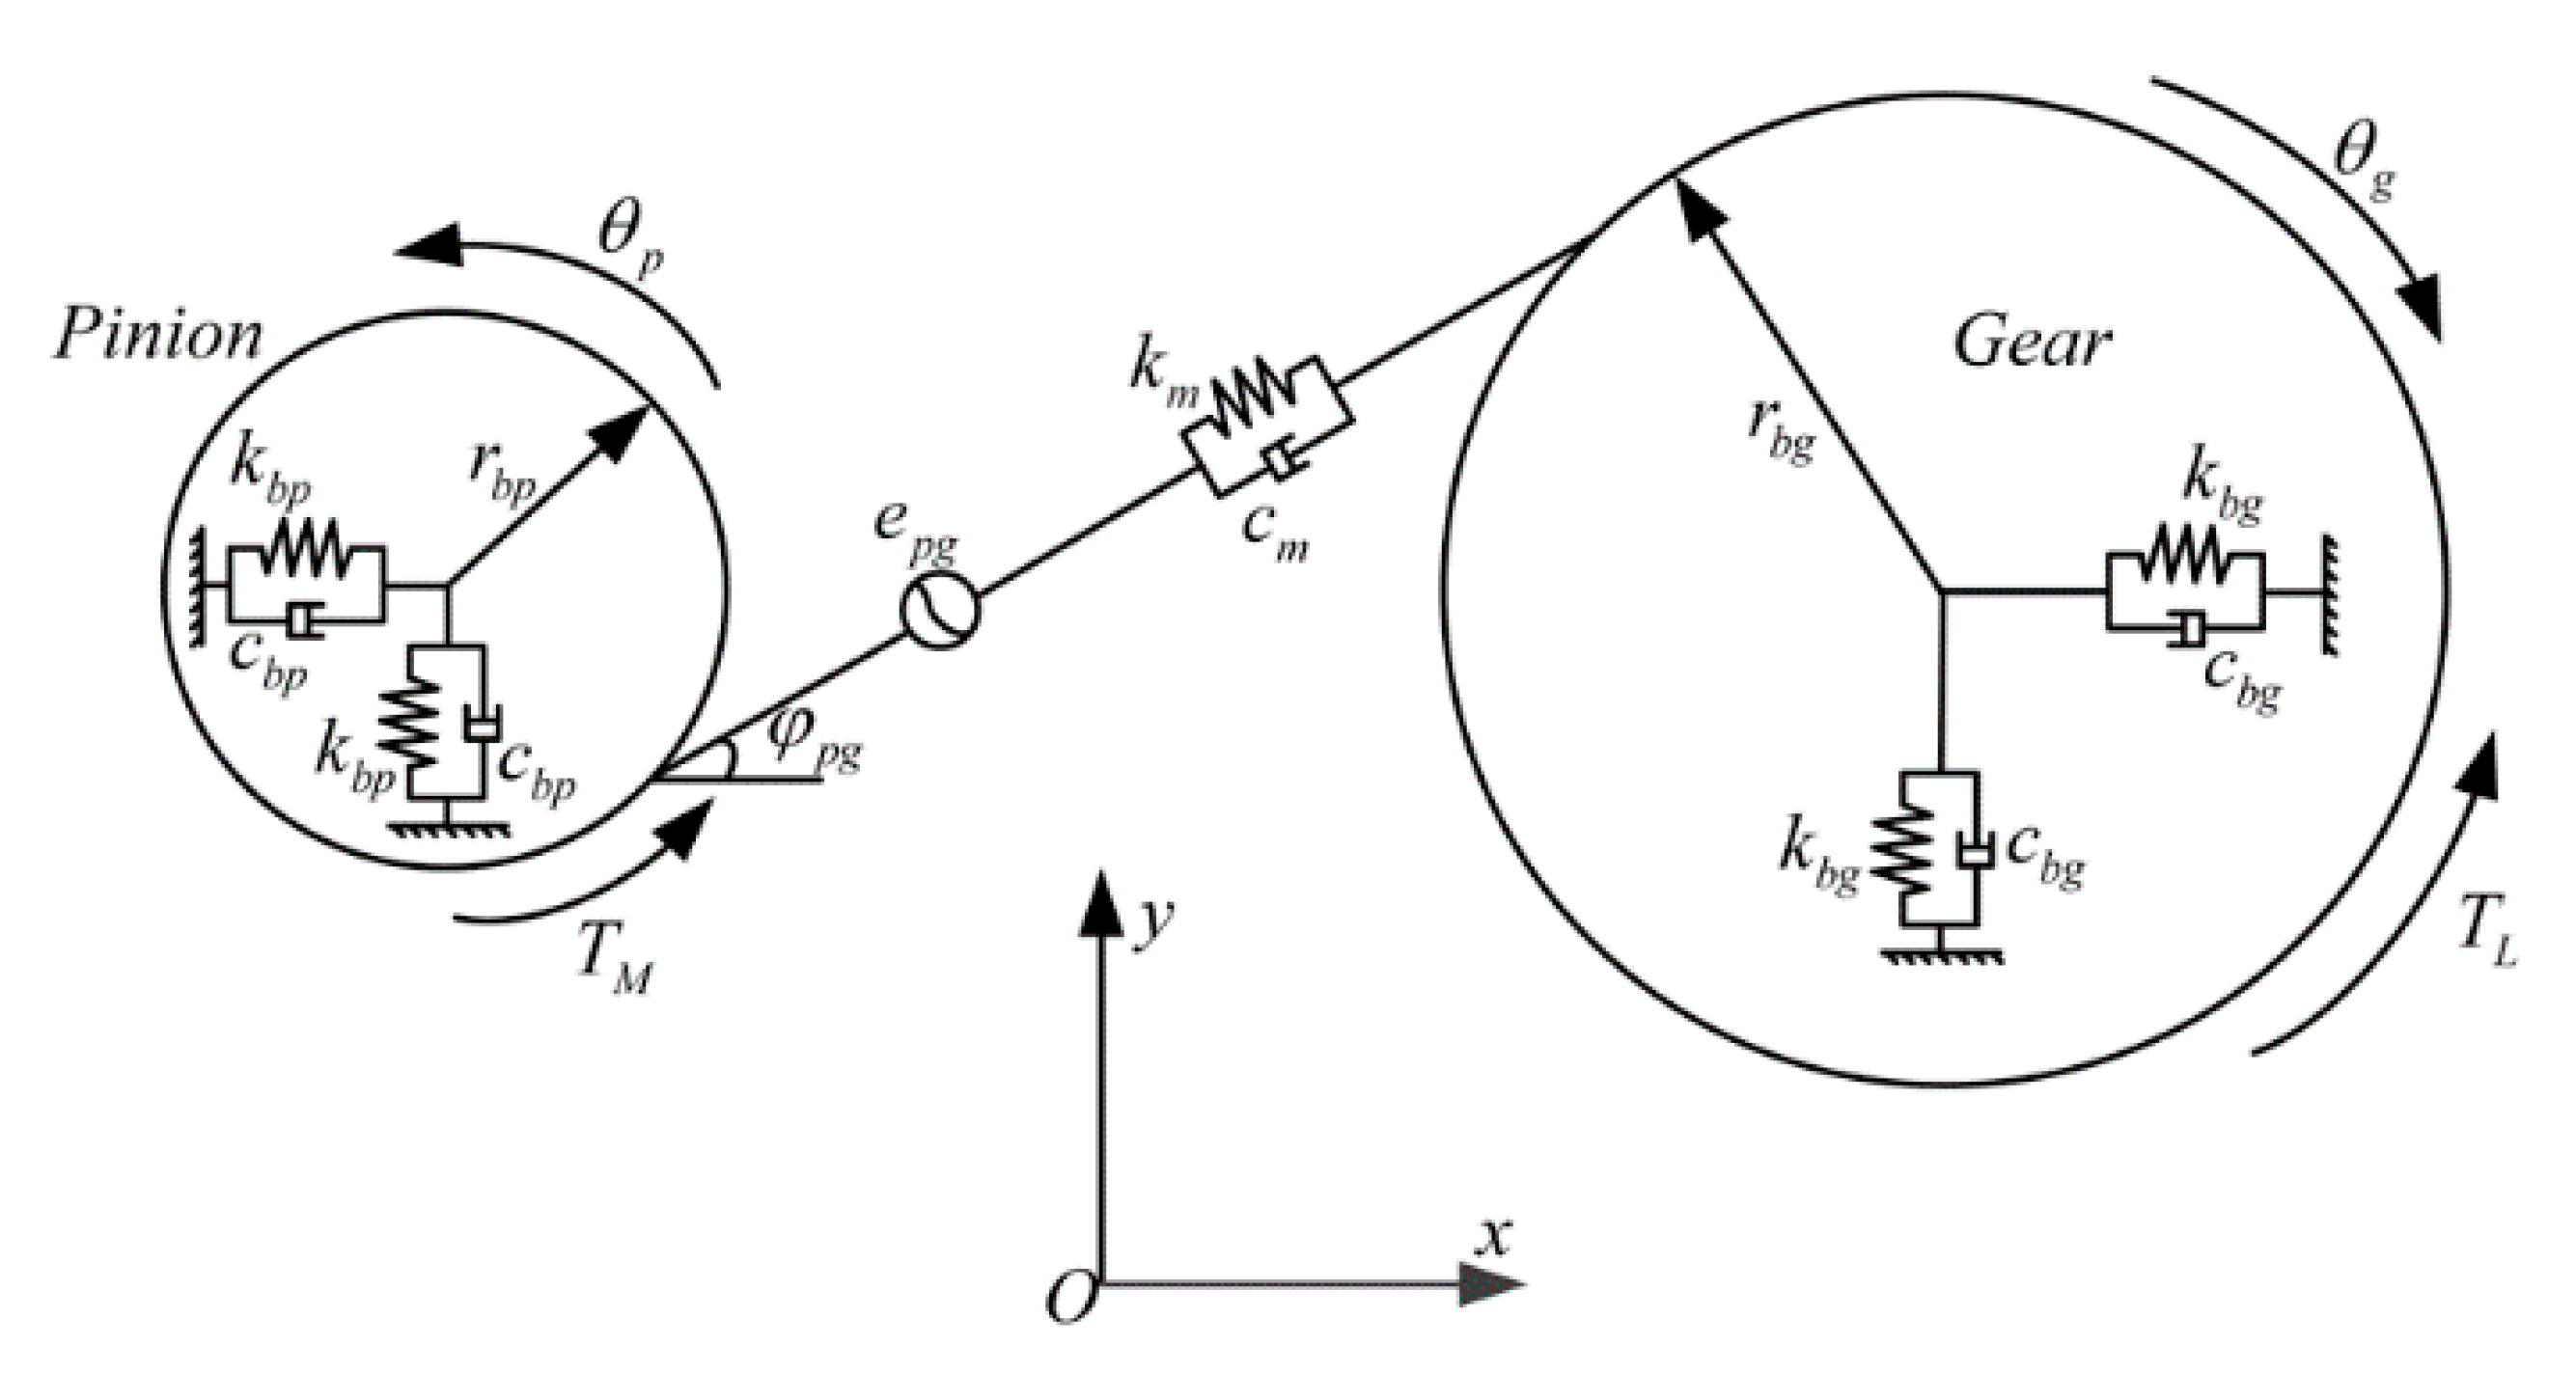
3. Dynamic Model of a Gear System

As shown in Figure 4, a six-degree of freedom dynamical model that considers the time-vary mesh stiffness, transmission error, and bearing support stiffness is established in which the changes of TVMS are caused by a double-teeth spalling fault [12].
Here are some assumptions: (1) the bearings at both ends of the shaft have the same stiffness and damping, (2) the gearbox casing is a rigid body, and (3) the shaft of the pinion and gear are parallel to each other. The equations of the dynamic model are given by Equation (17).
{ m p x ¨ p + c b p x ˙ p + k b p x p + F p g cos φ p g = 0 m p y ¨ p + c b p y ˙ p + k b p y p + F p g sin φ p g = 0 I p θ ¨ p + r b p F p g = T M m g x ¨ g + c b g x ˙ g + k b g x g F p g cos φ p g = 0 m g y ¨ g + c b g y ˙ g + k b g y g F p g sin φ p g = 0 I g θ ¨ g r b g F p g = T L
Fpg denotes the total mesh force, and it is expressed by:
F p g = c m [ r b p θ ˙ p r b g θ ˙ g ( x ˙ p x ˙ g ) cos φ p g ( y ˙ p y ˙ g ) sin φ p g e ˙ p g ] + k m [ r b p θ p r b g θ p ( x p x g ) cos φ p g ( y p y g ) sin φ p g e p g ]
where rbp and rbg are the base circle radius of pinion and gear, Ip and Ig are the mass moments of inertia of the pinion and gear, mp and mg are the masses of the pinion and gear, kbp and kbg are the bearing stiffness of the pinion and gear, respectively, cbp and cbg are the bearing damping of the pinion and gear, respectively, TM is the input torque, TL is the load torque, the time-varying meshing damping cm is mentioned in Reference [49], and epg denotes the transmission error, which can be obtained by the equation below.
e p g ( t ) = e m + e r sin ( 2 π f m + ϕ ) + Δ f f cos α + Δ f p b cos α
where em is the constant of the mesh error on the pitch circle, and er is the amplitude of mesh error on the pitch circle. a is the pressure angle, fm is the mesh frequency of the gear, and ϕ is the phase. Δff is tooth error and Δfpb is the base pitch error, as shown in Figure 5.

4. Dynamic Simulation and Experimental Verification

The simulated vibration signal is compared with the experimental measurement signal, and the dynamic simulation results are verified under conditions of a different faulty tooth number, and relative position of faulty teeth. The simulation parameters are detailed in Table 1.
The gear test-rig consists of a controller, a three-phase motor, a test gearbox, and a load applied by a clutch, as shown in Figure 6. Table 1 indicated the performance parameters of the gear and bearing. The data acquisition system is B&K-3560C, and the experimental vibrations signal is measured along the meshing line of the gear teeth by the sensor mounted on the bearing pedestal. The sampling frequency is 65,536 Hz, and the sampling time is 1 s. Since the pinion is a faulty gear, the vibration signal apy of the pinion in the direction of the meshing line is collected.
The test-rig presented in Figure 6 is the standard FZG test-rig of STRAMA-MPS. This FZG test-rig consists of a controller, a three-phase motor, a test gearbox, and a load applied by a clutch. Table 1 indicated the performance parameters of the gear and bearing. The data acquisition system is BRUEL&KJAER-3560C, and the experimental vibrations signal is measured along the meshing line of the gear teeth by the sensor mounted on the bearing pedestal. The sampling frequency is 65536 Hz, and the sampling time is 1 s. Since the pinion is a faulty gear, the vibration signal apy of the pinion in the direction of the meshing line is collected.

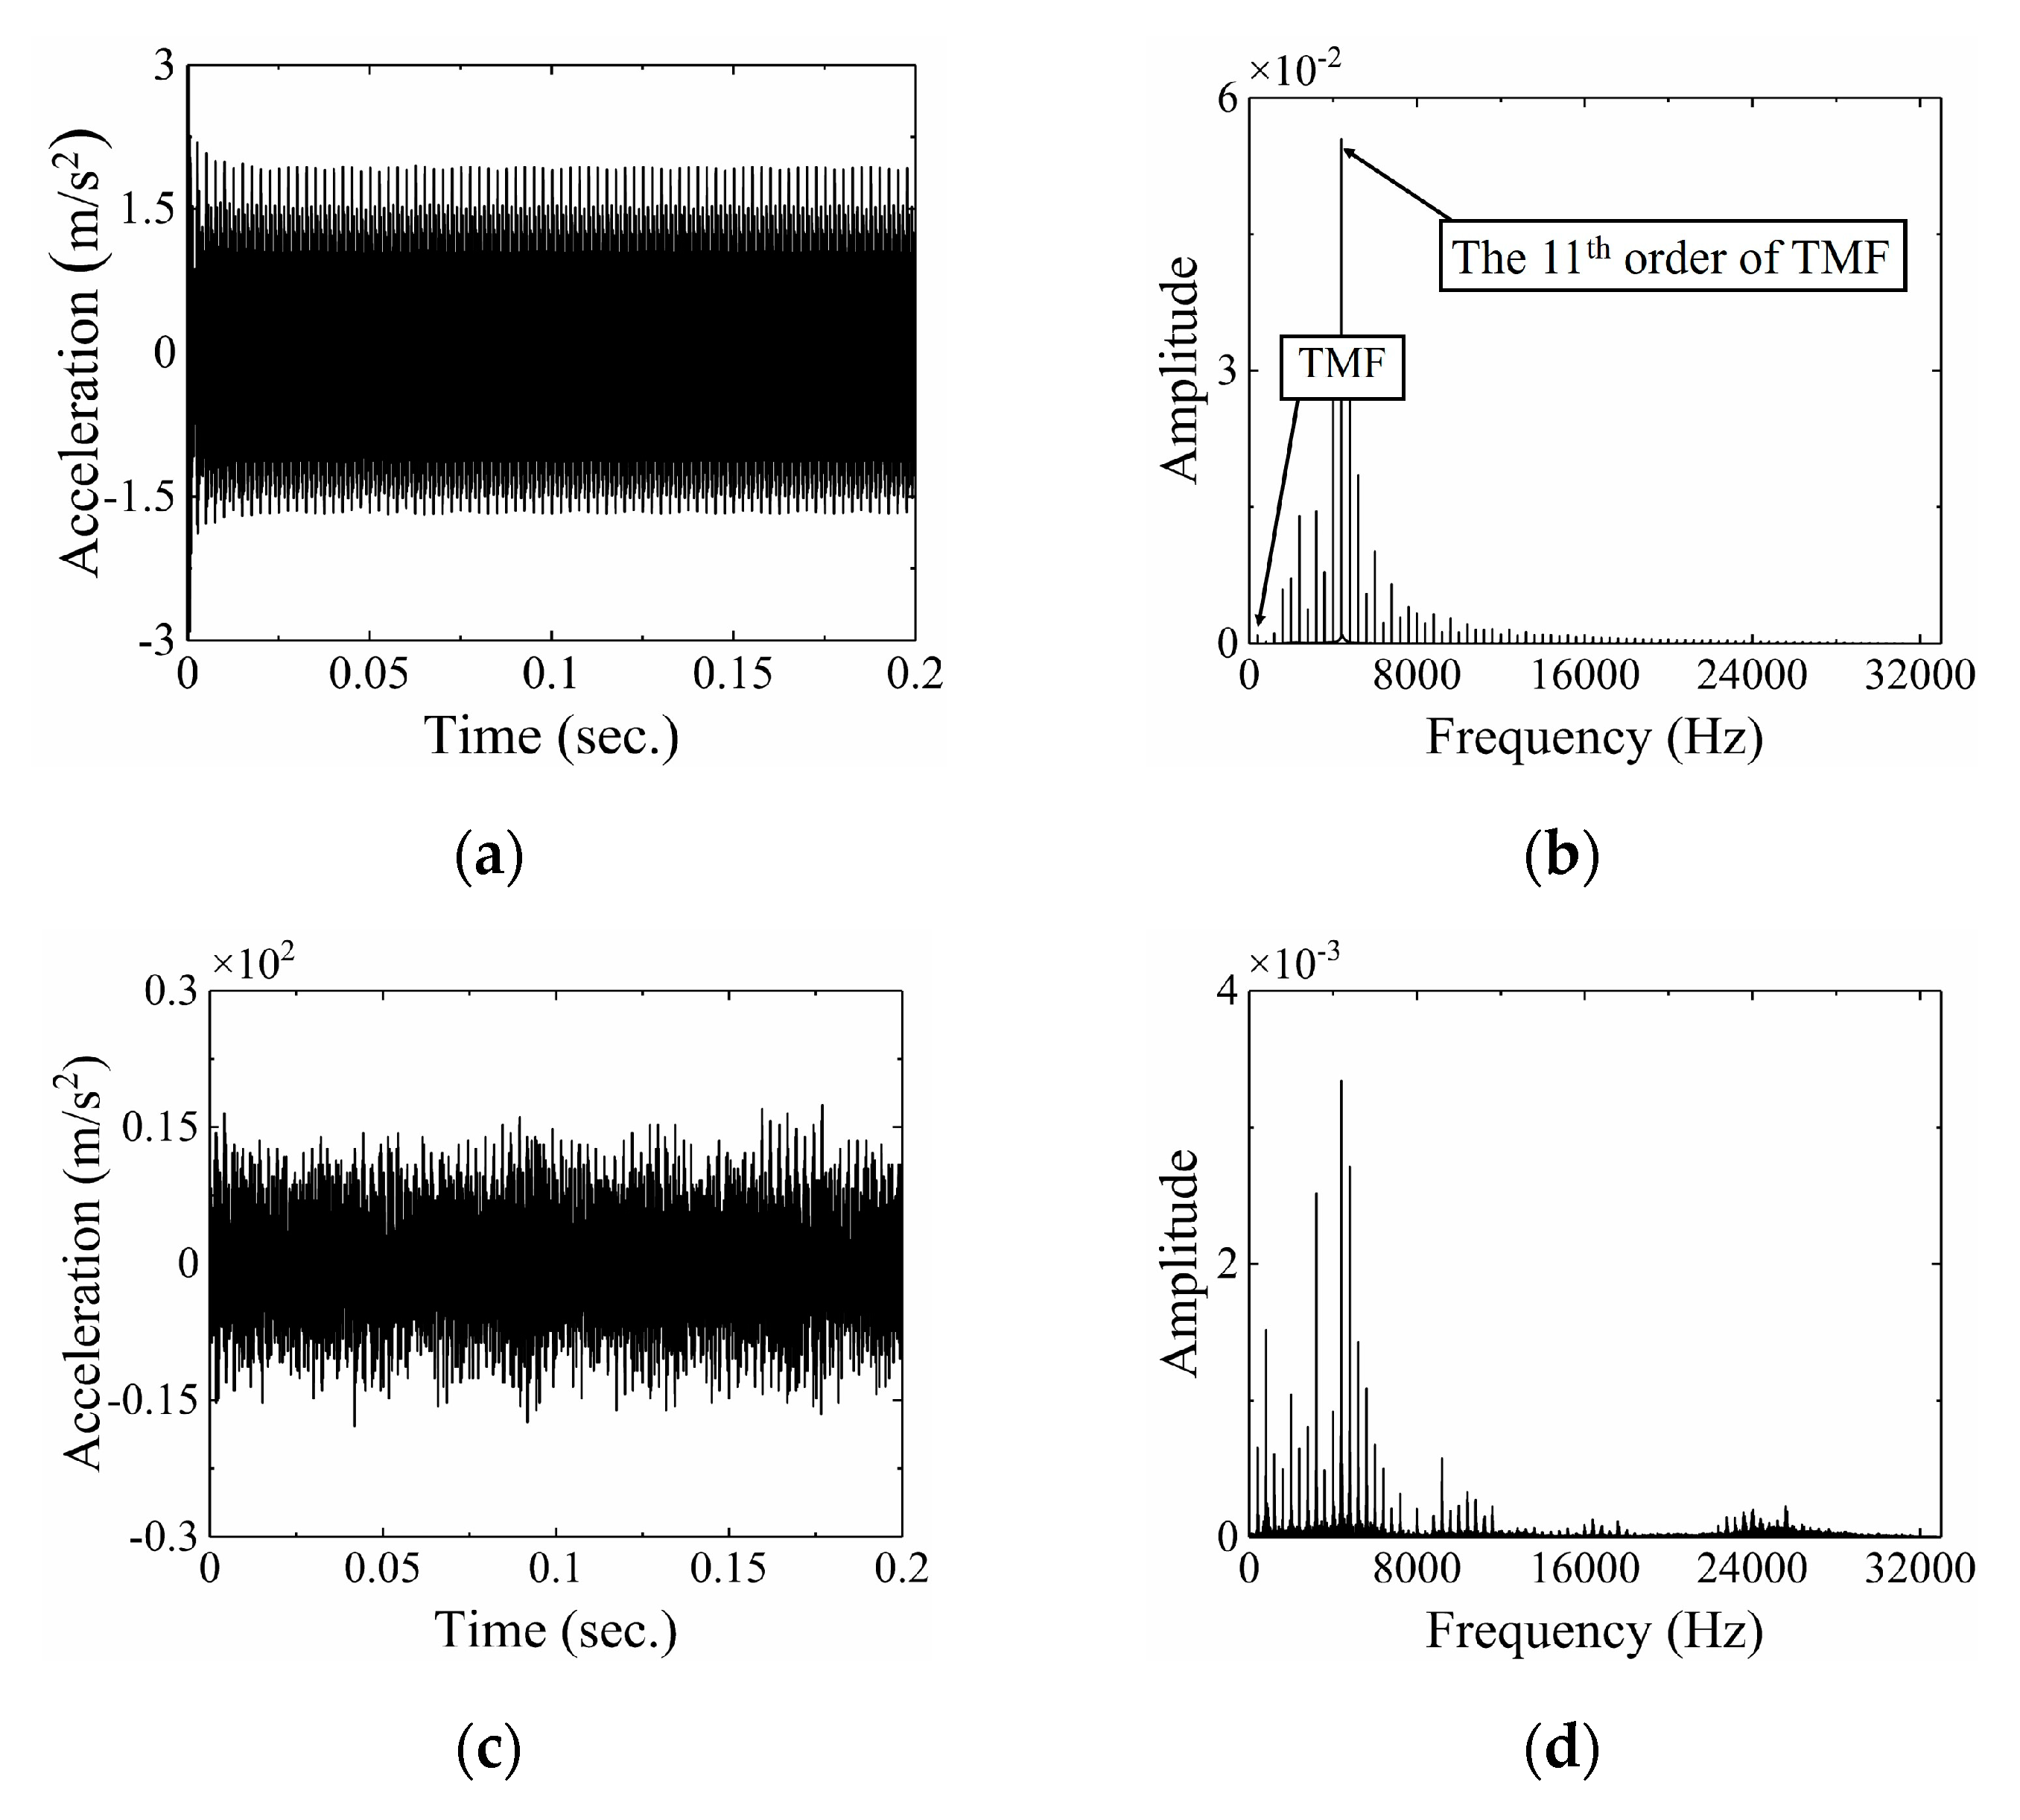
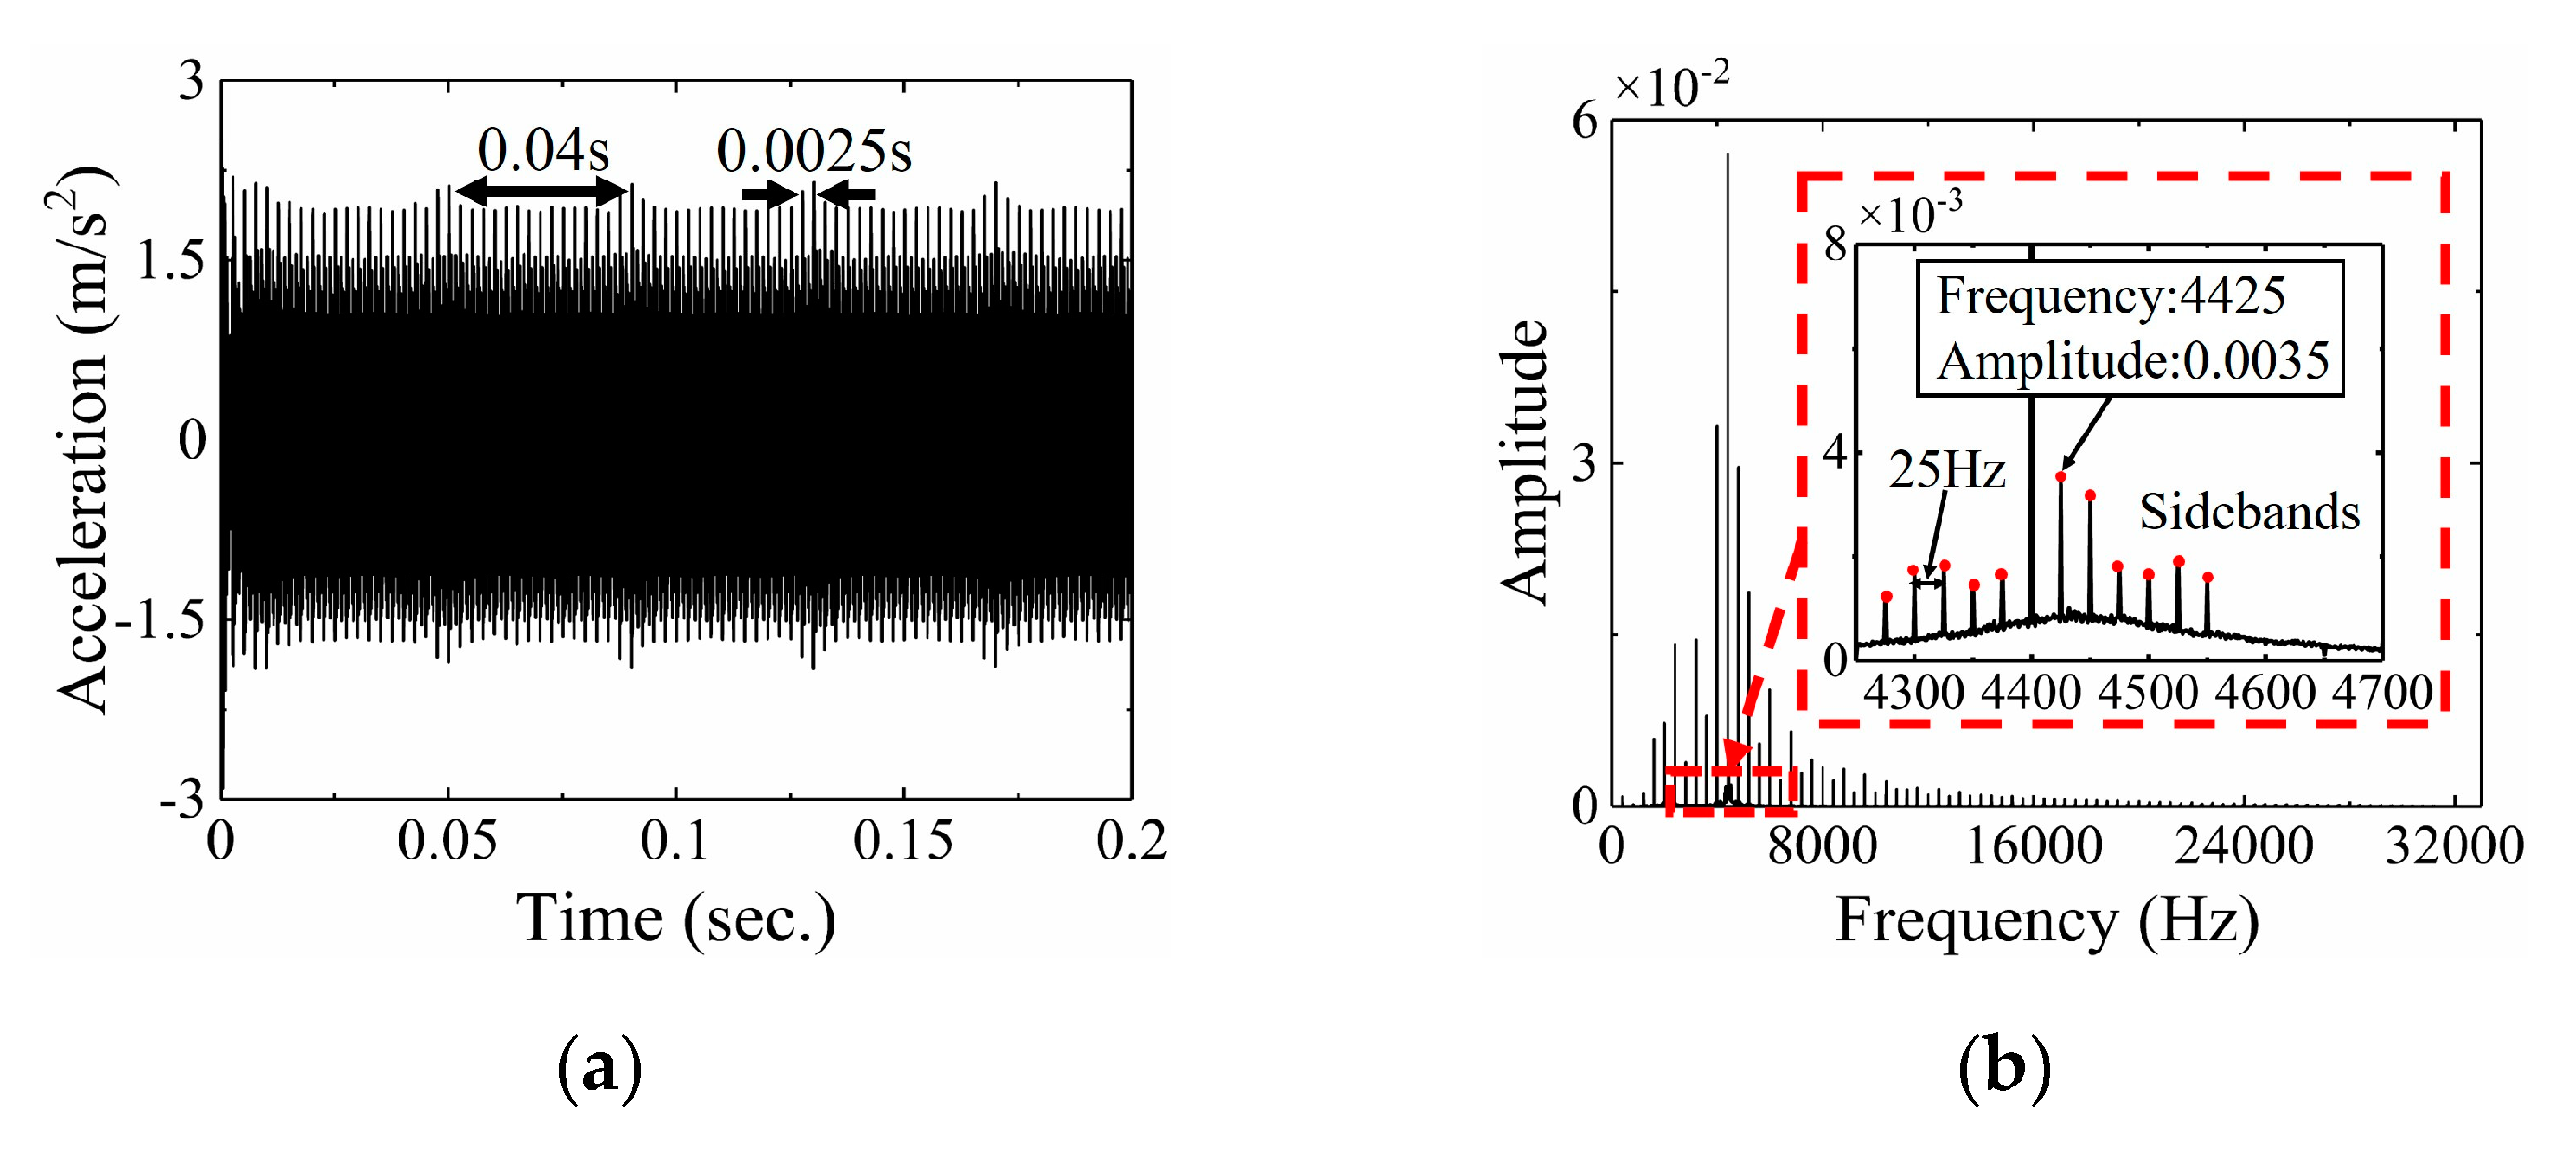
4.1. Effect of the Number of Spalling Faulty Teeth on Dynamic Characteristics of Gears

In this paper, we assume that the rotational speed of pinion is n = 1500 r/min, the rotational frequency of pinion is fs = 25 Hz, the rotating period of pinion is ts = 0.04 s, the meshing frequency is fm = 400 Hz, and the meshing period is tm = 0.0025 s. Three types of the spalling faulty tooth number are considered, namely health pinion, pinion with single tooth spalling, and pinion with adjacent double teeth spalling.
Figure 7a, Figure 8a, and Figure 9a present the failure states of tooth surface spalling, respectively. It can be clearly seen that the spalling is near the pitch line. This paper we set that r = 0.75 mm, h = 1 mm, and s = 3, where r, h, and s are the radius, depth, and numbers of spalling point, respectively. According to the method described in Section 2, the mesh stiffness is simulated. It can be observed from Figure 7b that the mesh stiffness curve is periodically changing during the meshing process. The mesh stiffness decreases when the spalling faulty tooth participates in an engagement. The frequency of mesh stiffness reduction is related to the number of teeth with spalling fault, as shown in Figure 8b and Figure 9b.
The simulated vibration signal and the experimental measurement signal under a different number of spalling faulty tooth are displayed in Figure 10, Figure 11 and Figure 12. The simulated results are close to the experimental results when the pinion is in a healthy state, as shown in Figure 10. There are no clear impulse vibrations in the time domain. Only tooth meshing frequency (TMF) and its harmonics are included in the frequency domain. In the frequency domain, the TMF is equal to the meshing frequency of gears, and the remaining harmonics are multiples of the TMF, as marked in Figure 10b,d.
Compared with the healthy gear, the spalling fault can generate the periodic impulse vibration, and sidebands are spaced by the rotational frequency of the faulty gears in the frequency domain. These features are successfully captured by the simulated signal. Figure 11 shows the simulated and experimental signal results of the pinion with single tooth spalling fault. As shown in Figure 11, the periodic impulse vibration can be recognized in the time domain, and the period of the impulse vibration is 0.04 s, which is equal to the rotating period of the pinion. The sideband appears in the frequency domain, and the spacing of the sideband is equal to the rotating frequency of the pinion. Figure 12 shows the simulated and experimental signal results of the pinion with an adjacent double tooth spalling fault. Compared with the time domain in Figure 11a, Figure 12a shows that the impulse vibration was excited twice with an interval of 0.0025 s in one rotational period of the pinion. However, impulse vibration in the experimental signal is submerged by the background noise, as shown in Figure 11c and Figure 12c. In the frequency domain, the maximum value of the sideband of Figure 12 is higher than that in Figure 11. The results of frequency domain analysis show that the fault feature in a case of double-teeth spalling are more clear than that in the case of single tooth spalling. However, due to the strong background noise, the fault feature frequencies in the experimental signal are not clear, and may even be submerged by the noise frequencies, as shown in Figure 11d and Figure 12d.

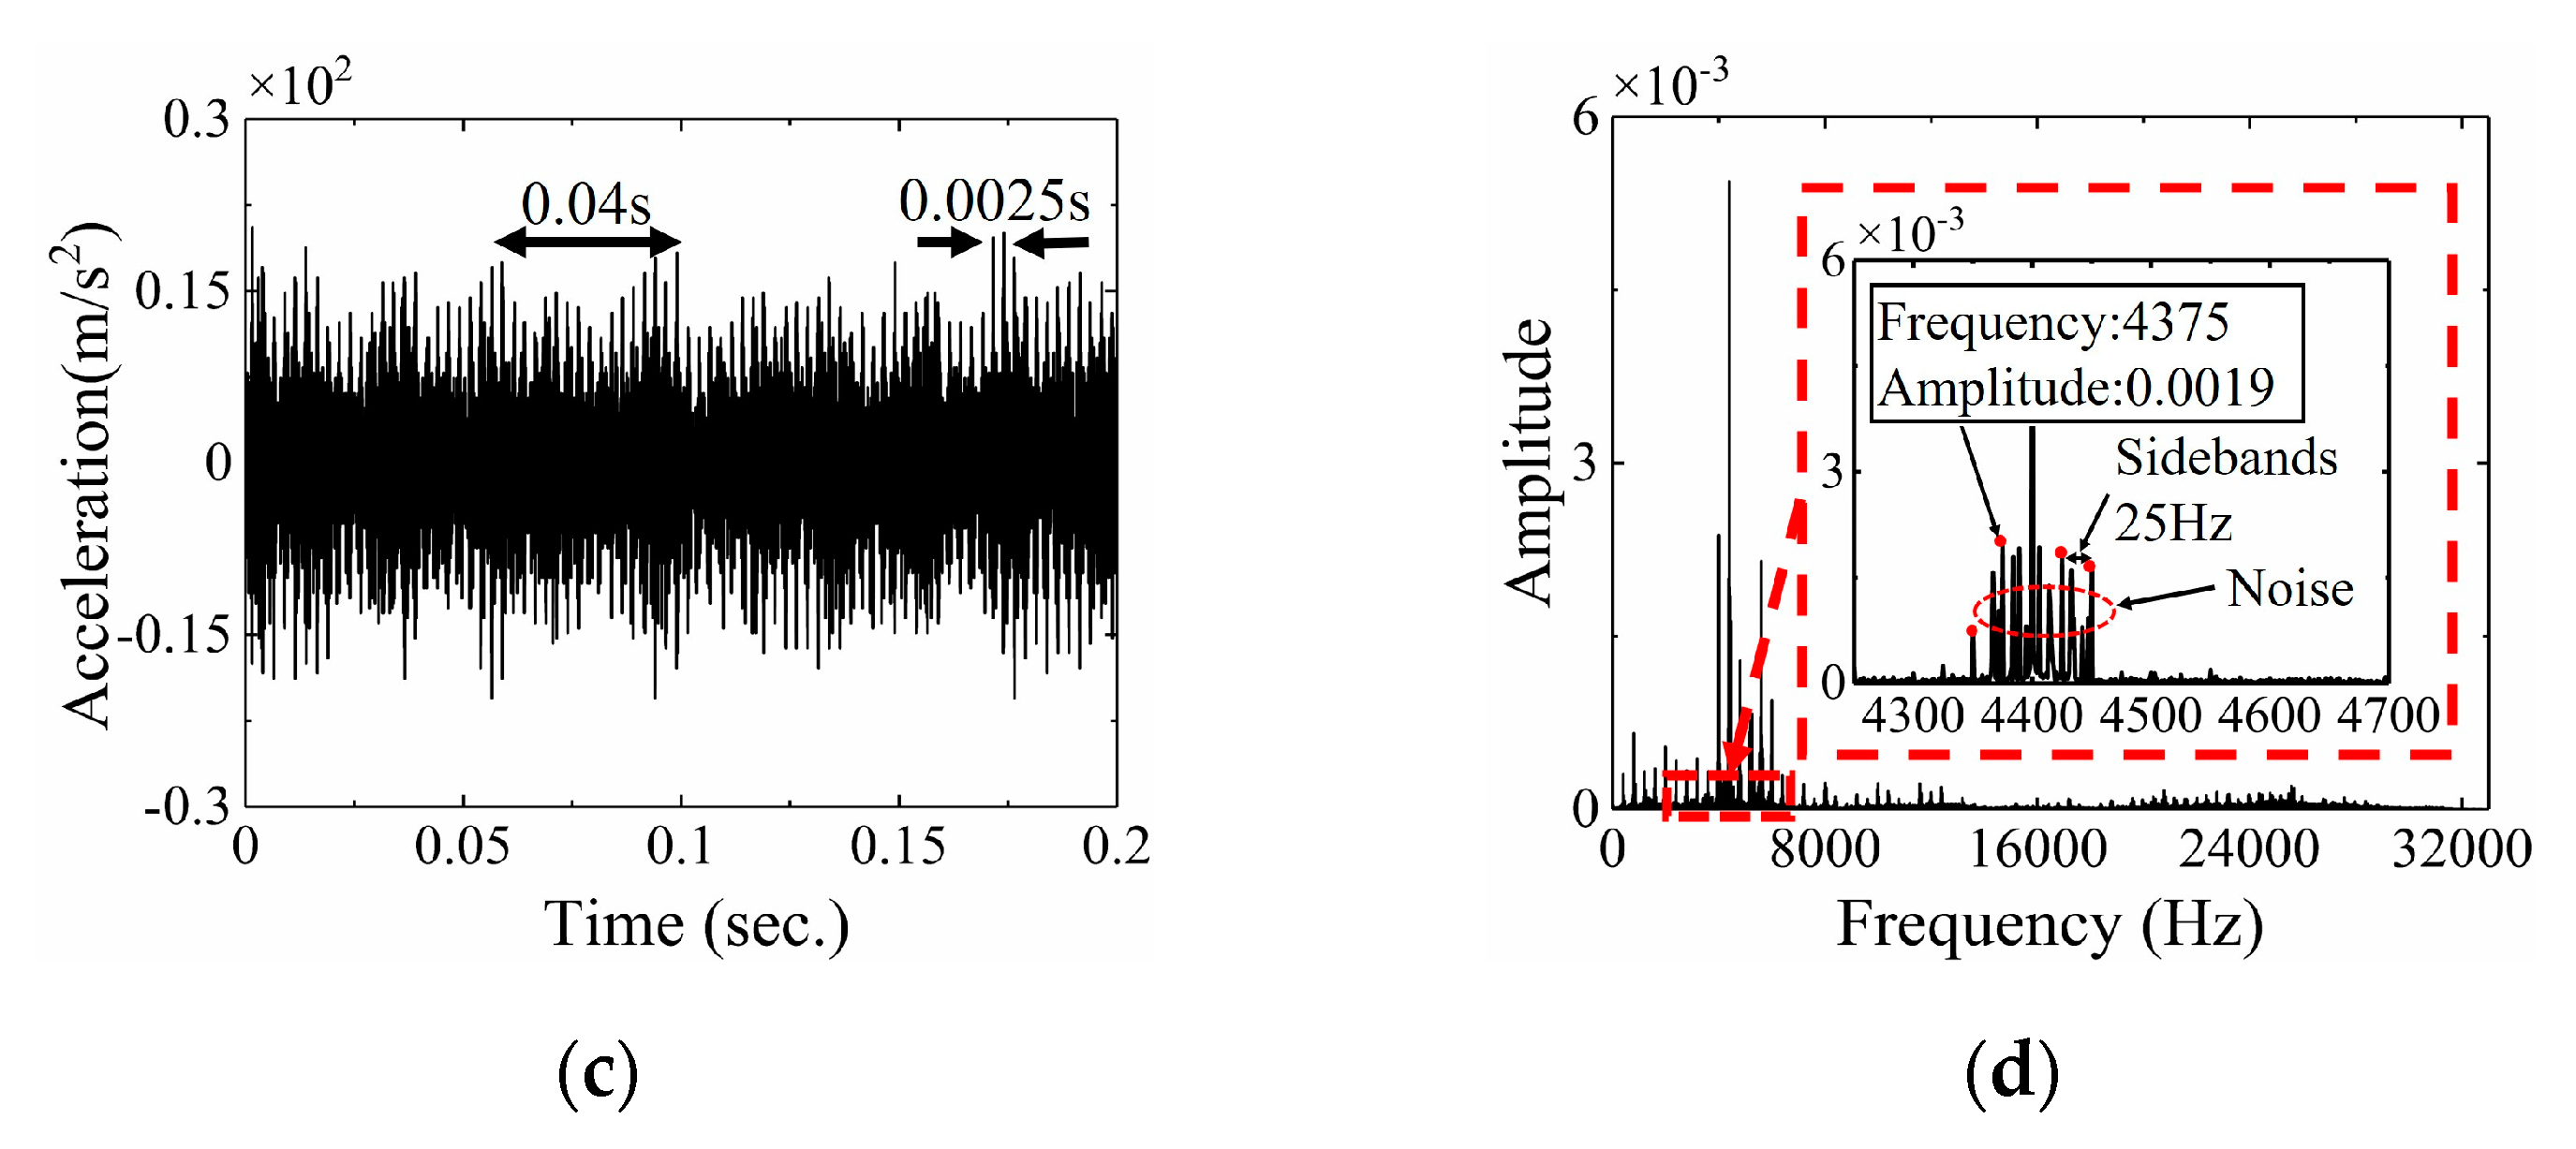
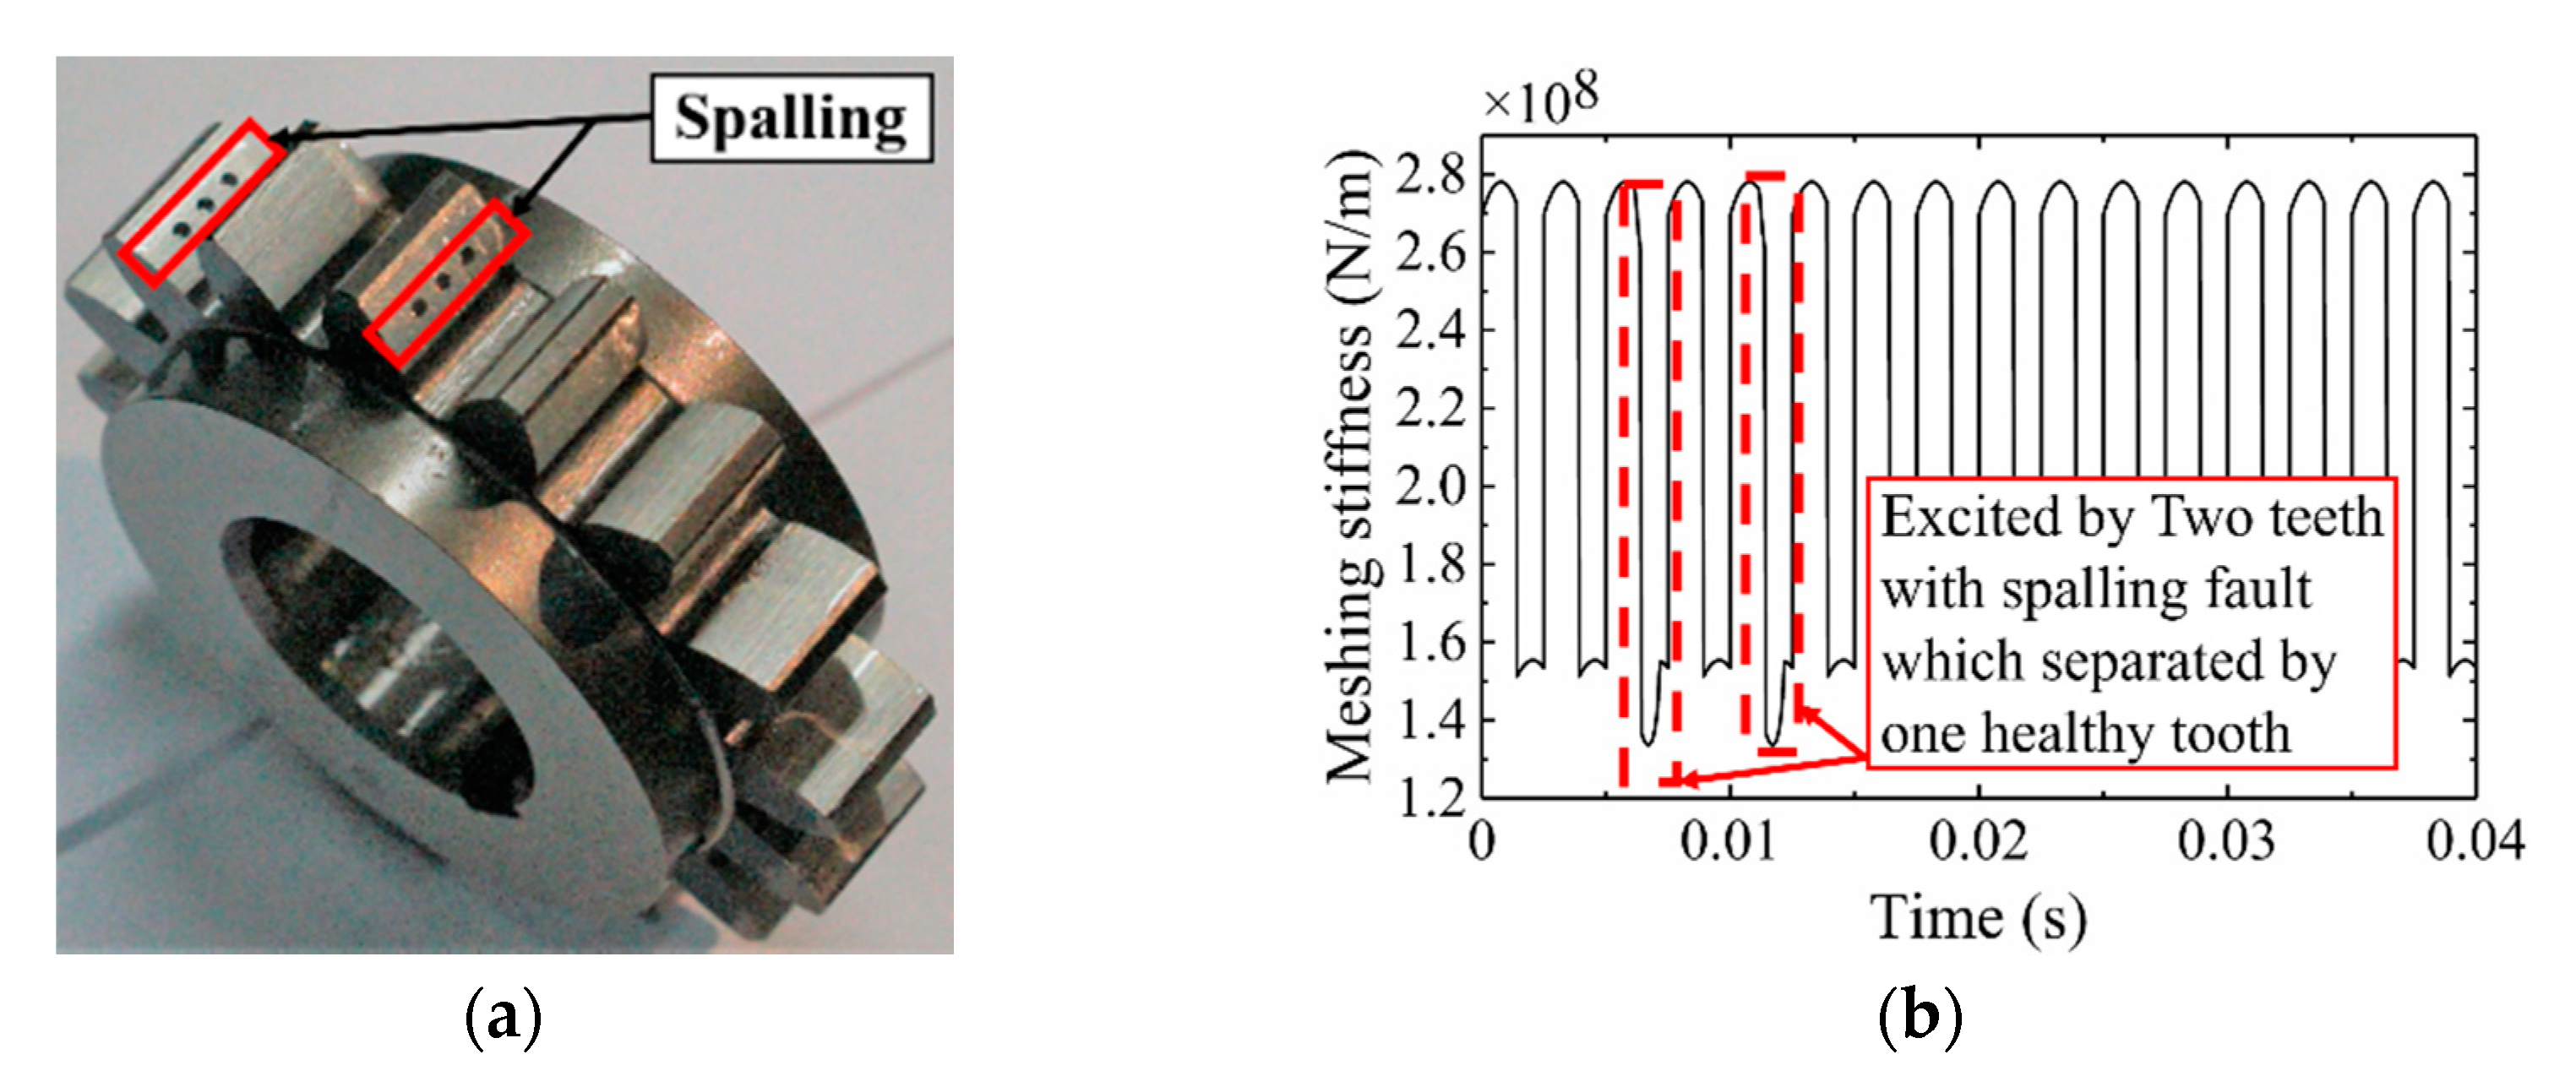
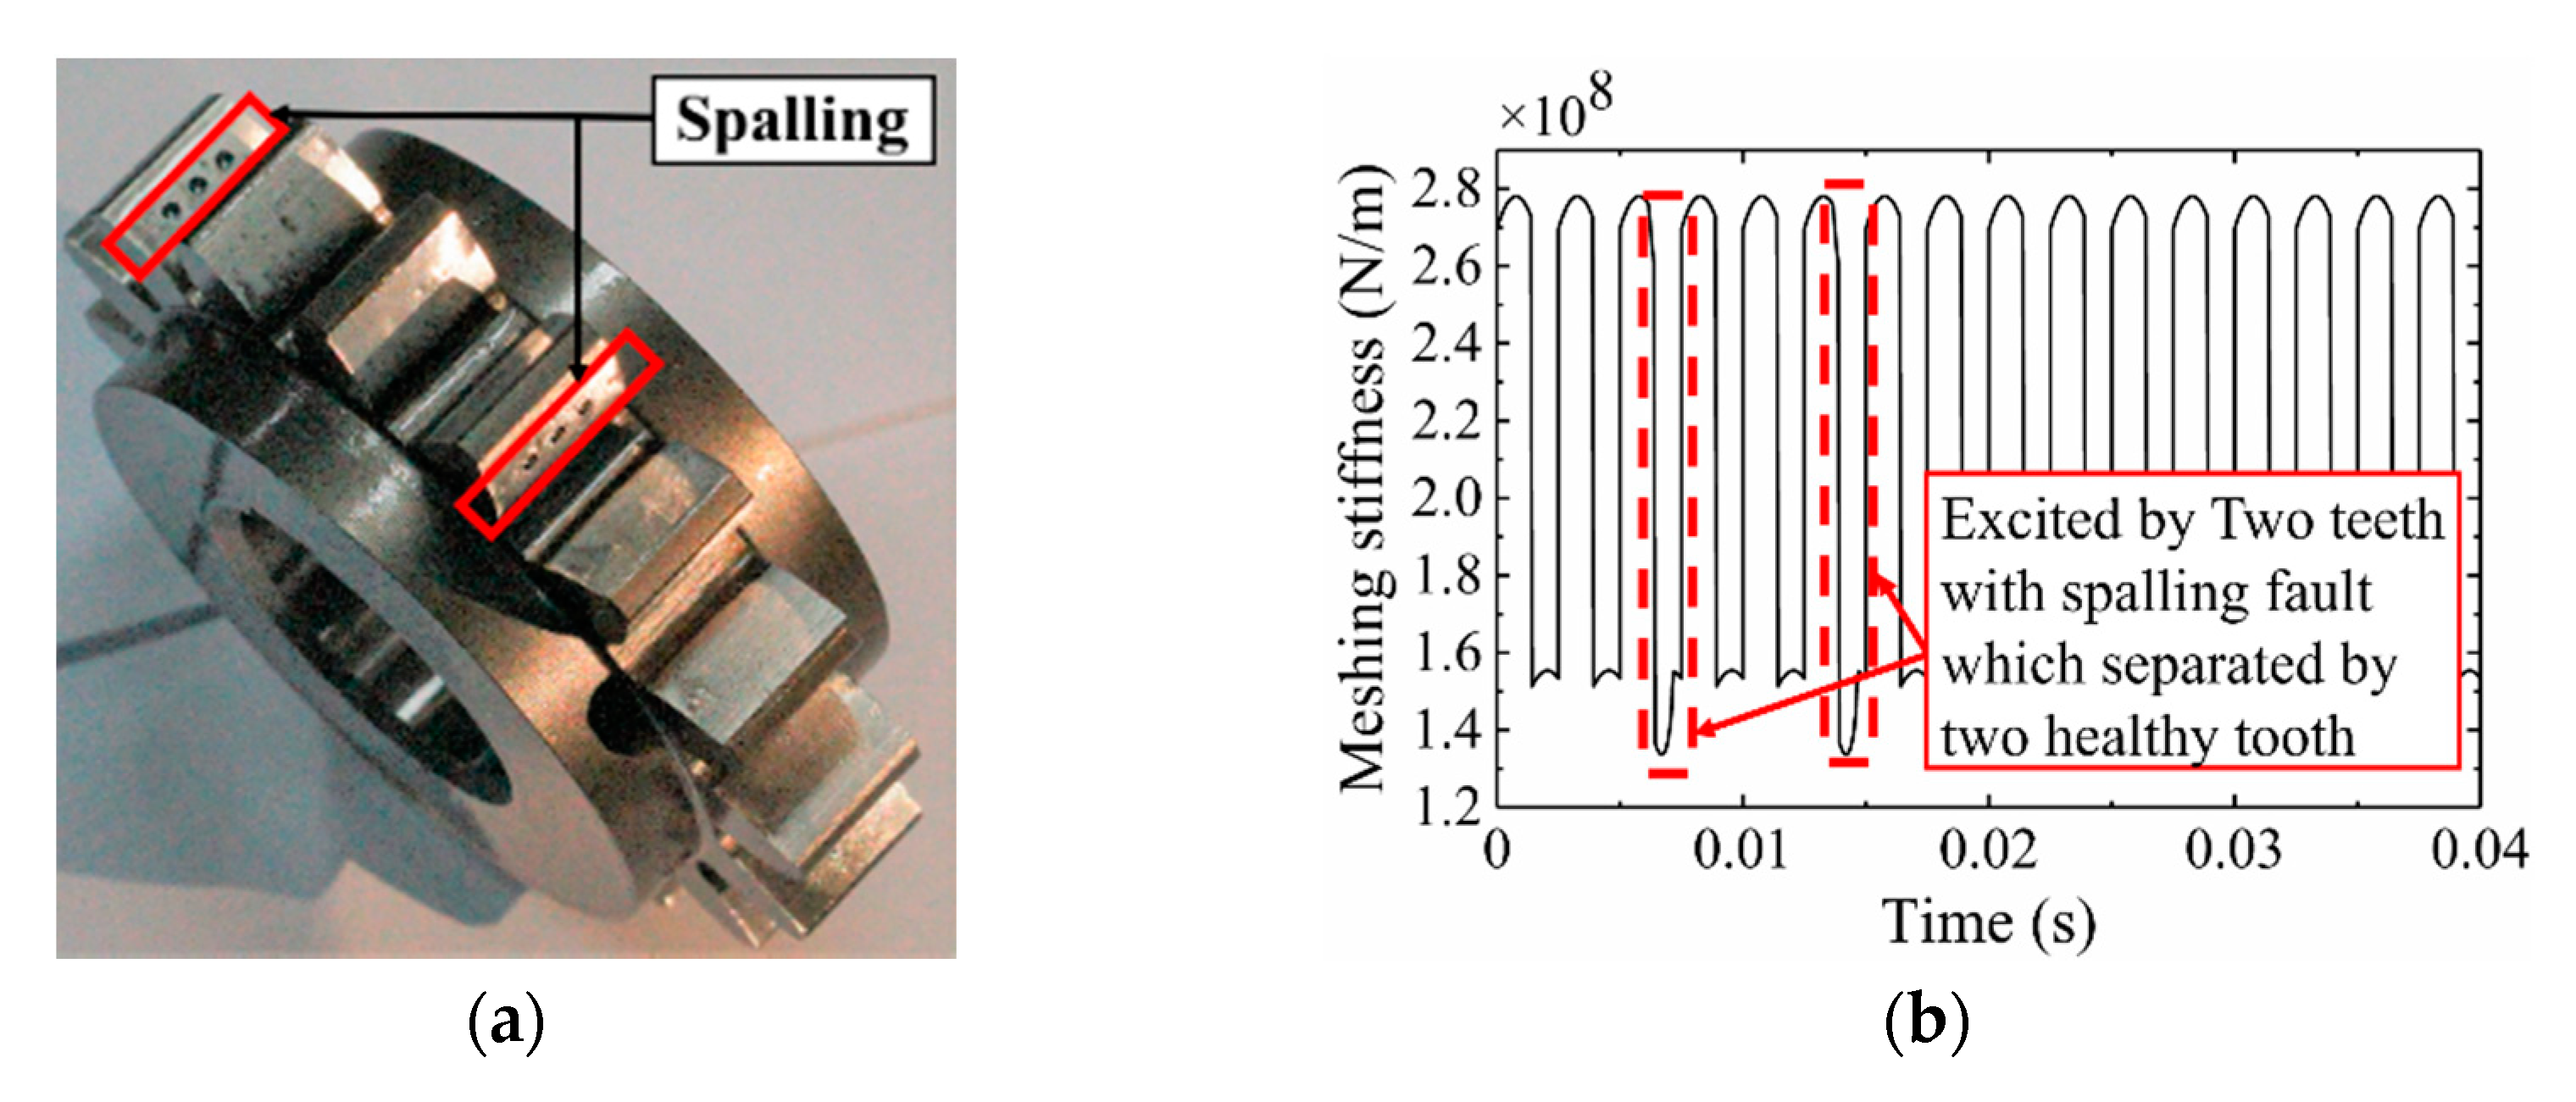
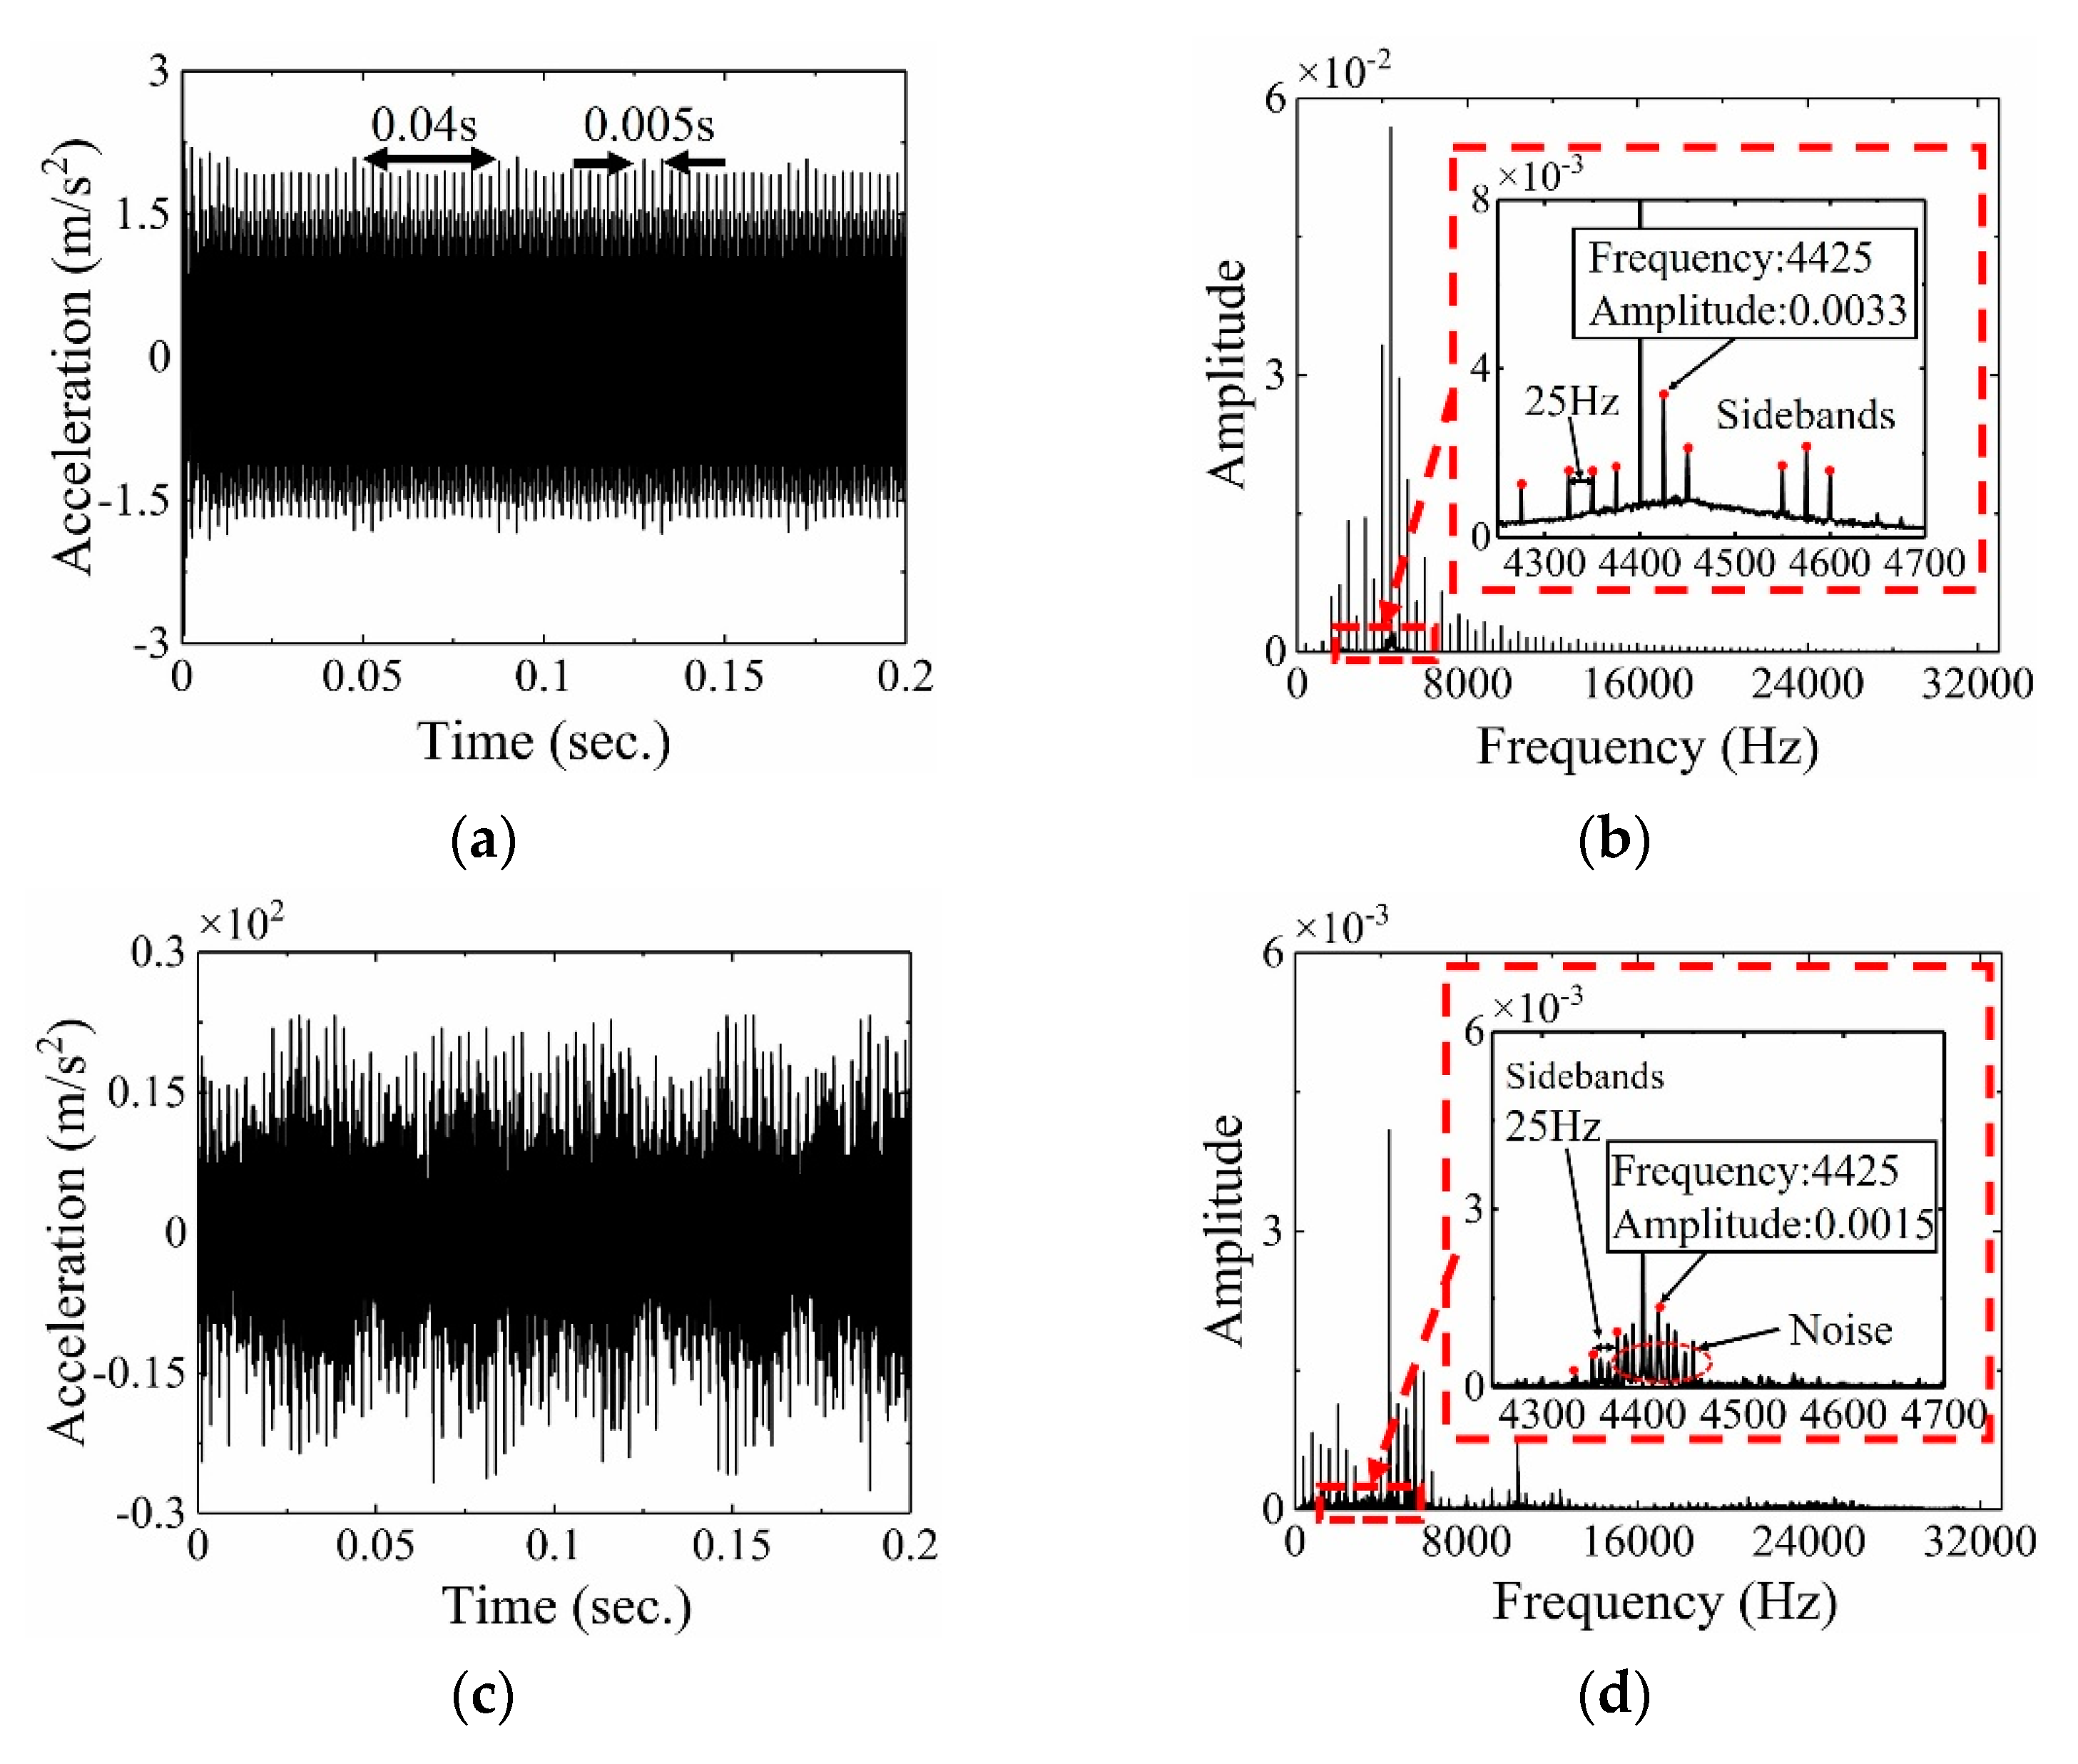
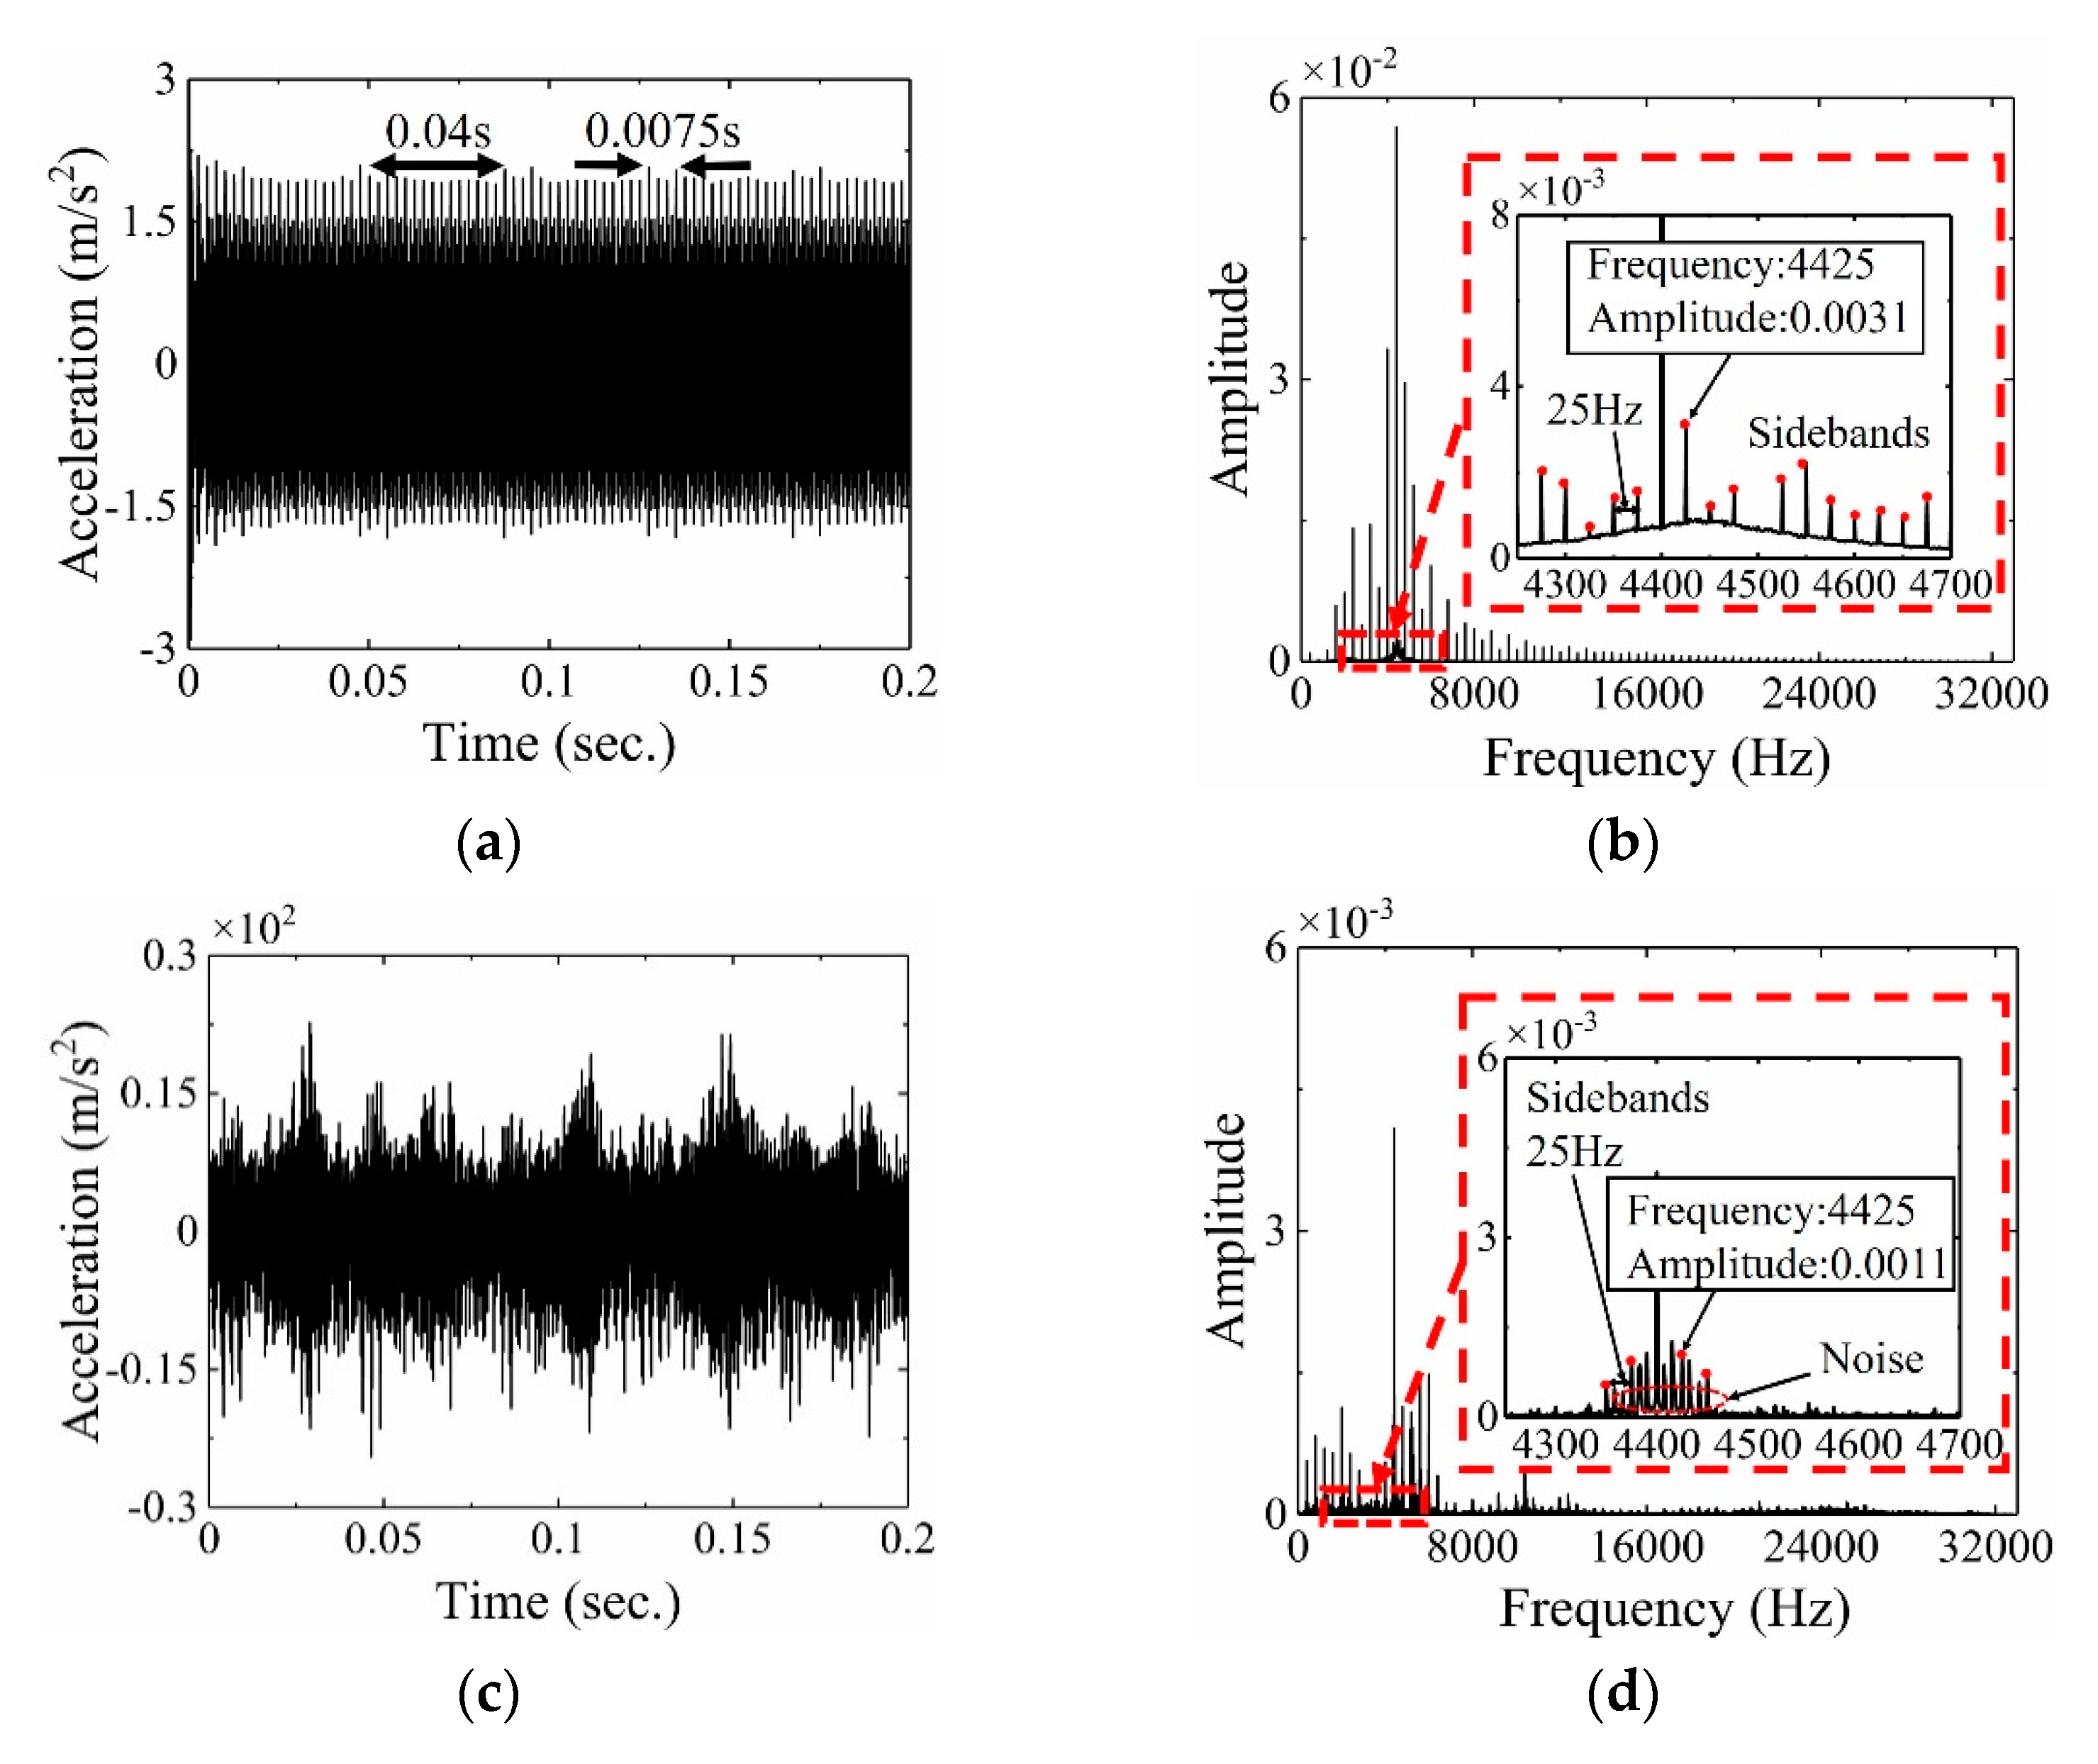
4.2. Effect of the Relative Position of the Faulty Teeth on Dynamic Characteristics of Gears

Based on the simulated and experimental parameters in Section 4.1, in this paper, we assume that the number of healthy teeth between two spalling faulty teeth is H. Three relative positions (H = 0, H = 1, and H = 2) of the two faulty teeth are considered. Figure 13a, Figure 14a, and Figure 15a show the failure states of tooth surface spalling in three relative positions. Furthermore, when the two spalling fault teeth are meshed separately, the mesh stiffness decreases, and the interval time of the reductions is related to the number of healthy teeth between the two spalling fault teeth, as shown in Figure 14b and Figure 15b.
The simulated and experimental signals both in time and frequency domain at the three relative positions of the double faulty teeth are presented in Figure 12, Figure 15 and Figure 16. As shown in Figure 12a, Figure 15a and Figure 16a, impulse vibration excited twice in one rotational period of the pinion. In addition, the distance between two impulse vibrations are 0.0025 s, 0.005 s, and 0.0075 s, which can be expressed by (H + 1)tm. However, the impulse vibration is not clear in Figure 12c, Figure 15c and Figure 16c. One possible explanation is that these features are submerged by the background noise in the experimental signal.
Moreover, as presented in Figure 12d, Figure 15d and Figure 16d, the maximum amplitudes of the sidebands at the three relative positions are 0.0019 m/s2, 0.0015 m/s2, and 0.0011 m/s2, respectively. Among them, the amplitude of the sidebands at the adjacent positions is the highest, which is close to the simulated results. It can be concluded that, when the two teeth with spalling fault are adjacent, the features of the spalling fault are the most clear. In addition, compared with Figure 15b and Figure 15d, as well as Figure 16b and Figure 16d, the strong background noise in the experimental signal also affects the identification of fault features, and then affects the accuracy of the verification results of the dynamic model and experimental signal.

5. Background Noise Elimination Method

As mentioned in Section 4, the periodic impulse of the experimental signal caused by the fault is submerged by the background noise, and the corresponding fault feature frequencies are difficult to identify in the frequency domain. In this section, a novel parameter-adaptive variational mode decomposition method is proposed to eliminate the background noise, while avoiding the disadvantage of choosing decomposed parameters manually by human experience in VMD.

5.1. The Principle of ALO-VMD Method

5.1.1. VMD Method

VMD is an adaptive signal decomposition method, which can adaptively decompose signals into a series of components with a separate property. The essence of VMD is to effectively solve the constrained variational problems, as described below.
{ min { u k } , { ω k } { k t [ ( δ ( t ) + j π t ) u k ( t ) ] e j ω k 2 2 } s . t . k u k = f
where uk is the k-th signal component, and ωk is the corresponding center-frequency of the k-th signal component.
By adding Lagrangian multiplier λ and penalty factor â into Equation (20), the constrained variational problem is rewritten as Equation (21).
L ( { u k } ,   { ω k } ,   λ ) = α ^ k t [ ( δ ( t ) + j π t ) u k ( t ) ] e j ω k 2 2 + f ( t ) k u k ( t ) 2 2 + λ ( t ) , f ( t ) k u k ( t )
Equation (21) can be processed by the alternate direction method of multipliers (ADMM) [24]. Subsequently, the signal components μ ^ k and its corresponding center-frequencies ω k are updated by Equations (22) and (23).
u ^ k n + 1 ( ω ) = f ^ ( ω ) i < k u ^ i n + 1 ( ω ) i > k u ^ i n ( ω ) + λ n ( ω ) 2 1 + 2 α ^ ( ω ω k n ) 2
ω k n = 1 = 0 ω | u ^ k n + 1 ( ω ) | 2 d ω 0 | u ^ k n + 1 ( ω ) | 2 d ω
After each updating, the Lagrangian multiplier λ is also replaced by Equation (24).
λ ^ n + 1 ( ω ) = λ ^ n ( ω ) + τ ( f ^ ( ω ) k u ^ i n + 1 ( ω ) )
The above process is updated repeatedly until the stop conditions are met, as shown in the equation below.
k u ^ k n + 1 u ^ k n 2 2 u ^ k n 2 2 < ε ,
where τ denotes the noise-tolerance and the tolerance of convergence criterion ε is usually set as 10−6. For more details on VMD [35].

5.1.2. Ant Lion Optimization Method

Ant lion optimization (ALO) is one of the swarm intelligence algorithms, which solves the functional optimization problem by imitating the hunting mechanism of ant lions. The principle of the ALO algorithm is introduced as below [44].
To imitate the random walk of ants inside the search space, a normalized equation is applied in Equation (26).
X i I t e r = ( X i I t e r a i ) × ( d i c i I t e r ) ( d i I t e r a i ) + c i
where ai is the minimum of random walk of the i-th variable, di is the maximum of random walk in the i-th variable, c i I t e r is the minimum of the i-th variable at the Iter-th iteration, and d i I t e r indicates the maximum of the i-th variable at the Iter-th iteration.
As mentioned in Reference [33], the random walk of ants is affected by the ant lions’ traps. This behavior can be modeled by Equations (27) and (28).
c i I t e r = A n t l i o n j I t e r + c I t e r
d i I t e r = A n t l i o n j I t e r + d I t e r
Therefore, cIter is the minimum of all the variables at the Iter-th iteration, dIter indicates the vector including the maximum of all variables at the Iter-th iteration, and A n t l i o n j I t e r shows the position of the selected j-th ant lion at the Iter-th iteration.
According to the roulette wheel, the ALO algorithm selects the fittest ant lion to catch the ants. Once the ant is in the trap, the ant lions throw the sand toward the center of the hole. The process is described mathematically by Equations (29) and (31).
c I t e r = c I t e r I
d I t e r = d I t e r I
I = { 1 I ter 0.1 I t e r max 10 γ I t e r I t e r max I t e r > 0.1 I t e r max
As such, Iter is the current iteration, Itermax is the maximum number of iterations, and γ is a constant defined based on the current iteration. The value of γ can be found in Reference [44].
Assumed by the ALO algorithm, the hunting stage is ended when the fitness value of ant is greater than that of the ant lion. To increase the probability of catching new ants, the ant lion is then expected to replace its position to the latest position of the hunted ant, as defined by Equation (32).
A n t l i o n j I t e r = A n t i I t e r
where A n t l i o n j I t e r shows the position of selected j-th ant lion at the Iter-th iteration, and A n t i I t e r indicates the position of i-th ant at the Iter-th iteration.
To maintain the best solution for the optimization process, the fittest ant lion is selected as an elite, which can affect the random walk of all ants. That is, the random walk of each ant is guided by the selected ant lion and the elite ant lion. Therefore, the average of two randomly walks are used to represent the repositioning of a given ant, which can be modeled by Equation (33).
A n t i I t e r = R A I t e r + R E I t e r 2
where R A I t e r is the random walk around the roulette wheel selected ant lion, and R E I t e r is the random walk around the elite ant lion.

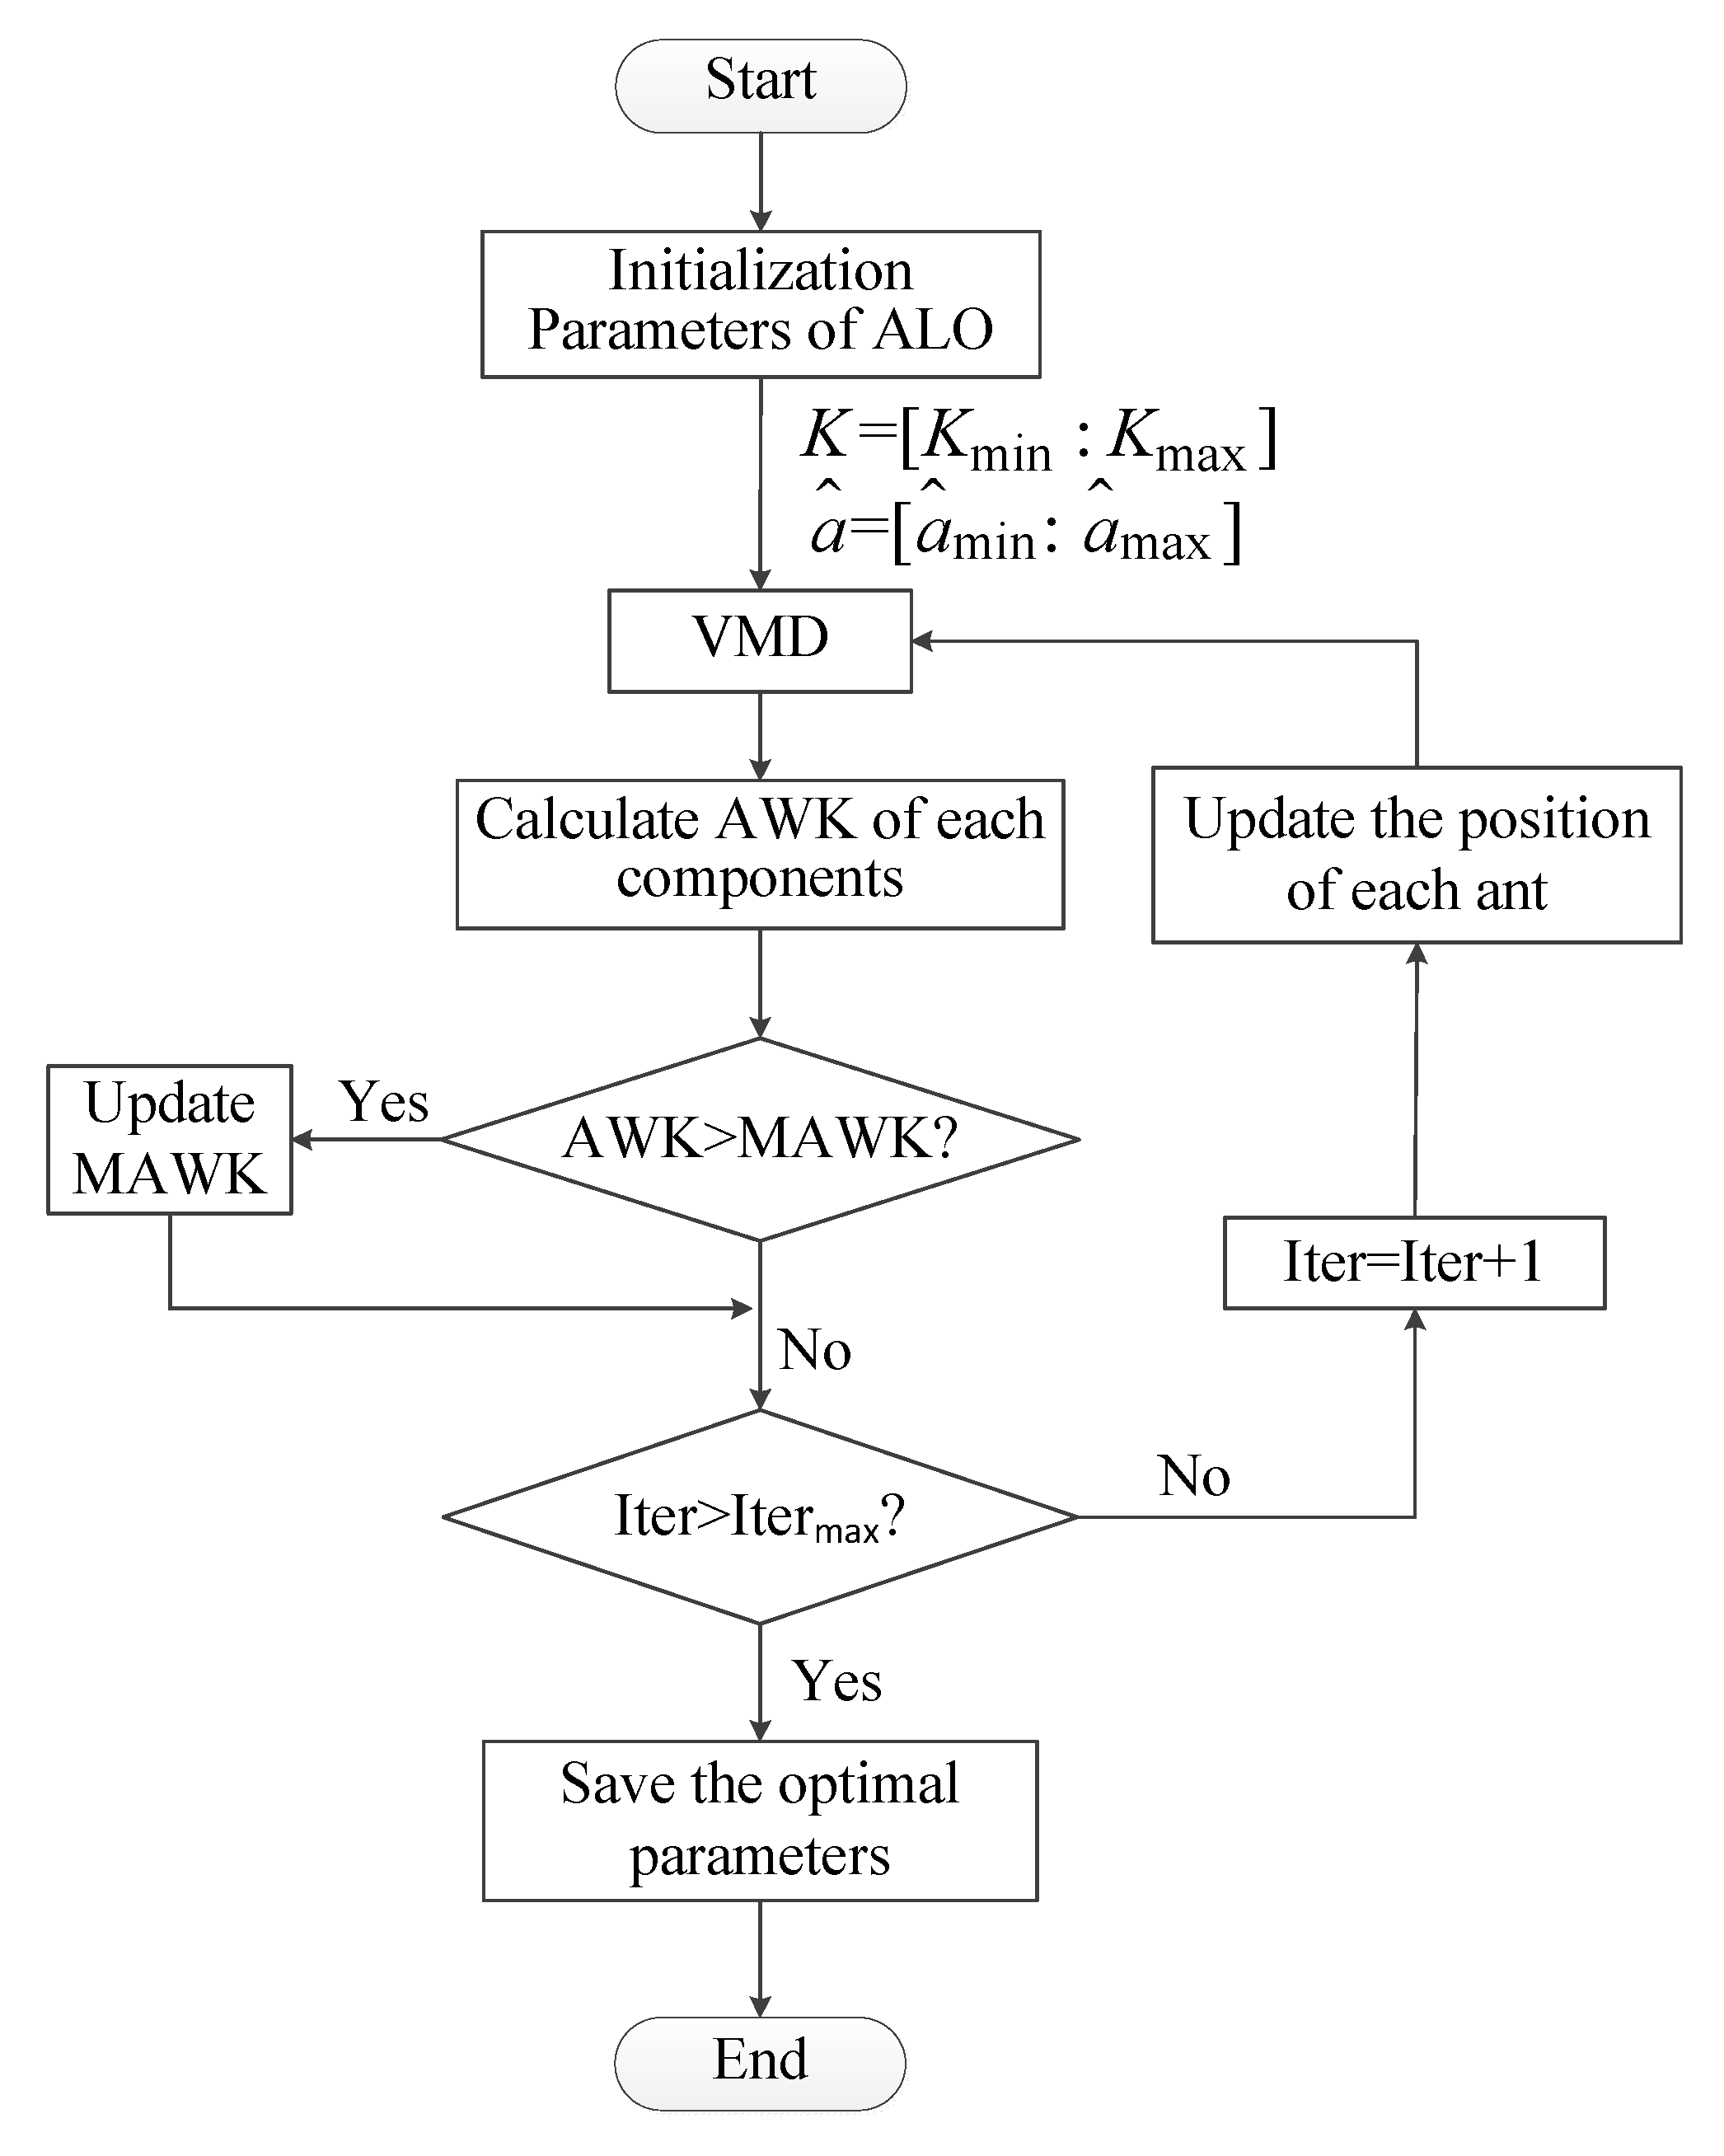
5.1.3. The Proposed ALO-VMD Method

The basic idea of the proposed ALO-VMD method is to obtain the optimal parameters (i.e., the modal component number K and penalty factors â) by the ALO algorithm, so as to ensure the decomposition capability of the VMD. As per the above discussion, a reasonable fitness function is an important factor in the ALO algorithm. To further ensure the optimal decomposition effect, the maximum average weighted kurtosis (MAWK) is setting as the fitness function in the ALO, and it is defined by the equation below.
{ f = a r g m a x { W K I i } s . t . K min K K max a ^ min a ^ a ^ max ,
where K and â is the optimal parameters. WKIi (i = 1, 2, …, K) represents the weighted kurtosis index value of the components from the VMD decomposition, which can be calculate by the equation below [51].
W K = K I · C ,
K I = ( 1 / N ) n = 0 N x 4 ( n ) [ ( 1 / N ) n = 1 N 1 x 2 ( n ) ] 2 ,
C = E [ ( x x ¯ ) ( y y ¯ ) ] E [ ( x x ¯ ) 2 ] E [ ( y y ¯ ) 2 ]
where KI is the kurtosis index of signal sequence x(n), N is the signal length, C is the correlation coefficient between signals x and y, and E(·) represents the mathematical expectation.
The flow chart of the proposed ALO-VMD method is illustrated in Figure 17. First, the initialization parameters of ALO-VMD are initialized. Second, the original signal is decomposed by the VMD method. Third, the average weighted kurtosis (AWK) value of each components is calculated and the maximum average weighted kurtosis (MAWK) is replaced if the average weighted kurtosis index value is greater than the current optimal fitness value. Finally, if the number of iterations is less than Itermax, let Iter = Iter + 1, and the positions of each ant are updated. Otherwise, the iteration ends and the optimal parameters are saved.

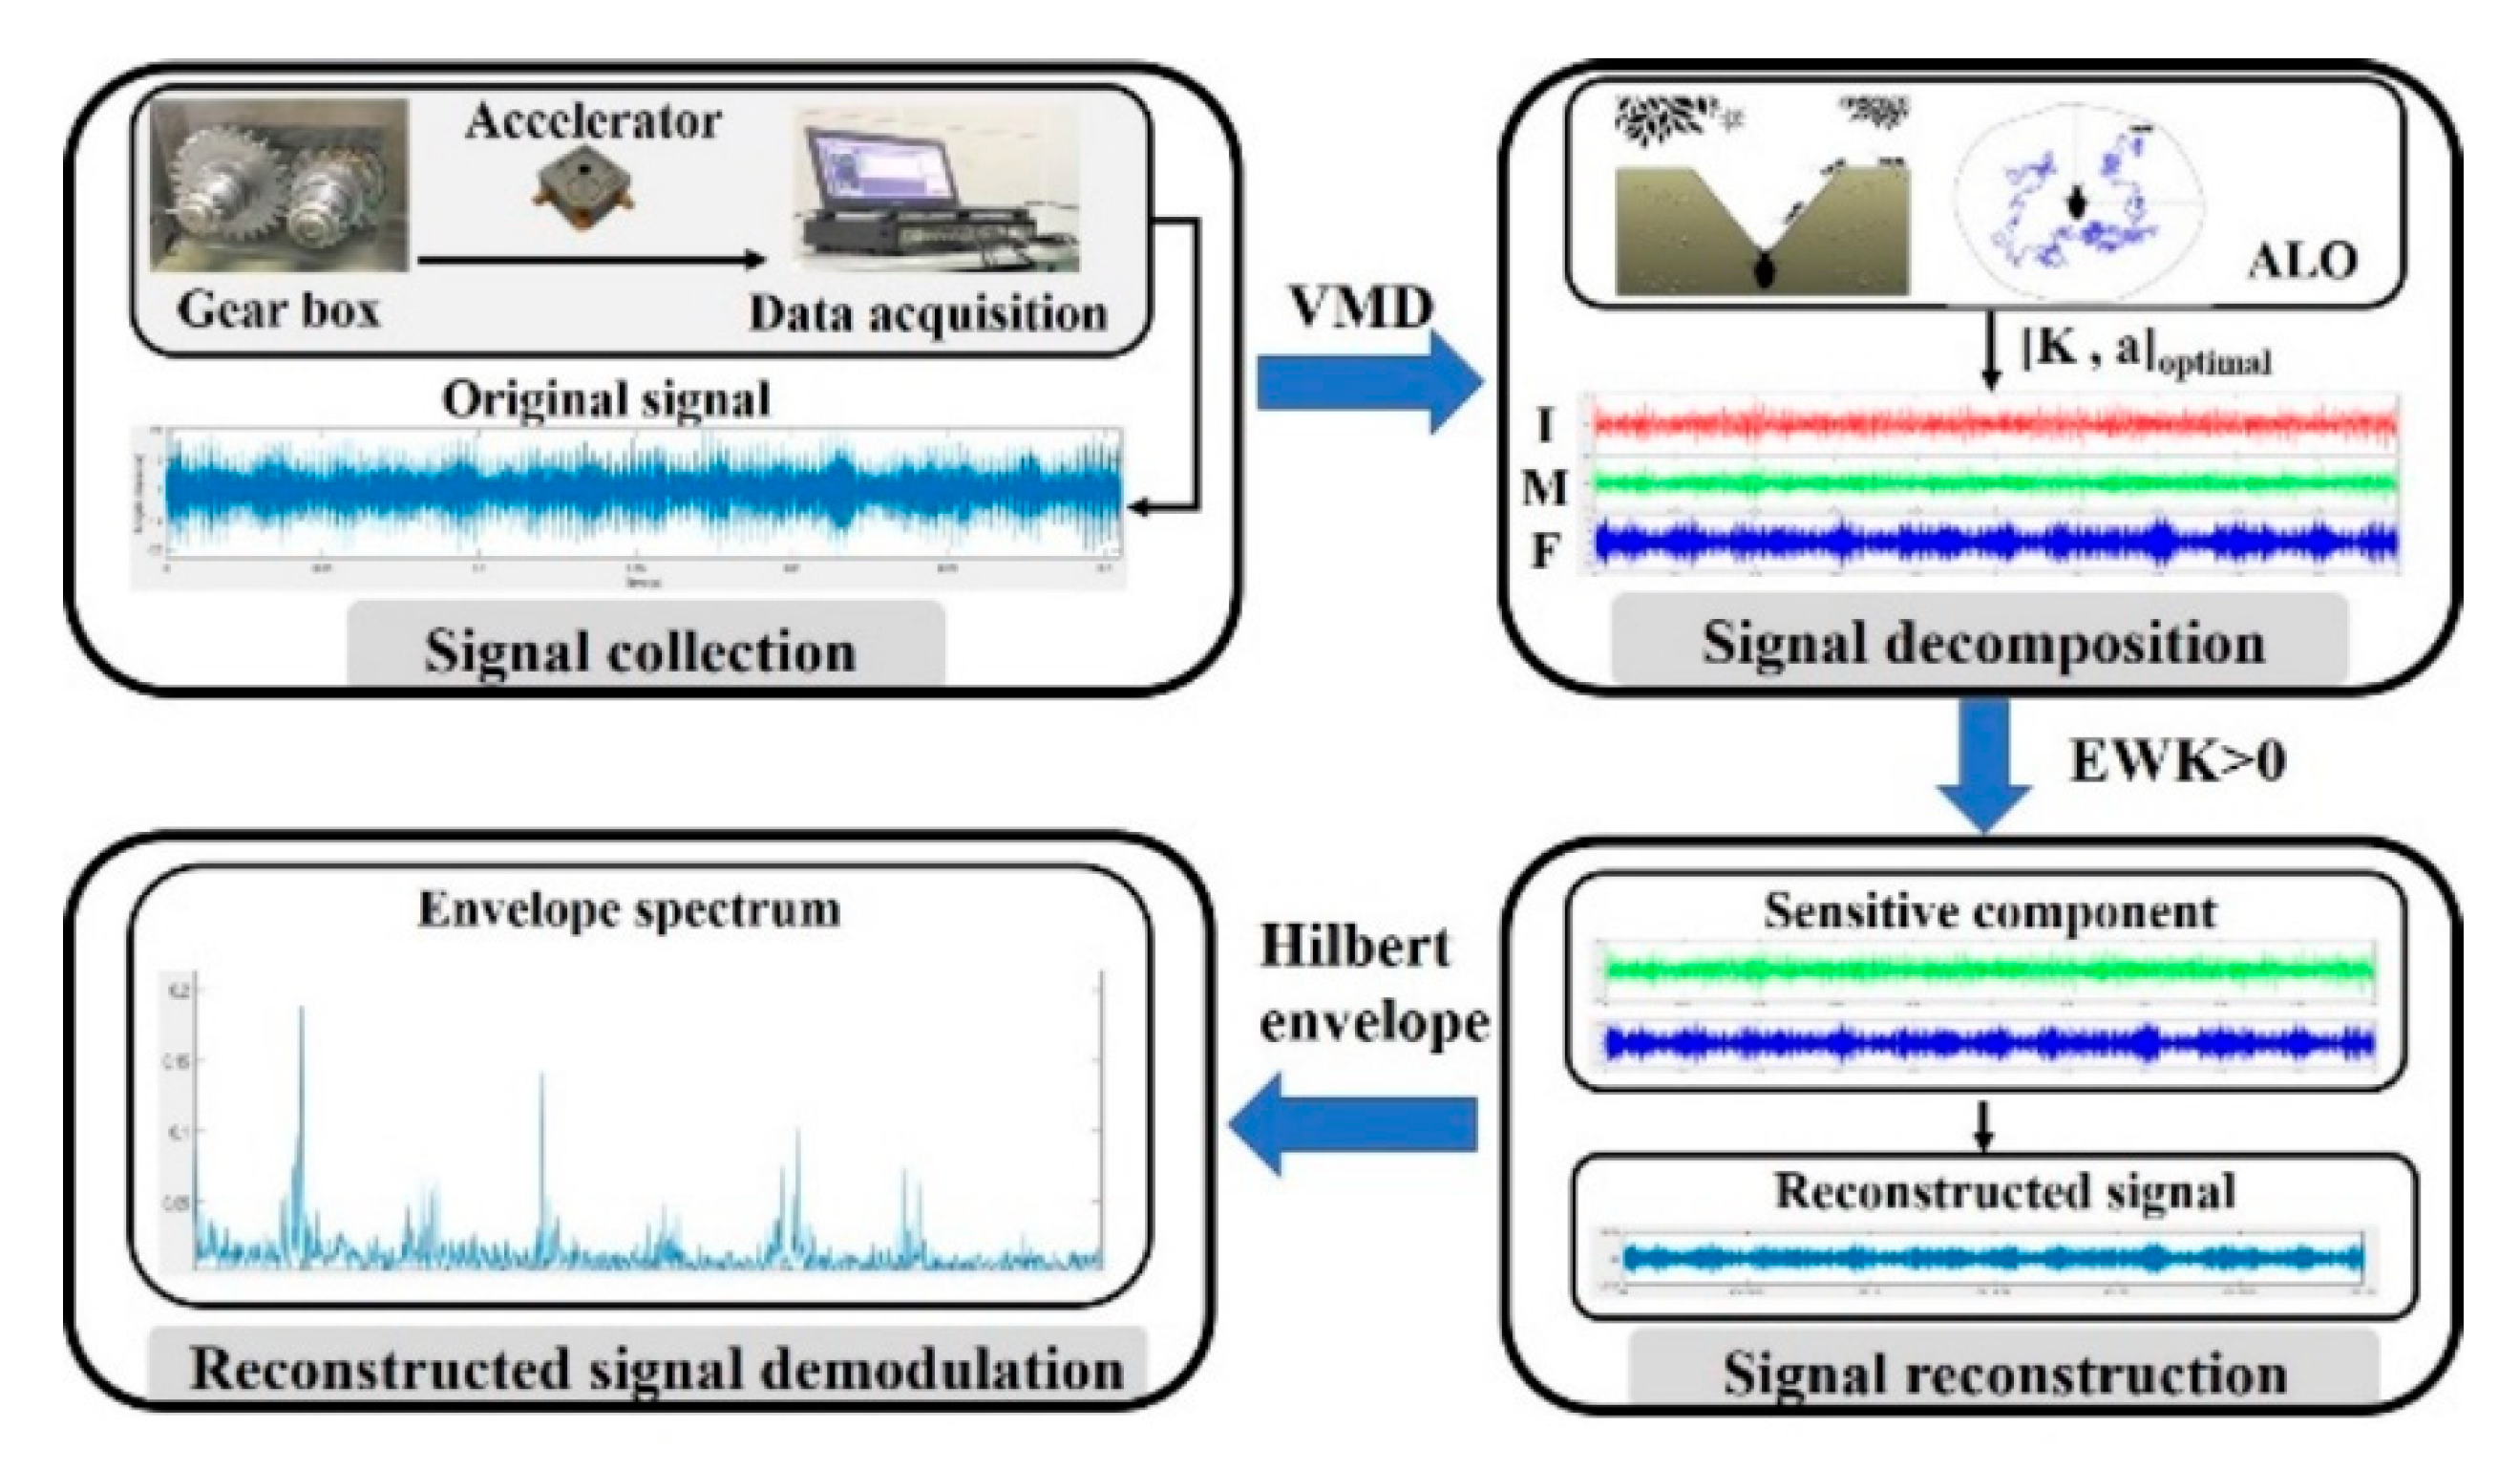
5.2. The Framework of the Background Noise Elimination Method

The framework of the feature extraction method is shown in Figure 18. It divides into four steps.
Step 1: Signal collection. Obtaining the original vibration signal by using the test rig, which is shown in Section 4.
Step 2: Signal decomposition. According to the fitness function and ALO algorithm, the optimal parameters of VMD are automatically determined. Then, the original signal is decomposed into a series of IMF components by a parameter-adaptive VMD method.
Step 3: Signal reconstruction. Combining the advantages of kurtosis index and correlation coefficient, an efficient weighted kurtosis (EWK) index is used to obtain the reconstructed signal, as shown in Equation (38). The intrinsic mode functions (IMF) component with EWK index greater than zero is selected as a sensitive component, and the rest are noisy components [52].
E W K = W K 1 K j = 1 K W K             i , j = 1   t o   K
Step 4: Reconstructed signal demodulation. The reconstructed signal is demodulated by the Hilbert envelope, and the faulty feature frequencies are detected from the envelope spectrum.

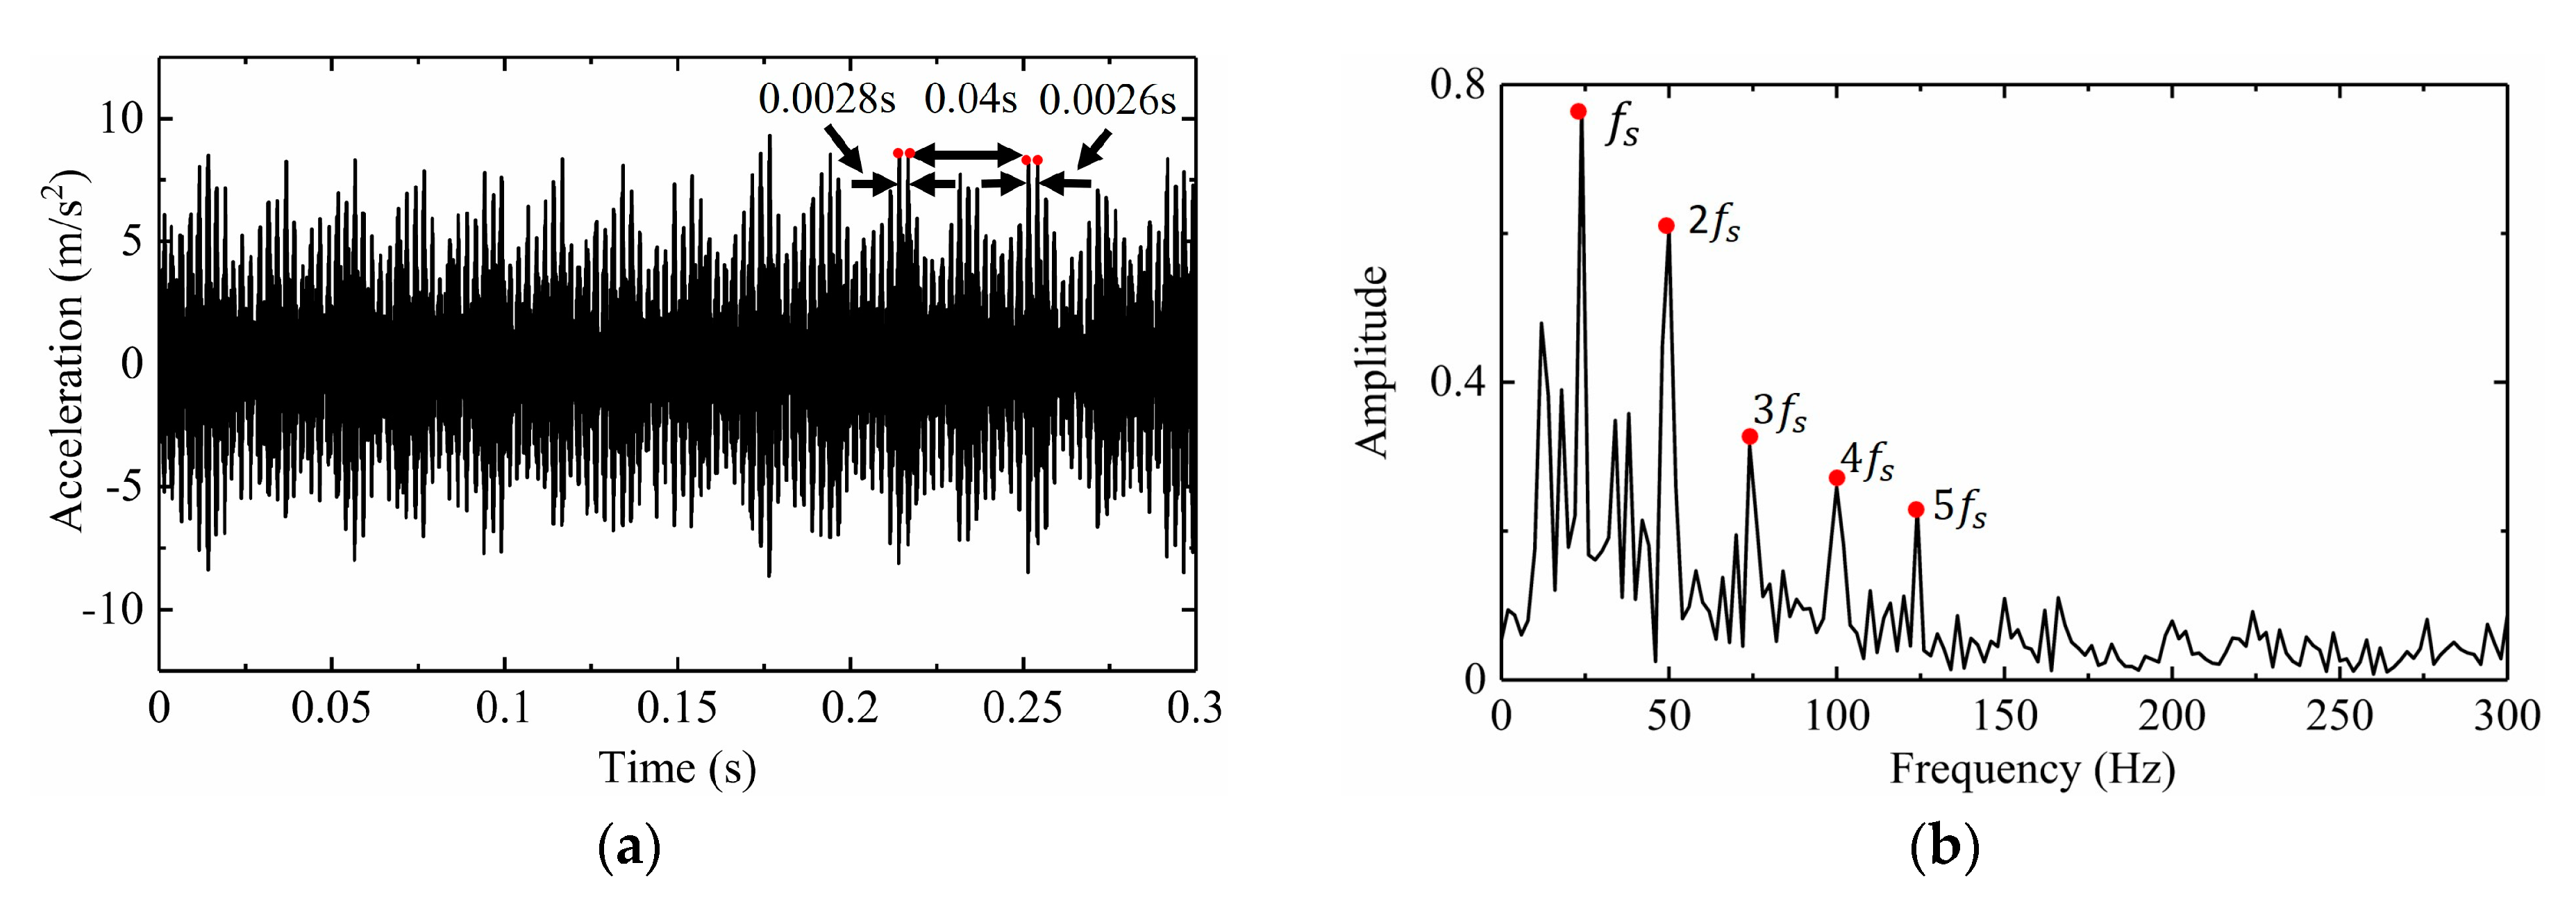
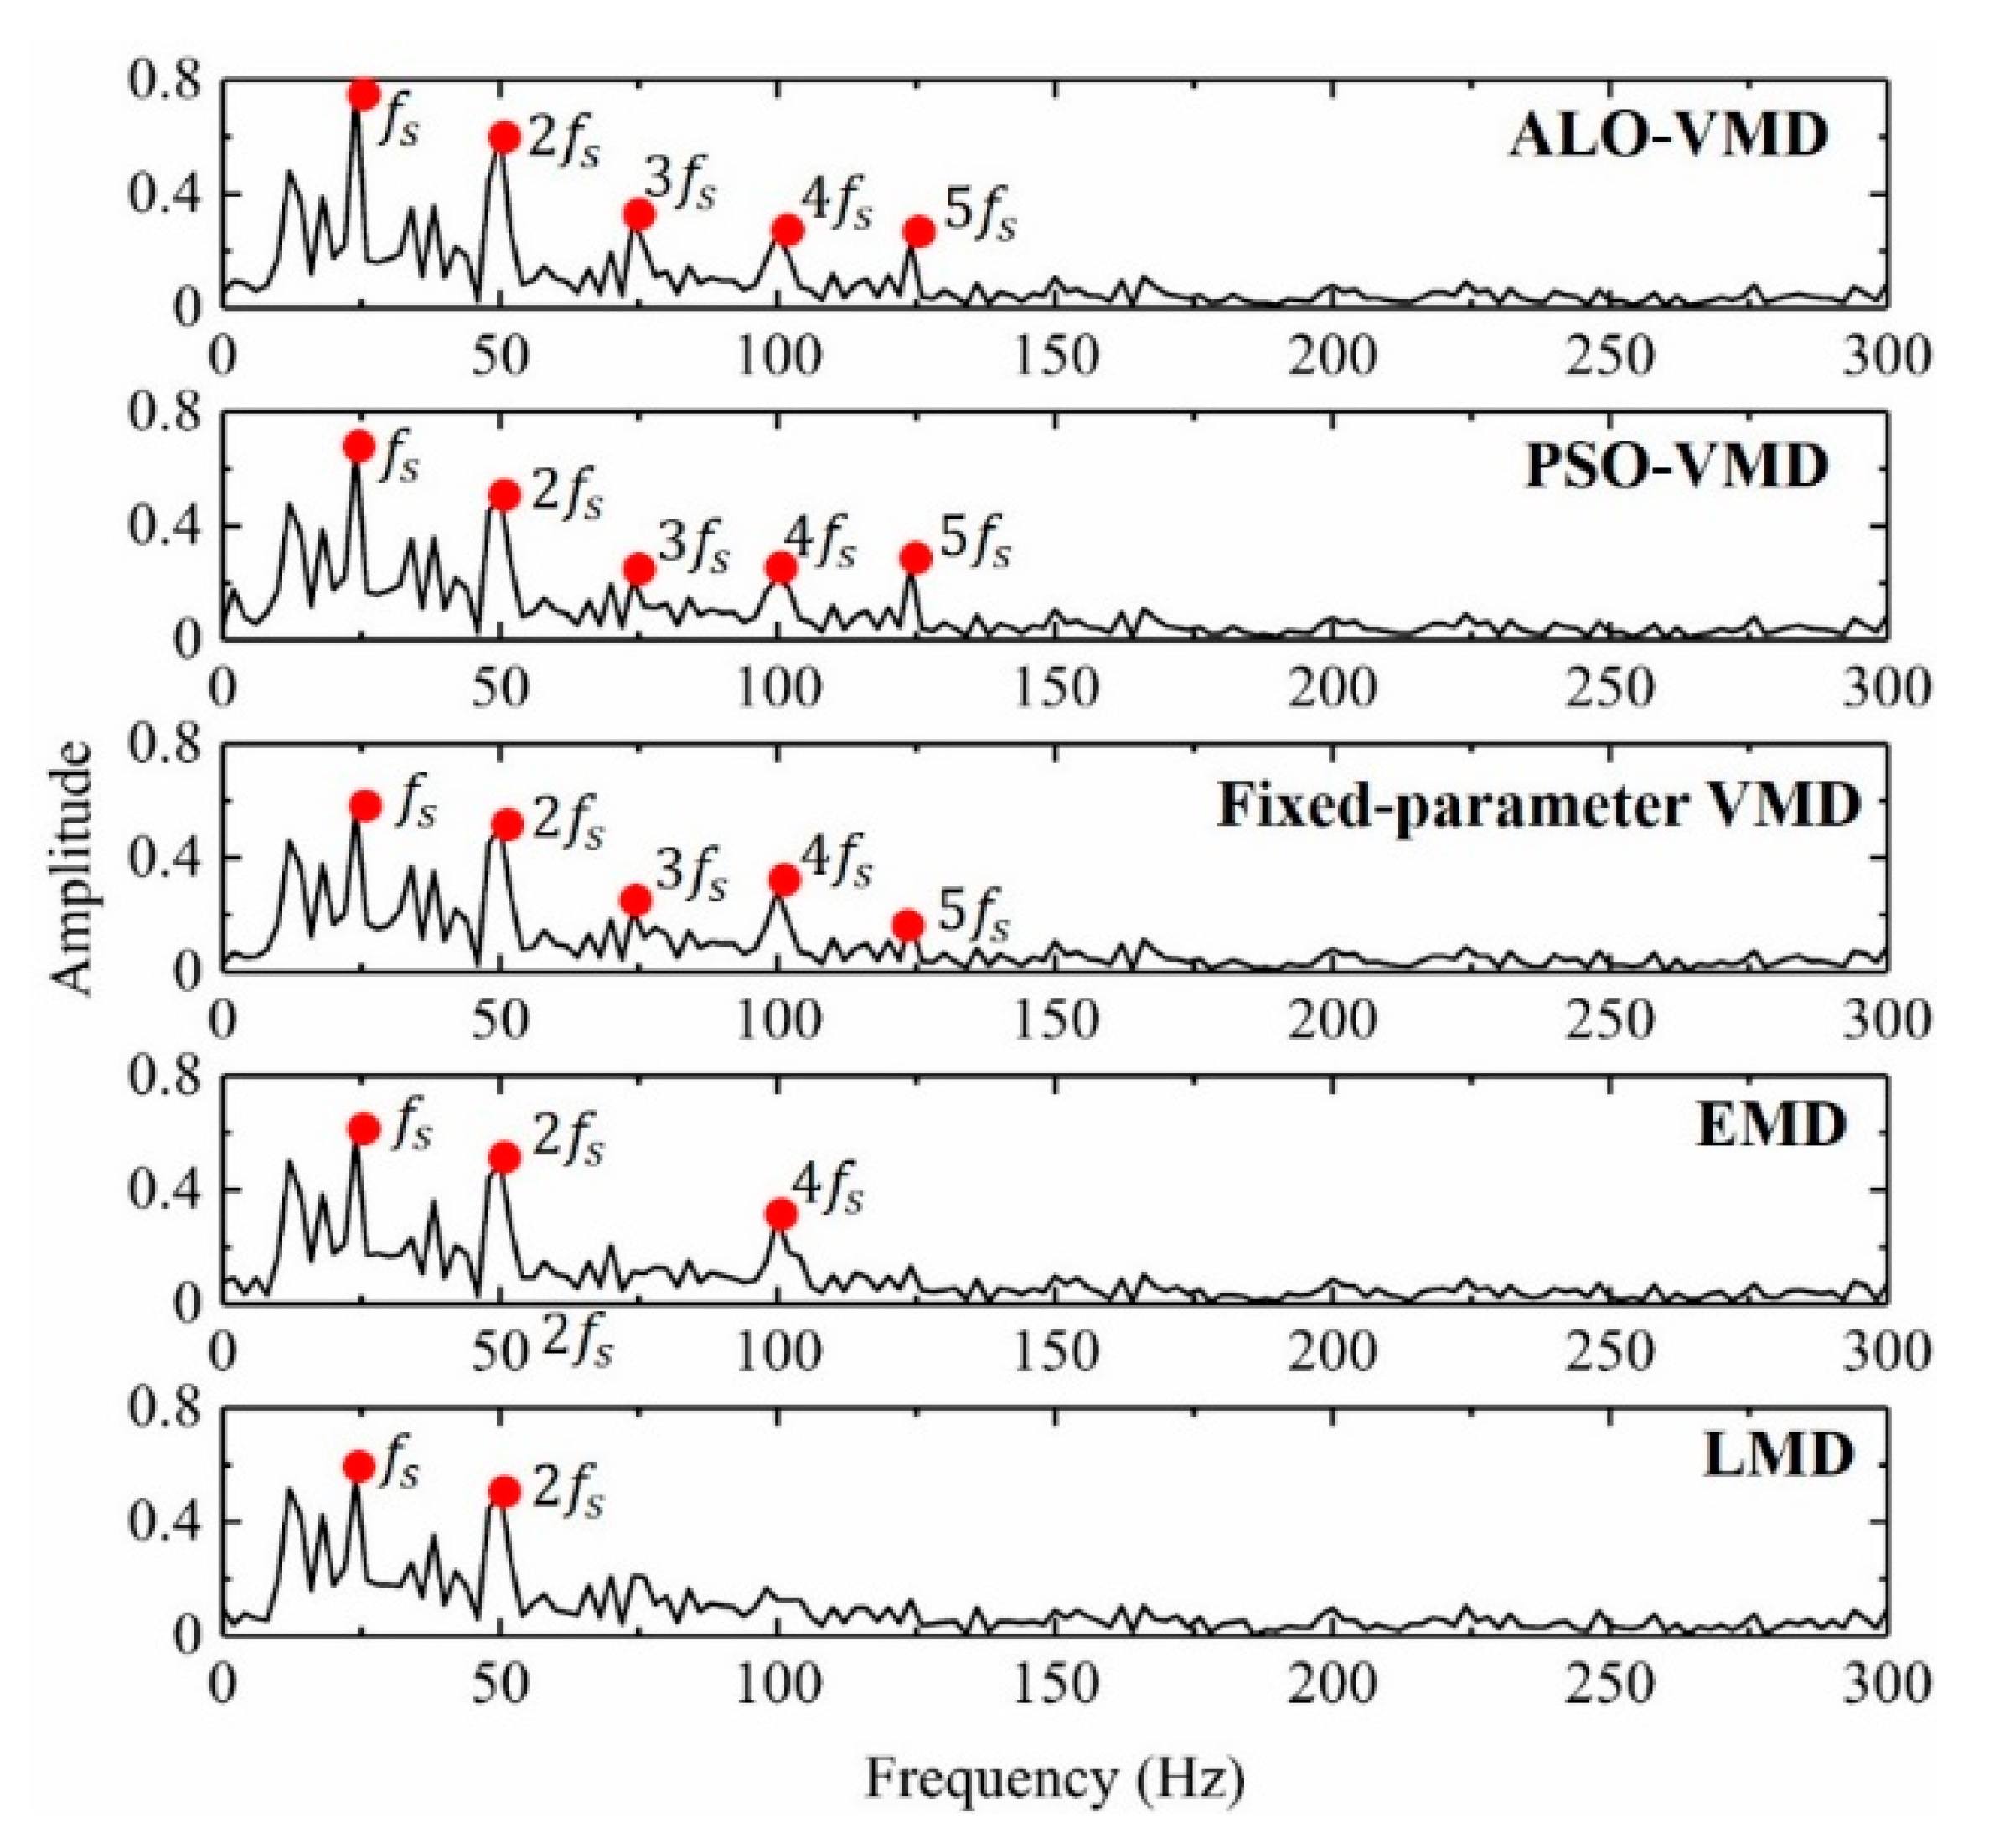
5.3. Background Elimination and Comparative Analysis

According to the conclusion given in Section 4, the double-teeth spalling fault feature are the most clear when the two teeth are adjacent. For the sake of discussion, the experimental signal when the two spalling faulty teeth are adjacent is processed, and the experimental conditions are listed in Table 2.
Due to the background noise, the periodic impulse cannot be recognized in the time-domain signal, and the faulty feature frequency is also not clear, as shown in Figure 12. In other words, the background noise in the experimental signal leads to the recognition effect of the double-teeth spalling fault feature, and then affects the accuracy of dynamic model validation. Therefore, the identification of double-teeth spalling fault feature from the noisy signal is of great significant.
First, the proposed ALO-VMD method is applied to process the experimental signal. To verify the optimization performance of ALO, the standard particle swarm optimization (PSO) is tested and compared. Here, the population of the ants is set to 30, and the maximum iterations is set to 10, the range of decomposition layer K = [2,11], and the range of penalty factor â = [50,8000]. Figure 19 and Table 3 show the comparison results of ALO and PSO. The results show that the optimum speed and optimization accuracy of the ALO algorithm is better than that of the PSO algorithm. Then, the optimal parameters K = 3 and â = 1626 are obtained by ALO.
As the result, three components and their corresponding EWK are obtained, as shown in Table 4. Since the EWK values of u1 and u2 are larger than zero, they are determined as sensitive components and selected as a reconstructed signal, while other modes are noisy modal components.
Subsequently, the reconstructed signal is demodulated by the Hilbert envelope and the envelope spectrum are shown in Figure 20. Compared with Figure 12c, the periodic impulse vibration, which was excited by the spalling fault can be clearly observed in Figure 20a. The period of the impulse vibration is 0.04 s, which is equal to the rotating period of the pinion. In addition, in a rotation period of the pinion, the impulse vibration excited twice, and the interval time of the two impulse vibrations is close to the single tooth meshing period. From the envelope spectrum, as shown in Figure 20b, the faulty feature frequency fs and its multiplications (2fs, 3fs, 4fs, and 5fs) can be clearly observed in the spectrum of the reconstructed signal. The results are consistent with the previous simulated results mentioned in Section 4, and it is demonstrated that the fault feature is extracted effectively by the proposed ALO-VMD method.
For comparisons, the PSO-VMD, the fixed-parameter VMD, the EMD, and the LMD are employed to process the same signal, and the results are displayed in Figure 21. The optimal K and â in PSO-VMD are 3 and 3580, respectively, and the K and â in the fixed-parameter VMD are set as 4 and 2000, respectively. Similar to the ALO-VMD method, the reconstructed signal of other methods is also selected according to the value of the EWK index. For clarity, the visible abscissa range of the spectrum is set to 0–300 Hz.
As shown in Figure 21, only the faulty feature frequency fs and its multiplication 2fs can be identified in the spectrums of the LMD, and three fault feature frequencies fs, 2fs, and 4fs are displayed by the EMD. In contrast, five fault frequencies are existing in the envelope spectrums of fixed-parameter VMD, PSO-VMD, and the proposed ALO-VMD. However, the amplitude of the fault frequencies shown in ALO-VMD are larger than shown in other methods.
To further evaluate the effectiveness of the five methods, two quantitative indexes, namely, the signal-noise-ratio (SNR) and the root-mean-square error (RMSE), are used [53], and described as follows.
S N R = 10 log { i = 1 N x 2 ( i ) i = 1 N ( x ( i ) x ^ ( i ) ) 2 }
R M S E = 1 N i = 1 N ( x ( i ) x ^ ( i ) ) 2
where x ( i ) is the original signal, x ^ ( i ) is the mean value of x ( i ) , and N denotes the length of signal x ( i ) .
As shown in Table 5, the signal-noise-ratio (SNR) of the reconstructed signal processed by ALO-VMD is larger than other methods, and the root-mean-square error (RMSE) of the reconstructed signal processed by ALO-VMD is smaller than other methods. It is concluded that the proposed ALO-VMD method has better performance in noise reduction for the double-teeth spalling fault than other methods.

6. Conclusions

In this paper, a dynamic model of a gear system with double-teeth spalling fault is presented with considering the influence of TVMS, transmission error, and bearing support stiffness. The effectiveness of the proposed dynamic model is validated by analyzing experimental results. The effect of the number of spalling teeth, and the relative position of the two faulty teeth are investigated. Both of the experimental tests and dynamic simulation results have shown that the double-teeth spalling fault will generate impulse vibration twice in one rotating period of the fault gear, and the interval of the two impulses is related to the number of healthy teeth, which can be expressed as (H + 1)tm. Moreover, the features of double-teeth spalling fault are significant when the two spalling teeth are adjacent.
In addition, a novel parameter-adaptive VMD method based on the ALO is proposed to eliminate the background noise from the experimental signal for ensuring the accuracy of dynamic model verification results and reducing the difficulty of fault feature analysis. The optimal parameters K and â is obtained by the ALO, and the raw signal obtained from experiments is decomposed by using the ALO-VMD. According to the EWK index, several signal components whose value is greater than zero are summed as a reconstructed signal. The reconstructed signal is then demodulated by the Hilbert envelope, and the fault features are analyzed by the envelope spectrum. The results confirm that, (1) the ALO has a good optimization ability and can provide the VMD with the optimal parameters K and â, (2) by comparing with the PSO-VMD, fixed-parameter VMD, EMD, and LMD, it can be found that the proposed ALO-VMD method is more effective in eliminating the noise than other methods.
Compared with References [19,22,23], the effect of tooth fillet foundation deflection is not considered in the proposed gear model. As reported in Reference [54], an equation for the fillet foundation deflection is valid only when the normal stress at the tooth root is linearly distributed and confined usable for large gears. However, due to the limitation of experimental conditions, the width of the fillet foundation is greater than that of teeth of the spalling pinion in this paper. This may be a limitation of the proposed model that needs to be further studied. Moreover, the spalling effects of random distribution are also worthy of further investigation.

Author Contributions

Methodology, Validation, Writing—original draft, L.S. Conceptualization, J.W. Funding acquisition, B.P. Writing—review and editing, J.W. and Y.X. Resources, Q.Z. Software, C.L. All authors have read and agreed to the published version of the manuscript.

Funding

This research was funded by the National Natural Science Foundation of China (Grant 51475425).

Acknowledgments

The authors sincerely thank Shuanghuan Driveline Co., Ltd. for providing the necessary facilities and machinery to build the prototype of the gear system.

Conflicts of Interest

The authors declare no conflict of interest.

References

  1. Kumar, A.; Gandhi, C.P.; Zhou, Y.; Kumar, R.; Xiang, J. Latest developments in gear defect diagnosis and prognosis: A review. Measurement 2020, 158, 107735. [Google Scholar] [CrossRef]
  2. Davidson, T.; Ku, P. The effect of lubricants on gear tooth surface fatigue. ASLE Trans. 1958, 1, 40–50. [Google Scholar] [CrossRef]
  3. Chen, Z.; Zhai, W.; Wang, K. Locomotive dynamic performance under traction/braking conditions considering effect of gear transmissions. Veh. Syst. Dyn. 2018, 56, 1097–1117. [Google Scholar] [CrossRef]
  4. Feng, K.; Borghesani, P.; Smith, W.A.; Randall, R.B.; Chin, Z.Y.; Ren, J.; Peng, Z. Vibration-based updating of wear prediction for spur gears. Wear 2019, 426, 1410–1415. [Google Scholar] [CrossRef]
  5. Weibring, M.; Gondecki, L.; Tenberge, P. Simulation of fatigue failure on tooth flanks in consideration of pitting initiation and growth. Tribol. Int. 2019, 131, 299–307. [Google Scholar] [CrossRef]
  6. Zhang, Z.; Li, S.; Wang, J.; Xin, Y.; Jiang, X. Enhanced sparse filtering with strong noise adaptability and its application on rotating machinery fault diagnosis. Neurocomputing 2020, 398, 31–44. [Google Scholar] [CrossRef]
  7. Zeman, J. Dynamische Zusatzkrafter in Zahnbradgetrieben. Z. Ver. Dtsch. Ingiere 1957, 9, 244. [Google Scholar]
  8. Harris, S.L. Dynamic loads on the teeth of spur gears. Proc. Inst. Mech. Eng. 1958, 172, 87–112. [Google Scholar] [CrossRef]
  9. Tobe, T. Dynamic loads on spur gear teeth. Bull. JSME 1961, 4, 417–422. [Google Scholar] [CrossRef]
  10. Johnson, D. Modes and frequencies of shafts coupled by straight spur gears. J. Mech. Eng. Sci. 1962, 4, 241–250. [Google Scholar] [CrossRef]
  11. Kohler, H.; Pratt, A.; Thompson, A. Paper 14: Dynamics and Noise of Parallel-Axis Gearing. In Proceedings of the Institution of Mechanical Engineers, Conference Proceedings; SAGE Publications Sage UK: London, UK, 1969; pp. 111–121. [Google Scholar]
  12. Wu, S.; Zuo, M.J.; Parey, A. Simulation of spur gear dynamics and estimation of fault growth. J. Sound Vib. 2008, 317, 608–624. [Google Scholar] [CrossRef]
  13. Kahraman, A.; Blankenship, G.W. Experiments on nonlinear dynamic behavior of an oscillator with clearance and periodically time-varying parameters. J. Appl. Mech. 1997, 64, 217–226. [Google Scholar] [CrossRef]
  14. Mohammed, O.D.; Rantatalo, M.; Aidanpää, J.-O. Dynamic modelling of a one-stage spur gear system and vibration-based tooth crack detection analysis. Mech. Syst. Signal Process. 2015, 54, 293–305. [Google Scholar] [CrossRef]
  15. Ren, F.; Luo, G.; Shi, G.; Wu, X.; Wang, N. Influence of manufacturing errors on dynamic floating characteristics for herringbone planetary gears. Nonlinear Dyn. 2018, 93, 361–372. [Google Scholar] [CrossRef]
  16. Ding, Y.; Rieger, N.F. Spalling formation mechanism for gears. Wear 2003, 254, 1307–1317. [Google Scholar] [CrossRef]
  17. Liang, X.; Zuo, M.J.; Feng, Z. Dynamic modeling of gearbox faults: A review. Mech. Syst. Signal Process. 2018, 98, 852–876. [Google Scholar] [CrossRef]
  18. Ma, H.; Li, Z.; Feng, M.; Feng, R.; Wen, B. Time-varying mesh stiffness calculation of spur gears with spalling defect. Eng. Fail. Anal. 2016, 66, 166–176. [Google Scholar] [CrossRef]
  19. Saxena, A.; Parey, A.; Chouksey, M. Time varying mesh stiffness calculation of spur gear pair considering sliding friction and spalling defects. Eng. Fail. Anal. 2016, 70, 200–211. [Google Scholar] [CrossRef]
  20. Liang, X.; Zhang, H.; Liu, L.; Zuo, M.J. The influence of tooth pitting on the mesh stiffness of a pair of external spur gears. Mech. Mach. Theory 2016, 106, 1–15. [Google Scholar] [CrossRef]
  21. Luo, Y.; Baddour, N.; Han, G.; Jiang, F.; Liang, M. Evaluation of the time-varying mesh stiffness for gears with tooth spalls with curved-bottom features. Eng. Fail. Anal. 2018, 92, 430–442. [Google Scholar] [CrossRef]
  22. Chen, T.; Wang, Y.; Chen, Z. A novel distribution model of multiple teeth pits for evaluating time-varying mesh stiffness of external spur gears. Mech. Syst. Signal Process. 2019, 129, 479–501. [Google Scholar] [CrossRef]
  23. Luo, Y.; Baddour, N.; Liang, M. Dynamical modeling and experimental validation for tooth pitting and spalling in spur gears. Mech. Syst. Signal Process. 2019, 119, 155–181. [Google Scholar] [CrossRef]
  24. Abouel-seoud, S.A.; Dyab, E.S.; Elmorsy, M.S. Influence of tooth pitting and cracking on gear meshing stiffness and dynamic response of wind turbine gearbox. Int. J. Sci. Adv. Technol. 2012, 2, 151–165. [Google Scholar]
  25. Jiang, H.; Shao, Y.; Mechefske, C.K. Dynamic characteristics of helical gears under sliding friction with spalling defect. Eng. Fail. Anal. 2014, 39, 92–107. [Google Scholar] [CrossRef]
  26. Totten, G.E. ASM Handbook, Volume 18: Friction, Lubrication, and Wear Technology; ASM International: Cleveland, OH, USA, 1992. [Google Scholar]
  27. Tan, C.K.; Irving, P.; Mba, D. A comparative experimental study on the diagnostic and prognostic capabilities of acoustics emission, vibration and spectrometric oil analysis for spur gears. Mech. Syst. Signal Process. 2007, 21, 208–233. [Google Scholar] [CrossRef] [Green Version]
  28. Liang, X.H.; Liu, Z.L.; Pan, J.; Zuo, M.J. Spur Gear Tooth Pitting Propagation Assessment Using Model-based Analysis. Chin. J. Mech. Eng. 2017, 30, 1369–1382. [Google Scholar] [CrossRef] [Green Version]
  29. Prabhakar, S.; Sekhar, A.S.; Mohanty, A.R. Detection and Monitoring of Cracks in a Rotor-Bearing System Using Wavelet Transforms. Mech. Syst. Signal Process. 2001, 15, 447–450. [Google Scholar] [CrossRef]
  30. Liang, P.; Deng, C.; Wu, J.; Yang, Z.; Zhu, J.; Zhang, Z. Compound fault diagnosis of gearboxes via multi-label convolutional neural network and wavelet transform. Comput. Ind. 2019, 113, 103132. [Google Scholar] [CrossRef]
  31. Huang, N.E.; Shen, Z.; Long, S.R.; Wu, M.C.; Shih, H.H.; Zheng, Q.; Yen, N.-C.; Tung, C.C.; Liu, H.H. The empirical mode decomposition and the Hilbert spectrum for nonlinear and non-stationary time series analysis. Proc. R. Soc. Lond. Ser. A Math. Phys. Eng. Sci. 1998, 454, 903–995. [Google Scholar] [CrossRef]
  32. Rai, A.; Upadhyay, S.H. Bearing performance degradation assessment based on a combination of empirical mode decomposition and k-medoids clustering. Mech. Syst. Signal Process. 2017, 93, 16–29. [Google Scholar] [CrossRef]
  33. Smith, J.S. The local mean decomposition and its application to EEG perception data. J. R. Soc. Interface 2005, 2, 443–454. [Google Scholar] [CrossRef] [PubMed]
  34. Liu, Z.; He, Z.; Guo, W.; Tang, Z. A hybrid fault diagnosis method based on second generation wavelet de-noising and local mean decomposition for rotating machinery. ISA Trans. 2016, 61, 211–220. [Google Scholar] [CrossRef] [PubMed]
  35. Dragomiretskiy, K.; Zosso, D. Variational Mode Decomposition. IEEE Trans. Signal Process. 2014, 62, 531–544. [Google Scholar] [CrossRef]
  36. Wang, Y.; Liu, F.; Jiang, Z.; He, S.; Mo, Q. Complex variational mode decomposition for signal processing applications. Mech. Syst. Signal Process. 2017, 86, 75–85. [Google Scholar] [CrossRef]
  37. Wang, Y.; Markert, R. Filter bank property of variational mode decomposition and its applications. Signal Process. 2016, 120, 509–521. [Google Scholar] [CrossRef]
  38. Zhang, M.; Jiang, Z.; Feng, K. Research on variational mode decomposition in rolling bearings fault diagnosis of the multistage centrifugal pump. Mech. Syst. Signal Process. 2017, 93, 460–493. [Google Scholar] [CrossRef] [Green Version]
  39. An, X.; Zhang, F. Pedestal looseness fault diagnosis in a rotating machine based on variational mode decomposition. Proc. Inst. Mech. Eng. Part C J. Mech. Eng. Sci. 2017, 231, 2493–2502. [Google Scholar] [CrossRef]
  40. Li, Y.; Li, G.; Wei, Y.; Liu, B.; Liang, X. Health condition identification of planetary gearboxes based on variational mode decomposition and generalized composite multi-scale symbolic dynamic entropy. ISA Trans. 2018, 81, 329–341. [Google Scholar] [CrossRef]
  41. Li, Y.; Cheng, G.; Liu, C.; Chen, X. Study on planetary gear fault diagnosis based on variational mode decomposition and deep neural networks. Measurement 2018, 130, 94–104. [Google Scholar] [CrossRef]
  42. Li, F.; Li, R.; Tian, L.; Chen, L.; Liu, J. Data-driven time-frequency analysis method based on variational mode decomposition and its application to gear fault diagnosis in variable working conditions. Mech. Syst. Signal Process. 2019, 116, 462–479. [Google Scholar] [CrossRef]
  43. Li, J.; Wang, H.; Zhang, J.; Yao, X.; Zhang, Y. Impact fault detection of gearbox based on variational mode decomposition and coupled underdamped stochastic resonance. ISA Trans. 2019, 95, 320–329. [Google Scholar] [CrossRef] [PubMed]
  44. Mirjalili, S. The ant lion optimizer. Adv. Eng. Softw. 2015, 83, 80–98. [Google Scholar] [CrossRef]
  45. Ali, E.; Abd Elazim, S.; Abdelaziz, A. Ant lion optimization algorithm for renewable distributed generations. Energy 2016, 116, 445–458. [Google Scholar] [CrossRef]
  46. Kanimozhi, G.; Kumar, H. Modeling of solar cell under different conditions by Ant Lion Optimizer with LambertW function. Appl. Soft Comput. 2018, 71, 141–151. [Google Scholar]
  47. Chaari, F.; Fakhfakh, T.; Haddar, M. Analytical modelling of spur gear tooth crack and influence on gearmesh stiffness. Eur. J. Mech. A/Solids 2009, 28, 461–468. [Google Scholar] [CrossRef]
  48. Li, R.; Wang, J. Gear System Dynamics; Science Press: Beijing, China, 1997. [Google Scholar]
  49. Bartelmus, W. Mathematical modelling and computer simulations as an aid to gearbox diagnostics. Mech. Syst. Signal Process. 2001, 15, 855–871. [Google Scholar] [CrossRef]
  50. Chen, H.T.; Wu, X.L.; Qin, D.T.; Yang, J.; Zhou, Z.G. Effects of gear manufacturing error on the dynamic characteristics of planetary gear transmission system of wind turbine. Appl. Mech. Mater. 2011, 86, 518–522. [Google Scholar] [CrossRef]
  51. Zhang, X.; Miao, Q.; Zhang, H.; Wang, L. A parameter-adaptive VMD method based on grasshopper optimization algorithm to analyze vibration signals from rotating machinery. Mech. Syst. Signal Process. 2018, 108, 58–72. [Google Scholar] [CrossRef]
  52. Gu, R.; Chen, J.; Hong, R.; Wang, H.; Wu, W. Incipient fault diagnosis of rolling bearings based on adaptive variational mode decomposition and Teager energy operator. Measurement 2020, 149, 106941. [Google Scholar] [CrossRef]
  53. Wang, X.-B.; Yang, Z.-X.; Yan, X.-A. Novel particle swarm optimization-based variational mode decomposition method for the fault diagnosis of complex rotating machinery. IEEE/ASME Trans. Mechatron. 2017, 23, 68–79. [Google Scholar] [CrossRef]
  54. Sainsot and, P.; Velex, P.; Duverger, O. Contribution of gear body to tooth deflections—A new bidimensional analytical formula. J. Mech. Des. 2004, 126, 748–752. [Google Scholar] [CrossRef]
Figure 1. Schematic diagram of gear meshing.
Applsci 10 07058 g001
Figure 2. Schematic diagram of a gear tooth cantilever beam.
Applsci 10 07058 g002
Figure 3. Geometric model of the spalling tooth.
Applsci 10 07058 g003
Figure 4. Dynamic model of the six-degree of freedom gear system.
Applsci 10 07058 g004
Figure 5. Tooth error and base pitch error [50].
Applsci 10 07058 g005
Figure 6. The gear test-rig.
Applsci 10 07058 g006
Figure 7. Status of tooth surface and mesh stiffness curves (healthy pinion): (a) status of tooth surface and (b) mesh stiffness curves.
Applsci 10 07058 g007
Figure 8. Status of tooth surface and mesh stiffness curves (single tooth with spalling fault): (a) status of tooth surface and (b) mesh stiffness curves.
Applsci 10 07058 g008
Figure 9. Status of tooth surface and mesh stiffness curves (adjacent teeth with spalling fault): (a) status of tooth surface and (b) mesh stiffness curves.
Applsci 10 07058 g009
Figure 10. The simulated and experimental signal in the meshing line direction (healthy pinion): (a) simulated signal, (b) simulated frequency signal, (c) experimental signal, and (d) experimental frequency signal.
Applsci 10 07058 g010
Figure 11. The simulated and experimental signal in the meshing line direction (single tooth with spalling fault): (a) simulated signal, (b) simulated frequency signal, (c) experimental signal, and (d) experimental frequency signal.
Applsci 10 07058 g011
Figure 12. The simulated and experimental signal along the line of action (adjacent teeth spalling fault): (a) simulated signal, (b) simulated frequency signal, (c) experimental signal, and (d) experimental frequency signal.
Applsci 10 07058 g012aApplsci 10 07058 g012b
Figure 13. Status of tooth surface and mesh stiffness curves (two teeth with spalling fault, which are separated by one healthy tooth): (a) status of tooth surface and (b) mesh stiffness curves.
Applsci 10 07058 g013
Figure 14. Status of tooth surface and mesh stiffness curves (two teeth with spalling fault, which are separated by two healthy teeth): (a) status of tooth surface and (b) mesh stiffness curves.
Applsci 10 07058 g014
Figure 15. The simulated and experimental signal in the meshing line direction (two teeth with spalling fault, which are separated by one healthy tooth): (a) simulated signal, (b) simulated frequency signal, (c) experimental signal, and (d) experimental frequency signal.
Applsci 10 07058 g015
Figure 16. The simulated and experimental signal in the meshing line direction (two teeth with spalling fault, which are separated by two healthy teeth): (a) simulated signal, (b) simulated frequency signal, (c) experimental signal, and (d) experimental frequency signal.
Applsci 10 07058 g016
Figure 17. The flow chart of the proposed ant lion optimization-variational mode decomposition (ALO-VMD) method.
Applsci 10 07058 g017
Figure 18. The framework of the feature extraction method.
Applsci 10 07058 g018
Figure 19. The convergence curve of ant lion optimization (ALO) and particle swarm optimization (PSO).
Applsci 10 07058 g019
Figure 20. The results of an experimental signal by the proposed ALO-VMD method: (a) The time-domain signal and (b) the envelope spectrum.
Applsci 10 07058 g020
Figure 21. The envelope spectrum of five decomposition methods for the experimental signal.
Applsci 10 07058 g021
Table 1. Parameters for the dynamic simulation.
ParametersPinionGear
Number of teeth1624
Pressure angle (deg)20
Teeth module (mm)4.5
Teeth width (mm)14
Mass (kg)0.6761.084
Mass moment inertia (kg·m2)0.0004070.001168
Young’s modulus (N/mm2)2.06 × 105
Poisson’s ratio0.3
Bearing damping (N·s/m)4.86 × 1036.16 × 103
Bearing stiffness (N/m)3.5 × 1093.5 × 109
Torque (N·m)23.535.3
Table 2. The information of the experimental conditions.
Fault GearSpeed (r/min)Sampling Frequency (Hz)Fault Feature Frequency (Hz)
Pinion1.500 65.53625
Table 3. Comparison of optimization performance between ant lion optimization (ALO) and particle swarm optimization (PSO).
ParametersMethods
ALOPSO
(K,a)(3,1626)(3,3580)
Iterations47
Optimal fitness1.6061.576
Table 4. The efficient weighted kurtosis (EWK) value of each component.
Componentu1u2u3
EWK0.2860.605−0.891
Selection
Table 5. The efficient weighted kurtosis (EWK) value of each component.
MethodALO-VMDPSO-VMDFixed-Parameter VMDEMDLMD
SNR10.4649.9169.8549.2179.101
RMSE1.5771.6691.7721.9642.004

