1. Introduction
Current trends in pharmaceutical formulation development, reflected in guidelines for industry [
1,
2], indicate the need for a better understanding of manufacturing processes. The quality of pharmaceutical formulation depends on the qualitative and quantitative composition, applied production process, and its parameters. In-depth knowledge of production processes is crucial for quality assurance of the final product. Complexity, nonlinearity, and lack of full understanding of the processes are the main obstacles to the high-quality models development. Application of the artificial intelligence (AI) tools, such as evolutionary algorithms (EA), in the knowledge discovery of the manufacturing process, is beneficial for both the optimization of pharmaceutical formulations and quality control purposes. The knowledge-based drug development is in accordance with process analytical technology (PAT) paradigm of drugs manufacturing advocated by the U.S. Food and Drug Administration agency (FDA). Moreover, the FDA pushes forward modeling as an important strategy for drug development and endorses terms “model informed drug development” (MIDD) and “model-based drug development” (MBDD). MIDD/MBDD extend substantially the classical PAT concept of drug manufacturing and navigates modern pharmaceutical industry towards Industry 4.0 and smart plants. Thus, it positions Information Communication Technologies (ICT) as pivotal elements of the successful development of new medicinal products. Since the pharmaceutical industry is highly regulated, to ensure this course the FDA announced that MIDD is going to be a subject of regulations and new guidelines for the industry in the future [
3].
Spray drying is a single step process which converts a liquid feed into dry particles. It is widely used for producing inhalable microparticles including small molecules like salbutamol [
4], ciprofloxacin hydrochloride [
5] and macromolecules like cyclosporine A [
6] or salmon calcitonin [
7]. Spray-dried particles’ properties depend on the type of equipment, working conditions, and feedstock characteristics [
8]. Quality control procedures for pulmonary drug delivery systems imply the determination of the emitted dose (ED) and fine particle fraction (FPF) through the use of impactors and liquid impingers. Both parameters (ED and FPF) highly depend on assay conditions like apparatus, flow rate, inhaler type [
9], and are determined in vitro by standardized procedures [
10]. Multiple factors influence inhalable powder performances, such as particle shape, size, surface, charge, which determine inter-particle interaction [
11].
Despite the wide use of the spray drying technology in the pharmaceutical industry, understanding of the process and the final product characteristics is still limited. Grasmeijer et al. [
12] proposed an approach which allows prediction of outlet temperature and relative humidity of the exhausted air leaving the drying chamber. The first parameter was calculated based on heat loss caused by conduction and an evaporation process, while the second one was estimated by applying the Antoine equation and the ideal gas law. Simulations were consistent with experimental results. Furthermore, models were applied to optimize spray drying conditions for inulin and trehalose solutions. Another example is the application of computational fluid dynamics (CFD) to simulate the course of the spray drying process and prediction of outlet temperature, as well as residue accumulation during the operation [
13]. The development of data-driven model presented by Amaro et al. focused on final product characteristics [
14]. The statistical approach presented was successfully applied to predict particles size, and surface area for spray-dried trehalose and raffinose.
Soon enough, the pharmaceutical industry will be in the need for good quality, transparent (no black box allowed) predictive, and/or explanatory models, susceptible to validation performed at the highest level of pharmaceutical standards. Therefore, it is a strong need for the development of universal, transparent tools capable of predicting inhalable particles behavior. Regarding the complexity of the problem, we propose the application of evolutionary algorithms to develop high-quality models to predict FPF and ED based on controllable parameters of the spray drying process.
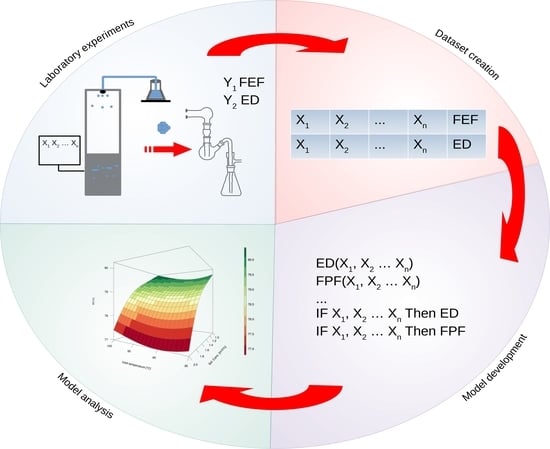
2. Materials and Methods
The results of laboratory experiments were used to construct the database. Dry powders were prepared by spray drying using Nano Spray Dryer B-90 (Büchi Labortechnik AG, Flawil, Switzerland). Feed solutions contained a model active pharmaceutical ingredient (API) and an excipient dissolved in the water–ethanol mixture. During spray drying, six factors were controlled and modified: API to excipient ratio [m/m%], feed solution concentration [m/V%], ethanol to water ratio [V/V%], inlet air temperature [°C], air flow [L/min], and pressure [mbar] inside the spray dryer. Particle aerodynamic performance was assessed by the Twin-stage Glass Impinger (Apparatus A, Copley Scientific, Colwick, UK) coupled with HandiHaler
® inhaler. Assays were carried out according to the 10th Ph. Eur. monograph on aerodynamic assessment of fine particles for powder inhalers (2.9.18) [
10]. The shape and size of obtained particles were analyzed based on Scanning Electron Microscopy photographs using ImageJ software (1.52a, website:
https://imagej.net/) [
15]. The particles were spherical and their median size for a number distribution (Dn50) differed from 250 nm to 760 nm between formulations. The complete database, applied in further computational experiments, is shown in
Table 1.
2.1. Models Development and Assessment
The computational experiment was designed to develop multiple input single output (MISO) models. ED and FPF models were developed separately without any interaction of these two variables. Model performance was evaluated according to the 10-fold cross validation and expressed by three goodness of fit metrics: root-mean-square error (RMSE, Equation (1)), normalized root-mean-square error (NRMSE, Equation (2)), and coefficient of determination (
R2, Equation (3)). NRMSE was calculated according to experimental FPF and ED ranges.
where: obs
i, pred
i = observed and predicted values of i-th record, n = total number of records.
where: RMSE = root-mean-square error calculated for the model, X
max = maximum value of the observed results, X
min = minimum value of the observed results.
where:
R2 = coefficient of determination, obs
i, pred
i = observed and predicted values, respectively, obs
mean = arithmetic mean of observed values.
Models were built and assessed using in-house software developed in R environment [
16]. Additional packages delivering evolutionary algorithms, fuzzy logic, and genetic programming methods were used. Computations were executed using 29 workstations (542 threads) working under Linux openSUSE Tumbleweed operating system. All tools applied in the study including source code and examples are available on SourceForge website [
17,
18,
19].
2.2. Evolutionary Algorithms
Evolutionary algorithms gained research focus through the work of John Holland and his group in the 1970s, who introduced framework for genetic algorithm (GA) development [
20]. Evolutionary algorithms are classified as heuristic search methods inspired by evolution process. The concept is based on the mechanism of natural selection where within the population only the fittest subjects, the ones which can adapt quickly to the solution, are selected for reproduction. The offspring inherits the characteristics of both parents, and if they better adapt to the observed solution (better fitness), they have a better chance to survive [
21].
The given problem is defined by the environment, where a population of candidate solutions are present. Every candidate has a chromosome which is used to decode its information to the real solution. The computational space in the population is represented by the genotype where the phenotype represents its solution in the real world. In other words, chromosomes describe the proposed real solution of the problem, and cost function evaluates its goodness of fit. The evolution process usually starts by the random initialization of the population. Then, it iterates over three critical steps: (1) selection of the best-fitted individuals, (2) application of the genetic operators such as cross-over, mutation, and (3) reproduction—the next generation is created. These three steps are repeated until a termination condition is reached [
22].
The process of model development and its selection was adapted from Polak et al. [
23], where the authors used a similar methodology to explore the physiological parameters influencing QT interval, indicating the broad area of application of evolutionary algorithms. In this work, in-house software implementing two machine learning frameworks (
fugeR and
rgp) delivering computational methods based on evolutionary algorithms was employed.
2.2.1. fugeR
The first framework named
fugeR [
24] delivers solutions to develop fuzzy logic (FL) models by applying evolutionary algorithms fundamentals. Fuzzy logic was introduced by Zadeh [
25], who claimed intermediate values between absolute true and absolute false, so called many-valued logic. The
fugeR uses a genetic algorithm to evolve a population of the fuzzy logic models. In general, solution development starts by generating a random population of fuzzy systems, test them with available data, and sort them based on the goodness of fit metric. The following generations are created as decedents of the best performing models by applying cross-over function and random mutations. At the end of the process, the fuzzy system with the best performance is returned. The
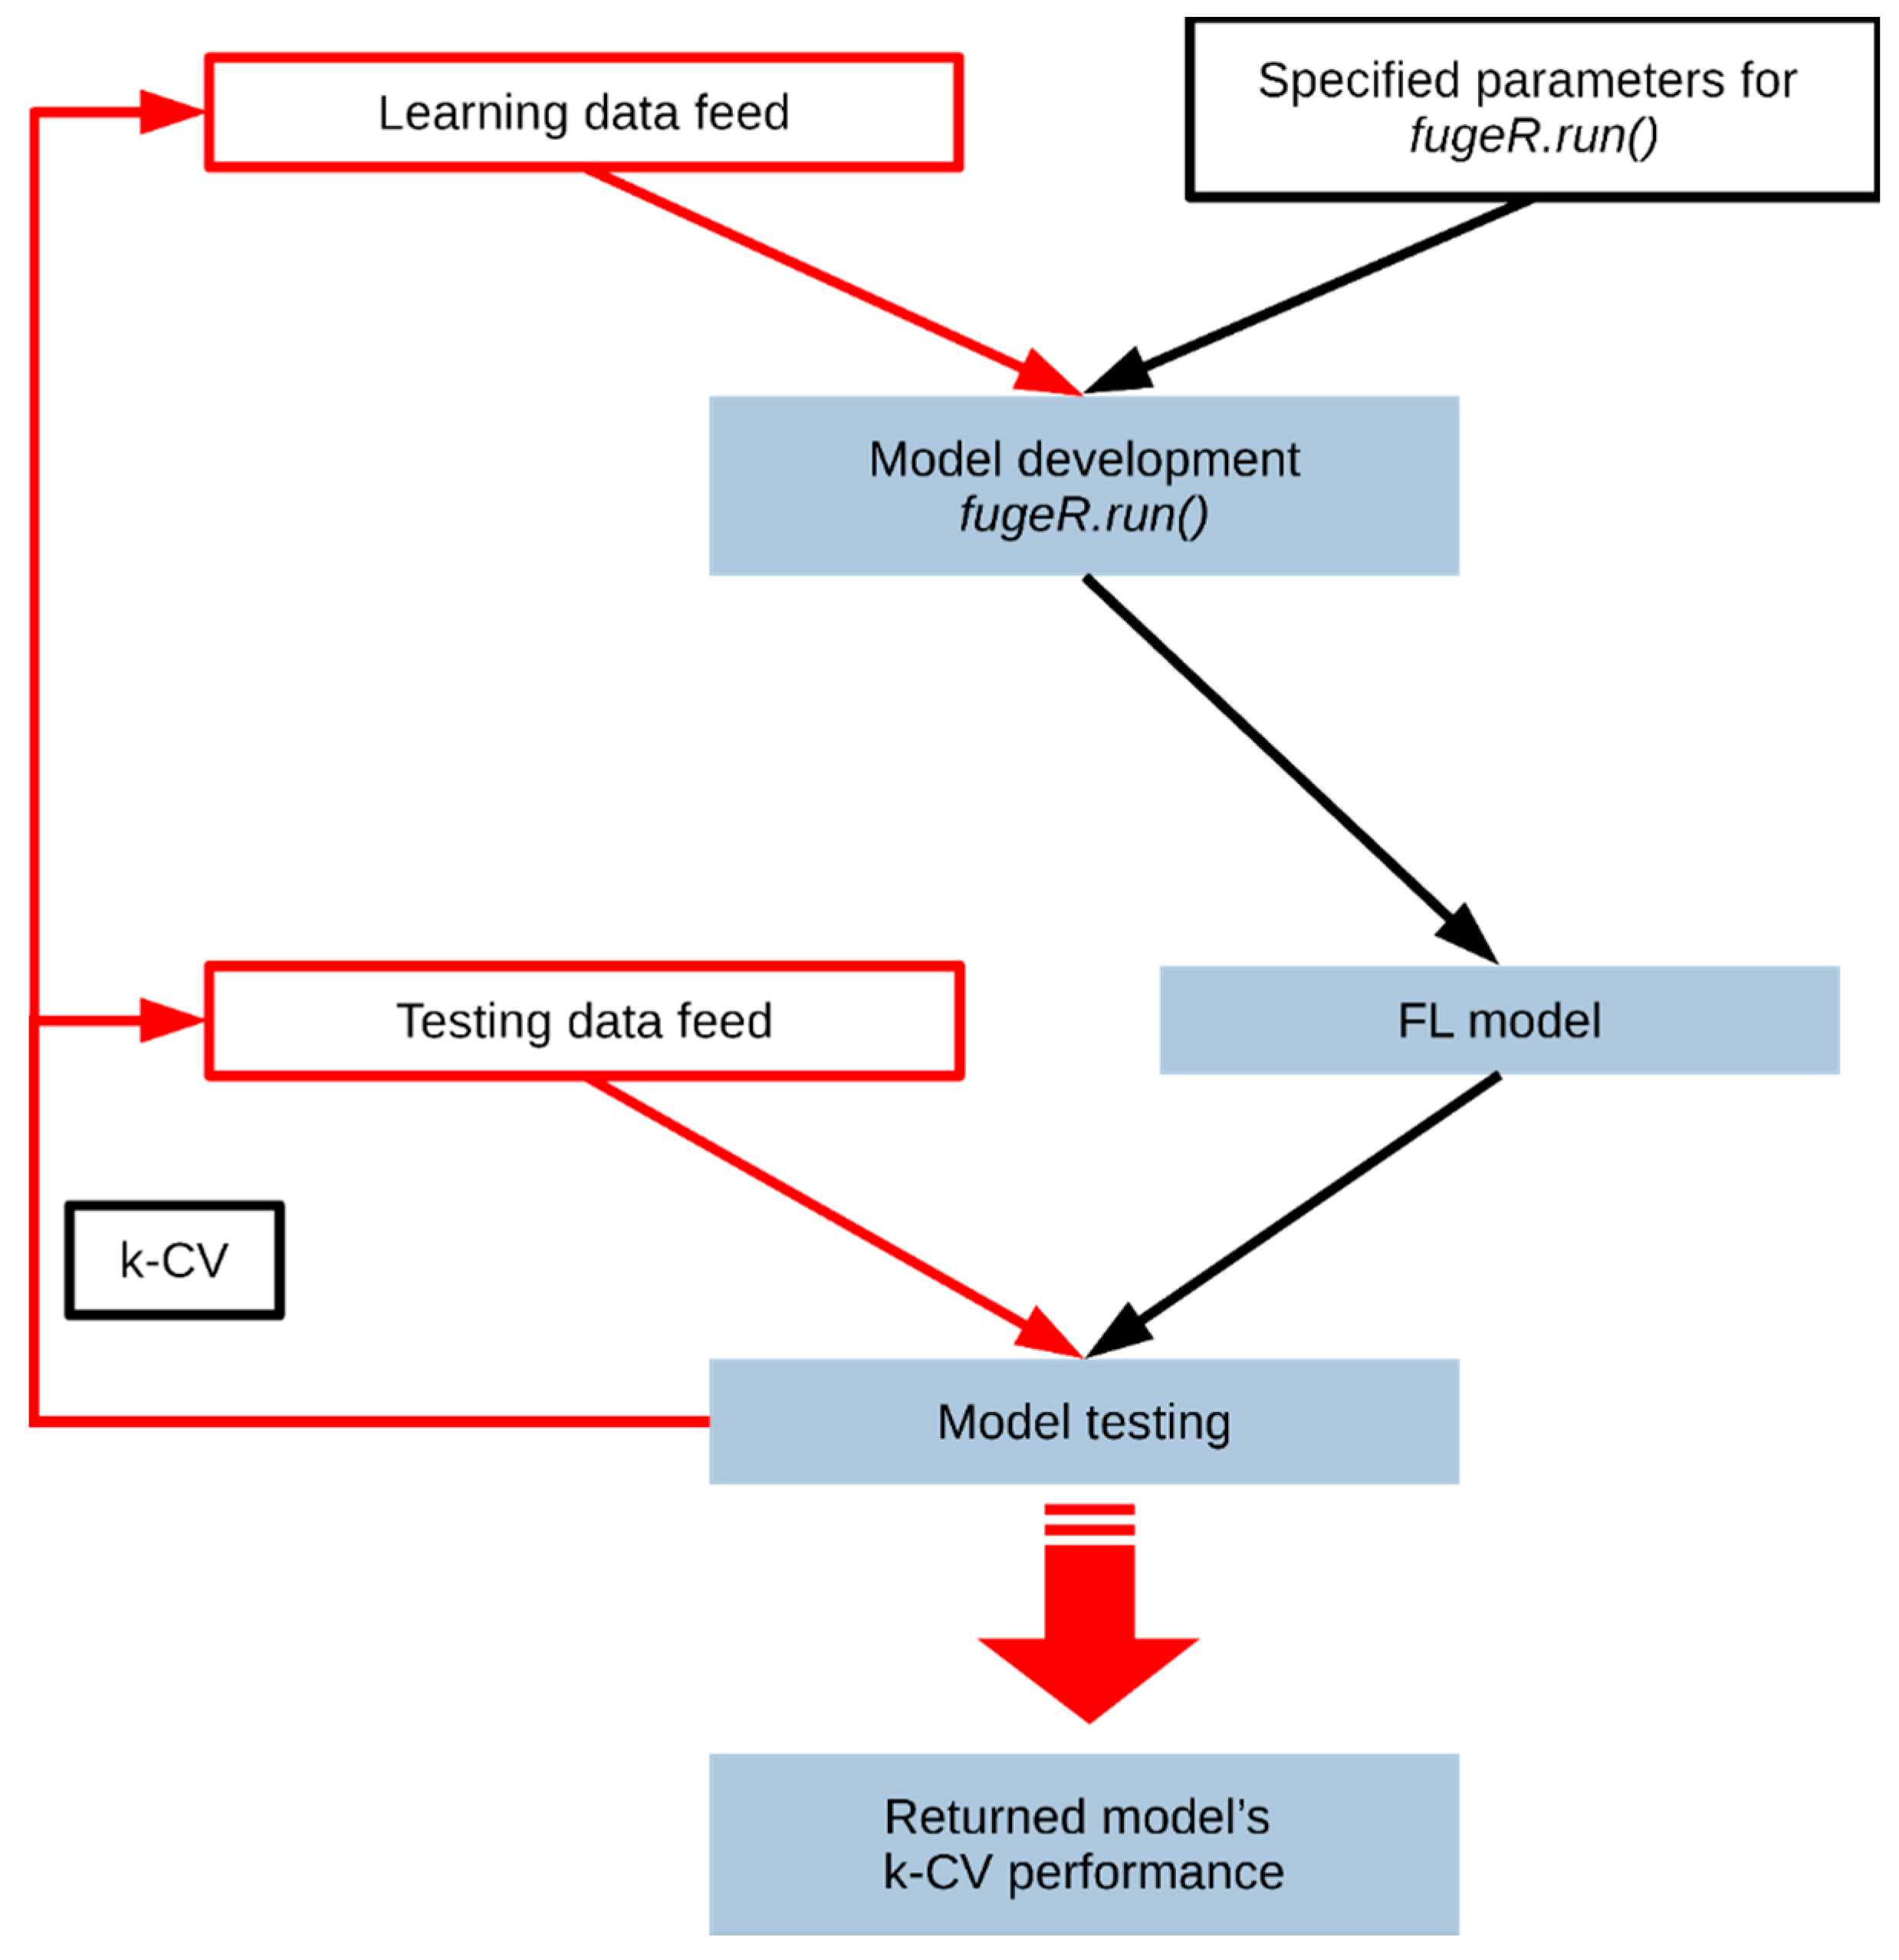
fugeR framework delivers enclosed functions to develop FL models using EA. However, to make model development process efficient and in line with the adopted standards, a wrapper software was created [
18]. The system was built using Bash and R languages and works under Linux OS. It allows generating computational tasks with grid-like generated parameters including: learn and test dataset files, factors pass to
fugeR.run() function for model development and scheme of models creation and assessment. Such approach allows testing developed models according to k-fold cross-validation standards and returns model performance as structured reports. Moreover, parallelization of the computational tasks speeds up the model development process and allows to find global problem solution. The general pipeline presenting the process of model development and testing process using the software is shown in
Figure 1. During computational experiments, both model architectures and optimization settings were tuned. The maximum number of rules differed from 10 to 50 with 1 to 20 variables within every fuzzy rule. The number of fuzzy membership functions (singletons) varied from 5 to 15. The learning strategy was controlled by population size (from 50 to 500) and generations number (from 100 to 500).
2.2.2. rgp
The second framework applied in presented work was
rgp [
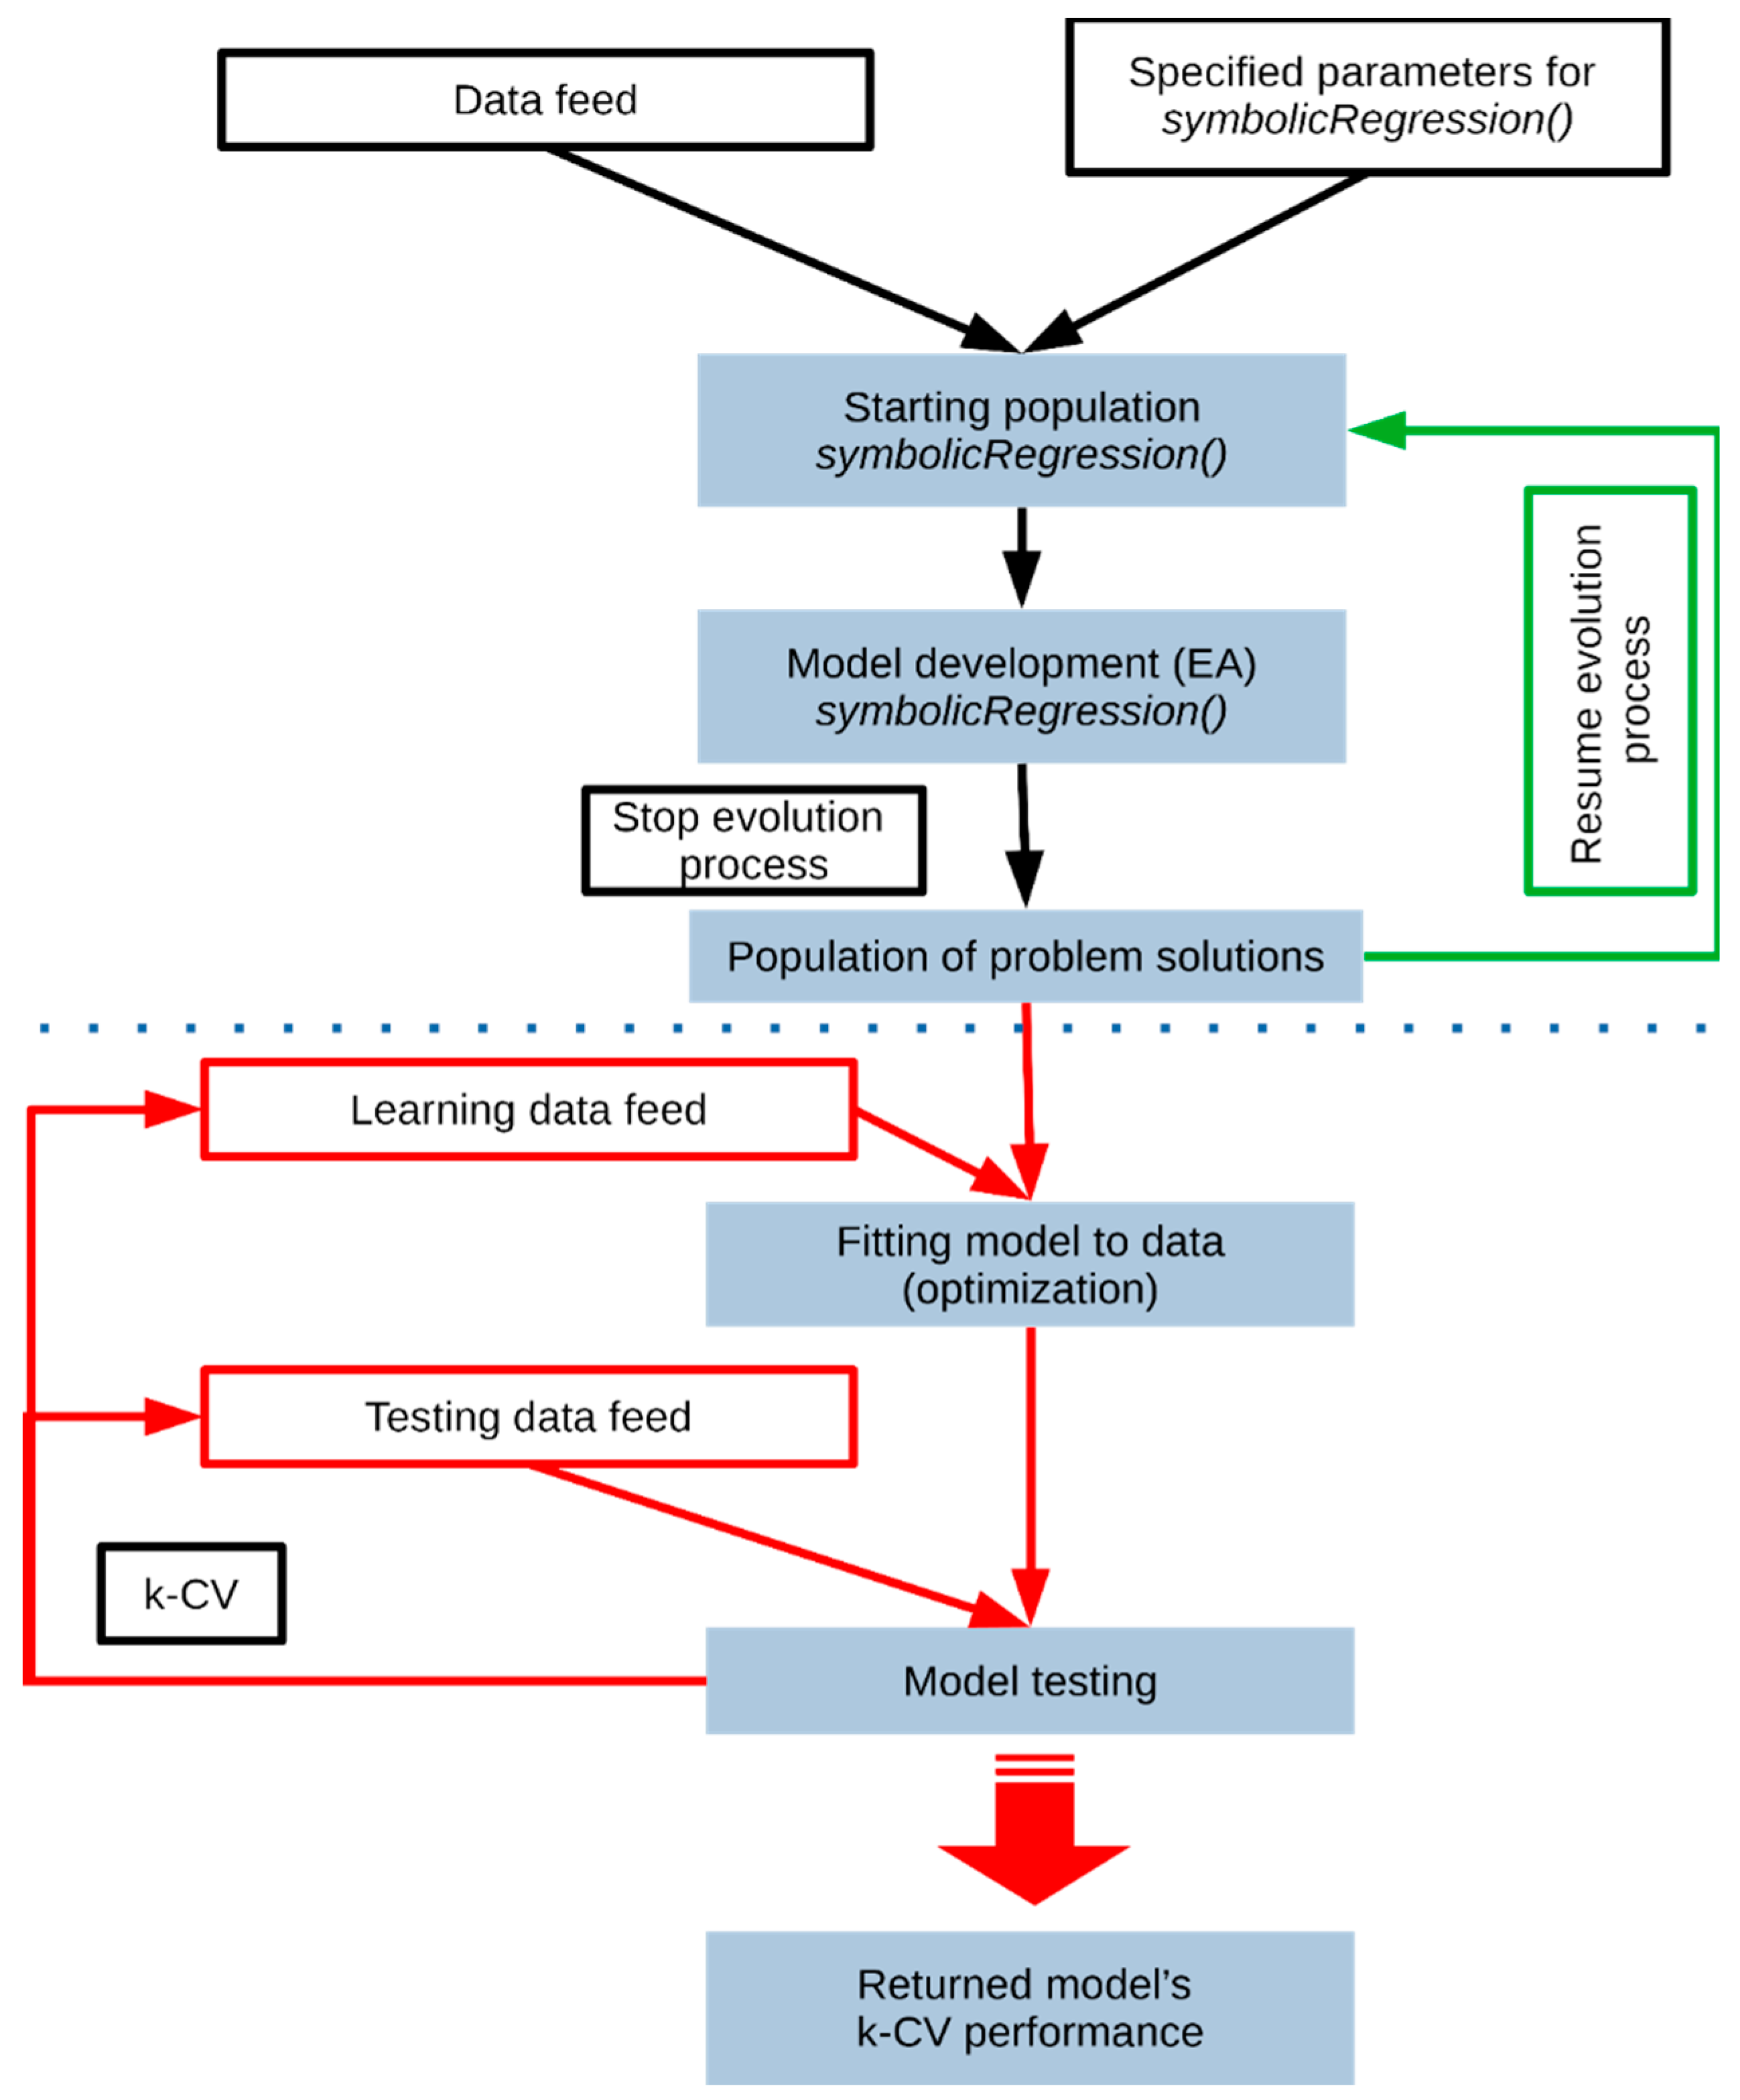
26] developed by Olivier Flash, which delivers genetic programming methods. GP allows generating a computer program capable to solve a defined problem using EA. Moreover, using a symbolic regression module, the solution of a given problem can be represented as formal mathematical expression, which is easy to read and understand by humans. Similar to the previously described tool, at the first stage, the population of random equations is generated and tested. Next generations are created as descendants based on the best performing models by the exchange of a genetic material (cross-over function) and additional random modifications (mutations). To make the model development process efficient and in line with adopted methodology, in-house software for Linux OS was developed [
19]. Source code was written in R and Bash programming languages. Software control parameters such as: data feed for the core function of model development through GP methods, flow of the evolution process (stop, resume), and performance metric the k-fold cross-validation (k-CV). Results are returned in structured report files. Model development and testing routine is continuous, which allows the user to follow recent advances and results. It is also possible to promptly use obtained models. The software is suited for parallelization of the processes by specifying a set of different parameters within the user interface. Moreover, computational tasks are run independently to speed up the model development process. The general scheme of the software workflow is shown in
Figure 2. In the presented work, symbolic regression was used to develop a mathematical formula directly on the data provided. The size of the chromosome, representing the maximum length of the equation varied from 50 to 200. The population size was set to 200, and the total length of the evolution process was set to 100 million steps divided into 500 testing stages. Moreover, the GP tools were used to perform feature selection based on the principle that variables related to the evolution of the solution are connected with the defined problem.
3. Results and Discussion
Prior to applying GP tools, linear regression models were developed and tested according to the 10-fold cross-validation scheme. Standard lm() function of R environment was applied, yet obtained results were far from being satisfactory. In the case of FPF prediction, RMSE was 12.03 (NRMSE = 20.44%), and in the case of ED predictions, RMSE was 11.30 (NRMSE = 32.2%).
3.1. Models for Prediction of FPF
The FPF prediction model performance is summarized in
Table 2. Both
fugeR and
rgp models exhibited good FPF predictive ability. Fuzzy systems resulted in a slightly worse performance in comparison to genetic programming, as their NRMSE was 8.86 with
R2 below 0.85. The best model was developed using
rgp package and it is presented as Equation (4) (NRMSE = 8.29%, and
R2 = 0.91). The model uses four variables: API to excipient ratio (X
1), feedstock solution concentration (X
2), ethanol to water ratio (X
3), inlet air temperature (X
4), and five constants (C
1–C
5). During the evolution of the solution, two variables describing flow rate and pressure inside the spray drying chamber were excluded. Comparison of FPF values predicted by the model and those obtained in laboratory experiments is presented in
Figure 3.
C1–C5: constants; C1 = 5.298; C2 = −524.223; C3 = −135.864; C4 = −13.842; C5 = 120.661,
X1: API to excipient ratio [m/m%],
X2: concentration of feed solution [m/V%],
X3: ethanol to water ratio in solvent applied in the process [V/V%],
X4: inlet air temperature during spray drying process [°C],
M: mass,
V: volume.
3.2. Models for Prediction of ED
Results obtained by the best fuzzy systems and GP models are presented in
Table 3. Both methods resulted in a significantly lower error in comparison to linear regression. The GP models yielded almost twice-fold lower NRMSE (8.14%) than fuzzy systems (below 15%). The best model is given in Equation (5). ED values calculated according to Equation (5) and observed in laboratory experiments are shown in
Figure 4. The model uses all six variables (X
1–X
6) available in the database and two constants (C
1 and C
2).
C1–C2: constants C1 = −5.029; C2 = 8.417,
X1: API to excipient ratio [m/m%],
X2: concentration of feed solution [m/V%],
X3: ethanol to water ratio in solvent applied in the process [V/V%],
X4: inlet air temperature during spray drying process [°C],
X5: air flow during spray drying process [L/min],
X6: pressure inside spray dryer during the process [mbar].
3.3. Model-Based Problem Analysis—Single Variable Impact
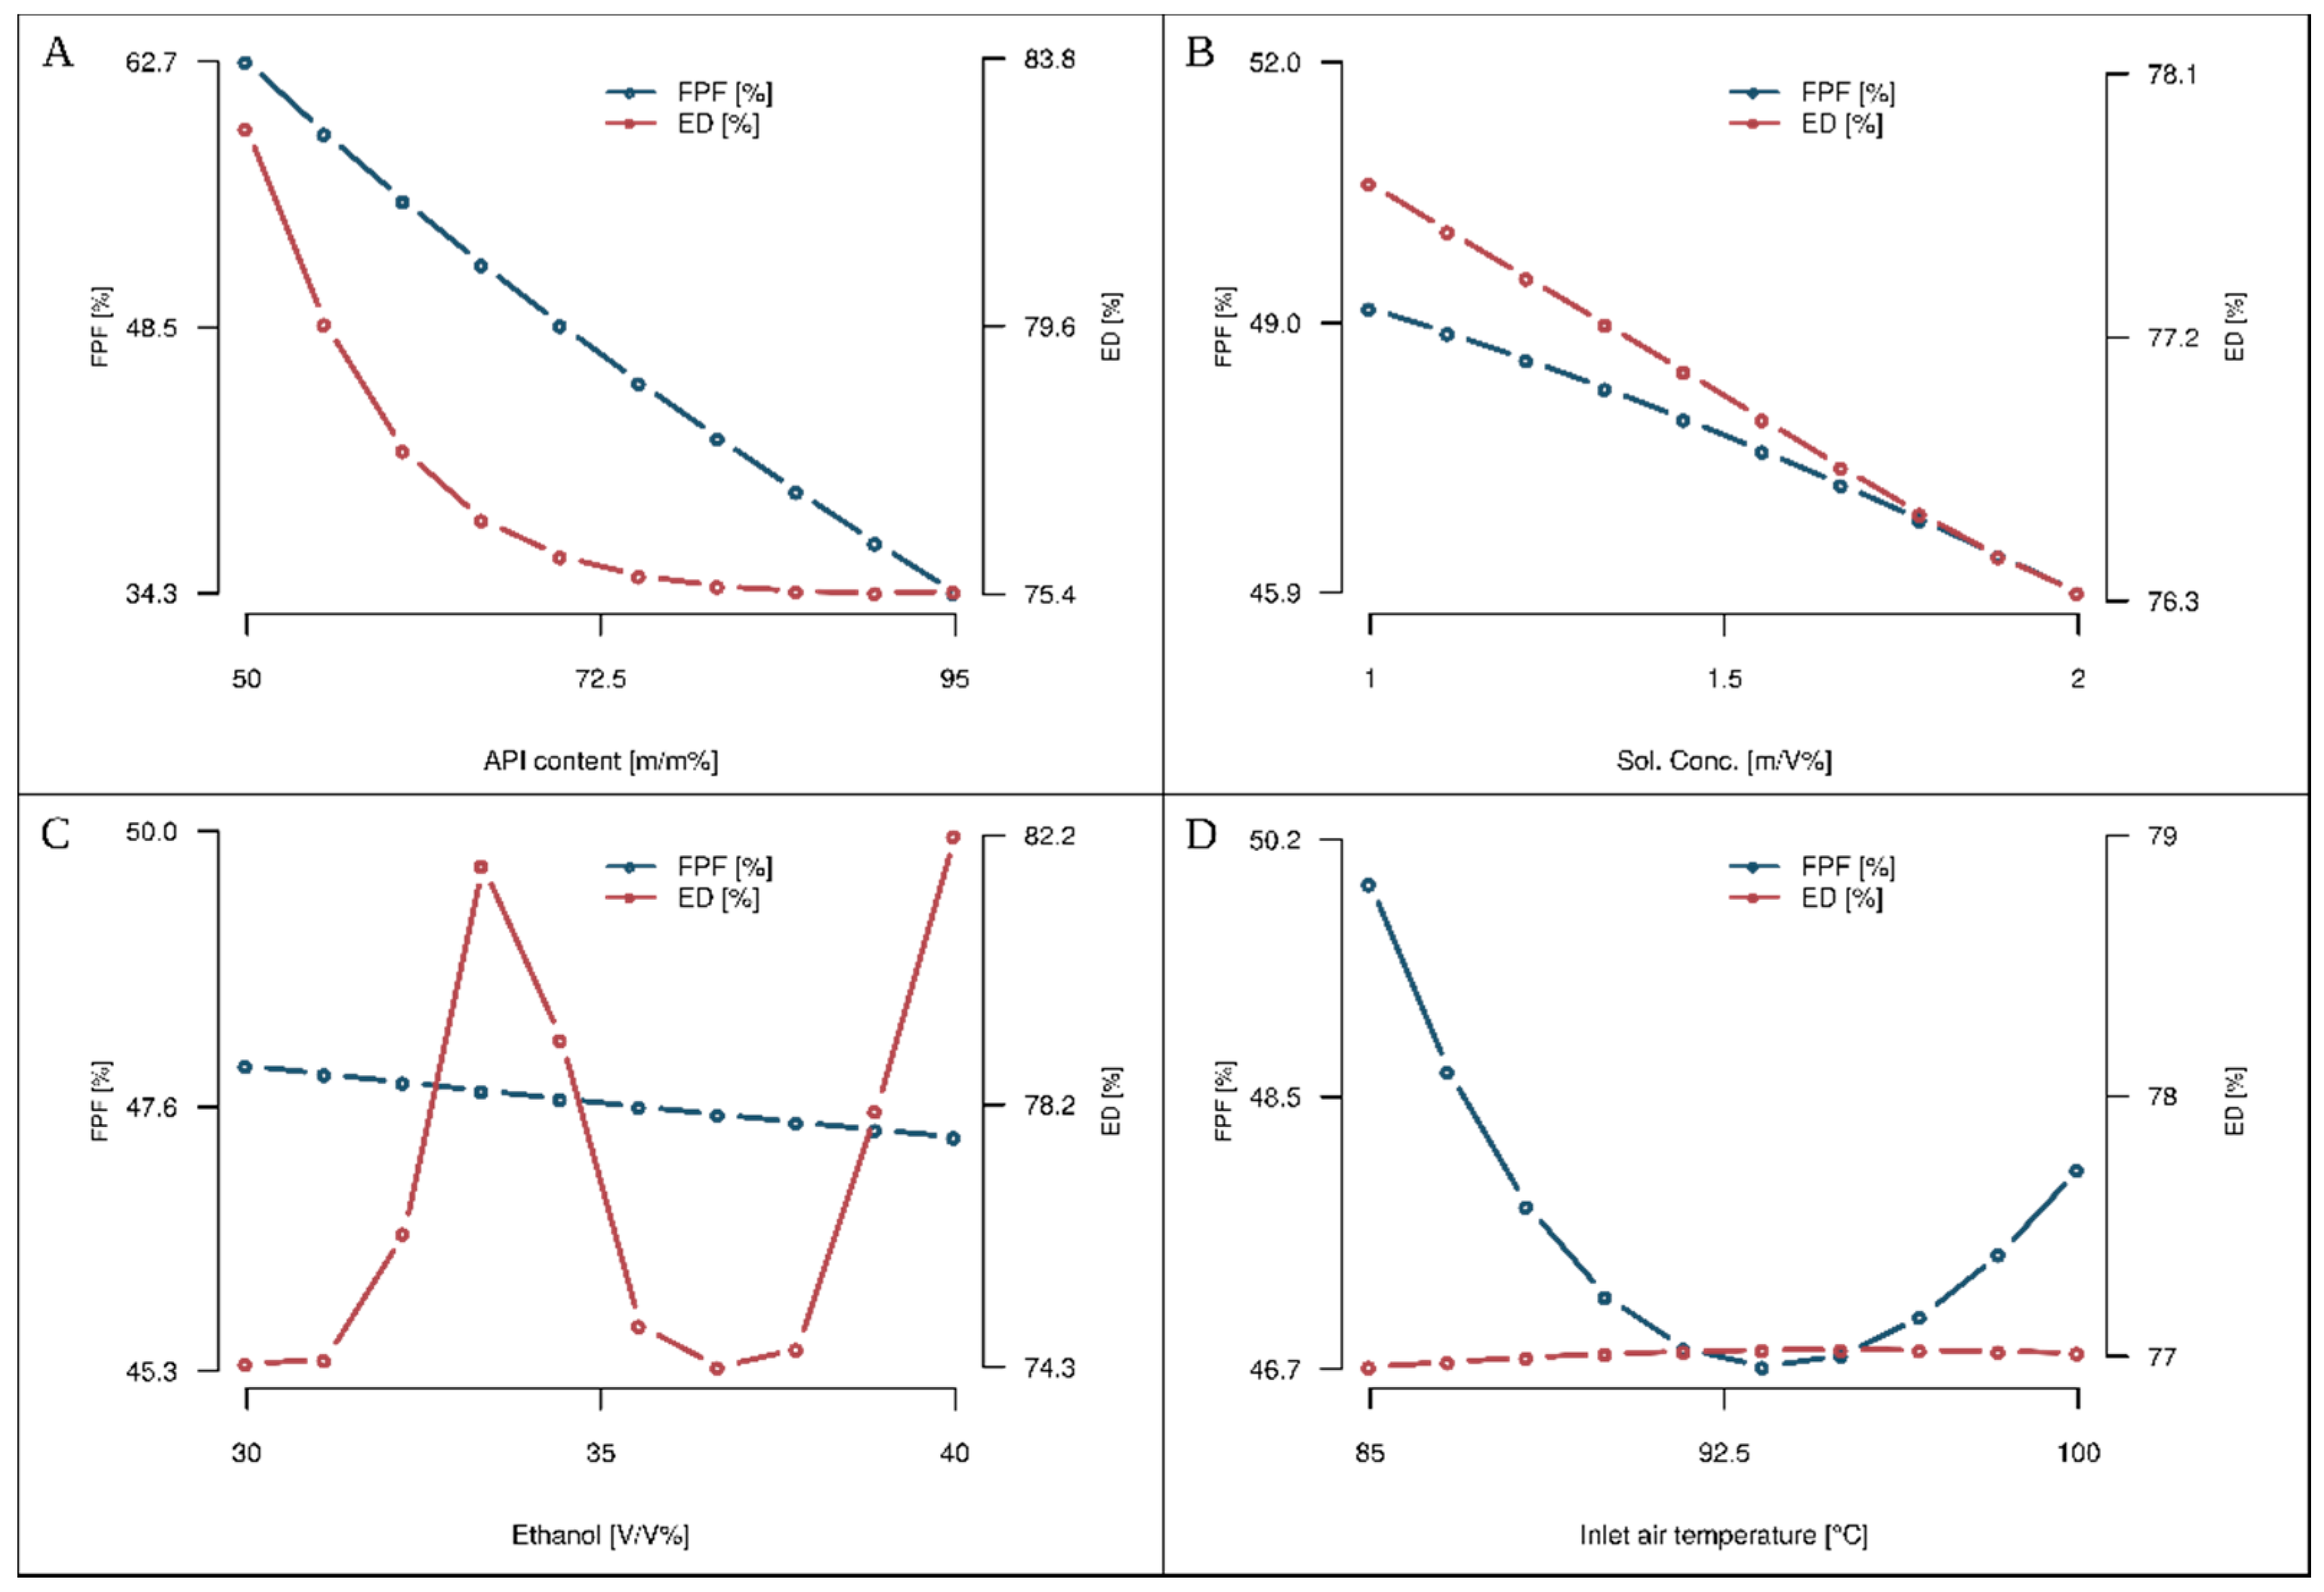
The predictive models were applied to explore the influence of input variables on predicted FPF and ED endpoints. Relationships between input and output variables are presented in
Figure 5. Analysis of
Figure 5A shows that changing the ratio of API to excipient content strongly impacts ED and FPF values. Increasing the API content in the liquid feed decreases both the FPF and ED. The steepest descent of ED is observed when API content is in the range of 50 to 72.5% (
Figure 5A).
Figure 5B presents the influence of the total concentration of compounds dissolved in feed solution on the final particle characteristics. It is observed that lower concentrations of feed solution yield higher FPF and ED values. Ethanol to water ratio in solvent applied in the process has a small impact on FPF value while predicted ED is significantly lower for feed solvents with lower ethanol content (
Figure 5C). The temperature of the air entering spray drying chamber does not affect ED at all (
Figure 5D). On the contrary, low and high temperatures positively impact FPF values (
Figure 5D).
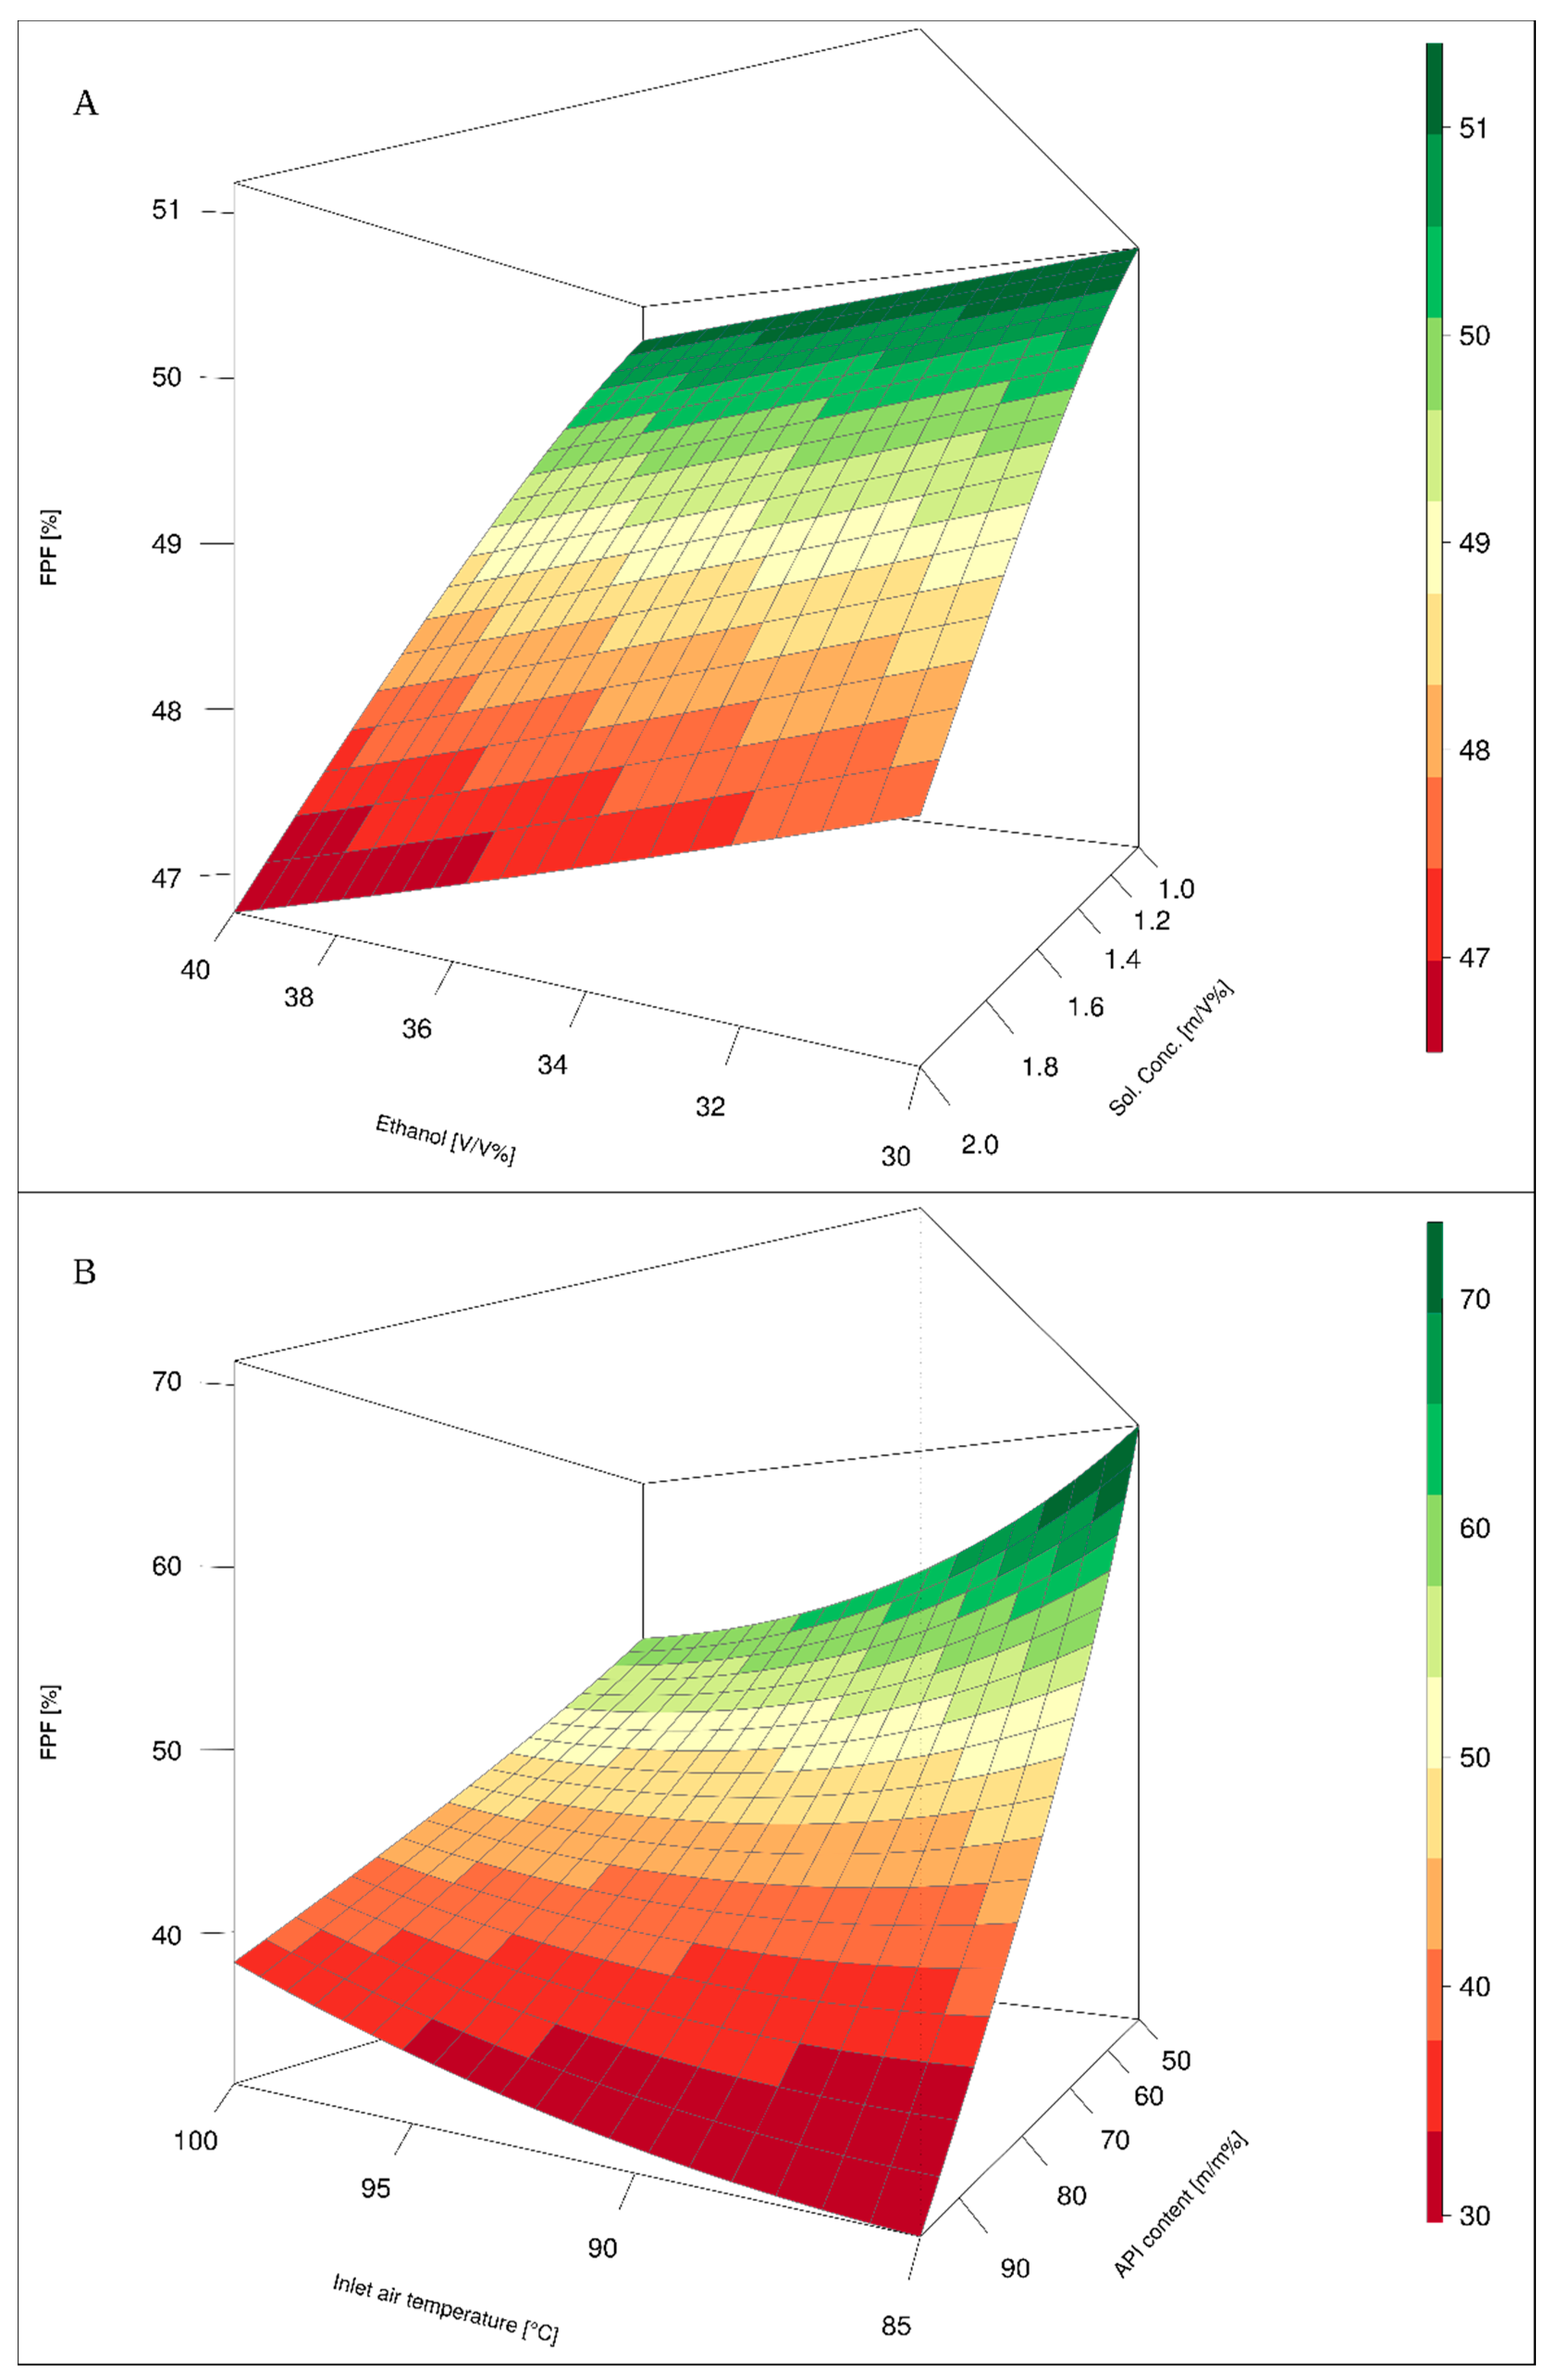
3.4. Model-Based Problem Analysis—Multi-Variables Impact
Influence of the two input factors on the endpoints (FPF, ED) was analyzed by plotting three-dimensional graphs. Of a plethora of possible combinations, we have selected the most significant ones.
Figure 6A presents the relationship between ethanol content in feed solvent, the total concentration of the solution, and predicted FPF value. It was observed that both low concentration of the feed solution and low ethanol content positively influence FPF values.
Figure 6B shows the relationship between FPF predicted by the model, inlet air temperature during spray drying process, and API to excipient ratio. It can be noted that FPF value is higher for formulations containing lower API to excipient ratio. At the same time, inlet air temperature influences FPF in a non-linear manner. It appears that higher inlet air temperature is beneficial in case of formulations with high API excipient content while lower inlet air temperature results in higher FPF in case of formulations with lower API content. The influence of individual variables on the predicted ED value by the model is shown in
Figure 7. It can be observed that decreasing API to excipient ratio positively influence predicted ED, and this trend is strong in the case of spray drying solution with a lower content of dissolved ingredients (
Figure 7A).
Figure 7B shows the influence of the inlet air temperature and solution concentration on the predicted ED. Decreasing amount of feed solution concentration positively influences ED, whereas high and low inlet air temperatures seem to have a small positive impact on predicted ED.
3.5. Discussion
The methodology applied during the development of evolutionary models stays in accordance with the Cross Industry Standard Process for Data Mining (CRISP-DM) protocol [
27]. Therefore, the high quality of the models is assured. The obtained errors, below 8.3% for FPF and 8.2% for ED, in the 10-fold cross validation protocol suggests that the developed models exhibit significant extrapolation ability. With the latter confirmed, the models for ED and FPF could be used for prospective development of pulmonary drug delivery dosage forms, with models acting as decision support systems (DSS). This research demonstrates that the above presented models perfectly balance predictability with transparency [
28,
29]. Moreover, the GP derived models are transparent and easily validated (Equations (4) and (5)).
The model analysis suggests the highest impact of API to excipient ratio (
Figure 5A) on the final aerosolization properties. These findings are in accordance with work of Bosquilion et al. [
30], who observed higher ED values for spray-dried powders with lower API content. Moreover, positive impact on the FPF value with increasing amount of excipient was reported by Corrigan et al. [
31] for spray-dried particles composed of salbutamol sulfate and lactose. It was also noted that decreasing total feed concentration resulted in the higher FPF. Chew et al. [
32] observed influence of feedstock concentration on particles surface characteristic and powders aerodynamic properties. Low feedstock concentration led to more corrugated particles and resulted in the higher FPF, which corresponds with our analysis (
Figure 5B and
Figure 6A). Ethanol content in the spray drying feed rate was also reported as a factor influencing particles morphology and ED [
33], which confirms the validity of the selection of this variable by evolutionary algorithm (Equations (4) and (5),
Figure 5C and
Figure 6A).
The limitations and the possibility to extend the presented model should also be pointed out. First of all, the discussed effects are valid for the substances applied in the experimental setup; therefore, in the case of other drugs and excipients it may differ in magnitude and direction. There is a possibility that increasing the other API concentration may result in higher ED or FPF experimental value, because feedstock and concentration effects are dependent on chemical–physical properties of the API, such as cohesiveness, hygroscopicity, and solubility. The same is with different spray drying setup including the type of apparatus, nozzle, and mechanism of aerosol generation, they may modify temperature impact on ED and FPF. Despite some limitations on the direct use of proposed models, it seems that the presented methodology could help in the development of optimal pharmaceutical formulation and understand underlying phenomena. Presented models could be improved and expanded in the future whereas methodology and workflow may remain unchanged.

 ,
, 


