Featured Application
This work presents the analysis of the element of the ‘roof’ as a methodological approach to assess the renovation opportunities of existing rooftops, as a stimulus to mitigate the urban phenomena of heat island mitigation by focusing on the role of codes, policies, and regulations in cities.
Abstract
Urban rooftops are a potential source of water, energy, and food that contribute to make cities more resilient and sustainable. The use of smart technologies such as solar panels or cool roofs helps to reach energy and climate targets. This work presents a flexible methodology based on the use of geographical information systems that allow evaluating the potential use of roofs in a densely built-up context, estimating the roof areas that can be renovated or used to produce renewable energy. The methodology was applied to the case study of the city of Turin in Italy, a 3D roof model was designed, some scenarios were investigated, and priorities of interventions were established, taking into account the conditions of the urban landscape. The applicability of smart solutions was conducted as a support to the review of the Building Annex Energy Code of Turin, within the project ‘Re-Coding’, which aimed to update the current building code of the city. In addition, environmental, economic, and social impacts were assessed to identify the more effective energy efficiency measures. In the Turin context, using an insulated green roof, there was energy saving in consumption for heating up to 88 kWh/m2/year and for cooling of 10 kWh/m2/year, with a reduction in greenhouse gas emissions of 193 tCO2eq/MWh/year and 14 tCO2eq/MWh/year, respectively. This approach could be a significant support in the identification and promotion of energy efficiency solutions to exploit also renewable energy resources with low greenhouse gas emissions.
1. Introduction
This paper presents some of the results of the Re-Coding research project, undertaken by the Research Centre Future Urban Legacy Lab (FULL) in collaboration with the Responsible Risk Resilience Centre (R3C) of Politecnico di Torino. This project was carried out in support of the current review of the General Development Plan of the city of Torino, Italy. Such research explored the relationship between codes and city morphology with the aim of expanding the scope of the existing building regulatory system to a wider encompassing environmental system of codes that could support the sustainable development of the city. A number of studies across disciplines are currently looking into the role of planning and coding in the definition of policies and regulations for environmental improvement of our built environment [1,2,3,4]. Conversely to the traditional planning approach of zoning, such studies discusses the importance of building codes to trigger effective changes on the urban scale by intervening on punctual aspects such as the environmental quality of building parts. Not only within the academic discourse, but also in practice current tendencies of policies and regulation systems tend to focus on the need of environmental awareness with such approach. This is the case, for example, of the cities of New York, with the OneNYC 2050 and Climate Mobilization Act, and of Marseille, with its regulatory planning and coding system, in which punctual actions are determined with simple rules to improve environmental performances. As [1] explained, the complexity of a regulation system might hinder the immediate understanding of the extent and impacts that such regulations have on the built environment, particularly when the overlapping of well-intentioned regulations generated in different time frames result in out-of-date or ineffective rules. For this reason, the Re-Coding project is aimed at redefining the rules starting by the analysis of ‘building elements’ as the interface between users (i.e., architects, private owners) and institutions. To this end, about 42 elements (i.e., windows, roof, external walls, and others) across scales have been identified and utilized as navigators to allow the mapping of current regulation systems.
This work presents the analysis of the element of the ‘roof’ as a methodological approach to assess the renovation opportunities of existing rooftops, as a stimulus to mitigate the urban phenomena of heat island mitigation by focusing on the role of codes, policies, and regulations in cities. The results of this analysis and exploration were used to propose and define modifications in the current regulations. Such modifications were aimed at actively promoting sustainable changes in the urban environment, in particular, by providing data to support the modification of the Building Annex Energy Code, currently in use in the city of Turin.
The Premises of the Research
The roof element was analyzed as a device that relates both environmental issues and the revision of the related regulations that define the relationship between urban morphology and the impacts on its ordinary transformation. Moreover, the roof could be considered as the fifth facade of buildings and its surface can be rethought as a platform for multiple uses, action, and potential transformation effects on the city [5,6].
Within this conceptual framework, the focus of the work was to tease out the opportunities offered in rethinking the roof element not only as a separation device between two environments, internal and external, but as a surface capable of catalyzing multiple functions related to urban living.
The analysis of international case studies (e.g., New York, Paris, Marseille, Melbourne, and Lisbon) started in the first phase of the research through the application of a matrix, which allowed the comparison of the design strategies adopted in relation to the current legislation. The matrix utilized is based on the innovation theory applied to architectural and urban design, defined first by Slaughter [7] and later elaborated by Nigra and Dimitrijevic [8]. Such matrix categorized each case study according to type of change, according to the definitions of incremental change, modular change, architectural change, system change, and radical change. These categories define different natures of change. The incremental change is defined as a small change that does not affect the overall nature of an intervention. The modular change is a change that influences a single independent part of a project. An architectural change is a change that alters the relation between major architectural and compositional elements. The system change is a change that alters the overall system functioning by increasing its performance. The radical change is a change that transforms totally the nature of an existing condition. The following table shows the application of these concepts to a number of case studies analyzed, in relation to the type of intervention done on the roof elements on certain projects.
The matrix above (Table 1) highlights the different opportunities to conceive roofs as a resource in relation to both the building system and the city system. The case studies analyzed allowed us to amplify the image of the functions that the roof element can accommodate: Temporary solutions that rethink the roof as a support for site-specific works or a platform hosting light devices for autonomous functions or that extend and intensify the functional program of the building, creating different relationships with the city up to the roof, rethought as a system-generative platform, which increases the building’s performance.

Table 1.
Criteria to assess rooftop renovation feasibility.
Rereading from this perspective, the idea of roofs and the surfaces made available emerges as an additional layer on the city, an infrastructure of latent potential to be activated through a constant dialogue between the project and the regulations [2,3,9].
Following are the main objectives of this work were:
- Showing an example of scientific investigation in support of the re-coding activity undertaken in conjunction with the Turin Municipality.
- Presenting a methodology able to evaluate the potential and feasibility of rooftop renovation in a built-up urban context.
- Evaluating the impact of smart rooftop solutions (insulated roof, green roof, high-reflectance roof, and energy production from solar energy) assessing energy savings, thermal comfort conditions, greenhouse gas (GHG) emissions, and social, environmental, and economic benefits.
- Identifying innovative building codes as an opportunity to promote rooftops’ renovation using smart solutions and technologies.
2. Materials and Methods
The methodology described in this section was applied to a case study of the city of Turin. The city is located in the northwestern part of Italy and has a continental climate and almost 900,000 inhabitants. The aim was to assess the applicability of rooftop renovation strategies in a built-up context at district level, investigating environmental, social, and economic impacts of smart roof solutions. Figure 1 describes in detail materials, methods, and tools used in this.
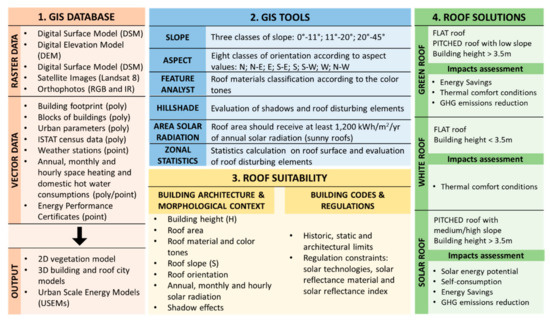
Figure 1.
Flowchart of materials, methods, and tools.
- (1)
- Geographic Information System (GIS) database: The main input data elaborated with the use of a GIS software and the output of the processing.
- (2)
- GIS tools: The tools used to analyze the buildings’ characteristics and the urban environment.
- (3)
- Roof suitability: The criteria used to evaluate the roof suitability according to architectural characteristics, morphological context, building codes, and regulations.
- (4)
- Roof solutions: The most effective rooftop strategies were identified to improve the livability conditions of the city of Turin, and the impact of smart technologies was investigated.
2.1. GIS Database: Input Data Collection and Processing
Building upon an ongoing research, a territorial database (DBT) was organized and implemented with the use of a GIS software processing remote sensing images, orthophotos, building characteristics, land cover data, local climate measurements, and energy consumption data. The main data content refers to:
- Elevation models (raster data): The digital terrain model (DTM), with a precision of 10 m, describes the natural terrain. The digital elevation model (DEM), with a precision of 5 m, represents the bare-Earth surface, without natural or built features. The digital surface model (DSM), with a precision of 0.5 m and 5 m, represents the Earth’s surface including trees and buildings. These kinds of data were used to assess shadows’ effects on buildings and the surrounding’s urban context to quantify the solar radiation, taking into account the sun and sky models, and to evaluate the building characteristics such as roof slope and orientation [10].
- Satellite images (raster data) from Landsat 8, the operational land imager (OLI) and the thermal infrared scanner (TIRS) with a precision of 30 m, were used to analyze the land cover types and to calculate the albedo of the outdoor spaces, the presence of vegetation with the use of the normalized difference vegetation index (NDVI), and the land-surface temperature (LST) [11].
- Orthophotos (raster data), with high spatial resolution of 0.1 m, red-green-blue (RGB) color model, and infrared (IR) spectral bands, were used to identify green areas and evaluate albedo values of outdoor urban spaces and buildings’ roofs, as a function of color tones [12,13].
- Municipal technical map of the city (polygonal vector data), updated to 2019, gave information on a building’s footprint, type of users, number of buildings, number of floors or building height, period of construction, roof area, gross and net heated volume, net heated surface, and surface-to-volume (S/V) ratio. In addition, urban parameters were calculated with buildings’ information at blocks of buildings scale [14].
- ISTAT (Italian National Institute of Statistics) census section data (polygonal vector data), updated to 2011, gave information at block-of-building scale on people occupancy, number of inhabitants, number of families and family members, percentage of foreigners, gender, age, income, employment rate, socio-economic data (income at 2009), central or autonomous heating systems, and type of fuels.
- Urban parameters (polygonal vector data) at block-of-buildings scale were elaborated using Istat census database and municipal technical maps. The main variables were building density (BD), building height (BH), building coverage ratio (BCR), relative buildings’ height (H/Havg), canyon effect (H/W ratio), solar exposition, and main orientation of the streets (MOS) [15].
- Local climate data refers to weather stations’ measurements (punctual vector data) located in the city. Available hourly data refer to temperature, relative humidity, vapor pressure, and wind velocity of the outdoor air.
- Space heating and domestic hot water consumption data (punctual and polygonal vector data) were provided by the district heating IREN Company of the city. The annual, monthly, and hourly energy consumptions were processed and georeferenced. These data, used to design and validate urban-scale energy models, refer to three consecutive heating seasons: 2012–13, 2013–14, and 2014–15 [16,17,18].
- Energy performance certificates (EPCs) (punctual vector data) of the Piedmont Region gave information on residential buildings with 867,131 certificates in about 10 years. These data were used to evaluate the type of energy efficiency action and the impact retrofit interventions for the city of Turin [19].
After the processing of these data, the three main outputs used in this work were a 2D vegetation model, a 3D roof city model, and urban-scale energy models with annual, monthly, and hourly time resolutions.
2.2. GIS Tools: Analysis of Building and Roof Typologies
The analysis of roof typologies and the urban environment was carried out using several tools, explained below.
- Slope tool was used to assess the roof slope of each building using the DSM and the municipal technical map. From the simulation results, the roofs were classified into three categories: (1) Flat roofs with a slope <11°, identified as potential intensive green roofs; (2) pitched roofs with slope ≥11° and <20°, as potential extensive green roofs; and (3) and pitched roofs with slope ≥20° and <45°, as potential solar roofs [13].
- Aspect tool was used to assess the roof orientation using the DSM and the municipal technical map. Eight classes of roof surfaces’ orientation were identified according to aspect values (that varied between 0° and 360°). Considering slope values and roof orientation, the pitched roofs were classified into five categories: Gable roofs with North-South (N-S) orientation, gable roofs with East-West (E-W) orientation, hipped/pyramid roofs, shed roof, and half-hipped roof [20].
- Feature Analyst tool was used to analyze roof materials with orthophotos as input data [21] to classify surfaces according to the color tones. In addition, from orthophotos the three bands (red, green, and blue) were analyzed with a GIS tool in order to optimize the classification, identifying dark/black, medium, and light/white roofs’ colors.
- Area solar radiation tool was used to quantify the annual and monthly solar radiation values from the DSM. The quota of incident global solar radiation was quantified for each pixel (with a dimension of 0.5 m) and the hours of sunlight were calculated to identify sunny roofs (with three or more hours of sunlight) [22].
- Hillshade tool was used to create a shaded relief from the DSM by considering the illumination source angle and shadows, and in combination with other tools to evaluate roof-disturbing elements.
- Zonal Statistics tool was able to calculate statistics’ values of raster data for each roof surface. The roof-disturbing elements, such as dormers and antennas, were identified with the standard deviation using the orthophotos, the annual solar radiation analysis, and the hill–shade analysis. By overlapping the results of the statistical analysis, the disturbance percentage for each roof was assessed, identifying three classes of disturbance: 15, 25, and 35% [23].
Some outputs of the application of the described methodology are indicated in the following figures.
Figure 2a shows the building typologies of a district of Turin with a dimension of 1 km × 1 km. Such classification was made using information on type of users, building height, and the S/V ratio values. It is possible to observe that almost 80% of buildings are residential, mainly linear blocks and towers [13]. Figure 2b describes the roof typologies, distinguishing six categories: flat, gable with E-W orientation, gable with N-S orientation, half-hipped, hipped or pyramid, and shed. In this pre-analysis, it was noticed that there is a potential of flat roofs that could be converted into green roofs (Figure 3a), the presence of low buildings with dark surfaces could be converted to light surfaces (high-reflectance roof), reducing the environmental temperature (Figure 2a), and a large quota of residential buildings has an optimal E-W orientation for solar energy production (Figure 3b).
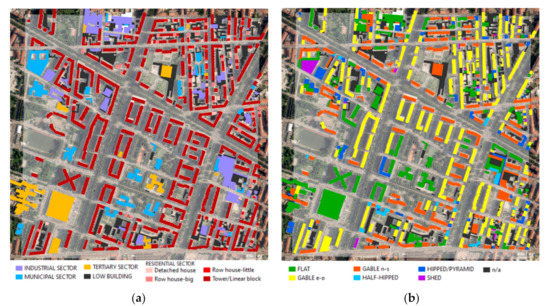
Figure 2.
District of Turin with a dimension of 1 km2: (a) Identification of building typology using type of users, building height, and surface-to-volume (S/V) value; (b) identification of roof typologies according to [23].
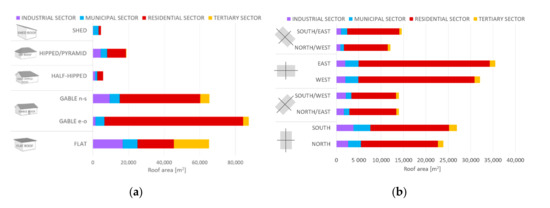
Figure 3.
District of Turin with a dimension of 1 km2: (a) Roof typology analysis and roof area; (b) building orientation analysis and roof area.
2.3. Roof Suitability: Analysis of Criteria to Assess Rooftop Renovations’ Feasibility
This section presents the criteria used to evaluate the feasibility of rooftop renovation and to identify the correct rooftop strategy as a function of urban environment. These criteria refer to building architecture, morphological context (Table 2), building codes, and regulations.
Table 2.
Criteria to assess rooftop renovation feasibility.
The information of buildings’ architecture and morphological context were investigated using the DBT presented in Section 2.1. According to Italian Standard (UNI) 11235:2015 and to the literature review [13,24,25,26,27], the following criteria were identified to select the potential roofs.
- Building height had to be higher than 3.5 m for green and solar roofs, while for albedo strategies (high-reflectance roof) it had to be less than 3.5 m in order to have the greatest effect on near-surface air temperatures.
- Roof area had to be greater than 100 m2 for green roofs; for high-reflectance roofs, greater than 20 m2; and it had to be greater than 50 m2 for solar roofs.
- Roof material and color tones for green and high-reflectance roofs were excluded; roofs with high reflectance and vegetated roofs, solar roofs, roofs with red tiles and/or disturbing elements, such as dormers and/or antennas, were excluded.
- Roof slope had to be less than 11° (flat roofs) for intensive green roofs and between 11° and 20° for extensive green roofs. There is no limit for high-reflectance roofs and it had to be between 20° and 45° (pitched roofs) for solar roofs.
- Roof orientation with northern exposition was excluded for solar technology, as north-facing rooftops receive less sunlight.
- Solar radiation: Roof area should receive at least 1200 kWh/m2/year of annual solar radiation for solar technologies. The solar energy potential was investigated, identifying the available rooftop areas and quantifying the total solar radiation on the rooftop.
- Shadow effects: More than 3 h of sunlight for green roofs are necessary to allow the growth of vegetation. Therefore, the shaded roofs (less than 3 h of sunlight) were excluded. In addition, the shadowing effects are important for the selection of the most appropriate plant species for green roofs.
The feasibility of energy efficiency interventions was assessed considering energy and environmental regulations at national and municipal levels. According to the Italian Decree 28/2011, some requirements were considered for the installation of solar energy technologies:
- Production of thermal from solar thermal (ST) collectors’ installation: At least 50% of the annual domestic hot water consumption must be covered by the ST production.
- Production of electricity from photovoltaic (PV) panels: The installed electric power, P, (in kW) must be greater than or equal to the value calculated with the following equation:where:
- P is the installed electric power (kW),
- K is a coefficient equal to 50 (m2/kW) after 1 January 2017, and
- A is the footprint area of the building (m2).
For roofing structures of buildings, verification of the effectiveness, in terms of cost–benefit ratio, was assessed referring to (according to Italian Decree 28/2011):
- Materials with high reflectance of roofs, assuming for the latter a solar reflectance value of not less than 0.65 in the case of flat roofs and 0.30 in the case of pitched roof.
- Passive cooling technologies (e.g., night ventilation and green roofs).
Furthermore, the Solar Reflectance Index (SRI) is used in the main international certification protocols for comparing the coolness of roof surfaces. In Italy some voluntary environmental protocols have been introduced, such as the ITACA (Institute for Innovation and Transparency of Procurement and Environmental Compatibility) protocol, Casaclima Nature certification, and the Green Building Council (GBC) Italia, in which SRI levels for roofs have been specified. In addition, from the enactment of the Italian Decree 11/01/2017, the Ministry for the Environment, Land and Sea has established the “Adoption of minimal environmental criteria (CAM) for the awarding of design services and new construction, renovation and maintenance work on buildings for management of construction sites of the public administration and minimal environmental criteria for the supply of incontinence aids”, thus aligning itself with environmental protection strategies adopted at an international level. The section “Reduction of impact on the microclimate and atmospheric pollution” establishes the requirement of materials with a high SRI (Table 3).
Table 3.
Italian voluntary protocols and requirements.
The Municipality of Turin regulates the roof elements through a number of rules, as shown in the image below. Current regulations determine rules to design roofs in relation to geometry, structural characteristics, heights, and architectural appearance. Such regulations also define restrictions to design intervention and uses according to functions and zoning of the masterplan, limiting, in particular, changes in the historical center of the city. Moreover, while the Building Annex Energy Code in place calls for environmental awareness by setting compulsory requirements for thermal insulation and derogations to enable the installation of solar and photovoltaic panels, the conversion into green surfaces is only mentioned within the voluntary requirements, leaving the economic burden to the private owners and the limitation of opportunities to out-of-date regulations.
To overcome such limitations, and after the identification of criteria to evaluate rooftops’ renovation feasibility, the rooftops’ potential was investigated for a district in Turin (IT) and the impact of smart-green technologies was evaluated and quantified using several indicators.
2.4. Impacts of Smart Roof Solutions and Technologies
From the literature review [8,28,29,30,31,32,33,34,35,36,37], it emerged that the main roof technologies able to obtain a positive impact on the urban heat island (UHI) mitigation, on the energy consumptions and savings, on the outdoor and indoor thermal comfort conditions, and on social and economic aspects are green and high-reflectance roofs and walls and the energy production from PV panels and ST collectors.
2.4.1. Energy Efficiency Solutions
To evaluate the energy savings after the rooftop renovation, the assessment of heat fluxes through the roof were quantified during the heating and cooling seasons. Different thermo-physical properties of the roofs, indicated in Figure 4, were used according to roof type: Common roof, common insulated roof (red tiles), insulated high-reflectance roof, and insulated green roof.
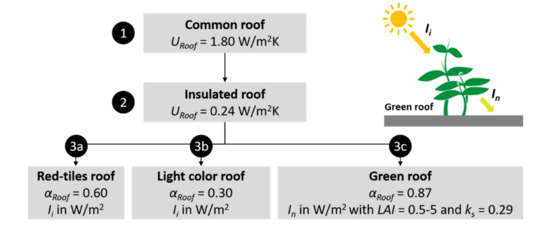
Figure 4.
Energy efficiency solutions’ scheme.
The roofs have different values of thermal transmittance (URoof) that depend on the type of insulations. URoof is taken to equal 1.80 W/m2/K for common roofs and 0.24 W/m2/K for insulated roofs (according to Italian standard) and has different solar absorption coefficients (αRoof) that depend on the roof-covering materials. The αRoof is equal to 0.6 for common roofs with red tiles, 0.3 for light-color roofs, and 0.87 for green roofs. The quota of solar radiation changes according to the presence of vegetation, the incident global solar radiation (Ii), was calculated according to global solar radiation recorded by weather stations, while the quota of incident solar radiation entering a green roof (In) depends on the Leaf Area Index (LAI), which is the ratio between the green area and the underneath soil area [38], and on the short-wave extinction coefficient (ks) [39].
Using green roof technology, the heat flow of solar radiation that enters the system is a net contribution taking into account the solar reflection and green absorption. Equation (2) describes the exponential law developed by Palomo Del Barrio [40] used in this work to assess the effect of green roofs on incident global solar radiation:
where:
- is the solar irradiance entering the system (W/m2);
- is the incident solar irradiance (W/m2);
- is the short-wave extinction coefficient (-), which was assumed to equal 0.29 (values proposed for similar vegetation characteristics in [40]); and
- is the ratio between the green area and the underneath soil area (-), which was assumed to equal 5 in summer, 3.5 in spring, 3 in autumn, and 0.5 in winter [38,39].
To assess the energy savings of a building, due to the roof component, some simplified assumptions were made: (1) The heat flow rate from internal gains was constant; (2) the heat flow rate dispersed by ventilation was constant; (3) the evapotranspiration of green roofs was not considered; and (4) and the thermal capacity of different roof typologies was equal.
The energy savings for space heating and cooling were quantified calculating the hourly heat flow rates before and after the rooftop retrofit interventions with the following equations [39]:
| with: | with: | |
where:
- is the energy savings during the heating season (Wh);
- is the energy savings during the cooling season (Wh);
- is the roof area (m2);
- is the thermal transmittance of the roof (W/m2/K);
- is the thermal resistance of the roof (m2K/W);
- is the internal air temperature during the heating season equal to 20 °C;
- is the internal air temperature during the cooling season equal to 26 °C;
- is the sol–air temperature, which was introduced to take into account not only the external air temperature but also the incident solar irradiation absorbed by the roof (°C);
- is the internal surface temperature of the roof (°C);
- is the external air temperature (°C);
- is the solar absorption of the roof (-);
- is the incident solar irradiance (W/m2), which with green roof was equal to (see Equation (2)); and
- is the external thermal adductance (W/m2/K).
The primary energy savings for space heating and cooling were quantified as the sum of the hourly energy savings during, respectively, the heating and cooling seasons divided by the efficiency of the systems:
where:
- is the primary energy savings during the heating season (Wh);
- is the primary energy savings during the cooling season (Wh);
- is the average seasonal efficiency of the heating system (in Italy, for residential buildings, this value varies between 0.65 and 0.75 (-)) [17]; and
- is the average seasonal energy efficiency ratio, which depends on the efficiency of air conditioners (in Italy, for a typical heat pump (air/air) this value is about 3).
Following the energy savings obtained from the retrofit of the rooftop, the GHG emissions’ reduction was quantified.
Green Roof Technology
Green roofs alleviate UHI effect through the raising of surface albedo [41] and, so, can reduce the air temperature through evaporation [30] and thermal insulation [42,43]. Therefore, green roofs and walls help in the reduction of energy consumption and guarantee an excellent thermal behavior in both heating and cooling seasons with consequent good thermal comfort conditions, thanks to the high thermal inertia technology [44,45,46,47]. Figure 5 shows the heat flows through the roof during the heating and cooling seasons, where Qsol is the quota of solar gains and Qsol,n is the quota of solar gains that enters the system.
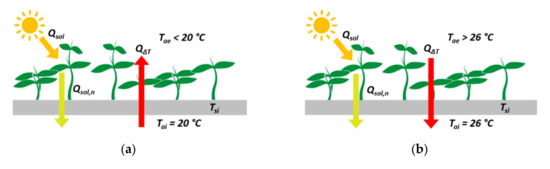
Figure 5.
Schematic diagram of green roof during (a) heating season and (b) cooling season.
The thermal conditions of buildings and urban environments were investigated at urban scale using two parameters: The ‘Normalized Difference Vegetation Index’ (NDVI) and the ‘Land Surface Temperature’ (LST). According to recent studies [31,32], the LST and the external air temperature decrease more or less rapidly as the green areas increase, depending also on the type of urban morphology. The local climate conditions were assessed before and after the installation of green technologies.
High-Reflectance Roof Strategy
High reflectance of roofs, identified as albedo strategy, is able to maximize the diffuse reflection of solar radiation, reducing the overheating of buildings and the surrounding urban context and maintaining lower surface temperatures [24,48]. From past studies on UHI mitigation, it has become accepted that a high level of albedo (as white roofs) has the potential to cool cities by 1–3 °C, cooling the lower states/layers of the atmosphere [49,50,51]. In particular, since in the urban canyon white roof has the greatest effect on air temperatures when used on buildings of 1–2 stories’ height [24], in this work low buildings were identified as suitable for this strategy. Moreover, the beneficial effects are greater in a mixed urban morphology context, such as the case of the Turin district analyzed in this work.
As previously mentioned, the SRI, used in the main international certification protocols, is a metric for comparing the coolness of roof surfaces. The higher the SRI, the cooler the roof will be in the sun [28,52]. For example, a clean black roof usually has an SRI of about 0 (with a solar reflectance of 0.05 and an infrared emittance of 0.90), while a clean white roof could have an SRI of about 100 (with a solar reflectance of 0.80 and a thermal emittance of 0.90). In general, dark roofs have an SRI less than 20 [53].
In this work, the effect of albedo strategy on thermal conditions was investigated calculating the SRI and the roof surface temperature (Ts) based on solar reflectance (ρ) and infrared emittance (ε). According to ASTM E1980-11(2019) standard, SRI can be defined as:
with:
where:
- is the steady-state temperature of a black surface (K) with solar reflectance of 0.05 and infrared emittance of 0.9, under the standard solar and ambient conditions with a solar flux of 1000 Wm−2, ambient air temperature of 310 K, convective coefficient of 12 Wm−2·K−1 surfaces, and apparent sky temperature of 300 K;
- is the steady-state temperature of a white surface (K) with solar reflectance of 0.80 and infrared emittance of 0.9, under standard solar and ambient conditions;
- is the temperature of the roof surface (K) under the standard solar and ambient conditions;
- is the solar absorptance of the roof surface (-) equal to ;
- is the solar reflectance of the roof surface (-); and
- is the Stefan–Boltzmann constant, 5.67 × 10⁻⁸ (Wm−2·K−4). Table 4 shows typical roofing materials with solar absorption (α), solar reflectance (ρ), and infrared emittance (ε) values used in this work to quantify SRI and Ts before and after roof renovation using the albedo strategy.
Table 4. Solar performance of roofing materials [48,56].
In the analyzed district, the values of roofing material properties refer to ‘generic black shingle’ for dark and black roofs, ‘gray Ethylene-Propylene Diene Monomer (EPDM)’ for medium roofs, and ‘white EPDM’ for white and renovated roofs. The values of SRI and Ts were calculated both at building scale and at blocks-of-building scale to evaluate the external conditions.
The main problem of this strategy is that over time the solar reflectance values of high- reflectance roofs decrease due to the accumulation of surface dirt and the degradation of the material by about 0.15 mainly during the first year [54]. The emission, however, does not decrease significantly, and washing the roof surfaces could restore the roof solar reflectance to 70%–100% of the original values [55].
Since most roofs are not washed frequently, it is necessary to evaluate aged values of solar reflectance and infrared emittance values to predict energy savings. If aged values of a roof are unknown, it is possible to estimate the aged solar reflectance (Agedρ) based on the initial solar reflectance (Initialρ) by using the following equation:
Referring to LEED (Leadership in Energy and Environmental Design) environmental protocol is also possible to assess mixed nonroof and roof measures, using the following relation as a function of area surfaces (A):
Solar Energy Technology
Solar thermal (ST) collectors and photovoltaic (PV) panels that exploit renewable energy sources (RES) provide environmental and economic benefits [57,58,59].
In this work, the solar technologies were assessed considering the potential roofs’ area with better solar exposition. In Italy, the most used types of low-temperature ST collectors are flat glass collectors with high efficiency and low cost and vacuum tubes, which have greater efficiency compared to flat glass collectors, due to the lower dispersions by thermal convection inside the vacuum tubes, but higher cost [60]. On average, a solar thermal system in Italy has a monthly efficiency of 40–85% with flat collectors and 70–86% with vacuum tubes; a collection area of 0.7–1.2 m2/person for flat collectors and 0.5–0.8 m2/person for vacuum tubes (considering the production of domestic hot water), with the month of maximum solar radiation being considered for the dimensioning; and a cost of 1000 euro/m2 for flat collectors and 1200 euro/m2 for vacuum tubes.
Regarding PV modules, the efficiency of converting solar energy into electricity varies mainly according to the type of technology chosen. The average efficiency values vary from 22% (high efficiency monocrystalline silicon) to 4% (amorphous silicon). The cost of a PV solar system depends on the installed power, which is around 2000 euro/kWp where kWp is the peak power). The capturing surface depends on the efficiency of the module and ranges from 5.5 m2/kWp for high efficiency monocrystalline silicon to 11 m2/kWp for amorphous silicon.
In assessing the efficiency of converting solar energy, it is also necessary to consider the energy losses of all system components, in addition to solar panels; it is estimated to be around 20–25%.
The GIS tool ‘Area solar radiation’ was used to quantify how much solar radiation each rooftop in the district receives throughout the year. The sun and sky models were elaborated, considering the monthly data of atmosphere transparency (τ) and ratio of diffuse radiation to global radiation (ω) identified from the ‘Photovoltaic Geographical Information System PVGIS’ of Joint Research Centre (JRC). In particular, considering the period 2013–14, τ was taken to equal 48%, 62%, and 72% in winter, midseason, and summer periods, respectively, and ω was taken to equal to 48%, 45%, and 35%, similarly.
According to European Standard (EN) 12975-2:2006 and Italian Standard (UNI) 11300-4:2016, the two typologies of ST collectors have, on average, respectively, zero-loss efficiencies η0 of 0.94 and 0.88, linear heat loss coefficients a1 of 3.34 and 1.57 W/m2/K, quadratic heat loss coefficients a2 of 0.02 and 0.01 W/m2/K2, and, for the whole system, a performance ratio of 75%. Then, their monthly efficiencies vary from 0.37 to 0.87 for the flat glass collectors and from 0.69 to 0.87 for the vacuum tubes.
The PV modules have an efficiency of 15% (standard efficiency polycrystalline silicon module), and both PV and ST have a system performance around 75%. The hypothesized ST areas were dimensioned in order to not have an overproduction of hot water during summertime.
The monthly energy consumption was simulated for a district of Turin as follow:
- For the residential sector, space heating consumption refers to measured data for the season 2013/2014 [17] and domestic hot water consumption was calculated taking into account that a person needs 50 L of water per day at a temperature of 45 °C (water temperature variation is 30 °C). For the nonresidential sector, space heating and domestic hot water consumption were quantified knowing, for different users, the specific consumption in kWh/m3 and the heated volume (m3) [16];
- For the residential sector, electrical consumption refers to the average monthly consumption of 1206 families for the years 2013 and 2014 [61]. For the nonresidential sector, electrical consumption (kWhel) was quantified knowing specific annual consumption in kWhel/m3 and the heated volume (m3) [62].
3. Results
This section describes the main results obtained by applying the methodology presented to a district of the city of Turin, ‘Pozzo Strada’. Turin is located in the northwest of Italy, in the Po valley, and it is characterized by a temperate-continental climate, with cold winters and a shorter but hot summer. According to Italian standard UNI 10349:2016, Turin’s climate is characterized by 2648 heating degree day (HDD) at 20 °C and 84 cooling degree day (CDD) at 26 °C. The results of this study were presented for a district with a dimension of 1 km2 with 21,520 inhabitants and more than 1000 buildings.
3.1. Model Application
In the selected district, 1228 buildings were analyzed. Of these buildings, 1097 were classified as potential rooftop renovation opportunities, distinguishing three types of smart solutions: Green roof technology, high-reflectance strategy, and energy production from ST collectors and PV modules.
According to [23], in order to give a priority of interventions, critical areas with the worst air quality conditions were identified as priority areas for the installation of green roof technologies (Figure 6a, red areas) to mitigate the UHI effect. The other areas, with mainly residential buildings, were considered for solar energy production using ST collectors and PV panels. Solar technologies were dimensioned considering residential and nonresidential demand. Figure 6b shows the rooftop classification, distinguishing these three types of smart solutions.
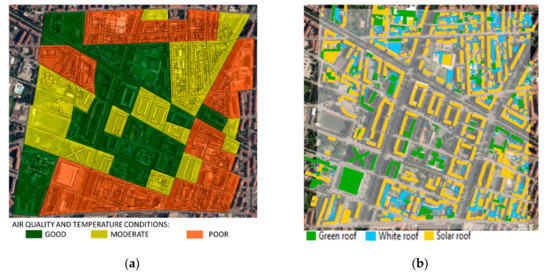
Figure 6.
District of Turin with a dimension of 1 km2: (a) Building block classification according to three classes of air quality conditions (green, good; yellow, acceptable, red, bad) [23]; (b) analysis of roof potential and feasibility of smart solutions: Green, high-reflectance, and solar roofs.
The main characteristics of the buildings selected as potential are indicated in Table 5. It is possible to observe that, thanks to the typical urban mix of Turin, the retrofit measures are well distributed within the district and, moreover, there is a consistent potential. For this reason, it is important to encourage the buildings’ renovation – in this case the rooftop renovation—especially in consolidated urban contexts where energy efficiency measures to intervene on buildings are limited.
Table 5.
Buildings’ characteristics.
3.2. Smart Roof Solutions’ Assessment
This subsection describes the main results obtained from the use of three smart solutions: Green roof technology, high-reflectance roof strategy, and solar energy technology. The aim was to harness the potential of urban rooftops in a district in the city of Turin.
3.2.1. Green Roof Technology
In the district analyzed, 64,712 m2 of roofs were identified as potential green roofs. Referring to Equation (3), the energy savings for heating and cooling seasons were quantified for a district in Turin. In this scenario, potential roofs were renovated using green roof technologies. The thermal transmittance with green technologies is equal to 0.24 W/m2/K (according to Italian Decree 26/6/2015) and the solar absorptance of a green roof surface is 0.87 [48,56]. The energy savings after the installation of green roofs was equal to 5669 MWh/year, which corresponds to 8.4% of space heating consumptions of residential buildings. The energy savings during cooling season was equal to 662 MWh/year. Figure 7 describes the energy savings at block-of-building scale, distinguishing heating and cooling seasons.
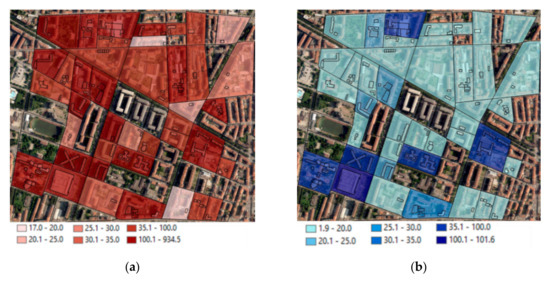
Figure 7.
Green roofs’ potential assessment at block-of-building scale: (a) Heating and (b) cooling primary energy savings in MWh/year.
Thermal conditions were investigated using some parameters calculated at block-of-building scale from satellite images (Section 2.1.). These parameters are the NDVI and the LST and allow us to describe the UHI effect and the local-climate characteristics of the urban environment. An analysis at blocks-of-building scale was made, and Figure 8a shows the variation of LST before and after the installation of green roof technologies. According to the literature review [34,35], the LST and the air temperature tend to decrease more or less rapidly as the green areas increase, depending also on the type of urban morphology. Increasing the green roofs’ areas of 64,712 m2, on average, the LST in the district tends to decrease by 1 °C (Figure 8b).
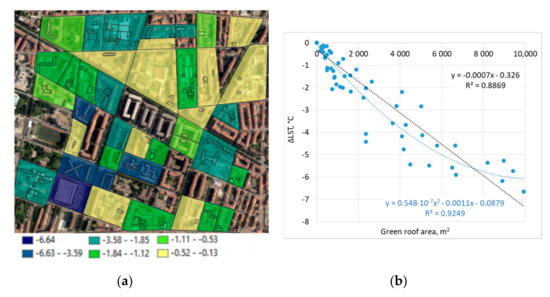
Figure 8.
Green roofs’ potential assessment at block-of-building scale: (a) Thermal condition assessment, Land Surface Temperature (LST) variation before and after the installation of green roof technologies; (b) correlation between the LST variation and the quota of green roof area.
The feasibility of green roof technology was assessed considering requirements the Ministerial Decree 26/06/2015. The roofs’ albedo in the district analyzed varied between 0.05 and 0.26 (for a few buildings, mainly industrial, the albedo was around 0.33) [23]. After retrofit measures with green roofs, the roof albedo criterion was respected due to the installation of passive cooling technology.
3.2.2. High-Reflectance Roof Strategy
Starting with 500 low buildings located in the district of Turin, 417 were selected as potential for the renovation of rooftop with white color (high-reflectance roof). Of these 417 potential buildings, which corresponded to an area of almost 45,000 m2, 313 had a slope less than 8.5° and 104 had a higher slope (on average, had slope of 8.8°, see Table 5). Figure 9 shows the SRI values calculated for each block of buildings. The SRI values are weighted according to the m2 of each roof. Figure 9 shows the SRI roof values at block-of-building scale, before (Figure 9a) and after (Figure 9b) the use of high-reflectance roof strategy on 417 potential roofs. From the results, it emerged that it is possible to obtain an increase in SRI of almost 30 and a reduction of Ts of over 10 °C. Therefore, these indicators could help designers and consumers to choose the proper materials for sustainable buildings and communities.
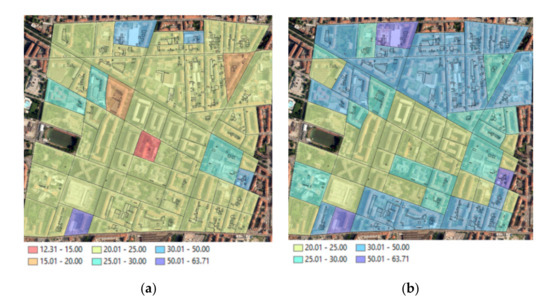
Figure 9.
Solar Reflectance Index (SRI) (%) values of existing roof at block-of-building scale: (a) Before (b) and after high-reflectance strategy.
The feasibility of high-reflectance roof strategy was assessed according to the Italian Decree 11/01/2017 and the environmental protocols. The SRI prerequisites (SRI > 0.29) were respected.
3.2.3. Solar Energy Technology
After the analysis of monthly and annual solar radiation on each rooftop (Figure 10), taking into account 570 heated, pitched buildings and roof surface with annual solar radiation higher than 1200 kWh/m2/year, the ST collectors and PV modules were dimensioned according to domestic hot water consumption and electrical consumption of residential and nonresidential users.
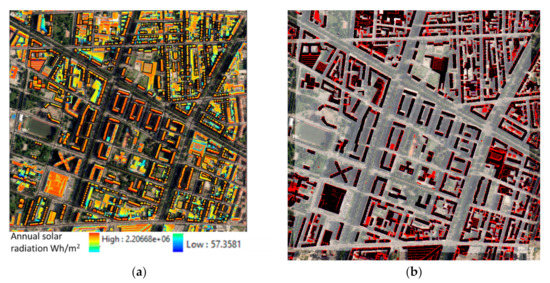
Figure 10.
Solar energy technology assessment: (a) Annual solar radiation, solar roofs are identified with a black outline; (b) identification of areas (in red) with annual solar radiation <1200 kWh/m2 (not suitable for solar energy production).
According to the Italian Decree 28/2011, 50% of domestic hot water consumption of residential sector is covered by ST collectors. The percentage reaches 100% in June, while in the winter months (December and January) ST production is able to cover about 7% of the residential consumption (Figure 11a). In addition, there is a GHG emission reduction of 1958 ton/CO2/year. The requirements indicate that 50% of consumption must be covered; this dimensioning is appropriate, given that in July hot water can only be used to cover domestic hot water.
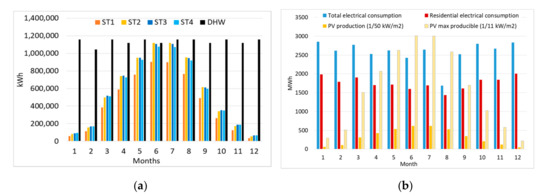
Figure 11.
Solar energy technology assessment (for the 2014 year): (a) Comparison between domestic hot water (DHW) consumption of residential sector and solar thermal (ST) production considering four collector typologies (collectors’ annual average efficiency: ST1 = 0.59, ST2 = 0.77, ST3 = 0.80, and ST = 0.79); (b) comparison between electrical consumption, photovoltaic (PV) production with coefficient K = 50 m2/kW (according to the Decree 28/2011), and PV max producible.
The PV panels can be dimensioned in two ways: By covering 100% of consumption in the month of maximum irradiation or by reaching 100% of annual self-consumption, taking into account that the overproduction in the summer months that is fed into the grid will be consumed in winter. In this work, the PV panels were dimensioned according to the National Decree 28/2011 using the footprint area of the buildings (A), where the installed power is equal to A divided by a K coefficient = 50 (Figure 11b). According to the installed power and the annual utilization hours of use (in the Piedmont region are 1130 h), the electricity produced from PV panels was compared to the electrical consumption. Therefore, knowing that a typical Turin family needs about 2000 kWhel/year for electricity supply and, in the district analyzed, the number of families is equal to 10,638 (ISTAT data, 2011), the 13% of the annual residential and nonresidential electrical consumption has been covered with a GHG emission reduction of 1853 ton/CO2/year. Considering only the residential sector, PV production covers the 18% of electricity consumption. In the summer months it covers 38% and in the winter months, 2–3%. Table 6 shows the total roof area, the quota well exposed with no disturbances (15–35%), the quota used for the ST collectors to satisfy the domestic hot water (DHW) consumptions, and the quota for the PV panels, as requested by the standards (1/50 kW/m2). Using the maximum energy potential that can be produced from PV panels with the left available roof area, it is possible to cover 82% of residential electrical consumption; with the reverse procedure, an optimal value of K of about 11 m2/kW was calculated.
Table 6.
Roof area for solar energy production.
From this analysis, it emerged that to reach the 50% coverage of domestic hot water, heating, and cooling consumption, it is necessary to use not only solar technologies but also other renewable energy technologies, such as the energy taken from the cold source with heat pumps for heating or PV panels for cooling. In fact, in the city, there are few renewable energy sources available, but there are sources that can be exploited in public spaces, such as the PV panels on shelters, micro-power plants (of which in Turin city there are three) and mini-wind on commercial buildings, considering the acoustic impact.
3.3. Energy Savings: Heating and Cooling
Green and high-reflectance roofs (cool roofs) have a significant effect in reducing energy consumption during cooling and heating seasons. In accordance with literature review [38,63,64,65,66,67], from this work it emerged that cool roofs are more effective in reducing heat gain in the cooling (C) season from 15 April to 14 October, than heat loss in the heating (H) season from 15 October to 14 April (Figure 12).
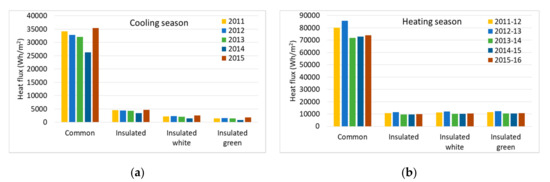
Figure 12.
Comparison of heat fluxes (Wh/m2) between common roof, insulated common roof, insulated high-reflectance roof, and insulated green roof: (a) Cooling season; (b) heating season.
This analysis was carried out using weather data measurement recorded by Politecnico weather station (WS) for the period from 2011 to 2016. The thermal performance of a refurbished roof was compared to the typical common roof. In particular, three roof solutions were taken into account: (1) Insulated common roof, (2) insulated high-reflectance roof, and (iii) insulated green roof. The heat flux (Q) in the roof was quantified according to Equation (3). Table 7 describes the characteristics of roof solutions and the main energy efficiency results. GHG emissions were quantified using 0.210 tonCO2/MWh for natural gas and 0.46 tonCO2/MWh for electricity [68].
Table 7.
Characteristics of roof solutions and energy efficiency results.
Figure 13 and Figure 14 show the results for three consecutive hot days (21–23 July 2015) and cold days (15–17 January 2012). From the comparison of hourly heat fluxes (W/m2) between common roof, insulated common roof, insulated high-reflectance roof, and insulated green roof, it emerged that using an insulated green roof there was less heat gain during the summer season and with an insulated roof there was less heat loss in the winter season.
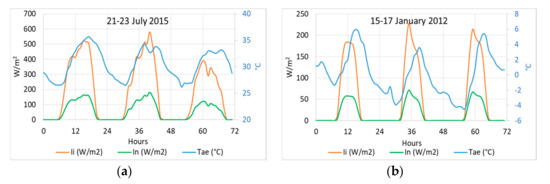
Figure 13.
Hourly values of global solar radiation (Ii), solar radiation entering in the system (In), and the external air temperature (Tae) for three consecutive days: (a) 21–23 July 2015; (b) 15–17 January 2012.
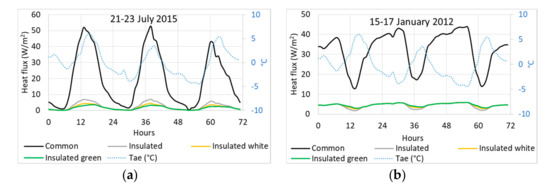
Figure 14.
Comparison of hourly heat fluxes (W/m2) between common roof, insulated common roof, insulated high-reflectance roof, and insulated green roof for three consecutive days: (a) 21–23 July 2015; (b) 15–17 January 2012.
This methodology, used to evaluate the effect of green and cool roofs, will be implemented in future work, adding the effect of evapotranspiration on energy performance of a building.
4. Discussion
The project Re-Coding represents an experience of updating current codes and normative framework to shape the morphology of a sustainable city. This project approach is a multiscale method that, from code design to city scale, can actively trigger sustainable impact by design. The relevance of this work is to be found in a number of aspects that can be generalized and suggested for future processes of normative updates to support sustainable development and environmental resilience, such as in the example shown about the roofs. In particular, a number of lessons can be drawn out from this experience and shared as general knowledge: (1) The institutional vision and wish to review and implement codes and normative framework is crucial to foster environmental sustainability change and resilience [69,70] and (2) the work of multidisciplinary research centers such as FULL and R3C allowed us to analyze the understanding of the local normative framework and to update it on scientific-based solutions related to global-based knowledge advancement. Moreover, this work was crucial to increase the interfaces between clients, institutions, and practitioners, through the study of specific building elements, such as the one of the roofs. In this regard, although the methodology was applied to a limited number of neighborhoods in Turin, it was possible to highlight the potential of the roof surfaces of the overall city. This was possible, in particular, by understanding the relation between such potential changes and the current normative framework in use. Despite few rules limiting the use of roofs in the city, concerned mainly with the zoning of the city center, most of the potential uses are actually possible. Figure 15 summarizes the application of the results found after the application of the methodology that was utilized in support of the decision-making process that the Municipality of Turin undertook to revise its local environmental regulation. Moreover, the proposed methodology showed that it is possible to extend actions both to improve the energy performance of the building and environmental performance and to increase the intensity of use of flat surfaces and the related social impact. A latter process could be triggered widely through subjective and individual actions of the owners of the space under the roof that could be the potential users of that space or open these spaces to an urban and collective dimension. As explained in the following sections, many are the environmental, social, and economic benefits by the potential use of roof surfaces.
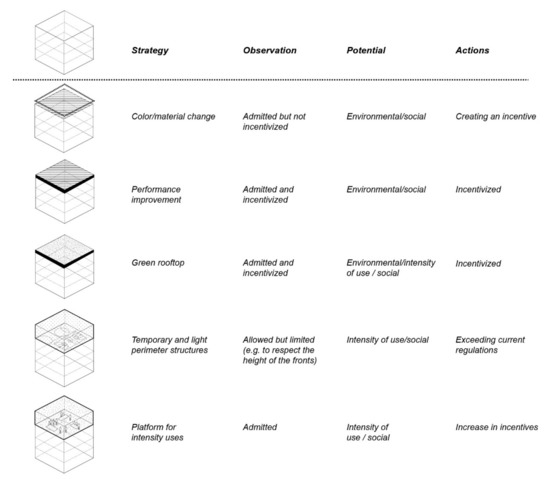
Figure 15.
Application of the results: Re-Coding activities.
4.1. Impact Assessment of Urban Rooftops’ Renovation
The achievement of resilient and sustainable cities depends on several factors, such as the characteristics of territory, the urban morphology, the energy performance of buildings, and the existing laws, constraints, and regulations. There is no one solution to reach this goal, but there are different low-carbon strategies, some of which are presented in this work. In particular, three rooftop renovation strategies are presented, and the effect of the use of these strategies was assessed for the city of Turin at district level.
4.1.1. Environmental, Social, and Economic Benefits
As it will be highlighted in the following subsections, the environmental, social, and economic impacts of rooftop ‘green’ renovations are widely recognized. Such benefits could be summarized as energy consumption reduction, UHI and air pollution mitigation, water management, sound insulation, and noise reduction, as well as ecological preservation, real estate market positioning improvement, building value increase, and psychological effects on the direct and indirect users, triggering economic and social activities, factors of enjoyment, concentration improvement, crime reduction, and productivity and creativity improvement. [8,36,37,71,72,73].
Environmental Benefits
At the environmental level, Berardi et al. [71] explained that the benefits of green roofs are multiple, such as: Energy consumption reduction, UHI and air pollution mitigation, water management, sound insulation, and noise reduction, as well as ecological preservation.
In the literature, several studies investigated energy savings and environmental benefits after the use of green roofs, high-reflectance roofs [48,65,73,74,75,76,77], and solar technologies [55,56,57]. For example, increasing urban albedo can reduce summertime temperatures, resulting in better air quality and savings from reduced air-conditioning costs [78]. Akabari et al. [78] found that converting 100 m2 of dark roof to white offsets the emission of ∼10 tons of CO2, equivalent. Moreover, 100 m2 of green roof has a one-time global warming offset potential of 3–4 tons of CO2, equivalent [79].
From the results of this work, it emerged that, through the retrofit of the roof, using, for example, green roof, environmental benefits can be obtained, thanks to the reduction of space heating and cooling consumption and, consequently, the reduction of GHG emissions with an improvement of urban thermal conditions. In future work, more detailed analyses will be made for some buildings’ blocks located in the same district using the ENVI-met software [80]. This tool, based on a holistic model, is able to simulate local climate conditions in an urban environment and to assess the effects of green technologies on energy savings and thermal comfort conditions.
Economic Benefits
The economic benefits of green roofs are widely discussed in literature over at least a decade [71,72,73,81,82,83,84,85,86].
Teotónio et al. [81] explained that different economic evaluations of green roof systems give a high variability of results. Moreover, Teotónio et al. [81] reported that, from a financial perspective, green roofs’ investments usually lead to financial losses of 19–50%, given their limited private benefits, whereas, from an economic and socio-environmental perspective, green roofs are mostly identified as interesting investments, leading to gains of 24–40%. Castleton et al. [73] reported that, in terms of whole-life cost analysis, the Net Present Value (NPV) of a green roof is 10–14% more expensive than a conventional roof over a 60-year lifetime. Yet, Bianchini et al. [82] explained that a reliable encompassing lifecycle net benefit-cost analysis, or any other calculation systems, should also take into consideration personal costs and benefits, initial construction cost, property value, tax reduction systems in place, storm water retention and avoidance in drainage system, energy reduction (both in terms of cooling and heating), plant longevity benefits, and operational and maintenance costs. Moreover, Sproul et al. [79] demonstrated a considerable variation in the economic value of white, green, and black flat roofs.
Bianchini et al. [82] also stated that:”… Green roofs provide personal and social benefits…there is a low financial risk for installing any green roof type. Additionally, from a personal perspective, the potential profit of an intensive green roof is much higher than its potential losses. Vegetative roofs are a personal investment. However, over the lifecycle of these roofs, both personal and social sectors derive economic benefits. In fact, when social costs and benefits are considered in the NPV estimation, the profitability of the investment is higher. Installing green roofs would be an even more attractive business, if social benefits were partially transferred to investors. The governments should promote green roof construction by reducing insurance premiums and partially subsidizing maintenance costs. These incentives will enhance green roof construction on new and existing buildings with added social environmental benefits.”
Moreover, according to the monitoring activities on the real estate market in Italy, ENEA (Italian National Agency for New Technologies, Energy and Sustainable Economic Development) ‘Istituto per la Competitività (I-Com)’ and the ‘Federazione Italiana degli Agenti Immobiliari Professionisti (FIAIP)’ show a strong correlation between the performing energy classes, potentially improved by the greening process of roofs, among other factors, and the trend in the real estate market. The general positive trend in 2019 showed a progressive reduction of buildings sold falling into the poorest energy class (G), which was around 40% for one-room and two-room apartments, 37% for three-room apartments, around 34% of single-family villas, and 24% for villas. Especially for these last two categories of homes, the improvement in the figure compared to the previous year is very positive. The signals coming from the renovated buildings’ segment are also positive, with the percentage of buildings belonging to the best-performing energy classes (A +, A, and B) going from 10% in 2017 to 22% in 2018.
Social Benefits
Different social benefits have been associated with the green roof and rooftop utilization in general. Shafique et al. [31] explained that among the benefits of roof utilisation, green roofs, in particular, the relief from the concrete construction by introducing the green space in urban areas seems to be the most significant. This is due to the ability of green roofs to provide pleasant effects to the urban inhabitants by reducing the air and noise pollution. The authors also explained that the use of roof spaces attract the eyes and tried to connect people together, thanks to the possible plurality of activities. The use of roofs might also enhance the property values [31]. Oberndorfer et al. [86] also explained that: “…living roofs also provide aesthetic and psychological benefits for people in urban areas. Even when green roofs are only accessible as visual relief, the benefits may include relaxation and restoration, which can improve human health. Other uses for green roofs include urban agriculture: food production can provide economic and educational benefits to urban dwellers.” Moreover, Williams et al. [87] stretched the concept of the use of roofs, as well as their greening process, as a factor of enjoyment, concentration improvement, crime reduction, and productivity and creativity improvement, as well as helping behaviors among citizens. Williams et al. [87] also reported that: ”…Studies from Canada and Finland demonstrate that many visitors to case study green roofs report positive aesthetic and restorative experience. A post-occupancy evaluation of gardens in a hospital setting, including several roof top gardens, found psychological benefits for patients including emotion respite.” The authors also explained that not only green roofs can provide such benefits, but also that the plurality of activities and functions that can be performed on roofs can enable a variety of socially positive effects related to the increase of well-being.
4.2. Smart Green Policies for Rooftop Renovation and Management
Berardi et al. [71] explained that a number of cities have already implemented successful policies to enable the diffusion of green roofs. The city of Tokyo has requested the implementation of green roofs in private buildings with built areas larger than 1000 m2 and in public buildings with built areas larger than 250 m2. Moreover, Berardi et al. [71] reported that, in 2014, Germany had in place a supporting program to facilitate the construction of 13.5 million m2 of green roofs per year. Cities, such as Esslingen, offered 50% of the cost of green roofs back or Darmstadt Municipality allocated an economic benefit of maximum of euro 5000 for a green roof. Berardi et al. [71] also explained that: ”…In the cities of Bonn, Cologne and Mannheim, the allocated storm water fees are considerably reduced once new green roofs are built. Similar policies have been implemented in other countries such as Switzerland and Austria. In Basel, users are repaid 20% of the cost of a green roof. In Toronto, there have been specific policies to promote green roofs in buildings with the ratio of 50–70% of the entire building coverage. In Quebec, an economic incentive is provided per square meter implemented of green roofs.”
The results of the study supported the definition of urban rules and regulation to improve the quality of life and livability, to promote a sustainable development of urban environment, and to identify effective energy policies for a more resilient city in the case of the Municipality of Turin. In particular, this work was formally included into the working papers of the Municipality of Turin. These documents are the technical knowledge-based support, on which the review process of the City Masterplan of the City of Turin is officially based [87].
5. Conclusions
This paper presented the work carried out within the Re-Coding project, a multidisciplinary exploration carried out by FULL and R3C at the Polytechnic of Turin, in collaboration with the Municipality of Turin. The study analyzed the role of regulation in fostering or hindering sustainable development and in supporting the Municipality of Turin to simplify, disambiguate, and redefine the local current environmental regulation system. The study particularly focused on the exploration of the role of the roof element, as fifth facades of buildings.
The study has evaluated the potential, feasibility, and impact of the rooftops’ renovation for a district of Turin. The results of this investigation confirm that the use of green roofs and the production of energy with solar thermal collectors and photovoltaic panels mitigate the urban heat island effect, reducing energy consumption with environmental, economic, and social benefits.
In line with [4], the study supported the idea that simple regulation can support and foster the transformation of cities toward a more sustainable and resilient built environment. Further studies will need to be conducted with the aim of monitoring and updating the future transformations of our cities, based on regulation updates. To this end, the approach of this work will need to consider the call for an ongoing normative review system in line with technological advancement, as well as in line with [88] the ability of institutions to envision and promote a sustainable and resilient vision for our cities. As [8] explained, understanding the opportunities of sustainable codes and regulations can contribute to the development and management of our future sustainably built environment, as the built environment and its environmental governance can still be considered the reflection of the societal changes that we decide to address [89].
Author Contributions
Conceptualization: V.T., G.M., L.B., M.N., and M.R.; methodology: V.T. and G.M.; formal analysis: V.T. and G.M.; writing—original draft preparation: V.T., G.M., L.B., and M.N.; writing—review and editing, V.T., G.M., L.B., M.N., and M.R. All authors have read and agreed to the published version of the manuscript.
Funding
This research received no external funding.
Conflicts of Interest
The authors declare no conflict of interest.
References
- Shen, B.; Ghatikar, G.; Lei, Z.; Li, J.; Wikler, G.; Martin, P. The role of regulatory reforms, market changes, and technology development to make demand response a viable resource in meeting energy challenges. Appl. Energy 2014, 130, 814–823. [Google Scholar] [CrossRef]
- Lehnerer, A. Grand Urban Rules; 010 Publishers: Rotterdam, The Netherlands, 2009. [Google Scholar]
- Marshall, S. Urban Coding and Planning; Routledge: London, UK; New York, NY, USA, 2011. [Google Scholar]
- Moroni, S.; Buitelaar, E.; Sorel, N.; Cozzolino, S. Simple Planning Rules for Complex Urban Problems: Toward Legal Certainty for Spatial Flexibility. J. Plan. Educ. Res. 2018, 40, 320–331. [Google Scholar] [CrossRef]
- Oswalt, P.; Overmeyer, K.; Misselwitz, P. Urban Catalyst: The Power of Temporary Use; DOM Publishers: Berlin, Germany, 2013. [Google Scholar]
- Baum, M.; Christiaanse, K. City as Loft: Adaptive Reuse as a Resource for Sustainable Urban Development; Gta Verl: Zürich, Switzerland, 2012. [Google Scholar]
- Slaughter, E.S. Implementation of construction innovations. Build. Res. Inf. 2000, 28, 2–17. [Google Scholar] [CrossRef]
- Nigra, M.; Dimitrijevic, B. Is radical innovation in architecture crucial to sustainability? Lessons from three Scottish contemporary buildings. Arch. Eng. Des. Manag. 2018, 14, 272–291. [Google Scholar] [CrossRef]
- Mutani, G.; Todeschi, V. An Urban Energy Atlas and Engineering Model for Resilient Cities. Int. J. Heat Technol. 2019, 37, 936–947. [Google Scholar] [CrossRef]
- Mutani, G.; Todeschi, V.; Matsuo, K. Urban Heat Island Mitigation: A GIS-based Model for Hiroshima. Instrum. Mes. Métrologie 2019, 18, 323–335. [Google Scholar] [CrossRef]
- Taha, H.; Sailor, D.; Municipal, S. High-Albedo Materials for Reducing Building Cooling Energy Use. Energy; U.S. Department of Energy Office of Scientific and Technical Information: Oak Ridge, TN, USA, 1992. [Google Scholar] [CrossRef]
- Mutani, G.; Todeschi, V. The Effects of Green Roofs on Outdoor Thermal Comfort, Urban Heat Island Mitigation and Energy Savings. Atmosphere 2020, 11, 123. [Google Scholar] [CrossRef]
- Mutani, G.; Todeschi, V.; Kampf, J.; Coors, V.; Fitzky, M. Building energy consumption modeling at urban scale: Three case studies in Europe for residential buildings. In Proceedings of the 2018 IEEE International Telecommunications Energy Conference (INTELEC), Turin, Italy, 7–11 October 2018; pp. 1–8. [Google Scholar]
- Boghetti, R.; Fantozzi, F.; Kämpf, J.; Mutani, G.; Salvadori, G.; Todeschi, V. Building energy models with Morphological urban-scale parameters: A case study in Turin. In Proceedings of the BSA: Building Simulation Applications, Bozen-Bolzano, South Tyrol, Italy, 19–21 June 2019; ISBN 978-88-6046-176-6. [Google Scholar]
- Mutani, G.; Todeschi, V. Space heating models at urban scale for buildings in the city of Turin (Italy). Energy Procedia 2017, 122, 841–846. [Google Scholar] [CrossRef]
- Mutani, G.; Todeschi, V. Building energy modeling at neighborhood scale. Energy Effic. 2020, 13, 1353–1386. [Google Scholar] [CrossRef]
- Mutani, G.; Todeschi, V.; Beltramino, S. Energy Consumption Models at Urban Scale to Measure Energy Resilience. Sustainability 2020, 12, 5678. [Google Scholar] [CrossRef]
- Mutani, G.; Gabrielli, C.; Nuvoli, G. Energy Performance Certificates Analysis in Piedmont Region (IT). A New Oil Field Never Exploited Has Been Discovered. Tec. Ital. J. Eng. Sci. 2020, 64, 71–82. [Google Scholar] [CrossRef]
- Zheng, Y.; Weng, Q.; Zheng, Y. A Hybrid Approach for Three-Dimensional Building Reconstruction in Indianapolis from LiDAR Data. Remote. Sens. 2017, 9, 310. [Google Scholar] [CrossRef]
- Overwatch Textron Systems. Feature Analyst 5.2 Reference Guide; Overwatch Textron Systems: Austin, TX, USA, 2007. [Google Scholar]
- Mutani, G.; Todeschi, V. Urban Building Energy Modeling: Hourly energy balance model of residential buildings at district scale. J. Phys. Conf. Ser. 2020, 1599. [Google Scholar] [CrossRef]
- Mutani, G.; Todeschi, V. Low-Carbon Strategies for Resilient Cities: A Place-Based Evaluation of Solar Technologies and Green Roofs Potential in Urban Contexts. Tec. Ital. J. Eng. Sci. 2020, 64, 193–201. [Google Scholar] [CrossRef]
- Botham-Myint, D.; Recktenwald, G.W.; Sailor, D.J. Thermal footprint effect of rooftop urban cooling strategies. Urban Clim. 2015, 14, 268–277. [Google Scholar] [CrossRef]
- Santos, T.; Tenedório, J.A.; Gonçalves, J.A. Quantifying the City’s Green Area Potential Gain Using Remote Sensing Data. Sustainability 2016, 8, 1247. [Google Scholar] [CrossRef]
- Hong, T.; Lee, M.; Koo, C.; Jeong, K.; Kim, J. Development of a method for estimating the rooftop solar photovoltaic (PV) potential by analyzing the available rooftop area using Hillshade analysis. Appl. Energy 2017, 194, 320–332. [Google Scholar] [CrossRef]
- Aparicio-Gonzalez, E.; Domingo-Irigoyen, S.; Snachez-Ostiz, A. Rooftop extension as a solution to reach nZEB in building renovation. Application through typology classification at a neighborhood level. Sustain. Cities Soc. 2020, 57, 102109. [Google Scholar] [CrossRef]
- Urban, B.; Roth, K. Guidelines for Selecting Cool Roofs; United States Department of Energy: Washington, DC, USA, 2010; pp. 1–23. [Google Scholar]
- Canto-Perello, J.; Martinez-Garcia, M.P.; Curiel-Esparza, J.; Martin-Utrillas, M. Implementing Sustainability Criteria for Selecting a Roof Assembly Typology in Medium Span Buildings. Sustainability 2015, 7, 6854–6871. [Google Scholar] [CrossRef]
- Suter, I.; Maksimović, Č.; Van Reeuwijk, M. A neighbourhood—Scale estimate for the cooling potential of green roofs. Urban Clim. 2017, 20, 33–45. [Google Scholar] [CrossRef]
- Shafique, M.; Kim, R.; Rafiq, M. Green roof benefits, opportunities and challenges—A review. Renew. Sustain. Energy Rev. 2018, 90, 757–773. [Google Scholar] [CrossRef]
- Ziogou, I.; Michopoulos, A.; Voulgari, V.; Zachariadis, T. Implementation of green roof technology in residential buildings and neighborhoods of Cyprus. Sustain. Cities Soc. 2018, 40, 233–243. [Google Scholar] [CrossRef]
- Tang, M.; Zheng, X. Experimental study of the thermal performance of an extensive green roof on sunny summer days. Appl. Energy 2019, 242, 1010–1021. [Google Scholar] [CrossRef]
- Yang, J.; Bou-Zeid, E. Scale dependence of the benefits and efficiency of green and cool roofs. Landsc. Urban Plan. 2019, 185, 127–140. [Google Scholar] [CrossRef]
- Dong, J.; Lin, M.; Zuo, J.; Tao, L.; Liu, J.; Sun, C.; Luo, J. Quantitative study on the cooling effect of green roofs in a high-density urban Area—A case study of Xiamen, China. J. Clean. Prod. 2020, 255, 120152. [Google Scholar] [CrossRef]
- Dimitrijević, B. (Ed.) Innovations for Sustainable Building Design and Refurbishment in Scotland; Springer International Publishing: New York, NY, USA, 2013. [Google Scholar] [CrossRef]
- Dimitrijevic, B.; Langford, D. Assessment Focus for More Sustainable Buildings. In Proceedings of the SUE-MoT International Conference on Whole Life Urban Sustainability and Its Assessment, Glasgow, UK, 27–29 June 2007. [Google Scholar]
- He, Y.; Yu, H.; Ozaki, A.; Dong, N. Thermal and energy performance of green roof and cool roof: A comparison study in Shanghai area. J. Clean. Prod. 2020, 267, 122205. [Google Scholar] [CrossRef]
- D’Orazio, M.; Di Perna, C.; Di Giuseppe, E. Green roof yearly performance: A case study in a highly insulated building under temperate climate. Energy Build. 2012, 55, 439–451. [Google Scholar] [CrossRef]
- Del Barrio, E.P. Analysis of the green roofs cooling potential in buildings. Energy Build. 1998, 27, 179–193. [Google Scholar] [CrossRef]
- Sanchez, L.; Reames, T.G. Cooling Detroit: A socio-spatial analysis of equity in green roofs as an urban heat island mitigation strategy. Urban For. Urban Green. 2019, 44, 126331. [Google Scholar] [CrossRef]
- Hoelscher, M.-T.; Nehls, T.; Jänicke, B.; Wessolek, G. Quantifying cooling effects of facade greening: Shading, transpiration and insulation. Energy Build. 2016, 114, 283–290. [Google Scholar] [CrossRef]
- Mahmoud, A.S.; Asif, M.; Hassanain, M.A.; Babsail, M.O.; Sanni-Anibire, M.O. Energy and Economic Evaluation of Green Roofs for Residential Buildings in Hot-Humid Climates. Buildings 2017, 7, 30. [Google Scholar] [CrossRef]
- Ng, E.; Chen, L.; Wang, Y.; Yuan, C. A study on the cooling effects of greening in a high-density city: An experience from Hong Kong. Build. Environ. 2012, 47, 256–271. [Google Scholar] [CrossRef]
- Cascone, S.; Catania, F.; Gagliano, A.; Sciuto, G. A comprehensive study on green roof performance for retrofitting existing buildings. Build. Environ. 2018, 136, 227–239. [Google Scholar] [CrossRef]
- Zhang, L.; Deng, Z.; Liang, L.; Zhang, Y.; Meng, Q.; Wang, J.; Santamouris, M. Thermal behavior of a vertical green facade and its impact on the indoor and outdoor thermal environment. Energy Build. 2019, 204, 109502. [Google Scholar] [CrossRef]
- Peng, L.L.; Jiang, Z.; Yang, X.; He, Y.; Xu, T.; Chen, S.S. Cooling effects of block-scale facade greening and their relationship with urban form. Build. Environ. 2020, 169, 106552. [Google Scholar] [CrossRef]
- Krarti, M. Integrated Design of Energy Efficient Cities. In Optimal Design and Retrofit of Energy Efficient Buildings, Communities, and Urban Centers; Butterworth-Heinemann: Oxford, UK, 2018. [Google Scholar] [CrossRef]
- Akbari, H.; Pomerantz, M.; Taha, H. Cool surfaces and shade trees to reduce energy use and improve air quality in urban areas. Sol. Energy 2001, 70, 295–310. [Google Scholar] [CrossRef]
- Oleson, K.W.; Bonan, G.B.; Feddema, J. Effects of white roofs on urban temperature in a global climate model. Geophys. Res. Lett. 2010, 37. [Google Scholar] [CrossRef]
- MacIntyre, H.; Heaviside, C. Potential benefits of cool roofs in reducing heat-related mortality during heatwaves in a European city. Environ. Int. 2019, 127, 430–441. [Google Scholar] [CrossRef]
- Santamouris, M.; Ban-Weiss, G.; Osmond, P.; Paolini, R.; Synnefa, A.; Cartalis, C.; Muscio, A.; Zinzi, M.; Morakinyo, T.E.; Ng, E.; et al. Progress in Urban Greenery Mitigation Science—Assessment Methodologies Advanced Technologies and Impact On Cities. J. Civ. Eng. Manag. 2018, 24, 638–671. [Google Scholar] [CrossRef]
- Akbari, H.; Levinson, R. Evolution of Cool-Roof Standards in the US. Adv. Build. Energy Res. 2008, 2, 1–32. [Google Scholar] [CrossRef]
- Berdahl, P.; Akbari, H.; Rose, L. Aging of reflective roofs: Soot deposition. Appl. Opt. 2002, 41, 2355–2360. [Google Scholar] [CrossRef] [PubMed]
- Akbari, H.; Berhe, A.; Levinson, R.; Graveline, S.; Foley, K.; Delgado, A. Aging and Weathering of Cool Roofing Membranes; Lawrence Berkeley National Lab: Berkeley, CA, USA, 2005. [Google Scholar]
- Akbari, H.; Berdahl, P.; Levinson, R.M.; Wiel, S.; Miller, W.A.; Desjarlais, A. Cool Color Roofing Materials; Energy Technologies Area: Berkley, CA, US, 2006. [Google Scholar]
- Kodysh, J.B.; Omitaomu, O.A.; Bhaduri, B.L.; Neish, B.S. Methodology for estimating solar potential on multiple building rooftops for photovoltaic systems. Sustain. Cities Soc. 2013, 8, 31–41. [Google Scholar] [CrossRef]
- Schindler, B.Y.; Blaustein, L.; Lotan, R.; Shalom, H.; Kadas, G.J.; Seifan, M. Green roof and photovoltaic panel integration: Effects on plant and arthropod diversity and electricity production. J. Environ. Manag. 2018, 225, 288–299. [Google Scholar] [CrossRef] [PubMed]
- Song, X.; Huang, Y.; Zhao, C.; Liu, Y.; Lu, Y.; Chang, Y.; Yang, J. An Approach for Estimating Solar Photovoltaic Potential Based on Rooftop Retrieval from Remote Sensing Images. Energies 2018, 11, 3172. [Google Scholar] [CrossRef]
- Mutani, G.; Todeschi, V.; Novo, R.; Mattiazzo, G.; Tartaglia, A. Le Isole Minori tra Sole, Mare e Vento; ENEA: Rome, Italy, 2019. (In Italian) [Google Scholar]
- Mutani, G.; Pastorelli, M.; De Bosio, F. A model for the evaluation of thermal and electric energy consumptions in residential buildings: The case study in Torino (Italy). In Proceedings of the International Conference on Renewable Energy Research and Applications (ICRERA), Glasgow, UK, 27–30 September 2015; pp. 1399–1404. [Google Scholar] [CrossRef]
- Mutani, G.; Beltramino, S.; Forte, A. A Clean Energy Atlas for Energy Communities in Piedmont Region (Italy). Int. J. Des. Nat. Ecodyn. 2020, 15, 343–353. [Google Scholar] [CrossRef]
- La Roche, P.; Berardi, U. Comfort and energy savings with active green roofs. Energy Build. 2014, 82, 492–504. [Google Scholar] [CrossRef]
- Rakotondramiarana, H.T.; Ranaivoarisoa, T.F.; Morau, D. Dynamic Simulation of the Green Roofs Impact on Building Energy Performance, Case Study of Antananarivo, Madagascar. Buildings 2015, 5, 497–520. [Google Scholar] [CrossRef]
- Costanzo, V.; Evola, G.; Marletta, L. Energy savings in buildings or UHI mitigation? Comparison between green roofs and cool roofs. Energy Build. 2016, 114, 247–255. [Google Scholar] [CrossRef]
- Silva, C.M.; Gomes, M.G.; Silva, M. Green roofs energy performance in Mediterranean climate. Energy Build. 2016, 116, 318–325. [Google Scholar] [CrossRef]
- Bevilacqua, P.; Bruno, R.; Arcuri, N. Green roofs in a Mediterranean climate: Energy performances based on in-situ experimental data. Renew. Energy 2020, 152, 1414–1430. [Google Scholar] [CrossRef]
- Kumar, V.; Prasad, L. Performance Analysis of Three-sides Concave Dimple Shape Roughened Solar Air Heater. J. Sustain. Dev. Energy Water Environ. Syst. 2018, 6, 631–648. [Google Scholar] [CrossRef]
- Gann, D.M.; Salter, A.J. Innovation in project-based, service-enhanced firms: The construction of complex products and systems. Res. Policy 2000, 29, 955–972. [Google Scholar] [CrossRef]
- Bossink, B. Eco-Innovation and Sustainability Management; Informa UK Limited: London, UK, 2013. [Google Scholar]
- Berardi, U.; GhaffarianHoseini, A.; GhaffarianHoseini, A. State-of-the-art analysis of the environmental benefits of green roofs. Appl. Energy 2014, 115, 411–428. [Google Scholar] [CrossRef]
- Vijayaraghavan, K. Green roofs: A critical review on the role of components, benefits, limitations and trends. Renew. Sustain. Energy Rev. 2016, 57, 740–752. [Google Scholar] [CrossRef]
- Castleton, H.; Stovin, V.; Beck, S.; Davison, J. Green roofs; building energy savings and the potential for retrofit. Energy Build. 2010, 42, 1582–1591. [Google Scholar] [CrossRef]
- Boixo, S.; Diaz-Vicente, M.; Colmenar-Santos, A.; Castro, M.A. Potential energy savings from cool roofs in Spain and Andalusia. Energy 2012, 38, 425–438. [Google Scholar] [CrossRef]
- Rosado, P.J.; Faulkner, D.; Sullivan, D.P.; Levinson, R. Measured temperature reductions and energy savings from a cool tile roof on a central California home. Energy Build. 2014, 80, 57–71. [Google Scholar] [CrossRef]
- New, J.R.; Miller, W.A.; Huang, Y.J.; Levinson, R. Comparison of software models for energy savings from cool roofs. Energy Build. 2016, 114, 130–135. [Google Scholar] [CrossRef]
- Seifhashemi, M.; Capra, B.R.; Milller, W.; Bell, J. The potential for cool roofs to improve the energy efficiency of single storey warehouse-type retail buildings in Australia: A simulation case study. Energy Build. 2018, 158, 1393–1403. [Google Scholar] [CrossRef]
- Akbari, H.; Menon, S.; Rosenfeld, A. Global cooling: Increasing world-wide urban albedos to offset CO2. Clim. Chang. 2008, 94, 275–286. [Google Scholar] [CrossRef]
- Sproul, J.; Wan, M.P.; Mandel, B.H.; Rosenfeld, A.H. Economic comparison of white, green, and black flat roofs in the United States. Energy Build. 2014, 71, 20–27. [Google Scholar] [CrossRef]
- Chiri, G.M.; Achenza, M.; Canì, A.; Neves, L.; Tendas, L.; Ferrari, S. The Microclimate Design Process in Current African Development: The UEM Campus in Maputo, Mozambique. Energies 2020, 13, 2316. [Google Scholar] [CrossRef]
- Teotónio, I.; Silva, C.M.; Cruz, C.O. Eco-solutions for urban environments regeneration: The economic value of green roofs. J. Clean. Prod. 2018, 199, 121–135. [Google Scholar] [CrossRef]
- Bianchini, F.; Hewage, K. Probabilistic social cost-benefit analysis for green roofs: A lifecycle approach. Build. Environ. 2012, 58, 152–162. [Google Scholar] [CrossRef]
- Corcelli, F.; Fiorentino, G.; Petit-Boix, A.; Rieradevall, J.; Gabarrell, X. Transforming rooftops into productive urban spaces in the Mediterranean. An LCA comparison of agri-urban production and photovoltaic energy generation. Resour. Conserv. Recycl. 2019, 144, 321–336. [Google Scholar] [CrossRef]
- Mahdiyar, A.; Tabatabaee, S.; Abdullah, A.; Marto, A. Identifying and assessing the critical criteria affecting decision-making for green roof type selection. Sustain. Cities Soc. 2018, 39, 772–783. [Google Scholar] [CrossRef]
- Wang, M.; Mao, X.; Gao, Y.; He, F. Potential of carbon emission reduction and financial feasibility of urban rooftop photovoltaic power generation in Beijing. J. Clean. Prod. 2018, 203, 1119–1131. [Google Scholar] [CrossRef]
- Oberndorfer, E.; Lundholm, J.; Bass, B.; Coffman, R.R.; Doshi, H.; Dunnett, N.; Gaffin, S.; Köhler, M.; Liu, K.K.Y.; Rowe, B. Green Roofs as Urban Ecosystems: Ecological Structures, Functions, and Services. Bioscience 2007, 57, 823–833. [Google Scholar] [CrossRef]
- Williams, K.J.; Lee, K.E.; Sargent, L.; Johnson, K.A.; Rayner, J.; Farrell, C.; Miller, R.E.; Williams, N.S. Appraising the psychological benefits of green roofs for city residents and workers. Urban For. Urban Green. 2019, 44. [Google Scholar] [CrossRef]
- Barioglio, C.; Campobenedetto, D.; Marianna, N.; Barale, M.F.; Frassoldati, F.; Robiglio, M. Re-Coding—Ripensare le Regole Della Città; Department of Architecture (DAD), Politecnico di Torino: Torino, Italy, 2019; ISBN 978-88-85745-28-5. (In Italian) [Google Scholar]
- Leach, M.; Rockström, J.; Raskin, P.; Scoones, I.; Stirling, A.; Smith, A.; Thompson, J.; Millstone, E.; Ely, A.; Arond, E.; et al. Transforming Innovation for Sustainability. Ecol. Soc. 2012, 17, 11–16. [Google Scholar] [CrossRef]
- Mumford, L. Stick and Stones, a Study on American Architecture and Civilization; Dover Publications: New York, NY, USA, 1955. [Google Scholar]


© 2020 by the authors. Licensee MDPI, Basel, Switzerland. This article is an open access article distributed under the terms and conditions of the Creative Commons Attribution (CC BY) license (http://creativecommons.org/licenses/by/4.0/).