Featured Application
Energy impacts and material resources used in the operation phase of a building should be considered to obtain more precise energy certifications than the current practical and regulatory schemes.
Abstract
Recent studies have identified that buildings all over the world are great contributors to energy consumption and greenhouse gas emissions. The relationship between the building industry and environmental pollution is continuously discussed. The building industry includes many phases: extraction of raw materials, manufacturing, construction, use, and demolition. Each phase consumes a large amount of energy, and subsequent emissions are released. The life cycle energy assessment (LCEA) is a simplified version of the life cycle assessment (LCA) that focuses only on the evaluation of energy inputs for different phases of the life cycle. Operational energy is the energy required for day-to-day operation processes of buildings, such as heating, cooling and ventilation systems, lighting, as well as appliances. This use phase accounts for the largest portion of energy consumption of the life cycle of conventional buildings. In addition, energy performance certification of buildings is an obligation under current European legislation, which promotes efficient energy use, so it is necessary to ensure that the energy performance of the building is upgraded to meet minimum requirements. For this purpose, this work proposes the consideration of the energy impacts and material resources used in the operation phase of a building to calculate the contribution of these energy impacts as new variables for the energy performance certification. The application of this new approach to the evaluation of university buildings has been selected as a case study. From a methodological point of view, the approach relied on the energy consumption records obtained from energy and materials audit exercises with the aid of LCA databases. Taking into practice the proposed methodology, the primary energy impact and the related emissions were assessed to simplify the decision-making process for the energy certification of buildings. From the results obtained, it was concluded that the consumption of water and other consumable items (paper) are important from energy and environmental perspectives.
1. Introduction
The increasing awareness about the environmental impacts caused by energy production and consumption has focused attention on energy-intensive processes. The building industry is a critical sector for the economic and social development of cities because of the services provided but causes important environmental impacts since it is energy-intensive [1,2]. Buildings require large amounts of resources and energy, and significant emissions and wastes are generated. In Europe, the construction of buildings accounts for 36% and 40% of the CO2 emissions and energy consumption, respectively [3]. Buildings consume energy throughout their complete life, from construction to demolition. These environmental impacts include mining, materials manufacturing, construction, use, and demolition phases. During the operational phase, characterized by the specific provision of services, general heating and cooling demands, as well as the required maintenance, the energy demand of a building is both direct and indirect. The indirect consumption of energy can be attributable to the production of the materials used in this operational phase [4].
Nevertheless, specific requirements for a building’s total energy and resource consumption over its lifetime must be implemented [5]. In this context, the Energy Performance Buildings Directive launched by the European Commission [6] aimed to provide a common strategy to implement actions for improving the energy efficiency of buildings and giving energy transparency by means of Energy Performance Certificates (EPCs) [7]. This directive introduced the concept of nearly Zero Energy Building (nZEB) target and requires all new buildings to be nZEB by the end of 2020 with most of the energy required coming from renewable sources [8]. The Spanish legislation is aligned with the European policies by means of the Royal Decree 235/2013 [9], which establishes the commitment to present an EPC to building users. This Royal Decree helps to inform about CO2 equivalent emissions caused by the use of energy, facilitating the implementation of measures to reduce these emissions and improve energy efficiency. However, although the EPC is mandatory in Spain, it is almost never calculated at the time of the pre-sale of a property, but only after the notarial deed. In fact, EPC is mandatory for new buildings or when selling or renting for the owners. But, a certain level of flexibility in reaching these goals is tolerated [10]. In this sense, the proposed methodology could define a new environmental performance metric useful for encouraging and promoting sustainability.
Various green rating systems have been established globally to evaluate the sustainability of construction projects [11]. Specifically, LEED (Leadership in Energy and Environmental Design), BREEAM (Building Research Establishment Assessment Method), CASBEE (Comprehensive Assessment System for Building Environmental Efficiency), and Green Star NZ (New Zealand Green Building Council) are examples of green building rating systems. They have as commonality the environment as the key factor on which all of the rating systems focus (more than 75% of total sub-categories in any eating system). However, they can hardly be translated into tools for energy certification, and furthermore, they do not include a truly holistic approach during the use stage, which makes it difficult to know where the energy and environmental impact occurs and act on it. Specifically, in the context of university’s institutions, the Global University Rankings (GURs), or the Universitas Indonesia (UI) GreenMetric aim to measure the performance of universities worldwide [12]. In both cases, the environmental variable has not been included to promote sustainability on campus and contribute to energy saving and mitigate climate change.
Many works have evaluated the environmental impacts of buildings, their constituent materials, components, and systems to identify any opportunities to reduce their environmental impacts. Life cycle assessment (LCA), life cycle energy assessment (LCEA), and life cycle carbon emissions assessment (LCCO2A) assess the environmental impacts and resources and energy consumption associated with the building industry [13]. Some factors contribute to discrepancies in results between different types of life cycle studies. Among then, the types of resource input and environmental loadings considered and the types of energy in focus (primary vs. secondary) are issues that must be taken into account to establish a common, simplified, and comprehensive tool that enables the decision-making process. LCA considers the entire life cycle of a building in terms of energy and materials used and, consequently, a high number of LCA studies have been carried out to evaluate the environmental impacts due to the construction sector. Asif et al. [14] assessed the use of energy and environmental impact in the production of five construction materials: wood, aluminum, glass, concrete, and ceramics. Wu et al. [15] analyzed the environmental impact of different types of concrete and steel used in the construction industry in China. Ortiz et al. [16] developed a review of LCA applied within the building sector from 2000 to 2007. Cuellar-Franca and Azapagic [17] used the LCA to assess three types of houses in the United Kingdom (UK): detached, semi-detached, and terraced, including all life cycle stages from house construction, use and to demolition after 50 years. From an energy point of view, Srinivasan et al. [18] applied two existing LCA tools—an economic input-output-based model and a process-based model—to estimate life cycle energy use in an example building. In addition, several reviews have been developed since 2015. Lotteau and colleagues reviewed LCA studies at the neighborhood scale [19], whereas Yarramsetty et al. [20] reviewed various LCA tools applicable to the building sector according to their functionality and different service life prediction models were also reviewed. Dossche et al. [21] also analyzed specific LCA building literature cases and different standards and frameworks. For instance, the comparison of four studies for structural concrete. Finally, Nwodo and Anumba [22] focused on major challenges in building LCA, ongoing studies, and potential solutions to resolve identified issues. ACV was also applied to assess the environmental impact of construction and demolition of buildings. Citherlet and Defaux [23] assessed three types of houses in Switzerland, considering direct impacts (use phase) and indirect impacts (material extraction, construction, and demolition).
In this context, this study aims to go beyond the evaluation of the total energy impacts of the consumption of a building needed for EPCs. This research was conducted to propose a new evaluation system that could define a new energy/environmental performance metric from a holistic point of view. This evaluation model intends to be useful for encouraging and promoting environmental sustainability, taking into account a life cycle thinking approach. Therefore, in addition to the consumption of the electric and heating systems (direct energy), which are generally considered in this type of studies, this work also proposes the consideration of the energy impacts associated with the consumption of other material resources demanded during the operational phase of the building (indirect energy), i.e., the energy used in the production of water consumed. To calculate the contribution of this indirect energy impact as new variables for the energy performance certification, different buildings of university campuses were chosen as a case study. In particular, the buildings of the campuses of Universidad of Cantabria in 2015 were chosen because they present the same function during their use stage (education). However, the energy requirements depend on the type of academic degrees and the activities developed in each building. Apart from that, all buildings have the same function and functional unit, which represents a key issue for the proposed methodology based on life cycle assessment. The analysis of different buildings with the same function allows the validation of the proposed methodology and its comparability from a methodology point of view. The selection of these buildings implies the consideration of water and paper consumption as relevant contributors to their energy performance.
2. Materials and Methods
The LCA technique was applied according to the recommendations provided by the ISO 14040 and 14044 standards [24,25]. This normalized methodology assures the correct analysis of the environmental impacts generated throughout the life cycle of a process or product, offering results both in the use of resources and emissions to the environment. As indicated by the standards, this LCA study included the definition of goal and scope, life cycle inventory (LCI) analysis, life cycle impact assessment (LCIA), and interpretation of the results (see Figure 1).
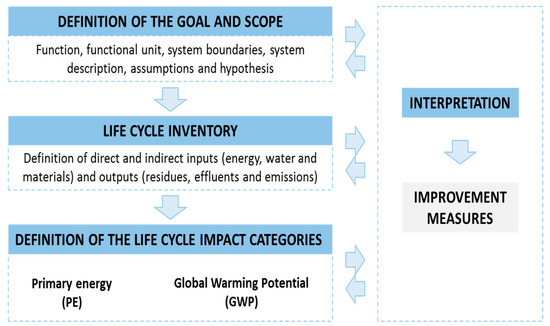
Figure 1.
Life cycle oriented procedure for developing an energy certification of a building.
First, the goal and scope definition collected a detailed specification of the system to be investigated and defined the intended application of the study in terms of the system function, functional unit (FU), and system boundaries. In addition, assumptions and hypotheses were also detailed. In the LCI stage, all relevant inputs and outputs for the system in a specific year were gathered [26]. This step is often the most work-and time-consuming step in LCA studies [27]. The LCIA step quantified the potential for resource consumption and environmental impact over all stages involved in the supply chain [26]. In this case, the impact categories considered were the consumption of primary energy (PE), which is composed of the consumption of direct energy (electricity) and indirect energy (the energy employed in the production of raw materials and outputs management). Finally, the interpretation step allows the identification of the main hotspots of the system under study to be able to propose improvement measures that could be analyzed using the same methodology. In this paper, the application and analysis of improvement measures were not developed.
2.1. Goal and Scope
The objective of the work was the development of a new methodology for the energy certification of buildings based on LCA, where in addition to the consideration of the energy impacts of electricity and natural gas (heating systems) consumption, other sources were also taken into account to determine indirect energy consumptions, which can make a significant contribution to the global consumption. For this purpose, the energy impacts associated with the water and material resources used in the operation phase of the building were included in the calculation of the contribution of these impacts as new variables for energy efficiency certification. The LCA-based developed methodology allowed for the calculation of the consumed primary energy and the corresponding emissions during the use phase of buildings, which can be employed as new variables to simplify the decision-making process for energy certification. The implemented case study was applied to the determination of the energy consumption and generated emissions of the buildings of the campuses of the University of Cantabria in 2015. To carry out this analysis, an inventory was developed according to the energy consumption records obtained from energy exercises and audit matters. The scope of the study focused on the use phase since this phase represents the most relevant environmental impacts of a building, with contributions between 70 and 90% of the total life cycle impacts [28].
2.2. Function and Functional Unit
The function represents the performance characteristics of the product, process, or service system. For instance, the generic final function of the system under study is the provision of usable space of the buildings fit for use over 50 years and protection during that period of the users and objects from harmful external factors [29]. In this case, the final function of the system is the provision of usable space for education and related activities (administration, laboratories, offices, etc.). To quantify this function, it is necessary to define a functional unit (FU), in which all the inputs and outputs will be referred. The FU should reflect this function allowing the comparison in the life cycle inventory and be comparable to those of other systems serving the same function.
A high variety of FUs was defined in LCA buildings [4]. Most of them were based on the floor area or the area of other relevant building elements, such as roof, and, in the case of the residential building, the entire house was frequently selected [1]. Another approach considered the total weight of the materials employed, which may ignore the impacts of the building as a whole element or other functions provided by the building [30]. This negative effect can be even enhanced when only particular building materials are considered, since they may not be representative of the impacts of the building. Consequently, the selection of the FU can be a critical aspect when assessing the energy consumption and related emissions in the context of different building circumstances. While the selection of 1 m² of floor as the FU is the most frequent decision [31], this point of view does not take into account the number of users of the space [32]. Under these premises, this work decided the normalization of the data by choosing as an FU 1 m2 per person, to get equivalent results in all buildings.
2.3. System Boundaries
Within the life cycle of buildings, three phases can be easily identified, which correspond to that of construction, use, and end of life, which can be observed in Figure 1. The construction (Cradle to Gate) stage covers material extraction, manufacturing, and construction; the Gate to Gate stage corresponds to the use stage, and the Gate to Grave stage includes demolition and waste management tasks. The standard established in [33] states that the use phase extends from the end of construction work until the building is about to be demolished. In this study, only the use stage (Gate to Gate stage) was considered.
On the one hand, the input flows taken into account included the ones traditionally considered in energy certifications, such as electricity (MJ) and natural gas (kg), and the new consumptions proposed included in this study, which were water (kg) and consumables (kg) (Figure 2). The consumption of paper was considered the most relevant consumable due to the high volume of paper used in higher education and research institutions, such as universities.
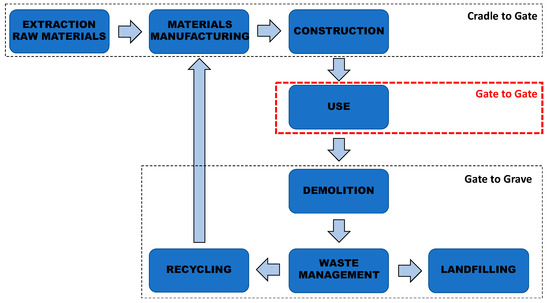
Figure 2.
System boundaries overview of the system within a general framework of the building lifetime.
On the other hand, the output flows considered the treatment of wastewater (m3) and paper waste (kg). The correct management of wastewater and waste paper is essential to improve the sustainability of public buildings and reduce environmental impacts. This perspective justified the reasons why the impact of the treatment in the corresponding wastewater treatment plants and paper recycling plants should be taken into consideration for the energy certification of a building on a university campus.
2.4. Life Cycle Impact Categories
The categories of energy consumption and environmental impact employed in this work were developed by the Centre for Environmental Science at Leiden University (CML 2001 Method) [34,35] and updated in April 2015: use of primary energy (PE) and global warming potential (GWP). PE is defined as the consumption of direct and indirect energy; that is, the energy used directly in the system and the energy required in the raw material production and outputs management. PE is determined according to Equation (1):
where is the direct energy consumption and represents the indirect energy consumption. and can be calculated following Equations (2) and (3):
where k represents electricity or other energy sources, n presents the rest of inputs used in the system, q is the energy equivalent measured in MJ per unit of input flow, and h is the activity whose units depend on the input flow.
Regarding GWP, this indicator is defined following Equation (4), where i represents the substances that contribute to the GWP, m is the weight of substance i emitted (kg/FU), and EF is the emissions factor of substance i (kg CO2 eq./kg i).
The largest source of greenhouse gas emissions from human activities is from burning fossil fuels for electricity, heat, and transportation. Public concern about climate change is a hot topic nowadays, and this environmental impact is directly measured through GWP. The largest source of greenhouse gas emissions from human activities is from burning fossil fuels for electricity, heat, and transportation. On the one hand, the PE category, expressed in MJ, accounted for the total consumption of both renewable and non-renewable energy sources. On the other hand, the GWP category, expressed in kg CO2 eq., represented the harmful chemicals emitted into the atmosphere that are responsible for the greenhouse effect: carbon dioxide (CO2), methane (CH4), nitrous oxide (N2O), hydrofluorocarbons (HFCs), perfluorocarbons (PFCs) and sulfur hexafluoride (SF6).
2.5. System Description and the Life Cycle Inventory
Universidad de Cantabria is a public university located in Cantabria, a northern region of Spain, with the main campuses in the cities of Santander and Torrelavega. It is one of the three universities that has been in the Top 10 list of the main Spanish rankings both in education as well as in research quality. Most of the campus is set in the low-lying area of Las Llamas in Santander, an open space that separates the northern side of the city from the rural areas along the coast. Green spaces and sports areas have been planned for this area. The rest of the campus is located in other parts of the city and Torrelavega, an urban center 20 kilometers away by motorway. The university offers a wide range of official degrees within graduate, postgraduate, and doctorate programs. Since its creation in 1972, it has provided university education for more than 40,000 students. It is organized in 15 schools and colleges. Table 1 shows the more important buildings of the university, with the corresponding areas and number of users that are serviced in each building during an academic year.

Table 1.
Main characteristics of the buildings on the campuses.
The data required to complete the inventories of this study can be divided into two categories. On the one hand, the primary data were obtained directly from the official energy and materials audits of the university [36]. These data included the total consumption of electricity, natural gas, and water, and the amount of paper transferred to recycling for each building. On the other hand, secondary data related to the production and recycling of paper, the treatment of wastewater in the corresponding treatment plant, the provision of natural gas, and the Spanish electricity mix (2014) were obtained from the Ecoinvent and PE databases [37,38]. Table 2 compiles the material flows of the Civil Engineering building throughout the year 2015, which was selected as an example, while the flows of the rest of the buildings can be found in the Supplementary Material (Tables S1–S6).
Table 2.
Life cycle inventory of the Civil Engineering building.
The software employed to perform the LCA was Gabi 9.0 (Sphera Solutions GmbH, Leinfelden-Echterdingen, Germany) [39]. GaBi 9.0 has a powerful LCA engine to complement the development of processes and products that fulfill environmental regulations and promote the reduction of materials, efficient energy, and resource use with lower environmental footprints (emissions, water consumption, waste production…), which can result in cost reduction and enhanced social responsibilities. This software provides a large, easily accessible, and continuously updated database that details the energy costs and environmental impacts of raw materials, from its extraction to its processing, analyzes the impact on the environment, and presents alternatives for improved design, manufacturing, or distribution. In this work, the GaBi software was applied to LCA of buildings to improve their energy certifications. With the use of this type of software, a closer approach to a sustainable building can be proposed, considering it can be built and managed economically while taking care of the environment and preservation of resources, and contributions to the protection of human health and social and cultural values.
2.6. Assumptions, Limitations, and Hypotheses
The number of users of each building was based on the number of students enrolled in the courses offered in each building during the 2014–2015 academic period, and an extra 10% was added to consider other users, such as academic staff, researchers or administration, and services personnel [36]. The data regarding consumption and treatment of both water and paper were limited because a university (in this case Universidad de Cantabria) is a vast institution, with several collectives and multiple internal organizations units (faculties, departments, research groups...). Therefore, due to the technical difficulties in collecting exact data, different hypotheses were assumed. On the one hand, in the case of the water inventory, data corresponded to the water consumption in each building registered by the university. As the percentages of consumed water sent to the treatment plant and water losses corresponding to said consumption could not be established, the total water consumed was considered treated, without any loss. The consumption of water was not constant throughout the year but depended on each building and the teaching and holiday periods. In addition, during the teaching period, the consumption of water was variable due to its use in laboratories and research activities. On the other hand, similarly, in the case of the paper inventory, the data corresponded to the quantities of recycled paper collected by the responsible service contracted by the university. Since the exact amounts of paper consumed in each building were impossible to establish with precision, all the paper consumed was considered to be recovered and sent to recycling. In addition, the consumption of paper was distributed in the buildings according to their surface and occupation, since the inventory data was for the total of the university, without further breakdown. Regarding the rest of the waste fractions generated at the university, currently, a pilot plan for the waste selective collection has started. However, although these selective collection plans for all waste fractions are being implemented, they are still in process. Only the paper/carton fraction has a detailed tracking, which allows the design and implementation of strategies aimed at prevention and recycling. Since data of the rest of the fractions are not yet available, they were not considered in this study.
Construction, maintenance, and end of life of buildings were not taken into account. Consequently, construction materials were not included. In addition, it was assumed that the environmental impact of buildings was negligible compared to the environmental impact of the use stage.
3. Results and Discussion
The normalized (expressed as a function of the FU) total consumption of PE and the total GWP resulting from the consideration of all the buildings of the university are represented in Figure 3. The total PE consumed during the use of the buildings was 5.6 MJ/m2·person and generated 0.13 kg of CO2 eq/m2·person.
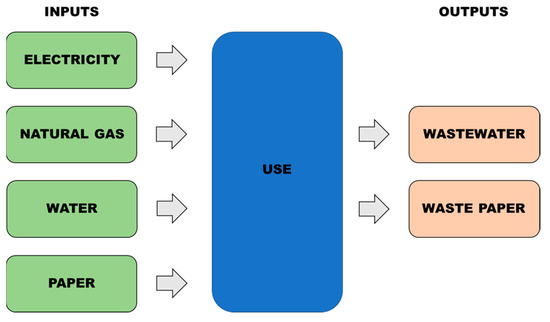
Figure 3.
Material and energy flow of the system under study.
The highest total monthly consumption of PE throughout the year corresponded, as observed in Figure 4, to the winter months, varying between 0.53–0.74 MJ/m2·person. In these months, more resources were required, both to heat the buildings and to illuminate them because the days are shorter and there are few hours of natural light. During the summer months, less energy was consumed, reducing up to 60.8%, due to the fact that the teaching activities are suspended. Nevertheless, there was still significant consumption due to the presence of researchers, management and maintenance staff, custodians or security personnel, as well as the activities in common areas, such as libraries or certain classrooms, so electricity consumption was maintained, both in air conditioning equipment and in the lighting of the spaces used.
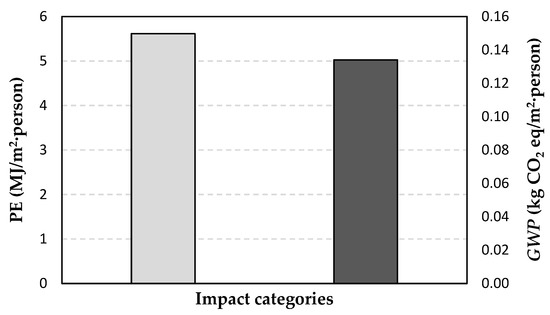
Figure 4.
Total primary energy (PE) and global warming potential (GWP) of the buildings analyzed.
Water consumption followed a more regular trend throughout the year, without relevant differences between winter and summer, while paper registered higher use at the beginning of the semesters and during the exams. The months when PE consumption was lower corresponded to the summer months, ranging between 0.29–0.36 MJ/m2·person.
Equivalent to the consumption of PE, Figure 5 shows the GWP attributable to the buildings in each month. The GWP exhibited a similar trend to the results obtained for PE. The largest emissions corresponded to the winter months with values ranging from 0.012 to 0.015 kg CO2 eq/m2·person, while in summer, the values were reduced and fell in the range between 0.008–0.010 kg CO2 eq/m2·person.
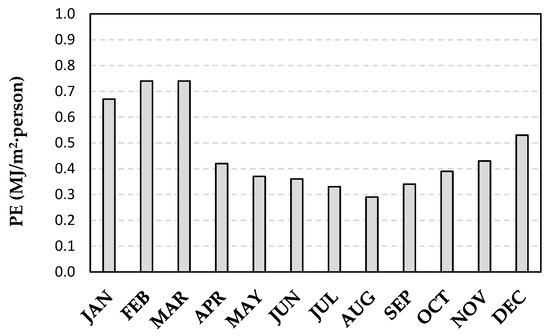
Figure 5.
Breakdown of the total primary energy (PE) throughout the year.
To determine the contribution of the different resources, the values of the total PE consumed were broken down to show the performance of electricity, natural gas, water, and paper, as observed in Figure 6. It can be observed that the highest value of PE was related to electricity consumption, which represents the value of 3.7 MJ/m2·person. However, the detailed analysis of the breakdown revealed the importance of taking into consideration the consumption of water and paper, since water contribution was 11.8% (0.67 MJ/m2·person) and even higher in the case of paper, with 22.8% (1.29 MJ/m2·person). The contribution of natural gas was minimal, representing only below 0.2%.
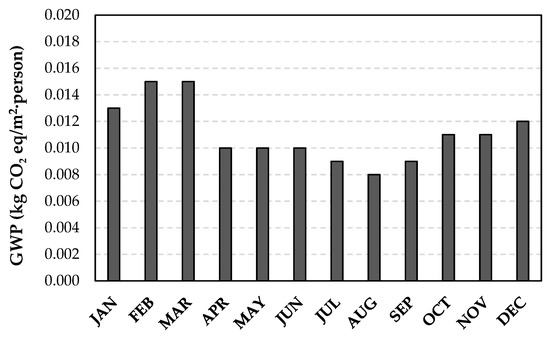
Figure 6.
Breakdown of the total global warming potential (GWP) throughout the year.
Once the relevance of the energy requirements due to water and paper, which have not been considered traditionally for energy certification of buildings, further analysis was applied. Since water and paper involved production and treatment processes (they appeared as inputs and outputs of the system simultaneously), Figure 7 depicts the PE values corresponding to both production and treatment stages of water and paper. The results highlighted a great difference between both resources. While the consumption of PE needed to supply water to the buildings was minimal, the treatment phase required much more PE. This result can be explained by the characteristics of a wastewater treatment plant when compared to a potabilization plant since the latter requires less mechanical and chemical processes to attain the objective [40,41,42,43]. In the case of paper, the results showed the opposite trend: the manufacturing stage clearly consumed much more PE than the recycling treatment. The production of paper requires wood as raw material. The wood fibers have to be separated to remove impurities. They are cut, washed, whitened with chemical substances, macerated, pressed, and dried, processes that require a great deployment of machinery and energy consumption [44,45].
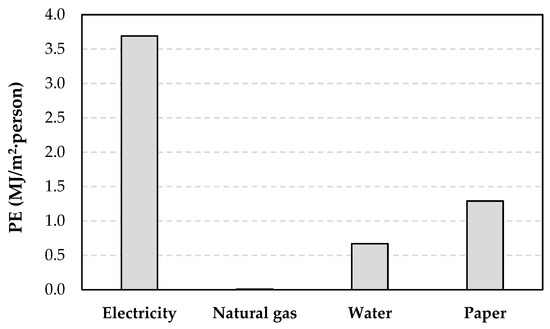
Figure 7.
Contribution of the different flows to the total primary energy (PE).
In a similar way, the breakdown of the GWP attributable to each resource can be observed in Figure 8. Once again, electricity production was clearly the main contributor (76.7%). In Spain, around 40–45% of the electricity is produced in thermoelectric plants that consume fuels fossils, such as coal, oil, or natural gas, around 15% comes from nuclear power plants, and only 35–40% of the electricity is obtained from renewable energies, such as hydroelectric, wind and photovoltaic [46]. Once again, the natural gas contribution to GWP could be considered neglectable, with a value below 0.3%. Regarding water and paper, the joint contribution to GWP was 23.0%, but in this case, the relative contribution of the paper (7.7%) was just half of the value corresponding to water (15.3%), when for PE, the opposite situation occurred. Once again, the GWP contribution due to natural gas could be considered neglectable, with a value below 0.3%. Equivalent to the PE situation, the breakdown of the production and treatment stages demonstrated the relevance of the wastewater treatment process and the paper manufacturing as the critical stages for GWP (Figure S1 in Supplementary Material).
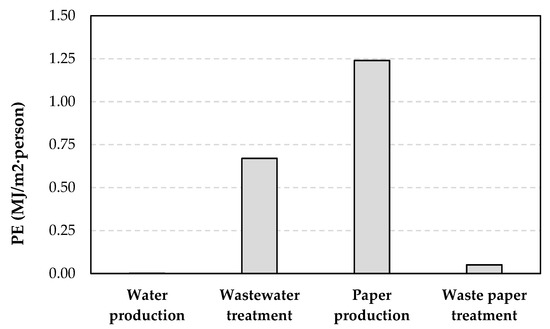
Figure 8.
Contribution of the water and paper production and treatment tasks to the total primary energy (PE).
Lastly, the results of the consumed PE (Figure 9) and the consequent GWP for the different buildings were collected (Figure 10), so that a final comparison was made among them. The PE values ranged from 0.17 to 1.49 MJ/m2·person for Law and Sciences buildings, respectively. On the one hand, the two buildings with the highest PE values, Sciences (1.49 MJ/m2·person) and Mines (1.35 MJ/m2·person), were characterized by a lower number of users than the others. Therefore, additional to the fact that these buildings were the smallest, they presented a large surface area in relation to each user, thus increasing the normalized PE consumption. On the other hand, the Law building was the one with the lowest energy consumption because, in addition to being a very large building (high surface) with many students, it does not have research laboratories, and, therefore, avoided the significant consumption attributable to the research spaces in other buildings (as is the case for the Sciences building with a high presence of laboratories). The GWP values of the building followed the same trend identified for the PE consumption with values from 0.004 (Law) to 0.037 (Sciences) kg CO2 eq/m2·person.
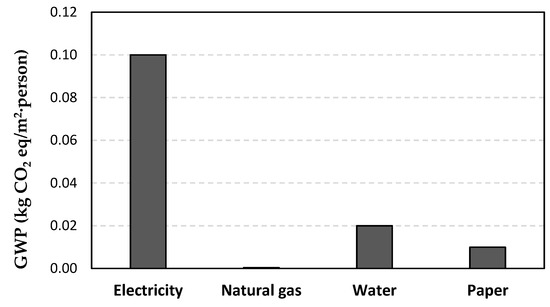
Figure 9.
Contribution of the different flows to the total global warming potential (GWP).
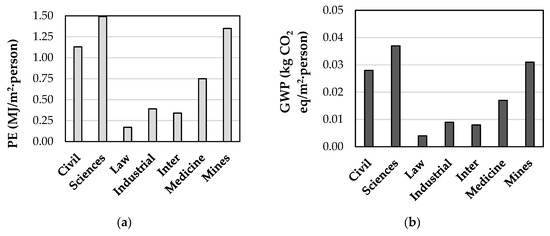
Figure 10.
Contribution of the different buildings: (a) total primary energy (PE); (b) global warming potential (GWP).
4. Conclusions
This work introduced an innovative methodology that facilitates decision-making to achieve an improvement in the efficiency of buildings through a new form of certification based on LCA methodology, taking into account a holistic point of view. The approach takes into account the energy consumption and the related emissions corresponding to the use and maintenance phase of a building, assuring the minimum requirements for user comfort and satisfactory service provision. The development and implementation of this new methodology involved a broader approach to the environmental problems that buildings cause, introducing a new evaluation framework that define an overall energy/environmental performance metric. This evaluation model intends to be useful for encouraging and promoting environmental sustainability, specifically during the use stage of buildings. In addition, the demonstrated usefulness to coordinate its development and implementation with other environmental management tools must be considered remarkable. The calculation of environmental impacts in the form of PE and GWP categories allowed the identification of opportunities for improvement, failures, and deficiencies in the building system, as well as facilitating the definition of priorities and a hierarchy of action for investment in environmental control.
From the results obtained as a consequence of the application of the proposed methodology to the case of a university, it can be concluded that the consumption of water and consumable elements (paper in this case study) can be important from an energy and environmental point of view, and, therefore, should be considered for a more precise energy certification than the ones derived from current practical regulations, which neglect these resources. Moreover, the results pointed to the need to undertake an expansion of these studies to include weighting mechanisms and different indicators to consider regional conditions, since the specific impacts associated with water consumption can significantly interfere with the results of the certifications.
There are some limitations of the study, common to a large number of institutions that must be overcome for the application of the proposed model. Specifically, the technical difficulties in collecting data and applying strategies in a university model of decentralized resource management, both in different sub-campus and in different buildings, implies the adoption of different hypotheses. To overcome this obstacle, a centralized consumption and resource management system is necessary, which allows the decision-making process to think globally and perform locally.
Finally, the proposed methodology could be adapted and applied to buildings with different uses, including residential buildings, offices, or commercial, public buildings. Additionally, further future developments to consider are the inclusion in the model of social, economic, and environmental metrics to expand the replicability of the model in different fields of application.
Supplementary Materials
The following are available online at https://www.mdpi.com/2076-3417/10/20/7123/s1, Table S1: Life cycle inventory of the Faculty of Science (Sciences), Table S2: Life cycle inventory of the Faculty of Law and Economics (Law), Table S3: Life cycle inventory of the School of Industrial Engineering (Industrial), Table S4: Life cycle inventory of the Interdisciplinary building (Inter), Table S5: Life cycle inventory of the Faculty of Medicine (Medicine), Table S6: Life cycle assessment of School of Mines Engineering (Mines), Figure S1: Contribution of the water and paper production and treatment tasks to the total global warming potential (GWP).
Author Contributions
Conceptualization, R.A. (Rubén Aldaco); Methodology, J.L. and R.A. (Rubén Aldaco); M.M. (María Margallo); Software, J.L. and M.R.; Formal Analysis, M.R.; M.M. (Mario Mañana), I.R.-S.; Investigation, M.R.; Writing-Original Draft Preparation, R.A. (Ricardo Abejón); Writing-Review & Editing, R.A. (Ricardo Abejón), J.L. and R.A. (Rubén Aldaco); Supervision, R.A. (Rubén Aldaco) and M.M. (Mario Mañana). All authors have read and agreed to the published version of the manuscript.
Funding
This research received no external funding.
Acknowledgments
The authors wish to thank Cantabria University for data support.
Conflicts of Interest
The authors declare no conflict of interest.
References
- Islam, H.; Jollands, M.; Setunge, S. Life cycle assessment and life cycle cost implication of residential buildings—A review. Renew. Sustain. Energy Rev. 2015, 42, 129–140. [Google Scholar] [CrossRef]
- Rashid, A.F.A.; Yusoff, S. A review of life cycle assessment method for building industry. Renew. Sustain. Energy Rev. 2015, 45, 244–248. [Google Scholar] [CrossRef]
- Ohms, P.; Andersen, C.; Landgren, M.; Birkved, M. Decision support for large-scale remediation strategies by fused urban metabolism and life cycle assessment. Int. J. Life Cycle Assess. 2019, 24, 1254–1268. [Google Scholar] [CrossRef]
- Cabeza, L.; Rincón, L.; Vilariño, V.; Pérez, G.; Castell, A. Life cycle energy analysis (LCEA) of buildings and the building sector: A review. Renew. Sustain. Energy Rev. 2014, 29, 394–416. [Google Scholar] [CrossRef]
- Collin, C.; Olesen, G.G.H.; Qvist Secher, A. A case-based study on the use of life cycle assessment and life cycle costing in the building industry. IOP Conf. Ser. Earth Environ. Sci. 2019, 323, 012163. [Google Scholar] [CrossRef]
- EC. Directive 2010/31/EU of the European Parliament and of the Council of 19 May 2010 on the Energy Performance of Buildings (Recast); OJ L 153, 18.6.2010; Official Journal of the European Union: Luxembourg, 2010; p. 13. [Google Scholar]
- Buratti, C.; Barbanera, M.; Palladino, D. An original tool for checking energy performance and certification of buildings by means of Artificial Neural Networks. Appl. Energy 2014, 120, 125–132. [Google Scholar] [CrossRef]
- Al Dakheel, J.; Del Pero, C.; Aste, N.; Leonforte, F. Smart buildings features and key performance indicators: A review. Sustain. Cities Soc. 2020, 61, 102328. [Google Scholar] [CrossRef]
- BOE. Real Decreto 235/2013, de 5 de Abril, por el que se Aprueba el Procedimiento Básico Para la Certificación de la Eficiencia Energética de los Edificios. 2013. Available online: https://www.boe.es/eli/es/rd/2013/04/05/235/con (accessed on 5 August 2020).
- Dell’Anna, F.; Bravi, M.; Marmolejo-Duarte, C.; Bottero, M.C.; Chen, A. Green Premium in Two Different European Climate Zones: A Comparative Study between Barcelona and Turin. Sustainability 2019, 11, 5605. [Google Scholar] [CrossRef]
- Doan, D.T.; Ghaffarianhoseini, A.; Naismith, N.; Zhang, T.; Ghaffarianhoseini, A.; Tookey, J. A Critical Comparison of Green Building Rating Systems. Build. Environ. 2017, 123, 243–260. [Google Scholar] [CrossRef]
- Muñoz-Suárez, M.; Guadalajara, N.; Osca, J.M. A Comparative Analysis between Global University Rankings and Environmental Sustainability of Universities. Sustainability 2020, 12, 5759. [Google Scholar] [CrossRef]
- Chau, C.; Leung, T.; Ng, W. A review on Life Cycle Assessment, Life Cycle Energy Assessment and Life Cycle Carbon Emissions Assessment on buildings. Appl. Energy 2015, 143, 395–413. [Google Scholar] [CrossRef]
- Asif, M.; Muneer, T.; Kelley, R. Life cycle assessment: A case study of a dwelling home in Scotland. Build. Environ. 2007, 42, 1391–1394. [Google Scholar] [CrossRef]
- Wu, X.; Zhang, Z.; Chen, Y. Study of the environmental impacts based on the green tax—Applied to several types of building material. Build. Environ. 2015, 2, 227–237. [Google Scholar] [CrossRef]
- Ortiz, O.; Castells, F.; Sonnemann, G. Sustainability in the construction industry: A review of recente developments based on LCA. Constr. Build. Mater. 2009, 23, 28–39. [Google Scholar] [CrossRef]
- Cuéllar-Franca, R.M.; Azapagic, A. Environmental impacts of the UK residential sector: Life cycle assessment of houses. Build. Environ. 2012, 54, 86–99. [Google Scholar] [CrossRef]
- Srinivasan, R.S.; Ingwersen, W.; Trucco, C.; Ries, R.; Campbell, D. Comparison of energy-based indicators used in life cycle assessment tools for buildings. Build. Environ. 2014, 79, 138–151. [Google Scholar] [CrossRef]
- Lotteau, M.; Loubert, P.; Pousse, M.; Dufrasnes, E.; Sonnemann, G. Critical review of life cycle assessment (LCA) for the built environment at the neighborhood scale. Build. Environ. 2015, 93, 165–178. [Google Scholar] [CrossRef]
- Yarramsetty, S.; Sivakumar, M.V.N.; Raj, P.A. Recent Developments in Life Cycle Assessment and Service Life Prediction: A Review. Urban. Chall. Emerg Econ. 2018, 509–520. [Google Scholar] [CrossRef]
- Dossche, C.; Biel, V.; De Corte, W. Use of life cycle assessments in the construction sector: Critical review. Proced. Eng. 2017, 171, 302–311. [Google Scholar] [CrossRef]
- Nwodo, M.N.; Anumba, C.J. A review of life cycle assessment of buildings using a systematic approach. Build. Environ. 2019, 162, 106290. [Google Scholar] [CrossRef]
- Citherlet, S.; Defaux, T. Energy and environmental comparison of three variants of a family house during its whole life span. Build. Environ. 2007, 2, 591–598. [Google Scholar] [CrossRef]
- ISO. Environmental Management—Life Cycle Assessment—Principles and Framework; ISO 14040:2006; CEN (European Committee for Standardisation): Brussels, Belgium, 2006. [Google Scholar]
- ISO. Environmental Management—Life Cycle Assessment—Requirements and Guidelines; ISO 14044:2006; CEN (European Committee for Standardisation): Brussels, Belgium, 2006. [Google Scholar]
- Margallo, M.; Domínguez-Ramos, A.; Aldaco, R.; Bala, A.; Fullana, P.; Irabien, A. Environmental sustainability assessment in the process industry: A case study of waste-to-energy plants in Spain. Resour. Conserv. Recycl. 2014, 93, 144–155. [Google Scholar] [CrossRef]
- Rebitzer, G.; Ekvall, T.; Frischknecht, R.; Hunkeler, D.; Norris, G.; Rydberg, T.; Schmidt, W.P.; Suh, S.; Weidema, B.P.; Pennington, D.W. Life cycle assessment—Part 1: Framework, goal and scope definition, inventory analysis, and applications. Environ. Int. 2004, 30, 701–720. [Google Scholar] [CrossRef] [PubMed]
- Adalberth, K.; Almgren, A.; Petersen, E.H. Life cycle assessment of four multi-family buildings. Int. J. Low Energy Sustain. Build. 2001, 2, 1–21. [Google Scholar]
- Lewandowska, A.; Noskowiak, A.; Pajchrowski, G.; Zarebska, J. Between full LCA and energy certification methodology—A comparison of six methodological variants of buildings environmental assessment. Int. J. Life Cycle Assess. 2015, 20, 9–22. [Google Scholar] [CrossRef]
- Anand, C.K.; Amor, B. Recent developments, future challenges and new research directions in LCA of buildings: A critical review. Renew. Sustain. Energy Rev. 2017, 67, 408–416. [Google Scholar] [CrossRef]
- Lessard, L.; Michalowski, W.; Fung-Kee-Fung, M.; Jones, L.; Grudniewicz, A. Architectural frameworks: Defining the structures for implementing learning health systems. Implement. Sci. 2017, 12, 78. [Google Scholar] [CrossRef]
- Norman, J.; MacLean, H.L.; Kennedy, C.A. Comparing high and low residential density: Life-cycle analysis of energy use and greenhouse gas emissions. J. Urban. Plan. Dev. 2006, 132, 10–21. [Google Scholar] [CrossRef]
- Sustainability of Construction Works–Assessment of Environmental Performance of Buildings–Calculation Method; UNE-EN 15978; European Committee for Standardization: Brussels, Belgium, 2012.
- Guinèe, J.B.; Gorrée, M.; Heijungs, R.; Huppes, G.; Kleijn, R.; de Koning, A.; van Oers, L.; Wegener Sleeswijk, A.; Suh, S.; Udo de Haes, H.A.; et al. Life cycle assessment: An operational guide to the ISO standards; Leiden University: Leiden, The Netherlands, 2001. [Google Scholar]
- Heijungs, R.; Guinée, J.B.; Huppes, G.; Lankreijer, R.M.; Udo de Haes, H.A.; Wegener Sleeswijk, A.; Ansems, A.M.M.; Eggels, P.G.; van Duin, R.; de Goede, H.P. Environmental Life Cycle Assessment of Products: Guide and Backgrounds (Part 1); Institute of Environmental Science: Leiden, The Netherlands, 1992. [Google Scholar]
- Universidad de Cantabria. Cifras del curso 2014–2015. 2016. Available online: http://web.unican.es/conoce-la-uc/la-uc-en-cifras/cifras-del-curso-2014-15 (accessed on 5 August 2020).
- Ecoinvent. Ecoinvent v3 database, Ecoinvent Centre. 2016. Available online: http://www.ecoinvent.org/ (accessed on 15 July 2020).
- PE International. GaBi 6 Software and Database on Life Cycle Assessment. Leinfelden-Echterdingen (Germany). 2014. Available online: http://www.gabi-software.com/databases/ (accessed on 13 October 2020).
- Sphera. GaBi 9.2: Software-Systemand Databases for Life Cycle Engineering (Stuttgart- Echterdingen). 2019. Available online: https://sphera.com/life-cycle-assessment-lca-software/ (accessed on 13 October 2020).
- Garfi, M.; Cadena, E.; Sanchez-Ramos, D.; Ferrer, I. Life cycle assessment of drinking water: Comparing conventional water treatment, reverse osmosis and mineral water in glass and plastic bottles. J. Clean. Prod. 2016, 137, 997–1003. [Google Scholar] [CrossRef]
- Ahmadi, A.; Tiruta-Barna, L.; Benetto, E.; Capitanescu, F.; Marvuglia, A. On the importance of integrating alternative renewable energy resources and their life cycle networks in the eco-design of conventional drinking water plants. J. Clean. Prod. 2016, 135, 872–883. [Google Scholar] [CrossRef]
- Bisinella de Faria, A.B.; Spérandio, M.; Ahmadi, A.; Tiruta-Barna, L. Evaluation of new alternatives in wastewater treatment plants based on dynamic modelling and life cycle assessment (DM-LCA). Water Res. 2015, 84, 99–111. [Google Scholar] [CrossRef]
- Lopes, T.A.S.; Queiroz, L.M.; Torres, E.A.; Kiperstok, A. Low complexity wastewater treatment process in developing countries: A LCA approach to evaluate environmental gains. Sci. Total Environ. 2020, 720, 137593. [Google Scholar] [CrossRef] [PubMed]
- Wang, L.; Templer, R.; Murphy, R.J. A Life Cycle Assessment (LCA) comparison of three management options for waste papers: Bioethanol production, recycling and incineration with energy recovery. Bioresour. Technol. 2012, 120, 89–98. [Google Scholar] [CrossRef] [PubMed]
- Gemechu, E.D.; Butnar, I.; Gomá-Camps, J.; Pons, A.; Castells, F. A comparison of the GHG emissions caused by manufacturing tissue paper from virgin pulp or recycled waste paper. Int. J. Life Cycle Assess. 2013, 18, 1618–1628. [Google Scholar] [CrossRef]
- REE (Red Eléctrica de España). La Demanda de Energia Eléctrica de España Descience um 0.4% em Noviembre (Nota de prensa). 2019. Available online: https://www.ree.es/es/sala-de-prensa/actualidad/notas-de-prensa/2019/12/la-demanda-de-energia-electrica-de-espana-desciende-un-0-4-en-noviembre (accessed on 18 August 2020).


© 2020 by the authors. Licensee MDPI, Basel, Switzerland. This article is an open access article distributed under the terms and conditions of the Creative Commons Attribution (CC BY) license (http://creativecommons.org/licenses/by/4.0/).