Article

Improvement of Diagnostic Parameters of a Rolling Wheel with Flat Spot and Experimental Test on Lithuanian Railways

by
Vladas Kukėnas
1,2,
Boris Kharitonov
3,
Mikhail Levinzon
3 and
Raimondas Jasevičius
1,4,*
1
Department of Mechanics and Materials Engineering, Vilnius Gediminas Technical University, J. Basanavicius str. 28, 03224 Vilnius, Lithuania
2
JSC “Railway Products Conformity Assessment Centre”, Paneriu str. 14, 01312 Vilnius, Lithuania
3
LLC “Railway Vehicle and Track Interaction Testing Center”, Slobodskoy pereulok 6/3, 111033 Moscow, Russia
4
Institute of Mechanical Science, Vilnius Gediminas Technical University, J. Basanavicius str. 28, 03224 Vilnius, Lithuania
*
Author to whom correspondence should be addressed.
Appl. Sci. 2020, 10(20), 7148; https://doi.org/10.3390/app10207148
Submission received: 10 September 2020 / Revised: 7 October 2020 / Accepted: 8 October 2020 / Published: 14 October 2020

Abstract

:
The JSC (Joint-Stock Company) “Railway Products Conformity Assessment Center”, under a contract with JSC “Lithuanian Railways”, carried out a rolling stock geometry and rolling surface defect risk assessment study which analyzed the principles and algorithm of the ATLAS-LG system used by JSC “Lithuanian Railways” and the system’s advantages and similarities with other systems used for rolling surface defect prediction worldwide. According to the results of this study, JSC “Voestalpine VAE Legetecha” made changes to the algorithms of its ATLAS-LG computing system and changed the parameter used to determine the damage to wheelsets. The goal of this work was to review the automatic systems of rolling stock used to evaluate the state of the rolling stock, compare the criteria for culling, describe the methodology for setting a new parameter for detecting wheel damage Pderivative instead of the previous parameter Kdm, and upgrade operational algorithms of ATLAS. This paper describes the algorithm and methodology for setting a new parameter, evaluating the construction of rolling stock and movement speed. To develop a replacement algorithm for the ATLAS-LG system, a new parameter verification methodology using the inverse Laplace transform for the mathematical model was used.

1. Introduction

On the basis of a comprehensive analysis of the safety of railway traffic conditions, including the derailment of rolling stock, it is evident that traffic safety violations sometimes occur even with all indirect security parameters maintained. If the rolling stock and track interaction forces could be controlled directly, such accidents could be avoided. To ensure traffic safety and reduce the number of residual defects on the track, the impact of the infrastructure’s rolling stock on the railway track must be assessed.
This conclusion obligates the engineers to develop systems that assess not only the secondary, but also direct parameters that determine the traffic safety and the reduction of residual deformation and its accumulation in the structural elements of the rolling stock and the track.
A serious achievement in this area is the development and implementation of the automated identification of rolling surface defects according to the values of interaction forces. Here, detection is based on detection of forces that act during the contact of the rolling surface with the rails. It is important to understand the influence of force acting between the rolling surface and rails, defining the contact force limits when the overload causes defects on the wheels.
The main elements of the calculation scheme of the mathematical model of the system “Rolling Stock–Track” used by many authors [1,2,3] are the “rolling stock” (rolling stock–wheel)–”contact between wheel and rail”–”track” (rail-gap–railway sleeper–trackbed).
The distribution of the forces generated at the wheel and rail contact point affects the dynamics of the wagon and the track. The contact forces of the defective wheel and a rail have a stronger effect than the healthy wheel and the rail. The magnitude of the contact forces depends directly on the speed of the wagon, geometrical parameters of the wheel and rail, and physical and mechanical characteristics of the rolling stock and track. The prediction of wheel and rail interaction is important not only for the operation of railways, but also for modeling the dynamics of multiple bodies. Attempts were made to improve dynamic models by implementing the basic factors related to wheel and rail coupling in the calculation of interaction models [4,5].
Mathematical models of rails are used for various complexity theories. It is possible to distinguish the main mathematical models [6,7,8] that are most common among authors: Bernoulli–Oiler and Tymoshenko. The study of wheel and rail interaction is based on wheel and rail interaction theories: Carter [9], Hertz [10], Kalker [11], and others. Kalker extensively described Carter and Hertz, as well as their capabilities, limitations, and adaptations [11].
Carter’s theory describes the wheel’s acceleration and braking action when large tangential forces are transferred to the rail. The rail is considered to be an infinite beam. When developing mathematical models of a moving wagon, Carter’s method considers the longitudinal contact force of wheel–rail but does not consider the transverse forces of a wagon.
The most common is the Hertz theory of elastic bodies [12,13,14], which states that, when two oval bodies are compressed, the contact area is elliptical, and the maximum pressure is generated at the center of the contact zone. By integrating the pressure distribution in the contact zone, the maximum load can be obtained.
The wheel with a flat spot can cause a significant dynamic effect on the entire system under consideration. A larger wheel’s flat spot results in a larger impact force. A mathematical model [15] was designed to investigate the vertical loads between a flat wheel and a rail. It was determined that the impact force increases with the increase in the size of the flat spot.
A mathematical model of interaction between two rigid contacting bodies was developed to estimate the friction forces [16]. The interaction contact area is considered as a point plane. Geometric defects of wheels and rails are rarely found at initial stages of usage; however, over time, these defects increase.
In order to describe the interaction between the flat wheel and rail, many authors of mathematical models described the wheel and rail contact area as a point or the wheel geometry as an analytical function [15,17,18,19,20,21,22,23,24]. In order to simplify mathematical models and considering that the most common damage of the rolling stock wheels is a wheel with a flat spot, the authors usually choose the flat wheel damage [7,25]. The interaction between the moving wheel and the rail is analyzed [2] taking into consideration the rail unevenness and the axial load of the rail, which affect the contact properties of the wheel and the rail. Moreover, the dynamic processes of the developed system are investigated.
The simplified wheel and rail nonlinear Hertz contact model consists of two masses with elastic connection. The mathematical models of wheel–rail interaction can be divided into two groups: when the total area of the wheel and rail contact is calculated and when the contact area is halved. Two mathematical models [26] of wheel and rail interaction were created. The first mathematical model calculates the total area of the wheel and rail contact, while the second divides the contact area in half. The obtained results of wheel and rail contact were compared with each other and the significance of the elasticity and stiffness analysis for the contact stress testing was established.
A mathematical model of wheel and rail interaction [27] was developed, where the wheel and rail are described by linear equation systems using the impulse reaction function. The model allows the calculation of vertical contact force caused by unevenness of the rails and wheels. The results of the research on acting forces [28] caused due to interaction of flat wheel with a rail were given. These forces are determined by the axial forces acting on different rails and the train speed. It was determined that the maximum obtained impact force between wheel and rail varies for different static wheel loads, and, when the speed is relatively high, the flat wheel loses contact with the rail. During the investigation of the dynamic processes occurring in wheel and rail contact, the researchers described the variations in wagon and rail mass acceleration and displacement within a time or track section [3,28,29,30,31]. It was determined that the maximum acceleration value is obtained in the case of a wheel with a flat spot.
The 1520 mm gauge railway infrastructure of the Republic of Lithuania is designed according to and must comply with the agreed technical parameters and methodologies of the railway infrastructure operators of the Organization for Cooperation between Railways (OSJD). Therefore, the Russian scientific literature must be considered, which contains works that use reverse Laplace transformation to develop the mathematical model of the system [32,33,34,35,36,37], and the mathematical model of the wheel with a flat surface is derived through frequency characteristics.
Recently, new methodologies of the theoretical part [38] for determining the discarding criteria P d e r r i v a t i v e of the wheel with flat surface were established, using the mathematical models given in the literature [32,33,34,35,36,37] and the description of the derivation of the mathematical model of the wheel with a flat surface, checking the results using a physical experiment.
The results of this paper include an analysis of the automatic rolling stock monitoring systems used to evaluate the condition of the wheel axles of the rolling stock, whereas methods and criteria for discarding them were compared; additionally, a methodology for updating the ATLAS-LG system software operation algorithm and setting the new discarding parameter P d e r i v a t i v e was described. To develop the mathematical model of the system, the reverse Laplace transformation was used, and the mathematical model of the wheel with a flat surface was derived through frequency characteristics, while a testing, trial, and operation program of the new parameter was described, and the process and results of the physical testing of the new parameter were described; lastly, the reliability of the old parameter K d m and the new parameter P d e r i v a t i v e was compared.
It is also important to mention research works related to this publication. In these research papers, train movement and safety analysis were associated with turnouts, structural elements, turnouts, design elements, wear, load and stress, contact surface, service life, safety, creepage, noise, lubrication, machine fault, etc. A new strategy to estimate static loads for the dynamic weighing in the motion of railway vehicles was given in [39]. Wheel interaction with turnout design elements was given in [40,41]. They analyzed the effects of profile wear on wheel–rail contact conditions and the dynamic interaction of vehicle and turnout. Moreover, extreme weather patterns on railway turnouts were given in [42]. A wheel wear review was given in [43,44]. The wear on the rails and rail side was analyzed in [45]. The fast degradation of a railway crossing was given in [46]. The load and stress on the contact surface of a turnout and a railway were numerically analyzed in [47]. The evaluation of the service life of rails was analyzed in [48], and the service life of turnouts was described in [49]. The measurement of the geometric center of a turnout for safety was presented in [50]. The influence of creepage of the railway was presented in [51]. A study of running safety and ride comfort was given in [52,53]. A new Swiss calculation model for railway noise for predicting the effects of different mitigation measures was given in [54]. A rail and wheel flange lubrication analysis was given in [55,56]. The robustness enhancement of machine fault diagnostic models was analyzed in [57]. The service and remaining life of an aged rail were analyzed in [58,59]. A cartographic documentation of railway areas was presented in [60].

2. Problem Formulation

2.1. Description

During interaction of the rolling stock and the track, forces are created which result in the dynamic loading transmitted to all elements of the railway structure and the rolling stock. In determining the reliability and stability of the rolling stock and the infrastructure work, it is necessary to rely on the values of the interaction forces between the rail and the wheelset. At the moment, there are no systems that can measure these forces during the usage; therefore, it is necessary to control the secondary factors that determine the interaction. These are wheel defects, which are determined by their size and are measured at the wagon checkpoints, and track geometry unevenness, which is determined by track measurements.
Certainly, when assessing traffic safety criteria, special experiments are carried out in which interaction parameters are measured. On the basis of these measurements, more or less reliable relations between the geometric parameters of the wheel and the size of force acting on wheel and rail of interaction are determined. Although these dependencies are not always accurately assessed in practice, in this work, the system used to determine traffic conditions and track and rolling stock repair systems was specifically related to the measurement of the indirect geometrical parameters. Furthermore, it is important to mention here that the survey and diagnostic monitoring of railway track geometry, turnouts, and railway infrastructure are based on two main methods: direct and indirect.

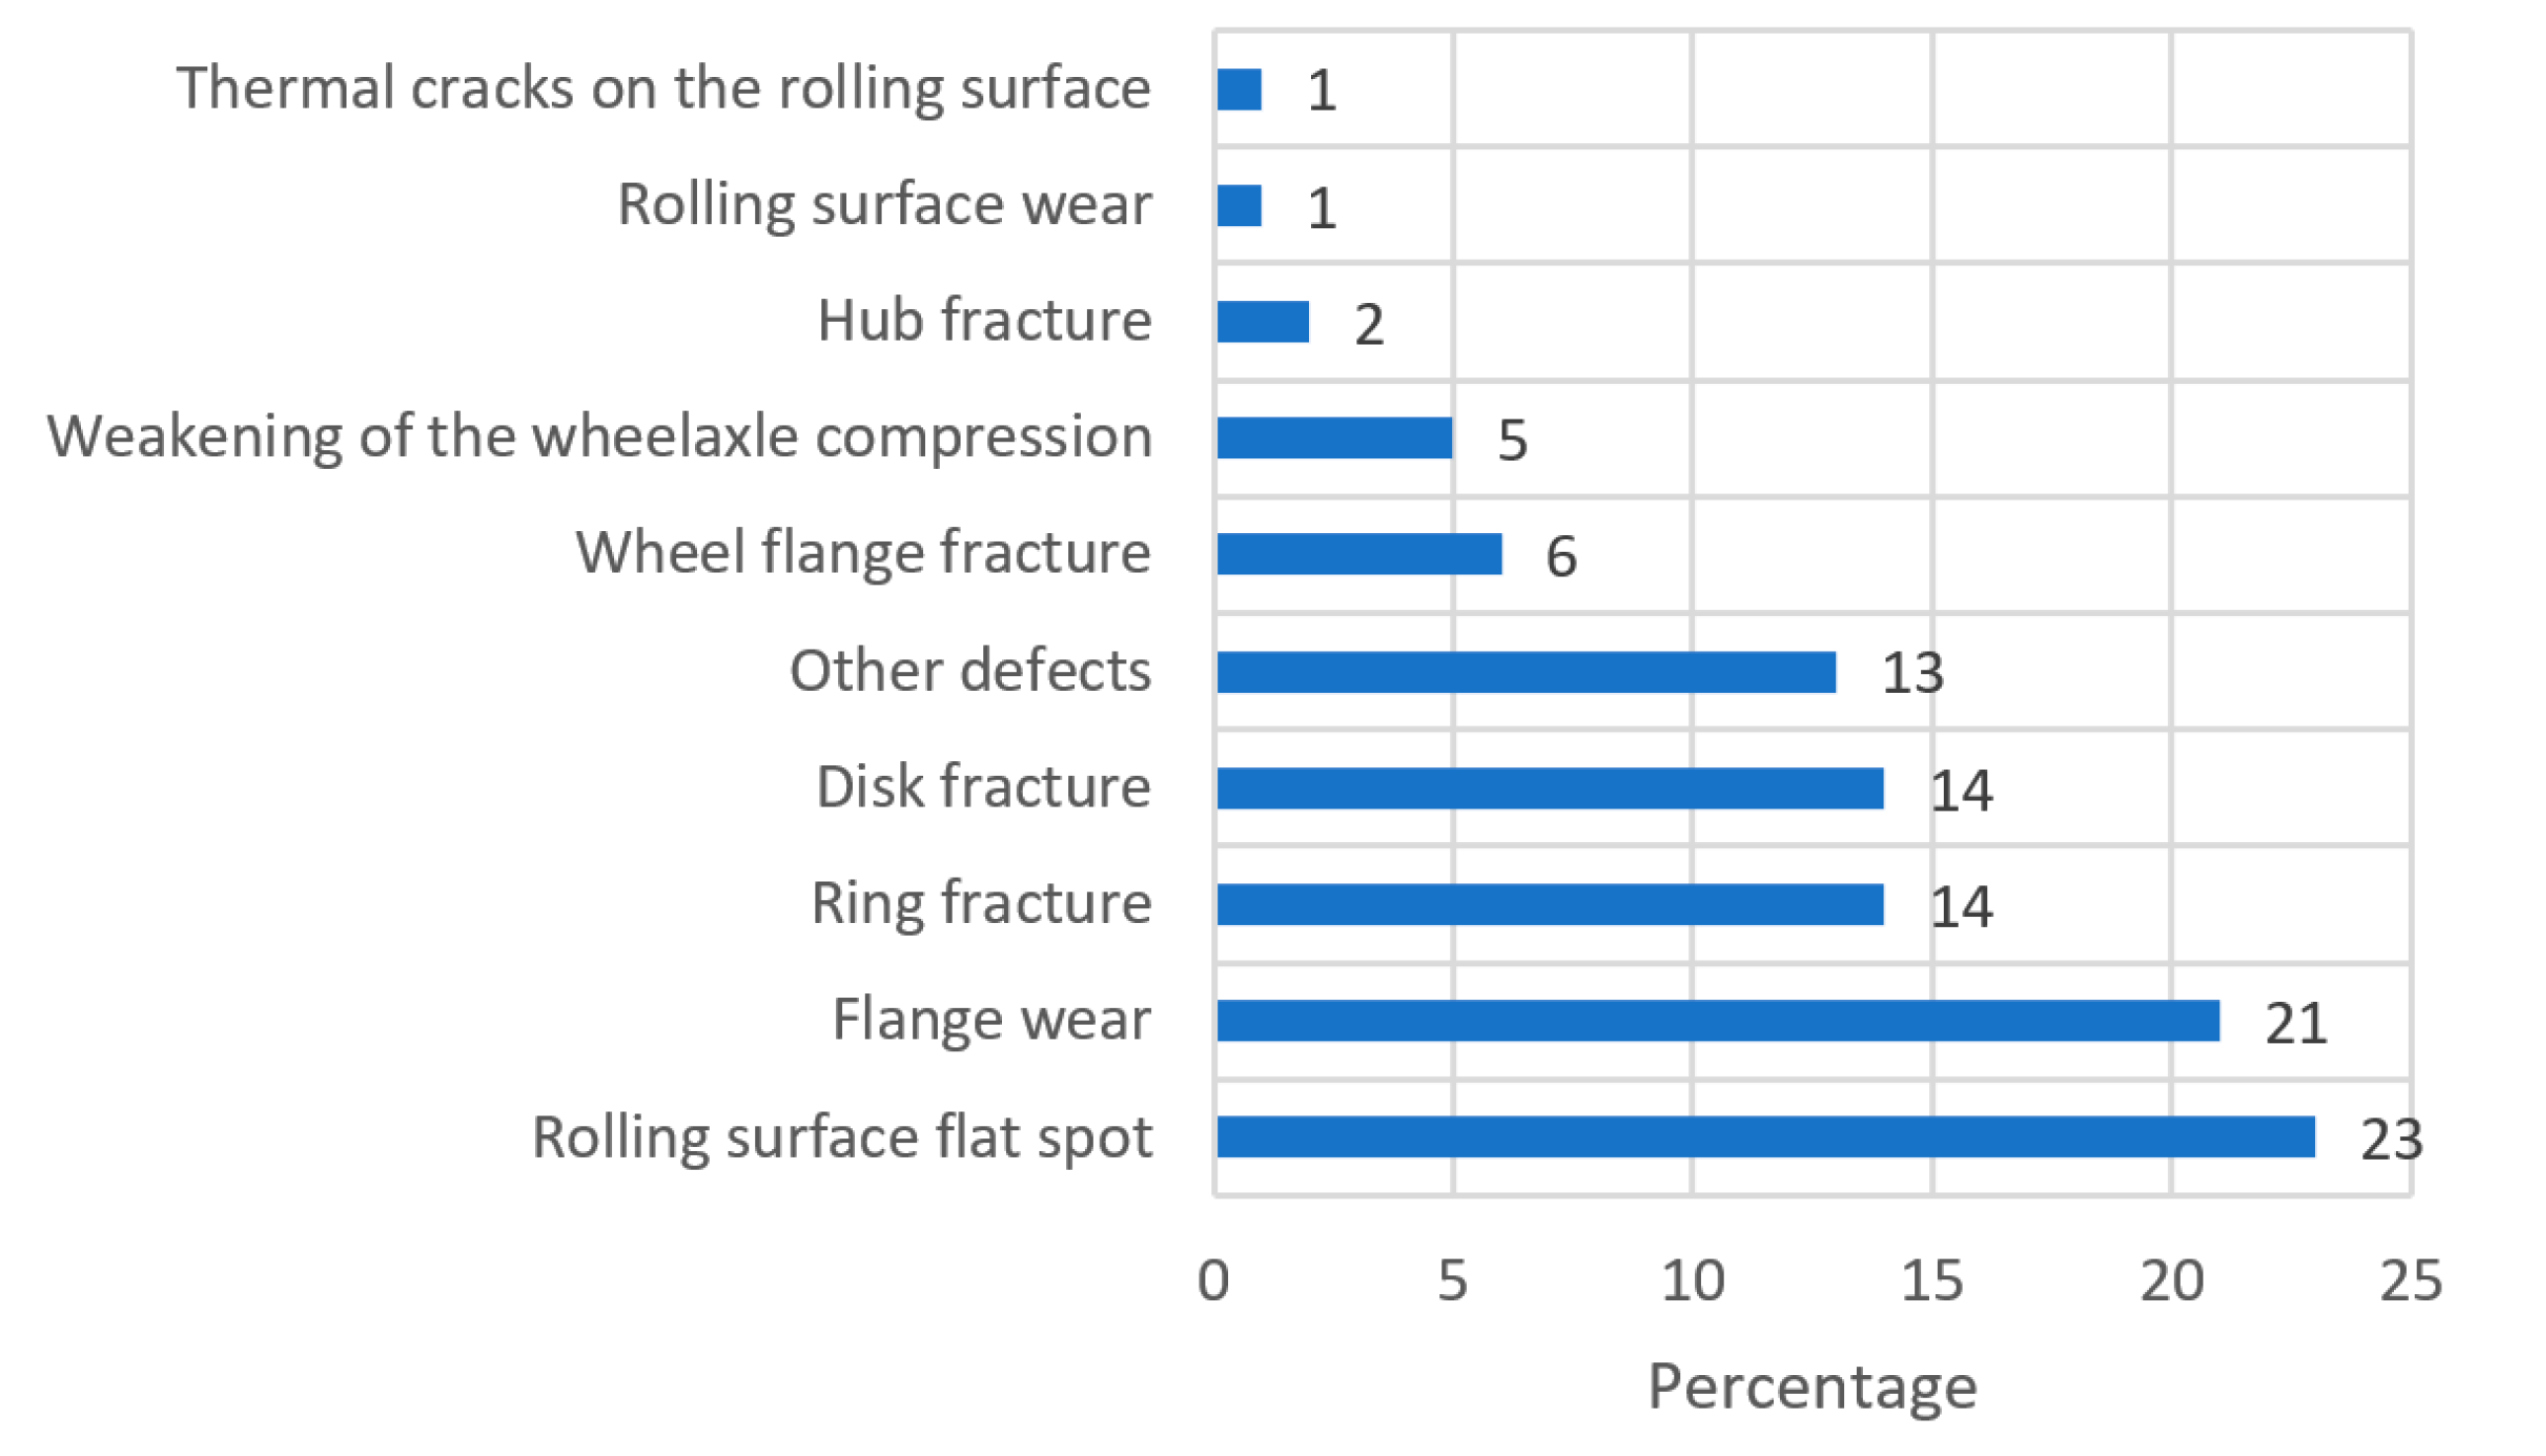
2.2. Risks Arising in the Structural Elements of the Rolling Stock and on the Track That Are Affected by Wheels with Geometrical Defects

When wheels with rolling surface defects touch the rails, the forces acting on the wheel and rail interaction point increase. The forces may increase severalfold.
According to the literature and work reviewed [61], it was demonstrated that the vertical dynamic impact forces induced by a wheel or rail defect can create dynamic forces 3–4 times greater than the static wheel load.
Investigation of the nature of such impact forces has revealed that, with certain types of impact loads, e.g., caused by rail defects, there are two clearly defined peaks with different impact on the rail track structure. They are marked P1 and P2. The first one can be noticed almost immediately after the defect. Usually, it is the greater of the two forces, but it has a high frequency. Although it can damage rails or sleepers, it generally does not travel to the ballast and the bed. The second peak occurs shortly, approximately after 10 ms. This force has low frequency and, although its amplitude is smaller than that of the first one, it travels to the ballast and the bed.
The size of these two forces depends on the speed of the wagon, the defect depth, and the angle of inclination. The undampened weight and the elasticity modulus of the railway essentially determine the second force P2. The weight of the track determines the first force P1. In practice, P2 is slightly reduced by increasing the railway track mass.
Different numerical methods, computer programs, and diagnostic tools are used to calculate the forces acting on the wheel and rail contacts.
ATLAS-LG is used in the Republic of Lithuania. The JSC (Joint-Stock Company) “Railway Products Conformity Assessment Center”, under contract with JSC “Lithuanian Railways”, performed a risk assessment study of rolling stock geometry and rolling surface defects [38] (JSC—Joint-Stock Company).
The principles and algorithm of the system ATLAS-LG used by JSC “Lithuanian Railways” were analyzed. The advantages and similarities of this system and other systems used worldwide for detection of rolling surface defects were analyzed. Practical tests were performed, and improvements in algorithmic calculations and new evaluation parameters were proposed.
The paper also examines the risk management system for damaged wheelsets. The dependence of the causes of train accidents on wheel defects is shown in Figure 1.
As can be seen from the Figure 1, flat spots and associated disc and ring fractures make up a significant percentage of the total number of defects that lead to accidents.
Thermal cracks during an impact load can greatly increase the number of cracks and break the wheel. A flat spot usually occurs when suddenly braking and when the wheels slip. A flat wheel can cause high impact loads on the rail track, gradually becoming no longer round (irregularly shaped wheel).
The purpose of this work was also related to the implementation of the following tasks:
  • To review the automatic rolling stock control systems used to evaluate the rolling stock wheel condition, comparing their culling criteria;
  • To describe the methodology for setting a new parameter for detecting wheel damage P d e r i v a t i v e instead of the previous parameter K d m and for modernization of the operational algorithms of the ATLAS-LG software where reverse Laplace transformation was used to develop the mathematical model of the system, and where the mathematical model of the wheel with flat surface was derived through frequency characteristics;
  • To describe the testing and trial program of the new parameter of the modernized ATLAS LG software;
  • To check the implemented modifications and the reliability of setting the new derived parameter for discarding, using practical experiments and registering the testing results;
  • To provide conclusions;
  • To establish a metrological verification methodology of ATLAS-LG systems.

3. An Overview of Automatic Rolling Stock Control Systems Used to Evaluate the State of the Rolling Stock

In many countries of the world, automated defect detection systems for wheels with rolling surface are being developed and used. There are valid prototypes and even industrial examples, which, in general, differ in the methods of determining the increase in wheel load on the rail. Such systems are being developed in the United States of America (USA), China, Germany, Spain, Finland, Russia, etc. Below, we review some of the typical examples of such systems. Each system is described in Section 3.1, Section 3.2, Section 3.3, Section 3.4 and Section 3.5 with citations.

3.1. ATLAS-LG System

The ATLAS-LG system (PKK) [62] is used in Lithuanian railways to identify the rolling stock and determine the level of danger. The system was developed according to the requirements of the Lithuanian Railways.
PKK ATLAS-LG continuously measures the vertical force between the wheel and the rail throughout the perimeter of the wheel. The vertical force is measured with tensometric sensors placed on the rail web. Measurement results are associated with a specific train number, axle number, and train side. In addition, the train speed, the number of axles, and the time of the train passing are measured.
The railway sleeper response and axle loads are measured by tensometric sensors mounted on the rail web.
The wheel factor K d m is used for culling the wheels. This factor is calculated as the ratio of the maximum and the base vertical forces and corrected according to a special methodology to obtain a proper evaluation of empty wagons.

3.2. WIM-WIM System (Finland)

The WIM-WIM system [63] measures the transfer loads of wheels on rails in order to determine the uneven loading and overloading of wagons, as well as the impact of wheels with a flat spot or significant oval shape. The system is based on tensometric sensors, and measurements can be made on trains running faster than 250 km/h.
The system can measure and determine the following:
  • wheel impact force on the rail;
  • dynamic rolling angle of the wheels on the rail and the relationship of this angle with the lateral interaction forces of the wheel and the rail;
  • the weight of individual rolling stock units, while also determining the uneven loading of wagons.
If the impact of the wheel on the railway track exceeds 45 tf (tf—tone force, 1 tf = 9.807 × 10³ N), the train is stopped, and wheelsets are replaced. When the impact load is in the range of 27 to 45 tf, a notification is given that this wheel needs to be repaired.

3.3. WILD System (USA)

System WILD [64] was developed by the Salient System Inc. (Austin, TX, USA) and Scalex Wild [65] Tampton (Tampere, Finland) companies. It collects information on the loads transmitted by the rolling stock to the rail. The information is collected using tensometric sensors, which are attached to the rail foot.
The main parameters of the WILD system are as follows:
  • vertical dynamic force which acts during the interaction of each rolling stock unit with a rail (accuracy up to 2%);
  • tilt angle of the wheelset in the track gauge (roll angle of the wheel on rail) (accuracy up to 0.001 rad);
  • transverse axle offset in relation to the axis of the road (accuracy up to 1 mm);
  • determination of the wobbling amplitude of the bogie rolling stock torsion (accuracy up to 0.005 rad).

3.4. AGUILA System (Spain)

The AGUILA system (ITTS, Madrid, Spain) was designed to prevent emergency situations by identifying the wagons with rolling wheel surface defects on moving trains (e.g., wheels with a flat spot, cracks, uneven wear), which cause impact loads on the rail, bearings, and wheelsets. The AGUILA system registers the forces that act on fiber optic pressure sensors mounted between the rail foot and the sleeper [66]. The operation of the system is based on the change in the luminous flux when the fiber optic pressure sensors (FOPS) are affected by the force of the load.
The AGUILA system consists of FOPS track sensors and electronics (DCST block, INNOtec Systems GmbH, Eppelsheim, Germany). The set of road detectors consists of seven fiber-optic sensors, mounted in seven-unit packs under the left and right rails, as well as two rail contacts (pedals) that turn the system on and off.

3.5. Lasca System (INNOtec Systems GmbH, Eppelsheim, Germany)

This system was designed to collect information by monitoring infrastructure and rolling stock, thus reducing the cost of railway track maintenance, and to detect wheels with rolling surface defects. The main difference of this system is that a special laser optic sensor is used as a measuring element, which controls the curvature of the railhead (Innotec System Gmbh, Eppelsheim, [67]).

3.6. Usage of Wheel Culling Criteria in Systems

In the existing wagon rolling surface defect detection systems, various wheel defect detection normatives are used which are characterized by the unitary strength criteria, i.e., according to safety or fatigue (durability criteria). The first group of criteria ensures that the rails, although defective, are in good condition at sufficiently low temperatures. Such checking is necessary, despite the fact that the probability of coincidence between the rail defect location and the impact location of the defective rolling surface is sufficiently low. In the evaluation according to criteria for allowed unitary strength values, in practice [68], special tests of rail samples in a climatic chamber were performed. The obtained results are presented in Table 1.
In order to provide a unitary strength at very low temperatures, the allowed vertical load limit can be decreased substantially.
In order to detect defective wheels in empty or partially loaded wagons, in many countries (including Russia, the USA, and India), a maximum force acting per wheel turning relation to its background value is used as a factor. A summary of the criteria used in similar systems for control of rolling stock is given in Table 2. As demonstrated above, an important factor in the correct discovery of defective wheels is the need to measure the effect of force in identical conditions.
For this, China [69] introduced the equivalent wheel rim rupture damage parameter T in order to prevent additional analysis of acting external factors for interaction forces. In the analysis of the dependency of force factors, it should be noted that, in the USA, the force factor determines the culling, while, in Russia, if the lower limit of the factor (370 kN) is exceeded, but the upper limit of the force factor (450 kN) is not exceeded, and the geometrical defect on the wheel rolling surface is not identified, the wagon is allowed to be used at a determined speed.
In Lithuania, in the ATLAS-LG system, the main culling factor is the dynamic factor K d m (threshold value of the dynamic factor). It should be noted that the ATLAS-LG system allows the use of the dynamic factor as a culling criterion, as well as the direct vertical force value, when this force is transmitted during the interaction of a defective wheel with a rail. Moreover, it should be noted that, in ATLAS-LG, different countries use different culling criteria (even European Union countries). This depends on the analysis of the statistical data obtained during the usage of the system.
As all attention has been focused on the criteria for defecting systems of automatic wheels with geometric surface defects during operation, and mobile special measurements are used to detect continuous welded rail (CWR) defects, this problem has not been addressed. Meanwhile, defects associated with the rail track are future studies that require completely different rail track measurement systems.
The defect characteristics of all defect systems mentioned in Section 3.1, Section 3.2, Section 3.3, Section 3.4 and Section 3.5 and the defect parameters and criteria of the countries in which they are used are summarized in Table 2.

4. Methodology for the Modernization of ATLAS-LG System Software Operational Algorithms

4.1. Criteria for Evaluation of ATLAS-LG System Operation Results

The performed investigation [38] showed that, using the ATLAS-LG system, according to the modernized criteria of dynamic factor, the detection of wheels with rolling surface defects is not sufficiently reliable. This effect is most evident when checking freight wagons on which wheel defects occur more often than other types of carriages. This is due to the fact that the operation of the system is influenced by the speed of the freight wagons and the axle load.
For creating a mathematical model for the analysis, we used methodology to apply inverse Laplace transformation, as used in [32,33,34,35,36,37]. This methodology was selected considering that the infrastructure and the rolling stock of Lithuanian railways is 1520 mm gauge, where the agreed technical parameters and methodologies of the railway infrastructure operators of the Organization for Cooperation between Railways (OSJD) prevail.
A mathematical model of wheel damage was derived from the frequency characteristics. Frequency characteristics that describe the dynamic system, using the input as the uneven location (which occurs as the mass of the wheel center moves) and the output as the dynamic force at the wheel and rail contact location, can be expressed using Equation (1) [38].
W p = 1 1 C k + W y ( 0 , i w ) W 0 ( i w ) ,
where W p represents the frequency characteristics (N/m), C k is the elasticity at the wheel and rail contact location (N/m), W y ( 0 , i w ) represents the frequency characteristics of the dynamic force transformations into the rail indentation, while the first argument indicates the distance where the value is determined (m/N), and W 0 ( i w ) represents the frequency characteristics, which relate the wheel displacement (under weight located above the spring) to the dynamic force at the point of contact (m/N).
These frequency characteristics can be determined as follows (Equation (2)):
W 0 ( i w ) = M 1 w 2 i r 1 w C 1 M 1 M 0 w 4 i r 1 ( M 1 M 0 ) w 3 C 1 ( M 1 + M 0 ) w 2 ,
where M 1 is the weight above the spring distributed for one wheel (kg), M 0 is the wheel weight (kg), f 1 is the fluctuation suppression index of the weight above the springs (N⋅s/m), and C 1 is the spring set elasticity distributed for one wheel (N/m).
The frequency characteristics of the dynamic force transformations into the rail indentation can be described as follows (Equation (3)):
W y ( 0 , i w ) = 1 E I ( r 1 r 2 ) ( r 1 r 3 ) ( r 1 r 4 ) + 1 E I ( r 2 r 1 ) ( r 2 r 3 ) ( r 2 r 4 ) ,
where r j ( j = 1, 2, 3, 4) represents the roots of the algebraic equation with complex indexes, as given in Equation (4).
r 4 + m V 2 E I r 2 f V + 2 i m w V E I r + u m w 2 + i f w E I = 0 ,
where E is the rail steel elasticity module (N/m4), i is the rail moment of inertia (m4), m is the given track weight (kg/m), f is the distributed track inhibition index (N⋅s/m2), u is the rail base elasticity module (Pa), and V is the travel speed (m/s).
Root numbers are selected using the following method (presence of two roots with negative real parts and two roots with positive real parts is proven using the Raus criterion R e , as given in the Equation (5)):
R e f 1 < 0 ,   R e f 2 < 0 ,   R e f 3 > 0 ,   R e f 4 > 0 ,
where f 1 , f 2 , f 3 , f 4 represent the fluctuation suppression index of the weight above the springs (N⋅s/m).
If we know the wheel center movement trajectory ξ ( V t ) , after the inverse Laplace transformation, the dynamic force P d can be calculated as follows (Equation (6)):
P d . = W p ( s ) ξ . .
If the wheel moves when a flat spot is present, the movement trajectory is described as follows (Equation (7)):
ξ ( V t ) = { 0 ,   t 0 ;   r w 0 2 t 2 2 ,   0 t l 2 w 0 r ; r ( l r w 0   t ) 2 2 ,   l 2 w 0 r t l w 0 r ; 0 ,   t l w 0 r ,
where w 0 = V / r is the wheel angular velocity (l/s),   l is the length of a “flat spot” type defect (for flat or compression spot, l 2 2 r δ ) (mm), δ is the flat spot depth of a compression spot height (mm), and r is the wheel radius (m).
After applying Laplace transformation to this expression, we get Equation (8).
ξ . = W 0 S 2 l e s T W 0 2 S 3 r + W 0 2 S 3 r e 2 s T ,
where T = 1 2 V is the half-time of wheel center “movement” over the gap (s).
In this case, the dynamic force after Laplace transformation can be described using Equation (9).
P d . = W p ( s ) ξ = W p ( s ) s 2 w 0 l e s T W p ( s ) s 3 w 0 2 r + W p ( s ) s 3 w 0 2 r e 2 s T .
The system transition impulse function can be described as follows (considering the layout of special points of the expression W p ( s ) s 2 in Equation (10)):
h ( t ) = 1 2 π + W p ( i w ) w 2 e i w t d w .
When it is determined and denoted by W P d ( i w ) = W p ( i w ) W 2 , the function h ( t ) can be described as follows (Equation (11)):
h ( t ) = 1 π 0 + [ R e W P d ( i w ) cos ( w t ) I m W P d ( i w ) sin ( w t ) ] d w .
The individual system reaction to the increase of approach acceleration can be calculated using the impulse transition function (Equation (12)).
H ( t ) = 0 t h ( τ ) d ( τ ) .
Increases in dynamic force over the timeline, considering the delay, can be expressed as follows (Equation (13)):
P d ( t ) = w 0 l h ( t T ) w 0 2 r H ( t ) + w 0 2 r H ( t 2 T ) .
In the case of step “up” with the δ value, the wheel center movement trajectory can be expressed as follows (Equation (14)):
ξ ( V t ) = { 0 ,   t 0 ; δ + r w 0 2 ( t T ) 2 2 ,   0 t T ; δ ,   t T .  
Performing Laplace transformation calculations identical to the calculations for the “flat spot” indicated above, we eventually get the following expression for calculating the dynamic force over the timeline (Equation (15)):
P d ( t ) = w 0 l 2 h ( t ) w 0 2 r H ( t ) + w 0 2 r H ( t T ) .
In this case, the length of the time interval where the wheel center movement trajectory changes is determined using Equation (16).
l = 2 2 r δ .
Thus, performing consecutive calculations of W 0 ( i w ) , r j (using the Descartes–Euler solution of quartic equations), W y ( 0 ,   i w ) , and h ( t ) , when frequency range H ( t ) is sufficient to determine the dynamic relation of the impact, we acquire all the necessary data to determine the dynamic forces that occur in the case of a wheel flat spot.
On the basis of the performed investigation, the normative recommendations for the evaluation of vertical forces transmitted from train wheels to rails measured by the ATLAS-LG measurement system were prepared. It is recommended to accept the following rolling stock culling criteria which exceed the normatives of the strike impact for the track:
1.
Vertical forces must be evaluated according to the size of P d e r i v a t i v e , hereinafter referred to as the derivative value of the vertical force adapted to conditions of all rolling stock speeds = 80 km/h and static axle load of freight wagons = 230 kN.
2.
The derivative value of the vertical force P d e r i v a t i v e is calculated if the speed of the rolling stock ranges from 30 to 80 km/h on a certain section with the installed ATLAS-LG system.
3.
If the speed exceeds 80 km/h, the “derivative” value of the vertical force P d e r i v a t i v e is equal to the maximum value recorded by the ATLAS-LG system during rolling of the analyzed wheel.
4.
The operation range of ATLAS-LG system does cover speeds less than 30 km/h.
5.
The “derivative” value of the vertical force is calculated according to the following equations:
-
for freight wagons (Equation (17)):
P d e r i v a t i v e = P m a x + ( 115 P a v e r a g e ) + ( 2.72 + 0.0028 P a v e r a g e ) ( 80 v ) ,
-
for locomotives and passenger wagon (Equation (18)):
P d e r i v a t i v e = P m a x + 2.5 ( 80 v ) ,
-
special rolling stock (Equation (19)):
P d e r i v a t i v e = P m a x + 2.7 ( 80 v ) ,
where   P m a x is the maximum value of the vertical force (kN), P a v e r a g e is the average value of the vertical force (kN), and v is the speed at which the carriage passes a distance section (km/h).
Two limits are set:
“Danger 1”—the train speed is limited to 40 km/h and the detected wheelset must be rolled out at the nearest point of service, regardless of whether it has defects. This limit value is determined when the “derivative” values of the following vertical forces are exceeded: for freight wagons, 450 kN; for locomotives and passenger wagons, 350 kN; for special rolling stocks, 400 kN.
“Danger 0”—the detected wheelset is checked at the nearest service station. After encountering defects that exceed the geometric parameters of normative indicators, the wheelset must be rolled out, and, if there are defects with parameters below the normative indicators, the wagon can continue to run at the determined speed. This limit value is determined when the “derivative” values of the following vertical forces are exceeded: for freight wagons, 350 kN; for locomotives and passenger wagons, 300 kN; for special rolling stocks, 300 kN.
Vertical force values (for “danger 0” and “danger 1”) can be calculated according to Equations (17)–(19).

4.2. System Software Operation Algorithm after Upgrading

When the ATLAS-LG system operates under the regulation referred to in Section 4.1, the following software operation algorithm is recommended:
1.
The ATLAS-LG system continues to operate in its standard mode. On the basis of the recommendations specified in Section 4.1, the main results of the system are used for processing and evaluation.
2.
The rolling stock type is determined and attributed to one of the following categories:
-
Freight wagon with variable load, including tanks, platforms, bunker type wagons, etc.;
-
locomotive;
-
passenger wagon;
-
special rolling stocks.
3.
The following parameters, which are standardized for the ATLAS system, are used to continue calculations:
-
P m a x —maximum value of the vertical force (kN);
-
P a v e r a g e —average value of vertical force (kN);
-
v —speed at which the carriage passes a distance section (km/h).
4.
Depending on the categories of rolling stock according to the Equations (17)–(19) and with the instructions are given in the second and third conclusions in Section 4.1, the “derivative” value of the vertical force P d e r i v a t i v e is determined.
5.
The resulting P d e r i v a t i v e value is aligned with the limit values given in Section 4.1 (two limits are set) for the relevant categories of rolling stock.
6.
When the relevant limit value is exceeded, the required level of risk is formed and the expected actions corresponding to this level of risk are formed.

4.3. ATLAS-LG System Modernized Software Experiment and Testing

In order to verify the proposed ATLAS-LG system work regulations, the following metrological investigation was proposed:
-
To roll out four wheelsets, in which a vertical force was determined during the test at certain part of Joniškis (city in Lithuania) section using the ATLAS-LG system. The obtained range of this vertical force was 450,500 kN. During the visual inspection of the wheel, rolling surface unevenness was detected, and, according to the existing rail exploitation requirements, the speed had to be restricted;
-
To form a test train from the traction unit and the semi-wagon to which the removed wheelsets were mounted;
-
In the Joniškis section, five test runs were performed at speeds of 40, 60, and 80 km/h. The test cycle was repeated with loaded and empty wagons.
During the measurement of the run, the measurements were based on the proposed work regulations. The probability of detection of wheelset with unevenness on rolling wheels surface was evaluated. The probability of detection should be 60–70%. The metrological verification of the effectiveness of this technology was carried out in tests performed. The results are given in Section 5 and Section 6.

4.4. Automatic Rolling Stock Control System with Software Installed Used in the Work

During physical experiments, the ATLAS-LG (PKK) [61] system was used with the software for measuring the force of the wheelsets acting on the rails and data processing (Figure 2).
The measurement range consisted of 14 points for measuring the railway sleeper response (R points) and 12 points for measuring the axle load (T points). The latter were also used to identify the wheels. Railway sleeper reactions and axle loads were measured by tensometric strain gauge sensors diagrams mounted on the rail web.

5. Description of Experiment

The metrological inspection was carried out in accordance with the program specified in Section 4.3 at the Joniškis station (in Joniškis city). Characteristics of the upper track construction were as follows: railway track R65, railway sleepers Swetrak, clamps (sąvaržos) (fasteners) Vossloh, railway sleeper epiphany 1840 units/km, and rubble ballast. The section of the test railway track was straight. The assessment of the condition of the railway, performed by the firm “Plasser and Theurer” with the EM 140 wagon and the TrackScan ME 4,011,244 track measuring cars, showed that the condition of the track was good. For the experiment, a test train formed by a railcar (traction) and a freight wagon no. 10,630,028 was formed. The wagon was weighed (with a stationary weighing scale) in a weighbridge and had a mass of 93.2 tons. Wheelsets with uneven rolling surface (described in Section 6) were mounted to the wagon. The same wheelsets were used for the tests that were carried out. The test train scheme is shown in Figure 3.
The main direction of the train during the test was toward the Joniškis station. In the direction of Latvia, the test train ran in reverse, and measurements were not made. The left and right wheels of the wheelset were set in the direction of the Joniškis station.
All wheelsets of the wagon were inspected and described, and their parameters and damages were measured. Twelve test runs were performed (Figure 4). Driving speeds ranged from 55 km/h to 80 km/h. During the test runs, the new parameter P d e r i v a t i v e and the speed were recorded. After running the new P d e r i v a t i v e parameter, it was compared with the older parameter K d m which was recorded in the tests.
Vertical force was calculated in contact zone between wheel and rails, with main attention given to the wheel. This work aimed to investigate the effect of wheel geometric unevenness (flat spot) on the track rail and to determine new parameters of such defecting systems. Track rail unevenness was taken as a constant in either the horizontal or the vertical plane, and the rails were considered to be of good quality (not worn) according to the current JSC “Lithuanian Railways” operating instructions. It should be mentioned that track rail unevenness can be caused by many factors, such as irregularities of track rails in the horizontal plane, irregularities of track rails in the vertical plane, rail corrugation, and rail side wear.

6. Results

The results of the practical testing of the ATLAS-LG system carried out at the Joniškis station (in Joniškis city) are presented below. The bold text in Table 3 indicates the unevenness that must be reflected in the ATLAS-LG system. In the case of this unevenness (marked in bold text), it is forbidden to ride. Each case of unevenness is discussed in detail below.

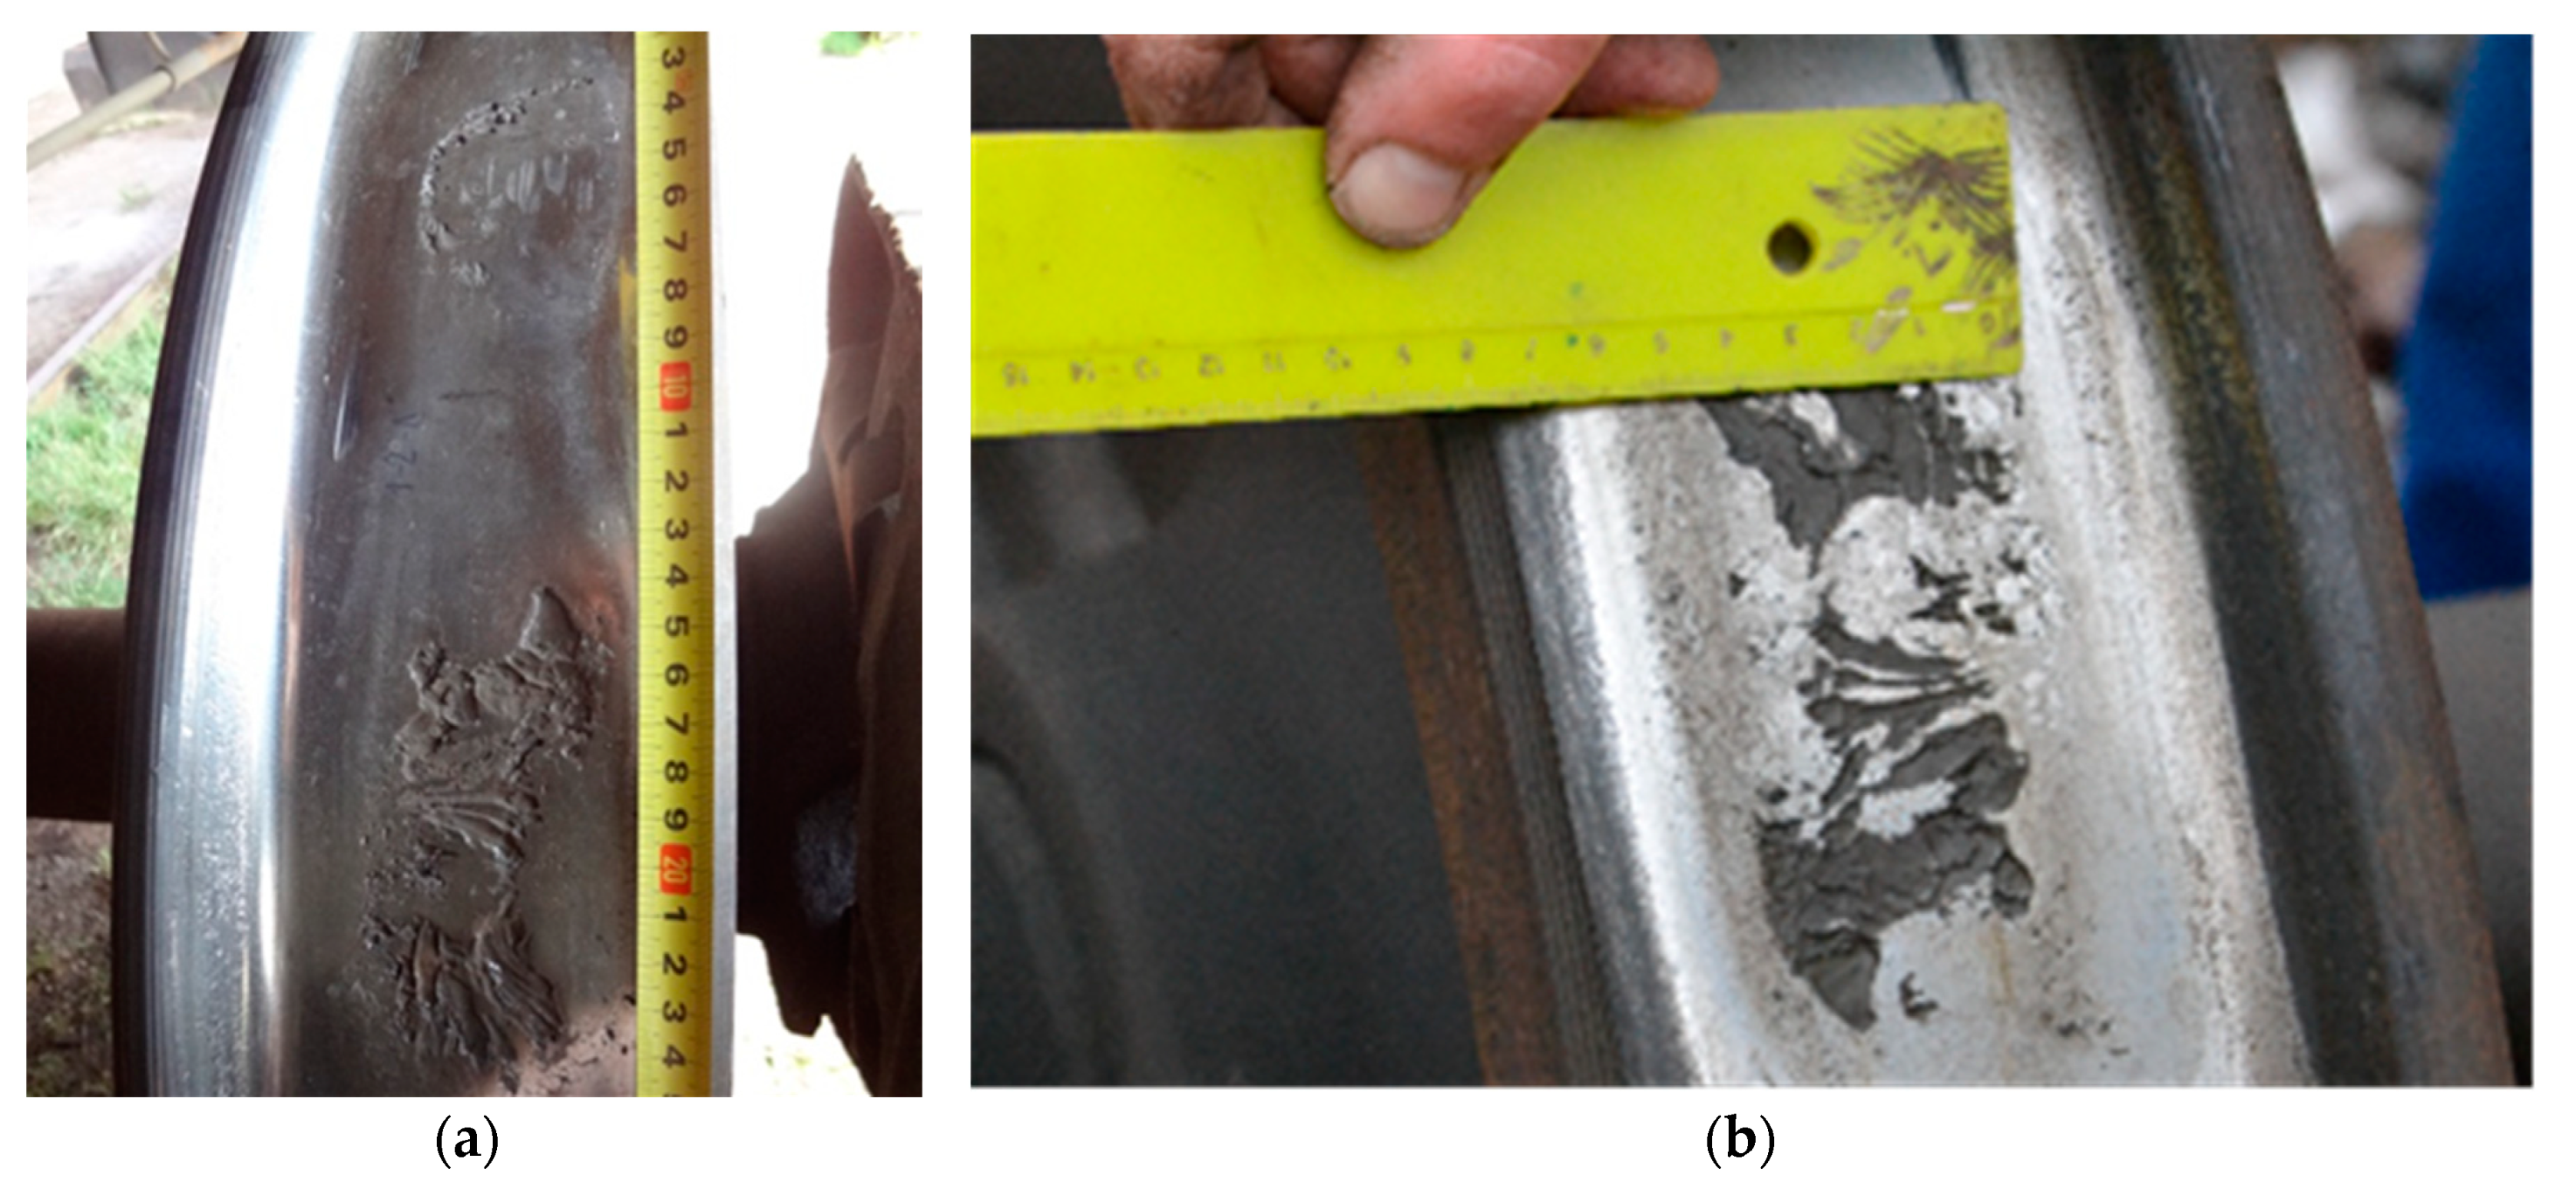
6.1. Unevenness 1: Second Left Wheel, Wheelset Number 11752782106.00

Wheel defects included flat spots of 3.0 × 170 × 60 mm, 1.0 × 70 × 50 mm, and 1.5 × 80 × 50 mm. The unevenness is shown in Figure 5 (photos taken before the tests).
According to the factor K d m > 7.0, this wheel was detected during 46 trips (33 trips—”danger 1” and 13 trips—”danger 0”) of the 72 trips in the summer and 38 trips (27 trips—”danger 1” and 11 trips—”danger 0”) of 72 trips in the winter. Thus, the rate of detection of “danger 1” was 42% and “danger 0” was 16%. The overall level of detection during the tests was 58%. During the long journey through all network systems, the detection rate of this defect was 13%.
Twelve trips at different speeds were performed. The results of measurements are presented in Table 4. The results of the measurements show that, according to the K d m indicator, this unevenness can be reliably detected when traveling at speeds greater than 60 km/h, and, according to the indicator of the vertical force derivative value, unevenness was detected during all trips.

6.2. Unevenness 2: Second Right Wheel, Wheelset Number 11752782106.00

Wheel defects included flat spots of 2.0 × 190 × 60 mm and 1.5 × 170 × 60 mm. The unevenness that was detected is shown in Figure 6 (photos taken before the tests).
According to the factor K d m > 7.0, this wheel was detected during 13 trips (eight trips—”danger 1” and five trips—”danger 0”) of 72 trips in the summer and seven trips (four trips—”danger 1” and three trips—”danger 0”) of 72 trips in the winter. Thus, the rate of “danger 1” detection was 8%, and that of “danger 0” detection was 6%. The overall level of detection in the tests was 14%. During the long journey through all network systems, the detection rate of this defect was 7%.
Twelve trips at different speeds were performed. The results of measurements are presented in Table 4. The results of the measurements show that this unevenness did not respond well to the speed variation according to the K d m index, but the unevenness of the vertical strength indicator was established for all trips at the level of “danger 1” and “ danger 0”.

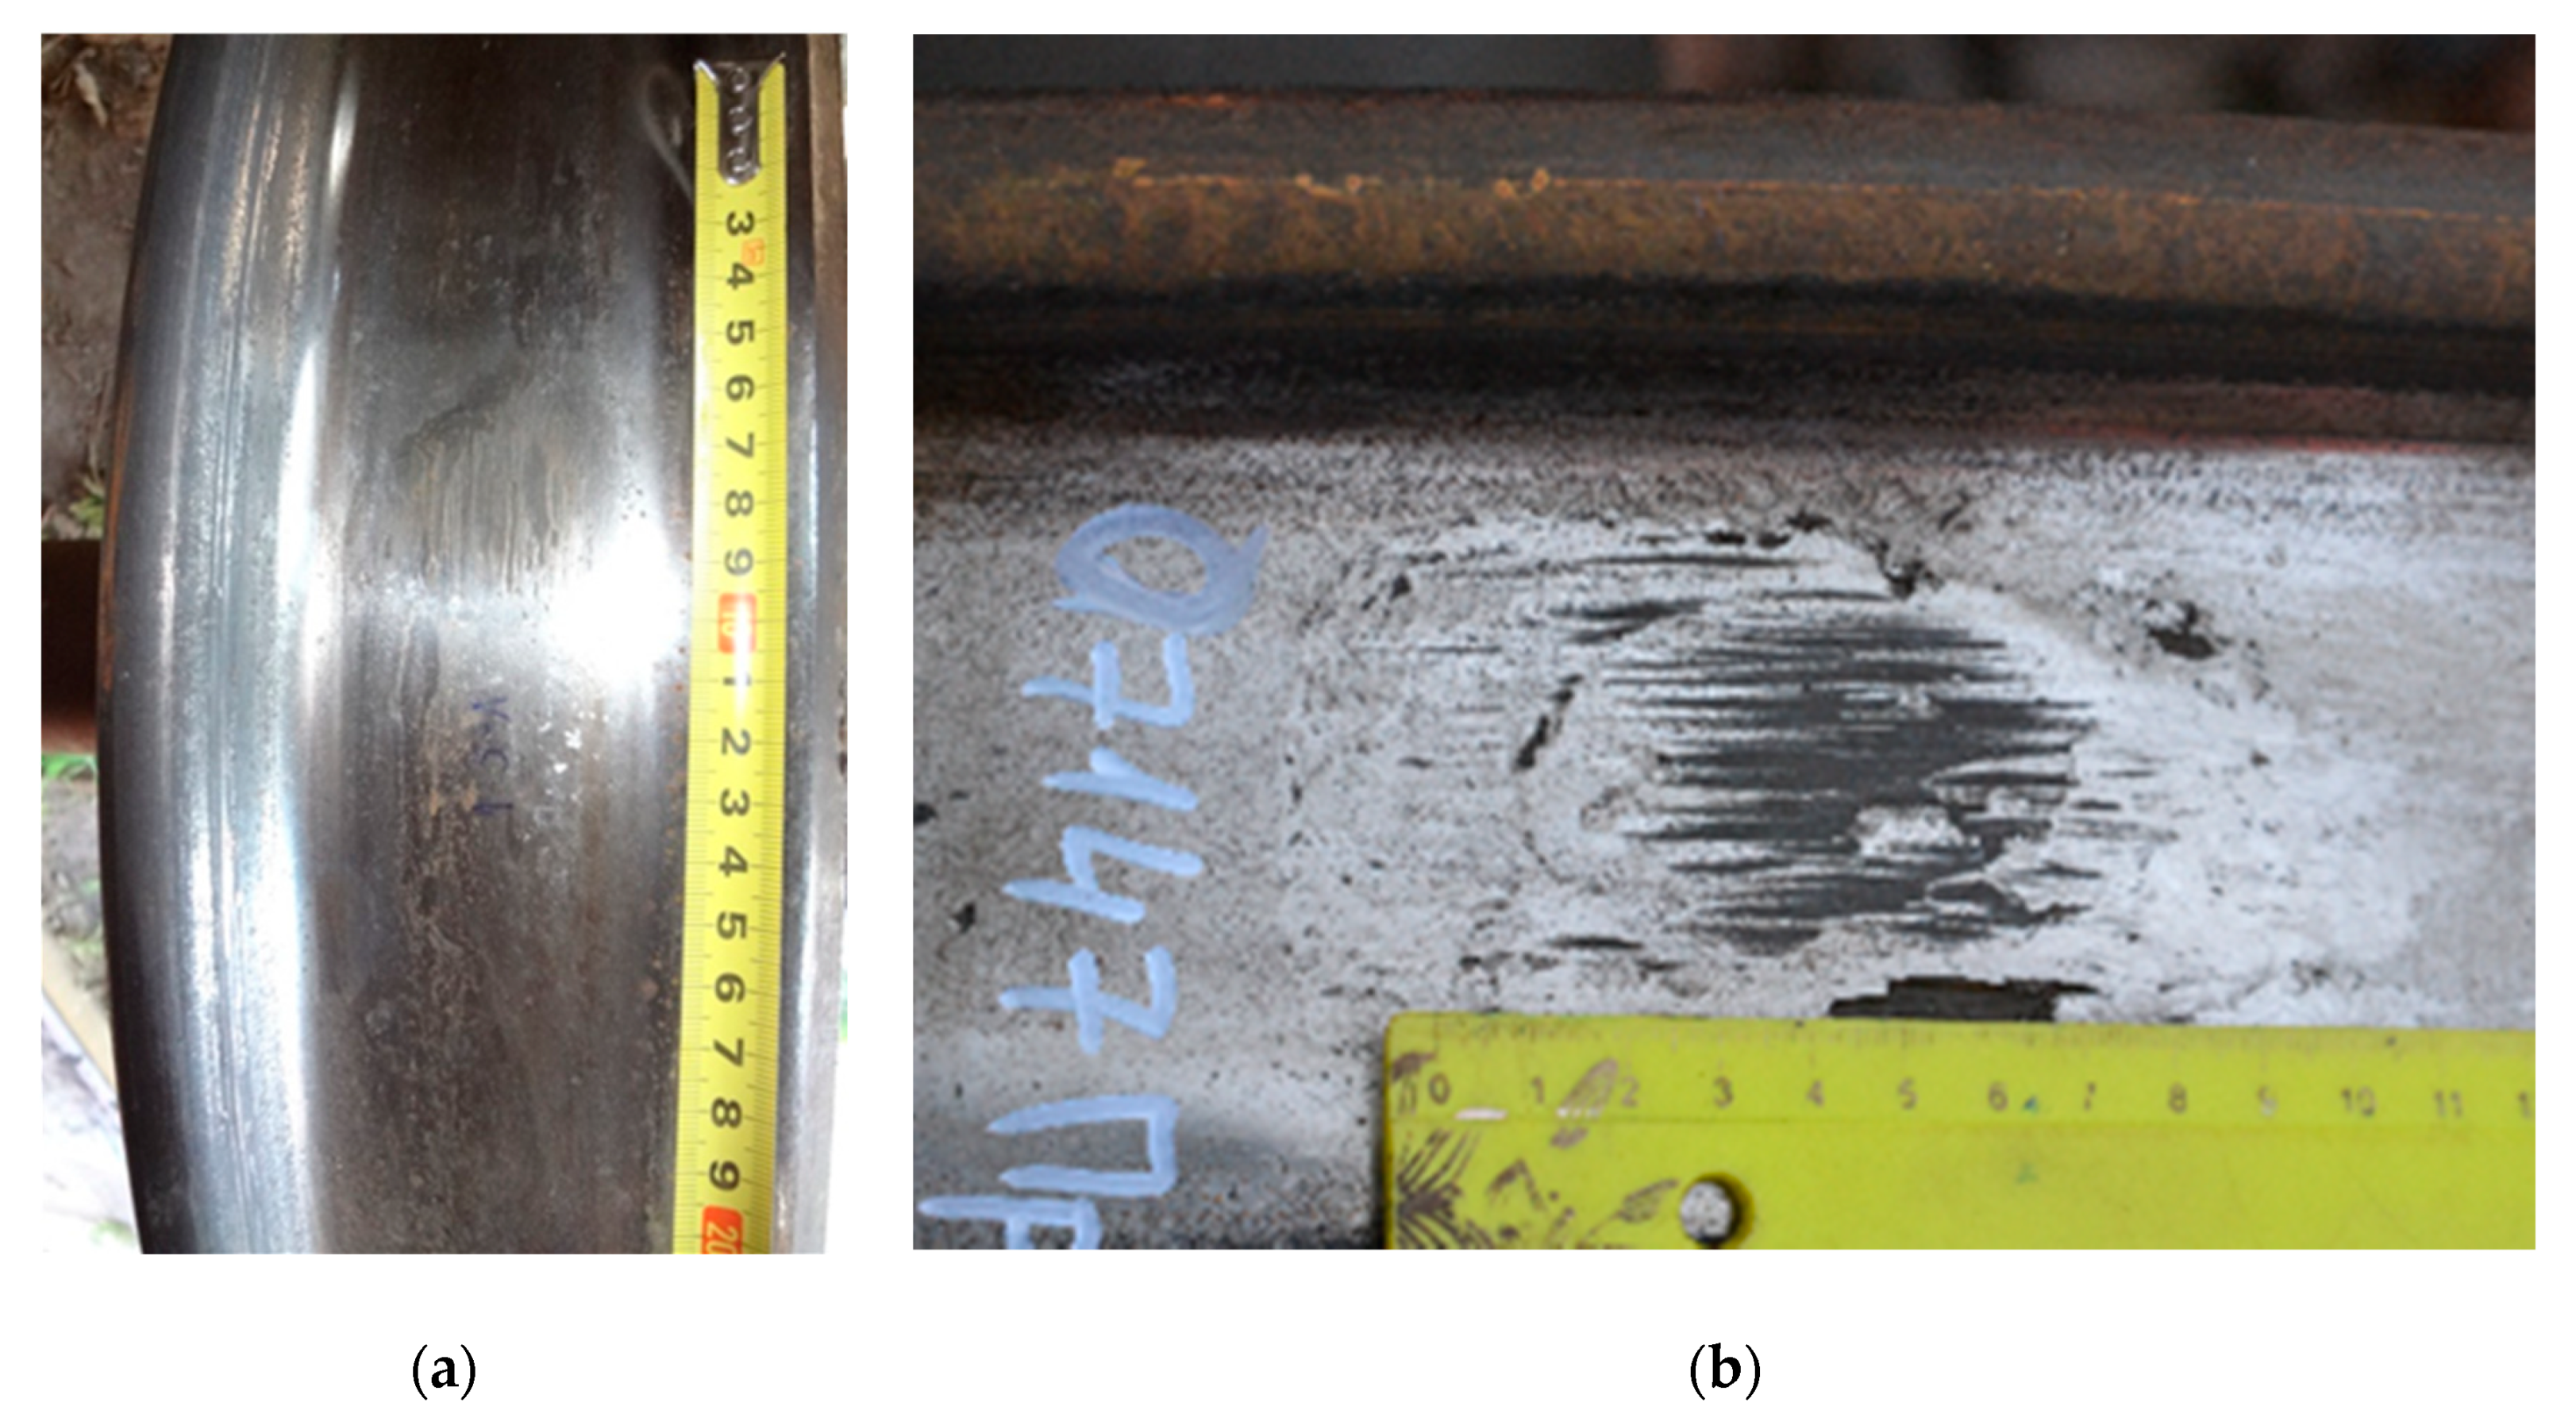
6.3. Unevenness 3: Third Left Wheel, Wheelset Number 11750714704.00

Wheel defects included flat spots of 2.0 × 100 × 70 mm and 0.7 × 30 × 30 mm. The unevenness that was detected is shown in Figure 7 (photos taken before the tests).
Test data show that, according to the factor K d m > 7.0, this wheel was detected in 21 trips (12 trips—”danger 1” and nine trips—”danger 0”) of 144 trips. Thus, the “danger 1” detection rate was 8% and that of “danger 0” was 6%. The overall level of detection in the tests was 14%. During the long journey through all network systems, the detection rate of this defect was 7%.
Twelve trips at different speeds were performed. The results of measurements are presented in Table 4. The results of the measurements show that this unevenness was completely undetected according to the K d m factor, and the unevenness of the vertical strength indicator was detected in 10 out of 12 trips.

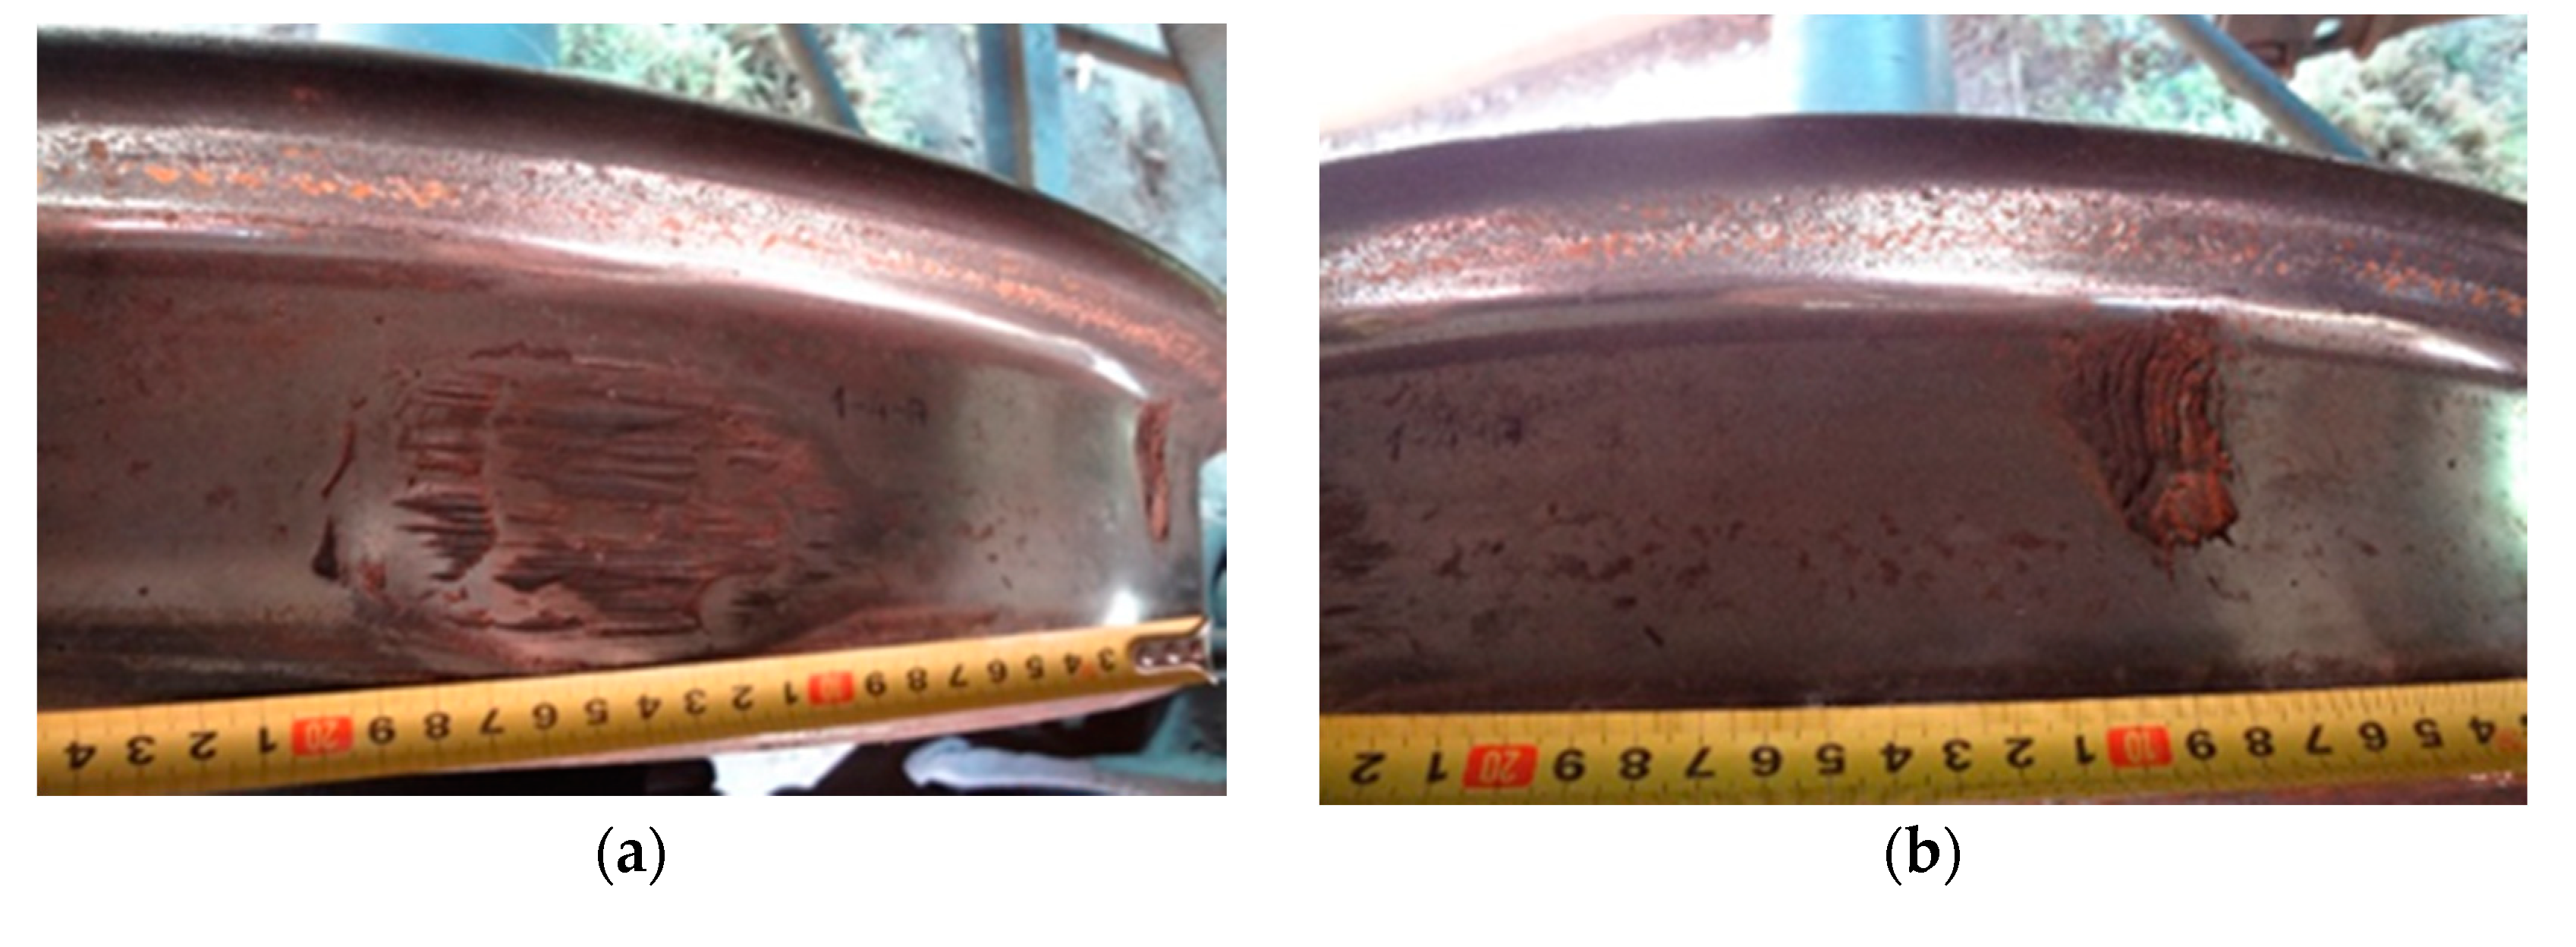
6.4. Unevenness 4: Fourth Right Wheel, Wheelset Number 000558371.90

Wheel defects included a flat spot (after slip and slide) of 2.0 × 80 × 50 mm and a flat spot (after impact) of 30 × 50 × 3.0 mm. The unevenness that was detected is shown in Figure 8 (photos were taken before the tests).
According to test data, using a factor K d m > 7.0, this wheel was detected in two trips (two trips—”danger 0”) out of 72 trips in the summer and two trips (one trip—”danger 1” and one trip—”danger 0”) out of 72 trips in the winter. The overall level of detection in the tests was 14%. During the long journey through all network systems, the detection for this defect was 0%.
Twelve trips at different speeds were performed. The results of measurements are presented in Table 4. The results of the tests show that this unevenness was not completely detected according to the K d m factor, and the unevenness using the vertical strength indicator was detected in eight out of 12 trips at the “danger 0” limit.
A summary of all tests results is presented in Table 4.

7. Proposed Methodology for Metrological Verification of ATLAS-LG Systems

According to ATLAS-LG data system, the Lithuanian public railway infrastructure manager JSC “Lithuanian Railways” detects defects in the rolling stock and, upon their identification, sends the rolling stock for repairs. The rolling stock is often owned by independent carriers and may lead to various legal disputes regarding the reliability of the measuring equipment. In order to avoid this, an ATLAS-LG metrological check is required. Depending on the experiment results and the existing ATLAS-LG service instructions, an ATLAS-LG metrological inspection methodology is proposed.
ATLAS-LG systems are installed at certain points of the Lithuanian railway network. The distances between the installation points are large; therefore, it is recommended that all ATLAS-LG systems be grouped according to their geographical location. It is recommended to use a single freight wagon for testing each system group with wheelsets that have wheels with artificial flat spots using the parameters presented in Table 5.
The metrological test should be carried out once a year in winter, when testing all systems of the same group with the same test train containing the traction device and a loaded wagon with an axle load of 230 kN, where the wheels have artificial flat spots as indicated in Table 5. The pilot train should then perform 5–10 trips per system at the speed of 40–80 km/h. The mean values of the axles of the test train and the derived values of the vertical forces can be evaluated. Next, a metrological certification is carried out according to two indicators.
The derived value of the vertical force determines the probability of wheel detection up to 60–70% according to the average of the base values of the vertical forces of the test train. This parameter allows the evaluation of systematic deviations of the post operation. If the value obtained for a particular post differs from other posts in the same group by more than 10%, then there is a systemic post-work error that needs to be investigated and removed. An error may occur due to the reduced stiffness of the rail base.

8. Discussion

Looking at the scientific literature in Section 1, we can see that, for wheels with rolling surface defects, the forces acting at the point of contact between the wheel and the rail increase with contact with the rails. These vertical dynamic impact forces can cause 3–4-fold greater dynamic forces than the static wheel load. Section 2 lists the possible causes and consequences of these failures. From the information provided in Section 2, it was found that the joints or skates and the associated disc and ring fractures represent a significant percentage of the total number of defects that led to the accidents. It is, therefore, necessary to find and eliminate such defects as early as possible.
As it is difficult to measure the geometrical (direct) parameters of the wheel while running the vehicles and to create systems for measuring such parameters, efforts are being made to develop and determine other (indirect) parameters that would ensure the detection of such failures. The review of such systems in Section 3 shows that all of them, like the ATLAS-LG system used in the study, are focused on measuring the impact forces caused by wheel rolling surface defects and determining their dependences on the size of the defect. Considering that the amount of damage detection of defective wheels of the ATLAS-LG system in Lithuanian railways was not satisfactory, goals were set to improve and set new damage detection parameters and check them. Considering [38], the test runs with defective wheels (also used in the experiment in Section 5 and Section 6) and the measurements were performed with the ATLAS-LG system and the Limited Liability Company (LLC) “Railway Vehicle and Track Interaction Testing Center” measuring equipment.
On the basis of the results of this study, Section 4 describes the ATLAS-LG system improvement algorithm and the determination of the new rejection parameter P d e r i v a t i v e by evaluating the vehicle speed, design, and purpose. Section 5 and Section 6 describe an experiment that confirmed that the new parameter is more reliable. However, to ensure the operation of the system, it is necessary to calibrate it once a year; therefore, Section 7 provides a calibration methodology. According to the results of these tests and inspections, the operation algorithms of ATLAS-LG systems were corrected, and proposals for the Railway Infrastructure Manager of the Republic of Lithuania to use a new wheel damage detection parameter for other Railway Cooperation Managers of the Organization for Cooperation between Railways (OSJD) were prepared.

9. Conclusions

This article presented an analysis of the automatic rolling stock monitoring systems used to evaluate the condition of the wheelsets of the rolling stock, as well as a comparison of methods and criteria for discarding them, and the problems when utilizing them (Section 3).
A methodology for updating the ATLAS-LG system software operation algorithm and setting the new discarding parameter P d e r i v a t i v e was described. To develop the mathematical model of the system, the reverse Laplace transformation was used, and the mathematical model of the wheel with flat surface was derived through frequency characteristics (Section 4).
After the tests, the results showed that the probability of detection of wheel surface unevenness on the required speed limitation according to new parameter P d e r i v a t i v e ranges from 67% to 100%; compared with the previous system of evaluation and the K d m parameter, the increase is 1.8–25-fold. In addition, it allows the identification of unevenness that the current method does not fully detect.
The use of the new P d e r i v a t i v e parameter is more efficient and can more accurately detect wheel damage. Its use will reduce the impact of wheel defects on the railway infrastructure and decrease the maintenance costs.
This article also presented a methodology for ATLAS-LG metrological testing. It is intended for precision use of the parameter and for determining the reliability of the measuring equipment. In order to ensure accurate use of the parameter, it is necessary to carry out a metrological inspection of ATLAS-LG systems in accordance with the proposed methodology once a year. Section 7 provides a calibration methodology.
On the basis of the results of these tests and inspections, the Railway Infrastructure Manager of the Republic of Lithuania has prepared proposals for the use of a new parameter for detection of wheel damage to other Organization for Cooperation between Railways (OSJD) railway infrastructure managers.
In the future, we will use this proposed P d e r i v a t i v e parameter and the ATLAS-LG system for experimental studies by linking it to the sound produced by the impact forces due to wheel defects.

Author Contributions

V.K., B.K., M.L. and R.J. conceived the presented idea; processed and analyzed the data, wrote the paper. All authors have read and agreed to the published version of the manuscript.

Funding

The research was funded by the Vilnius Gediminas Technical University (VGTU).

Conflicts of Interest

The authors declare no conflict of interest.

References

  1. Zhang, S.; Xiao, X.; Wen, Z.; Jin, X. Effect of unsupported sleepers on wheel/rail normal load. Soil Dyn. Earthq. Eng. 2008, 28, 662–673. [Google Scholar] [CrossRef]
  2. Zakeri, J.A.; Xia, H.; Fan, J.J. Dynamic responses of train-track system to single rail irregularity. Lat. Am. J. Solids Struct. 2009, 6, 89–104. Available online: https://www.lajss.org/index.php/LAJSS/article/view/208 (accessed on 8 October 2020).
  3. Uzzal, R.U.A.; Stiharu, I.; Ahmed, W. Design and Analysis of MEMS based Accelerometer for Automatic Detection of Railway Wheel Flat. Int. Sch. Sci. Res. Innov. 2009, 3, 785–793. [Google Scholar] [CrossRef]
  4. Ward, C.P.; Goodball, R.M.; Dixon, R. Contact force estimation in the railway vehicle wheel-rail interface. In Proceedings of the 18th IFAC World Congress, Milano, Italy, 28 August 2011; pp. 4398–4403. [Google Scholar] [CrossRef] [Green Version]
  5. Zhu, Y.; Olofsson, U. An adhesion model for wheel–rail contact at the micro level using measured 3d surfaces. Wear 2012, 314, 62–170. [Google Scholar] [CrossRef]
  6. Zhai, W.M.; Sun, X.A. A detailed model for investigating vertical interaction between railway vehicle and track. Vehicle Syst. Dyn. 1994, 23, 603–615. [Google Scholar] [CrossRef]
  7. Zhu, J.J.; Ahmed, A.K.W.; Rakheja, S. An Adaptive Contact Model for Simulation of Wheel-rail Impact Load due to a Wheel Flat. In Proceedings of the 13th National Conference on Mechanisms and Machines, IISc, Bangalore, India, 12–13 December 2007; pp. 157–164. Available online: https://pdfs.semanticscholar.org/5e02/4433f27891bfc354a81f6ef7cb8d81847d5a.pdf (accessed on 8 October 2020).
  8. Mazilu, T. A dynamic model for the impact between the wheel flat and rail. U.P.B. Sci. Bull. Ser. D 2007, 69, 131–144. Available online: https://www.scientificbulletin.upb.ro/rev_docs_arhiva/full58723.pdf (accessed on 8 October 2020).
  9. Hertz, H. Über die Berührung Fester Elastische Körper und über die Harte. Verh. Des. Ver. Zur Beförderung Des. Gewerbefleisses 1882, 449–463. Available online: https://home.uni-leipzig.de/pwm/web/download/Hertz1881.pdf (accessed on 8 October 2020).
  10. Carter, F.C. On the Action of a Locomotive Driving Wheel. Proc. R. Soc. Lond. A 1926, 112, 151–157. [Google Scholar] [CrossRef]
  11. Kalker, J.J. Wheel–rail rolling contact theory. Wear 1991, 144, 243–261. [Google Scholar] [CrossRef]
  12. Love, A.E.H. A Treatise on the Mathematical Theory of Elasticity; University Cambridge Press: Cambridge, UK, 1906; p. 580. [Google Scholar]
  13. Timoshenko, S.P.; Gudier, J. Elasticity Theory; Nauka: Moscow, Rusisa, 1979; p. 576. [Google Scholar]
  14. Bogdevičius, M. Vehicle Dynamics; Technika: Palanga, Lithuania, 2012; p. 206. (In Lithuanian) [Google Scholar]
  15. Bian, J.; Gu, Y.; Murray, M.H. A dynamic wheel-rail impact analysis of railway track under wheel flat by finite element analysis. Vehicle. Syst. Dyn. 2013, 51, 784–797. [Google Scholar] [CrossRef] [Green Version]
  16. Pogorelov, D.U.; Pavlukov, A.E.; Iudakova, T.A.; Kotov, S.V. Modeling of dynamic systems bodies contact impact problems. Dyn. Resist. Reliab. Veh. V.I. Sakalo. Briansk BGTU 2001, 531.13, 11–23. (In Russian) [Google Scholar]
  17. Nielsen, J.C.O.; Abrahamsson, T.J.S. Coupling of physical and modal components for analysis of moving non-linear dynamic systems on general beam structures. Int. J. Numer. Methods Eng. 1992, 33, 1843–1859. [Google Scholar] [CrossRef]
  18. Barke, D.W.; Chiu, W.K. A review of the effects of out-of-round wheels on track and vehicle components. Proc. Inst. Mech. Eng. Part. F J. Rail Rapid Transit. 2005, 219, 151–175. [Google Scholar] [CrossRef]
  19. Sackfield, A.; Dini, D.; Hills, D.A. The contact problem for a wheel having a ’flat’. Wear 2006, 261, 1265–1270. [Google Scholar] [CrossRef]
  20. Sackfield, A.; Dini, D.; Hills, D.A. Contact of a rotating wheel with a flat. Int. J. Solids Struct. 2007, 44, 3304–3316. [Google Scholar] [CrossRef] [Green Version]
  21. Shabana, A.A.; Rathod, C. Geometric coupling in the wheel/rail contact formulations: A comparative study. J. Multi–Body Dyn. 2007, 221, 147–160. [Google Scholar] [CrossRef]
  22. Shabana, A.A.; El–Ghandour, A.I.; Zaazaa, K.E. Study of the effect of the spiral geometry on wheel/rail contact forces. J. Multi–Body Dyn. 2011, 225, 111–125. [Google Scholar] [CrossRef]
  23. Kouroussis, G.; Gazetas, G.; Anastasopoulos, I.; Conti, C.; Verlinden, O. Discrete modelling of vertical track–soil coupling for vehicle–track dynamics. Soil Dyn. Earthq. Eng. 2011, 31, 1711–1723. [Google Scholar] [CrossRef]
  24. Pieringer, A.; Kropp, W.; Nielsen, J.C.O. The influence of contact modelling on simulated wheel/rail interaction due to wheel flats. Wear 2014, 314, 273–281. [Google Scholar] [CrossRef] [Green Version]
  25. Nielsen, J.C.O.; Oscarsson, J. Simulation of dynamic train–track interaction with state–dependent track properties. J. Sound Vib. 2004, 275, 515–532. [Google Scholar] [CrossRef]
  26. Wiest, M.; Kassa, E.; Daves, W.; Nielsen, J.C.O.; Ossberger, H. Assessment of methods for calculating contact pressure in wheel-rail/switch contact. Wear 2008, 265, 1439–1445. [Google Scholar] [CrossRef]
  27. Pieringer, A.; Kropp, W. A fast time-domain model for wheel/rail interaction demonstrated for the case of impact forces caused by wheel flats. J. Acoust. Soc. Am. 2008, 123, 3266. [Google Scholar] [CrossRef]
  28. Wasiwitono, U.; Zheng, D.; Chiu, W.K. How useful is track acceleration for monitoring impact loads generated by wheel defects? In Proceedings of the 5th Australasian Congress on Applied Mechanics, Brisbane, Australia, 10–12 December 2007; pp. 502–507. [Google Scholar]
  29. Kumar, V.; Rastogi, V. Investigation of vertical dynamic behaviour and modelling of a typical Indian rail road vehicle through bond graph. World J. Model. Simul. 2009, 5, 130–138. [Google Scholar]
  30. Ferrara, R.; Leonardi, G.; Jourdan, F. Numerical Modelling of Train Induced Vibrations. Procedia Soc. Behav. Sci. 2012, 53, 155–165. [Google Scholar] [CrossRef]
  31. Wang, K.; Liu, P.F.; Zhai, W.; Huang, C.; Chen, Z.; Gao, J. Wheel/rail dynamic interaction due to excitation of rail corrugation in high–speed railway. Spec. Top. High. Speed Railw. Infrastruct. 2015, 58, 226–235. [Google Scholar] [CrossRef]
  32. Danilov, V.N. Calculation of railway path in the zone of the joints. Work. JSC Vniizht 1952, 70, 116. (In Russian) [Google Scholar]
  33. Andreev, G.E. The Work of the Superstructure in Straight Sections during High-Speed Train Traffic. Ph.D. Thesis, St. Petersburg State Transport University, St. Petersburg, Russia, 1974. [Google Scholar]
  34. Kogan, A.Y. Vertical dynamic forces acting on a path. Work. JSC Vniizht 1969, 402, 208. (In Russian) [Google Scholar]
  35. Kogan, A.Y.; Verkhotin, A.A. Calculation of the impact on the path of a pair of wheels with a slider//Studies on the possibility of increasing train speeds. JSC Vniizht 1984, 5, 31–37. (In Russian) [Google Scholar]
  36. Kogan, A.Y. Track Dynamics and Its Interaction with Rolling Stock. Transport. 1997, 328. Available online: https://search.rsl.ru/ru/record/01001788753 (accessed on 13 January 2020). (In Russian).
  37. Guidelines for the Calculation of the Vertical Unsteady Stress-Strain State of the Track on Wooden and Reinforced Concrete Sleepers in the Area of the Rail Junction; Ministry of Transport of the Russian Federation: Moscow, Russia, 2005. (In Russian)
  38. Assessment of Rolling Stock Geometry and Risk of Rolling Surface Defects; JSC Railway Products Conformity Assessment Centre: Vilnius, Lithuania, 2015. (In Lithuanian)
  39. Mosleh, A.; Costa, P.A.; Calçada, R. A new strategy to estimate static loads for the dynamic weighing in motion of railway vehicles. Proc. Inst. Mech. Eng. Part. F J. Rail Rapid Transit. 2020, 234, 183–200. [Google Scholar] [CrossRef]
  40. Xu, J.; Wang, P.; Wang, L.; Chen, R. Effects of profile wear on wheel–rail contact conditions and dynamic interaction of vehicle and turnout. Adv. Mech. Eng. 2016, 8, 1687814015623696. [Google Scholar] [CrossRef] [Green Version]
  41. Chen, R.; Chen, J.; Wang, P.; Xu, J.; Xiao, J. Numerical investigation on wheel-turnout rail dynamic interaction excited by wheel diameter difference in high-speed railway. J. Zhejiang Univ. Sci. A 2017, 18, 660–676. [Google Scholar] [CrossRef]
  42. Dindar, S.; Kaewunruen, S.; An, M.; Sussman, J.M. Bayesian Network-based probability analysis of train derailments caused by various extreme weather patterns on railway turnouts. Saf. Sci. 2018, 110, 20–30. [Google Scholar] [CrossRef] [Green Version]
  43. Tunna, J.; Sinclair, J.; Pérez, J. A Review of wheel wear and rolling contact fatigue. Proceedings of the Institution of Mechanical Engineers. Proc. Inst. Mech. Eng. Part. F J. Rail Rapid Transit. 2007, 221, 271–289. [Google Scholar] [CrossRef]
  44. Enblom, R. Deterioration mechanisms in the wheel–rail interface with focus on wear prediction: A literature review. Vehicle. Syst. Dyn. 2009, 47, 661–700. [Google Scholar] [CrossRef]
  45. Zhai, W.; Gao, J.; Liu, P.; Wang, K. Reducing rail side wear on heavy-haul railway curves based on wheel–rail dynamic interaction. Vehicle. Syst. Dyn. 2014, 52, 440–454. [Google Scholar] [CrossRef]
  46. Liu, X.; Markine, V.L. Train Hunting Related Fast Degradation of a Railway Crossing—Condition Monitoring and Numerical Verification. Sensors 2020, 20, 2278. [Google Scholar] [CrossRef] [PubMed] [Green Version]
  47. Aniołek, K.; Herian, J. Numerical Modeling of Load and Stress on the Contact Surface of a Turnout and a Railway Vehicle. J. Transp. Eng. 2013, 139, 533–539. [Google Scholar] [CrossRef]
  48. Kataoka, H.; Abe, N.; Wakatsuki, O. Evaluation of service life of jointed rails. QR RTRI 2002, 43, 101–106. [Google Scholar] [CrossRef]
  49. Xin, L. Long-Term Behaviour of Railway Crossings: Wheel–Rail Interaction and Rail Fatigue Life Prediction. Ph.D. Thesis, TU Delft, Delft, The Netherlands, 2017. [Google Scholar]
  50. Kampczyk, A. Measurement of the Geometric Center of a Turnout for the Safety of Railway Infrastructure Using MMS and Total Station. Sensors 2020, 20, 4467. [Google Scholar] [CrossRef]
  51. Monk-Steel, A.; Thompson, D.; Beer, F.; Janssens, M. An investigation into the influence of longitudinal creepage on railway squeal noise due to lateral creepage. J. Sound Vib. 2006, 293, 766–776. [Google Scholar] [CrossRef]
  52. Kardas-Cinal, E. Comparative study of running safety and ride comfort of railway vehicle. Pr. Nauk. Politech. Warsz. 2009, 71, 75–84. [Google Scholar]
  53. Kardas-Cinal, E. Selected problems in railway vehicle dynamics related to running safety. Arch. Transp. 2015, 31, 37–45. [Google Scholar] [CrossRef]
  54. Hecht, M.; Wunderli, J.; Thron, T.; Sehu, D. sonRAIL—The new Swiss calculation model for railway noise. Notes Numer. Fluid Mech. Multidiscip. Des. 2012, 118, 515–522. [Google Scholar] [CrossRef]
  55. Fletcher, D.I.; Beynon, J.H. The effect of intermittent lubrication on the fatigue life of pearlitic rail steel in rolling-sliding contact. Proc. Inst. Mech. Eng. Part. F J. Rail Rapid Transit. 2000, 214, 145. [Google Scholar] [CrossRef]
  56. Descartes, S.; Saulot, A.; Godeau, C.; Bondeux, S.; Dayot, C.; Berthier, Y. Wheel flange/rail gauge corner contact lubrication: Tribological investigations. Wear 2011, 271, 54–61. [Google Scholar] [CrossRef]
  57. Shi, D.; Yunguang, Y.; Gillwald, M.; Hecht, M. Robustness enhancement of machine fault diagnostic models for railway applications through data augmentation. Proj. Innov. Monit. Predict. Maint. Solut. Lightweight Wagon (Innowag) 2020. [Google Scholar] [CrossRef]
  58. Deshimaru, T.; Kataoka, H.; Abe, N. Estimation of Service Life of Aged Continuous Welded Rail. Q. Rep. Rtri 2006, 47, 211–215. [Google Scholar] [CrossRef]
  59. Freimanis, A.; Kaewunruen, S. Peridynamic analysis of rail squats. Appl. Sci. 2018, 8, 2299. [Google Scholar] [CrossRef] [Green Version]
  60. Dybeł, K.; Kampczyk, A. Symbols and codes used in the cartographic documentation of railway areas. Probl. Kolejnictwa 2019, 182, 115–129. [Google Scholar]
  61. Zarembski, A.M. Wheel/rail impact: P1 and P2 forces. Railw. Track Struct. 1995, 1, 9–10. [Google Scholar]
  62. Technical Description of ATLAS-LG System, RAKP Project. ATLAS-LG Requirements for Installation; VAE Eisenb. GMBH: Eisenberg, Germany, 2006; Volume 8, p. 0124490769.
  63. Guidelines to Best Practices for Heavy Haul Railway Operations: Wheel and Rail Interface Issues. Available online: https://ihha.net/resources-ihha/ecopy (accessed on 13 January 2020).
  64. WILD Wheel Impact Load Detector; Salient Systems, Inc.: Austin, TX, USA, 2020.
  65. Scalex Wild Wheel Impact Load Detector and Control. Scale; Tampton: Tampere, Finland, 2020.
  66. Vertical Dynamic Load Monitoring System “AGUILA”, Based on Fiber Optic Pressure Sensors; ITSS: Puerto de Sagunto, Spain, 2014. (In Russian)
  67. Mobile Monitoring System for Train., Vehicle and Infrastructure under Real Operating Conditions; Innotec System GMBH, Lasca: Hannover, Germany, 2020.
  68. Kogan, A.Y.; Romen, U.S.; Bogdanov, V.M.; Levinzon, M.A.; Verchotin, A.A. The investigation of effect of impact from wheel on rail because of availability perturbation no rolling surface of wheel. In Proceedings of the World congress on Railway research, Florence, Italia, 16–19 November 1997; p. 401. [Google Scholar]
  69. System for monitoring rail loads and technical condition of wagons. Railw. World 2000, 1, 12. (In Russian)
Figure 1. Contribution of wheel defects (by type of defects) to causes of accidents (percentage).
Applsci 10 07148 g001
Figure 2. ATLAS LG system measuring zone.
Applsci 10 07148 g002
Figure 3. Scheme of test train; 1–4—inspected wheelsets.
Applsci 10 07148 g003
Figure 4. Performing the experiment. The picture shows the draisine (yellow), the wagon with wheel damage (green), and the ATLAS-LG system equipment post (white).
Applsci 10 07148 g004
Figure 5. Wheel with surface unevenness ((a,b)–flat spot)—unevenness 1.
Applsci 10 07148 g005
Figure 6. Wheel with surface unevenness ((a,b)–flat spot)—unevenness 2.
Applsci 10 07148 g006
Figure 7. Wheel with surface unevenness ((a,b)–flat spot)—unevenness 3.
Applsci 10 07148 g007
Figure 8. Wheel with surface unevenness ((ad)–flat spot)—unevenness 4.
Applsci 10 07148 g008aApplsci 10 07148 g008b
Table 1. Limits of vertical loads transmitted to the railhead when impact equipment is used for testing. The tests were performed in a climatic chamber at the appropriate ambient temperature [68].
Defects in Rail SampleVertical Loads, kN
Temperature of Rail 20 °CTemperature of Rail −20 °CTemperature of Rail −60 °C
Without defects20001000-
With defects-330240
Table 2. Defective wheel definition normatives according to two factors of strength group parameters (factor). The table was constructed on the basis of the literature presented in Section 3.1, Section 3.2, Section 3.3, Section 3.4 and Section 3.5.
Country and Additional InformationDriving Speed,
km/h
Acceleration in Journal Box, g
(Multiply by g = 9.81 m/s2)
Maximum Vertical Force, kNThe Ratio of the Maximum Force to the Background
For RepairsUncouple
In Russia, for wagons6025–30370450-
In Russia, for passenger wagons20 km length on the trackWinter: 45
Summer: 30
--3
In Russia (letter of V.A. Gapanovich
13 May 2013)
--370450-
USA
(WIM-WIM)
45-270450-
USA (TTCI, Transportation Technology Center Inc.)72-273350-
India55–65-2003502.0–4.5
Lithuania, ATLAS-LG system----3–5 locomotives and electrical trains 6.5–11 wagons
Poland,
System ATLAS
--3003504.5–5.0
Sweden,
System ATLAS
--300 locomotive
190 wagon
425 locomotive
320 wagon
4.7 locomotive
5.2 wagon
UK, system ATLAS--350400-
Germany, system ATLAS---01.7 (three times)
Table 3. Measurement results of wheel unevenness.
No. of WheelsetNumber of Wheelset (from Manufacturer)Definition of Wheel Surface Defects
Left WheelRight Wheel
Flat Spot Size, mm (Inspected in Known Experiment [38])Flat Spot Size, mm (Inspected in Current Experiment)Flat Spot Size, mm (Inspected in Known Experiment [38])Flat Spot Size, mm (Inspected in Current Experiment)
1002964405.89-Wheel flat spot after impact
10 × 20 × 2.0
-Wheel flat spot after slip and slide
50 × 45 × 3.0
7 × 25 × 2.0
211752782106.00Wheel flat spots after slip and slide
3.0 × 120 × 60
1.0 × 70 × 50
Wheel flat spot after impact
110 × 45 × 4.0
Wheel flat spots after slip and slide
3.0 × 170 × 60
1.0 × 70 × 50
1.5 × 80 × 50
Wheel flat spot after slip and slide
2 × 190 × 50
Wheel flat spots
after impact
40 × 60 × 4.0
130 × 30 × 4.0
Wheel flat spots
after slip and slide
2 × 190 × 60
1.5 × 170 × 60
311750714704.00Wheel flat spot
after slip and slide
1.5 × 70 × 55
Wheel flat spots
after slip and slide
2.0 × 100 × 70
0.7 × 30 × 30
-No damage
4000558371.90-No damageWheel flat spot
after slip and slide
2.0 × 80 × 50
Wheel flat spot
after impact
30 × 45 × 3.0
Wheel flat spot after slip and slide
2.0 × 80 × 50
Wheel flat spot
after impact
30 × 50 × 3.0
Table 4. A summary of all test results (maximum achieved value is P d e r i v a t i v e ).
TripSpeed, km/hDirectionLeft WheelRight Wheel
Wheelset No. 5 from Atlas-LG System Wheelset No. 6 from ATLAS-LG SystemWheelset No. 7 from ATLAS-LG SystemWheelset no. 8 from Atlas-LG SystemWheelset No. 5 from ATLAS-LG SystemWheelset No. 6 from ATLAS-LG System Wheelset No. 7 from ATLAS-LG SystemWheelset No. 8 from ATLAS-LG System
Maximum Achieved Value, kN (Danger Limit 450/350)KdM (Danger Level), DimensionlessMaximum Actual Value, kNMaximum Achieved Value, kN (Danger Limit 450/350)KdM (Danger Level), DimensionlessMaximum Actual Value, kNMaximum Achieved Value, kN (Danger Limit 450/350)Maximum Achieved Value, kN (Danger Limit 450/350)Maximum Achieved Value, kN (Danger Limit 450/350)KdM (Danger Level), DimensionlessMaximum Actual Value, kNMaximum Achieved Value, kN (Danger Limit 450/350)Maximum Achieved Value, kN (Danger Limit 450/350) KdM (Danger Level), DimensionlessMaximum Actual Value, kNMaximum Achieved Value, kN (Danger Limit 450/350)
11271855.0Forward311.146.68393.8469.60 *7.33 (1)418.22455.75 *222.54273.476.30385.33497.88 *267.07 6.41362.55447.81 **
11402247.5Forward345.436.33391.1481.70 *5.52303.58469.09 *264.07314.566.24368.17420.62 **259.23 5.15305.48412.09 **
11511141.0Forward352.75 **5.94355.5474.86 *5.06304.88501.01 *280.67313.036.35388.72428.79 **296.544.92290.40418.43 **
12042157.0Forward305.617.24 (0)427.7493.98 *6.53365.84423.52 *222.01271.615.69367.30446.23 **261.895.13288.04375.13 **
12181860.6Forward292.887.77 (1)468.2516.11 *5.96322.96393.23 **210.23263.385.42338.06401.29 **206.203.53249.09300.72
12303057.5Forward279.787.86 (1)451.4520.08 *6.47366.23418.51 **217.32262.115.76352.28444.02 **236.064.88307.89374.67 **
12455859.3Forward295.878.30 (1)488.5543.41 *6.03335.48398.67 **205.89242.905.51335.04412.68 **234.654.99324.00378.27 **
13015651.2Forward279.128.11 (1)489.7564.57 *7.00 (0)377.07440.00 **251.07270.275.84351.91480.84 *247.015.01301.36395.42 **
13172972.3Forward304.459.89 (1)511.3551.78 *8.89 (1)512.79360.23 **187.75230.275.57333.02512.79 *181.475.53304.86304.46
13333576.7Forward236.258.14 (1)421.6452.78 *5.55358.40295.23192.48224.814.81257.48395.26 **183.175.42365.40353.21 **
13490475.7Forward254.149.05 (1)483.3508.81 *6.65397.07323.30184.26214.475.09300.96407.31 **184.524.88321.61323.50
14051677.7Forward263.077.92 (1)465.6466.80 *6.81358.69373.27 **175.94190.995.94381.53387.98 **170.165.41323.38335.31
Wheel number in the actwheelset No. 1 (left side)wheelset No. 2 (left side)wheelset No. 3 (left side)wheelset No. 4 (left side)wheelset No. 1 (right side)wheelset No. 2 (right side)wheelset No. 3 (right side)wheelset No. 4 (right side)
Axle number (from manufacturer)0029654405.89117552782106.00 (registered dangers)11750714704.00000558371.900029654405.89117552782106.00 (registered dangers)11750714704.00000558371.90
Unevenness of the wheelsflat spot (after impact) flat spots (after slip and slide) flat spot (after slip and slide) 0.7 × 30 × 30 mm-flat spot (after impact) 50 × 45 × 3 mmflat spot (after slip and slide) 2 × 190 × 60 mm *-flat spot (after slip and slide) 2 × 80 × 50 mm *
10 × 20 × 2 mm1 × 70 × 50 mm
-3 × 170 × 60 mm *flat spot (after slip and slide) 2 × 100 × 70 mm *-flat spot (after impact) 7 × 25 × 2 mm1.5 × 170 × 60 mm-flat spot (after impact) 30 × 50 × 3 mm
-flat spot (after slip and slide) 1.5 × 80 × 50 mm- - -
Detection probability, %danger 1-10033 25
danger 0- 50 75 67
In Total-100 *83 * 100 * 67 *
Detection according to ATLAS KdM,% based on previous test resultsTestsdanger 1-428 8 0.7
danger 0-176 6 2
In total-59 *14 * 14 * 2.7 *
Trips-137 7 0
* “danger 1”; ** “danger 0”.
Table 5. Testing each system group with the wheelsets.
No. of WheelsetLength, mmDepth, mmExpected Danger Level
1621.00
2751.50
3872.01/0
41063.01
Publisher’s Note: MDPI stays neutral with regard to jurisdictional claims in published maps and institutional affiliations.

