Experimental Investigation on Glaze Ice Accretion and Its Influence on Aerodynamic Characteristics of Pipeline Suspension Bridges
Abstract
1. Introduction
2. Ice Accretion Tests
2.1. Facilities and Experimental Procedure
2.2. Testing Cases
2.3. Ice Accretion Parameters
3. Characteristics of Ice Accretion on Diverse Members
3.1. Ice Accretion on Pipeline
3.1.1. Influence of Pipeline Diameter
3.1.2. Influence of Icing Duration
- (1)
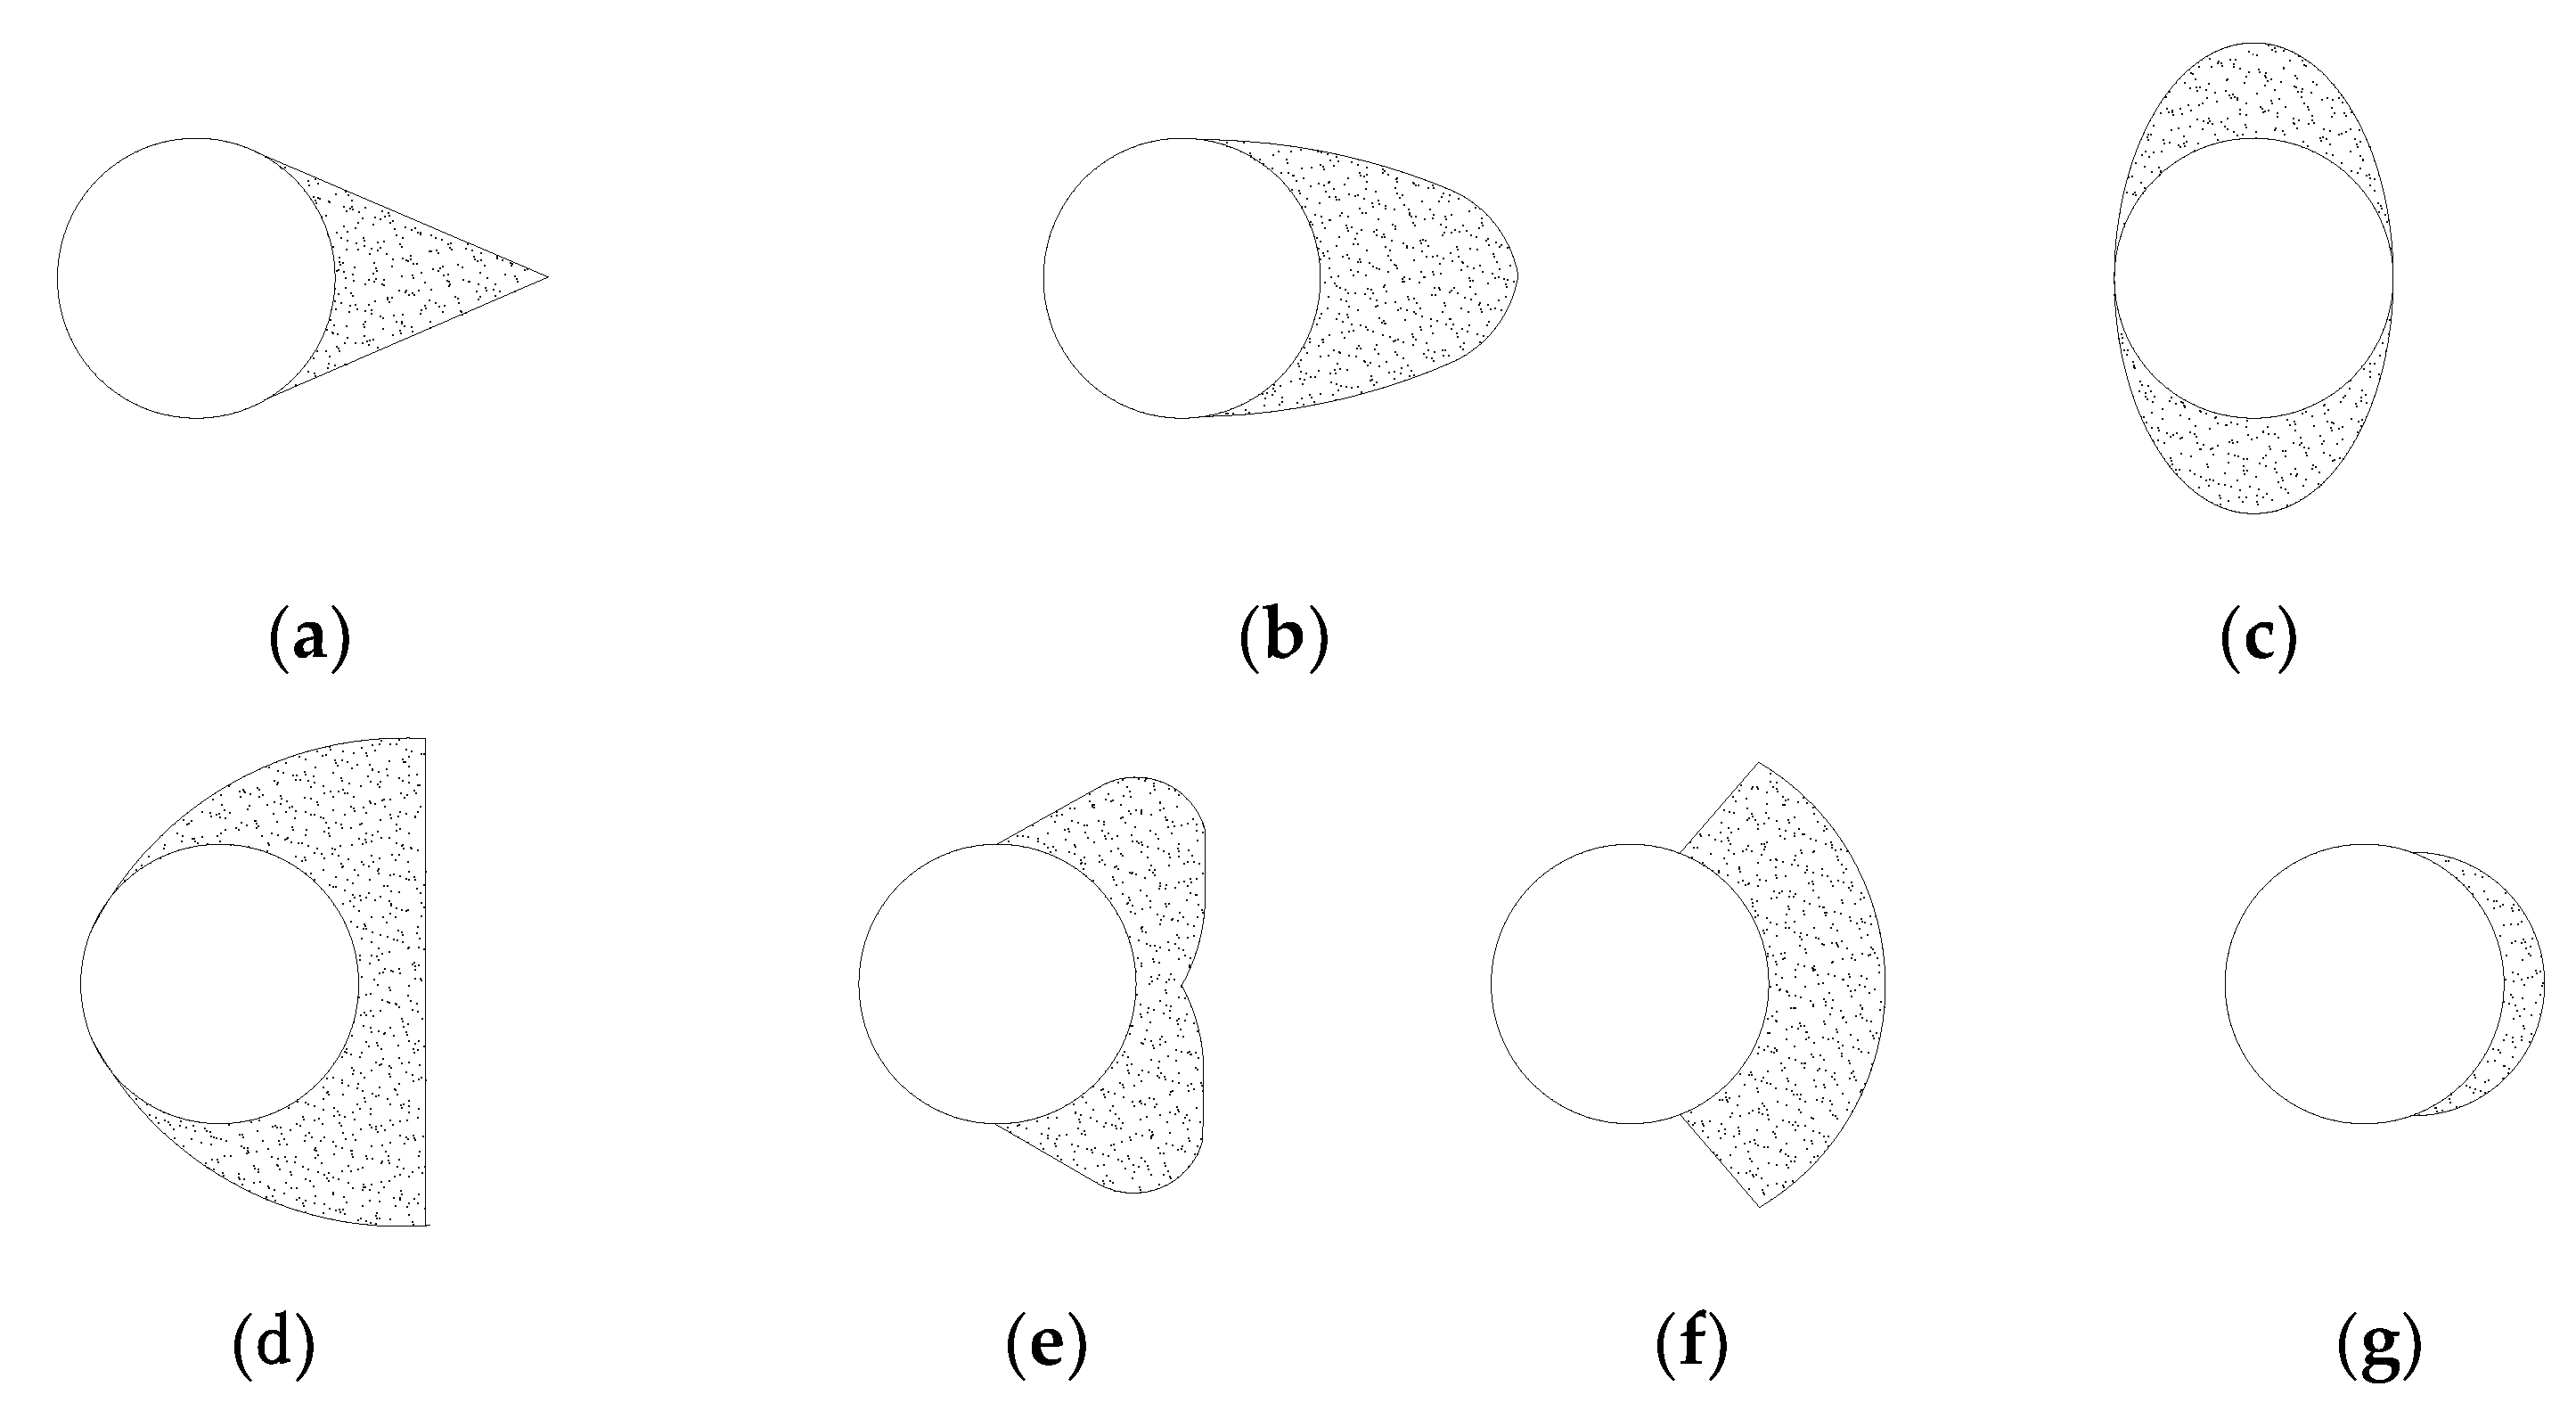
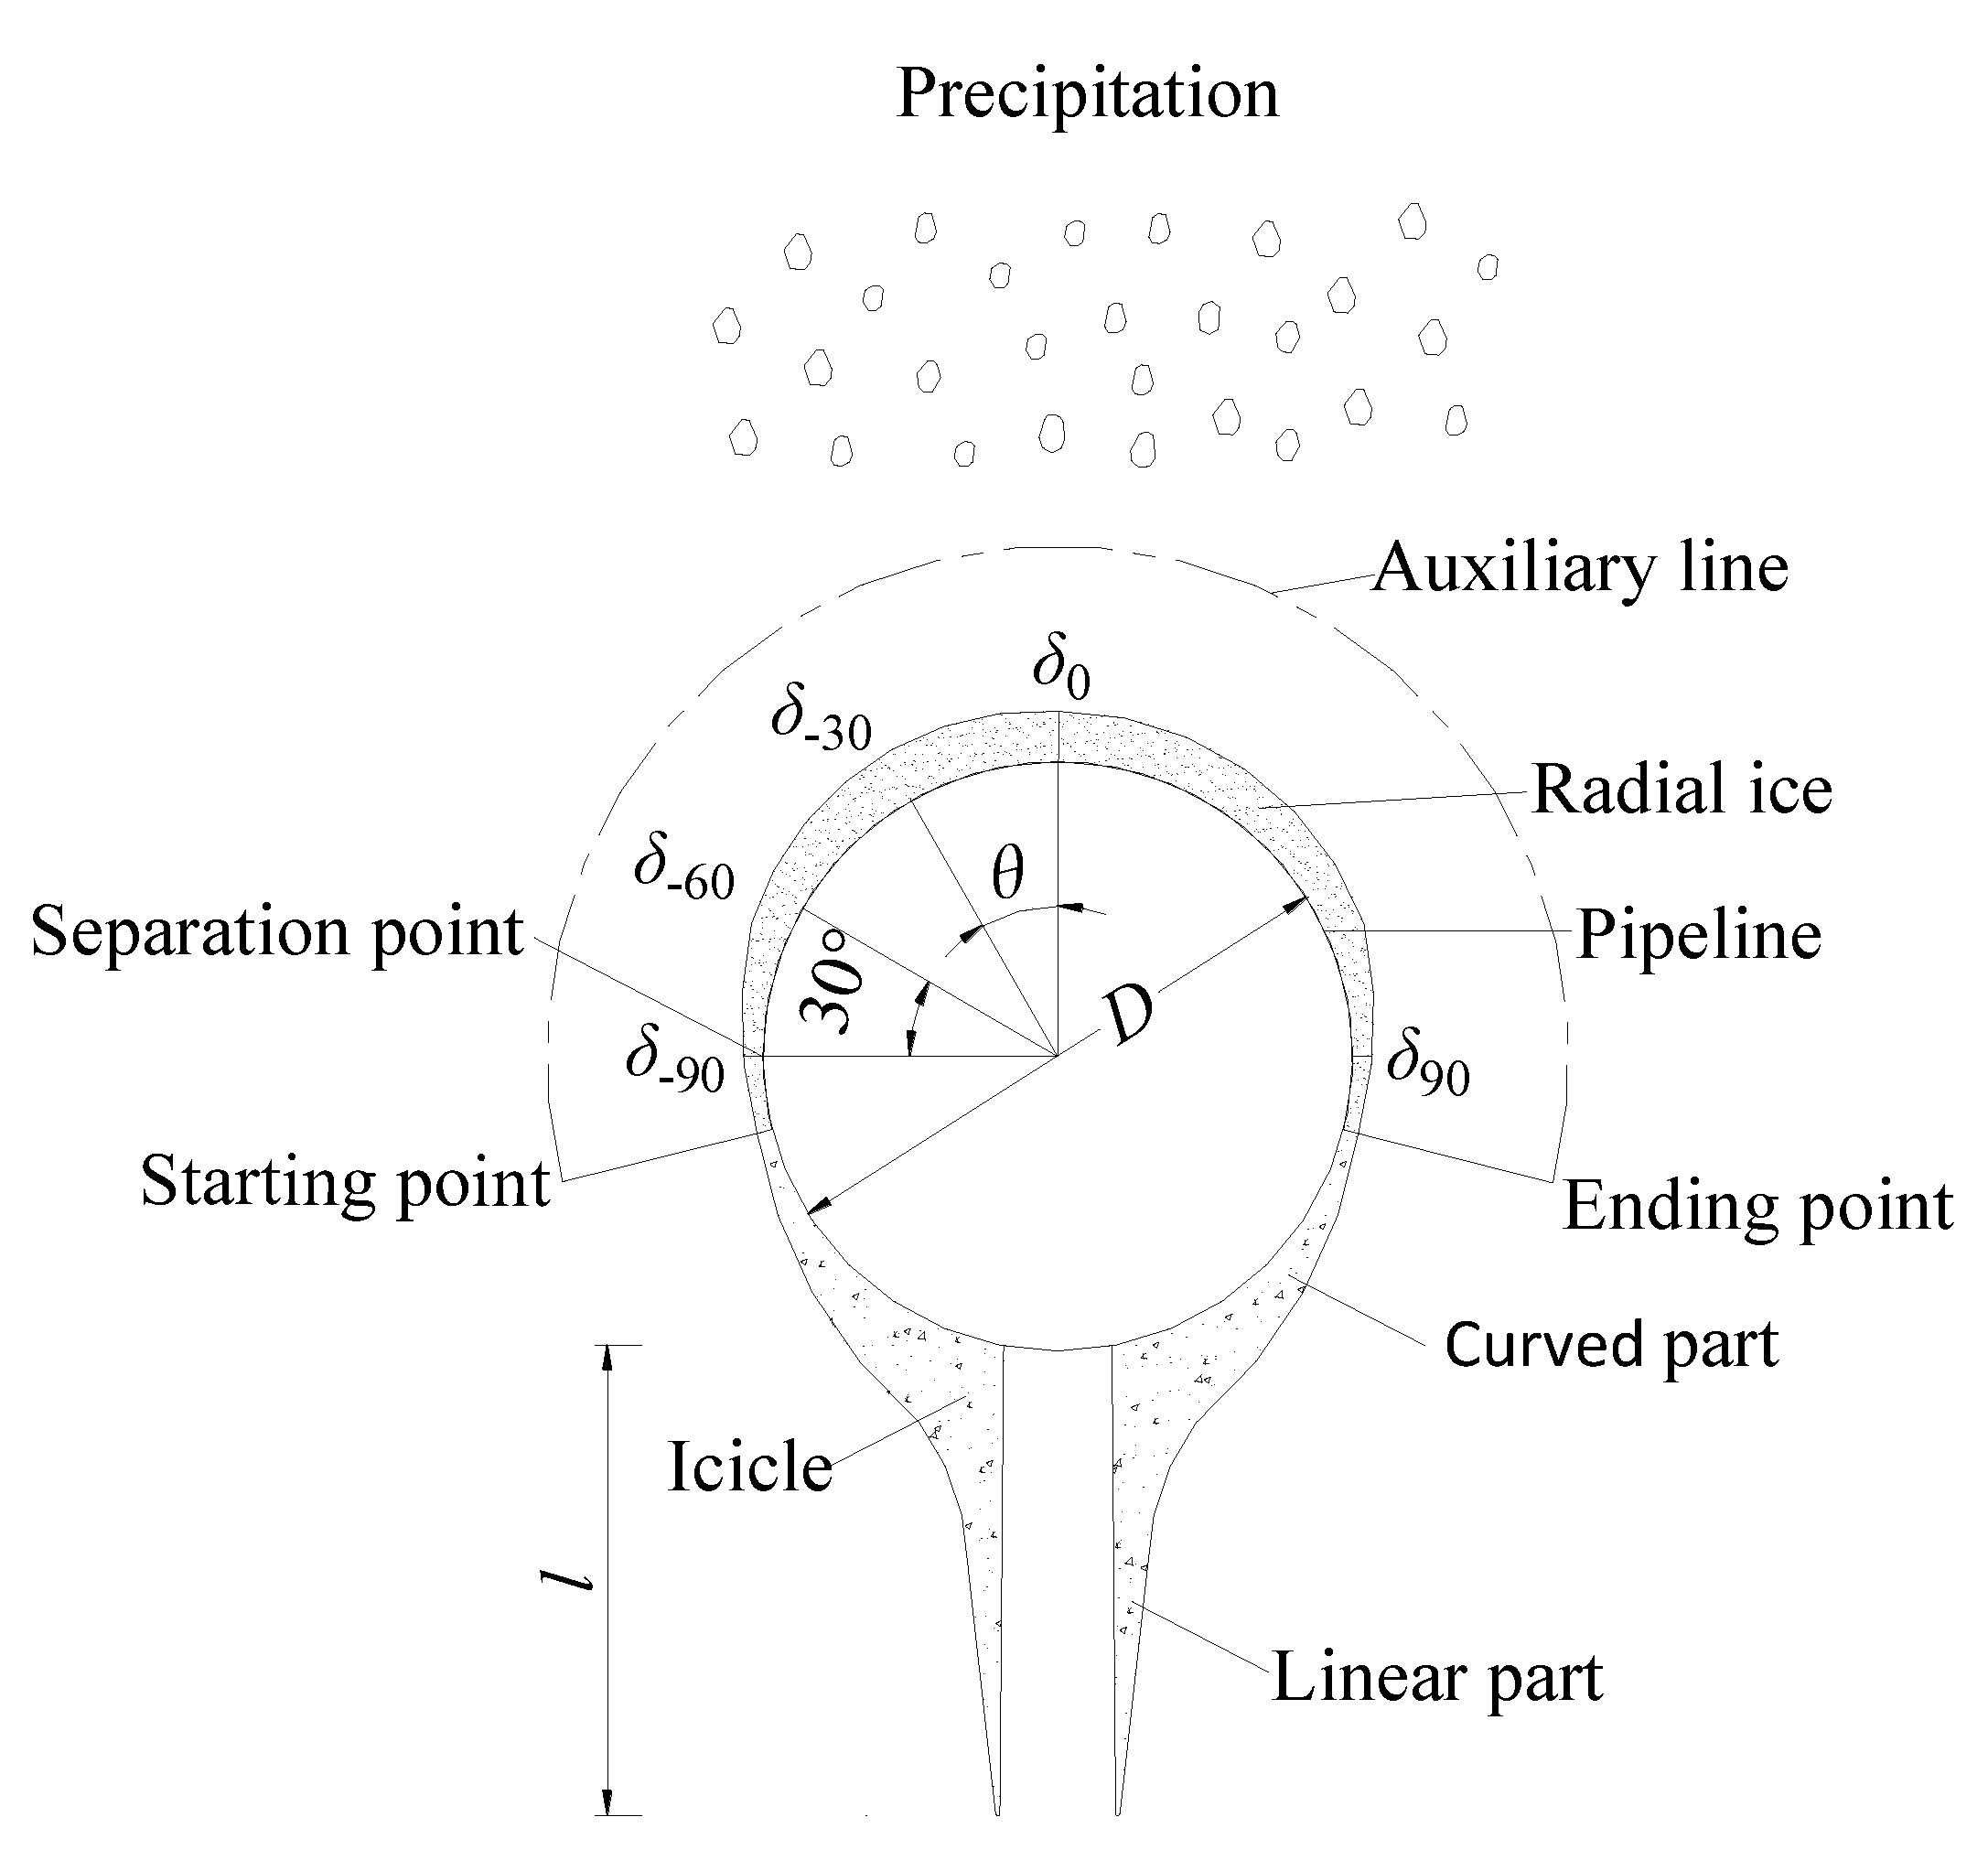
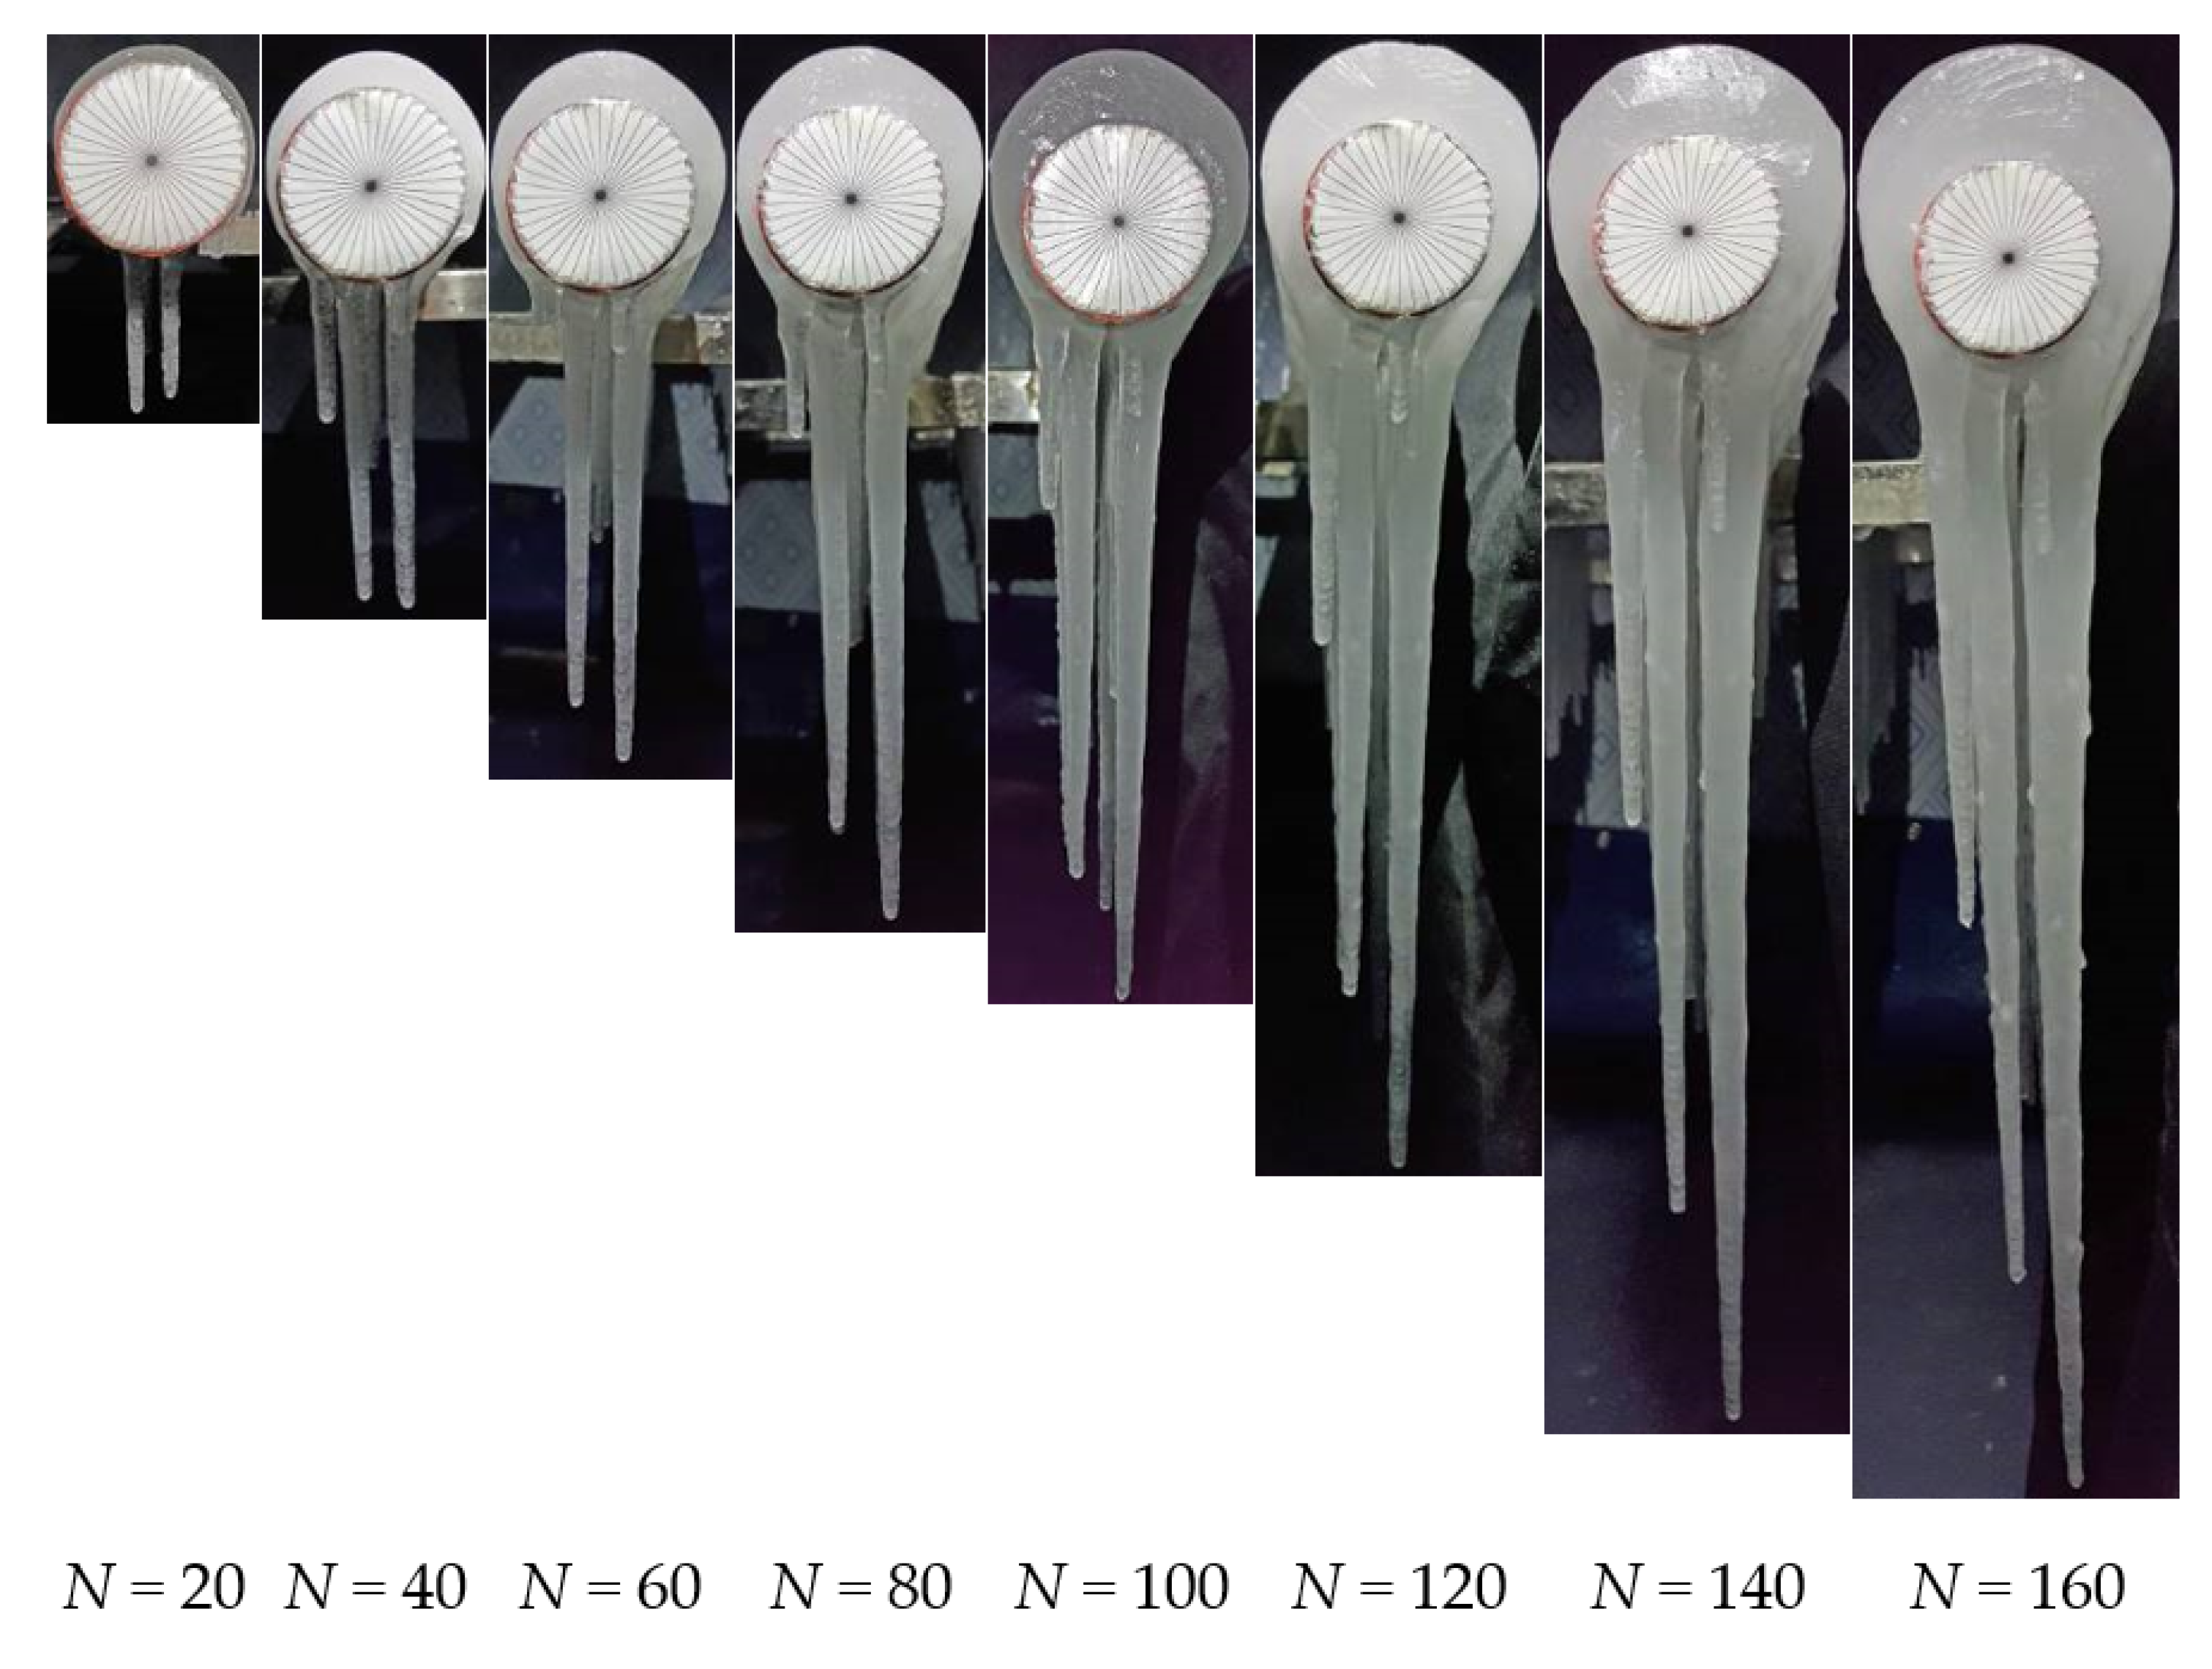
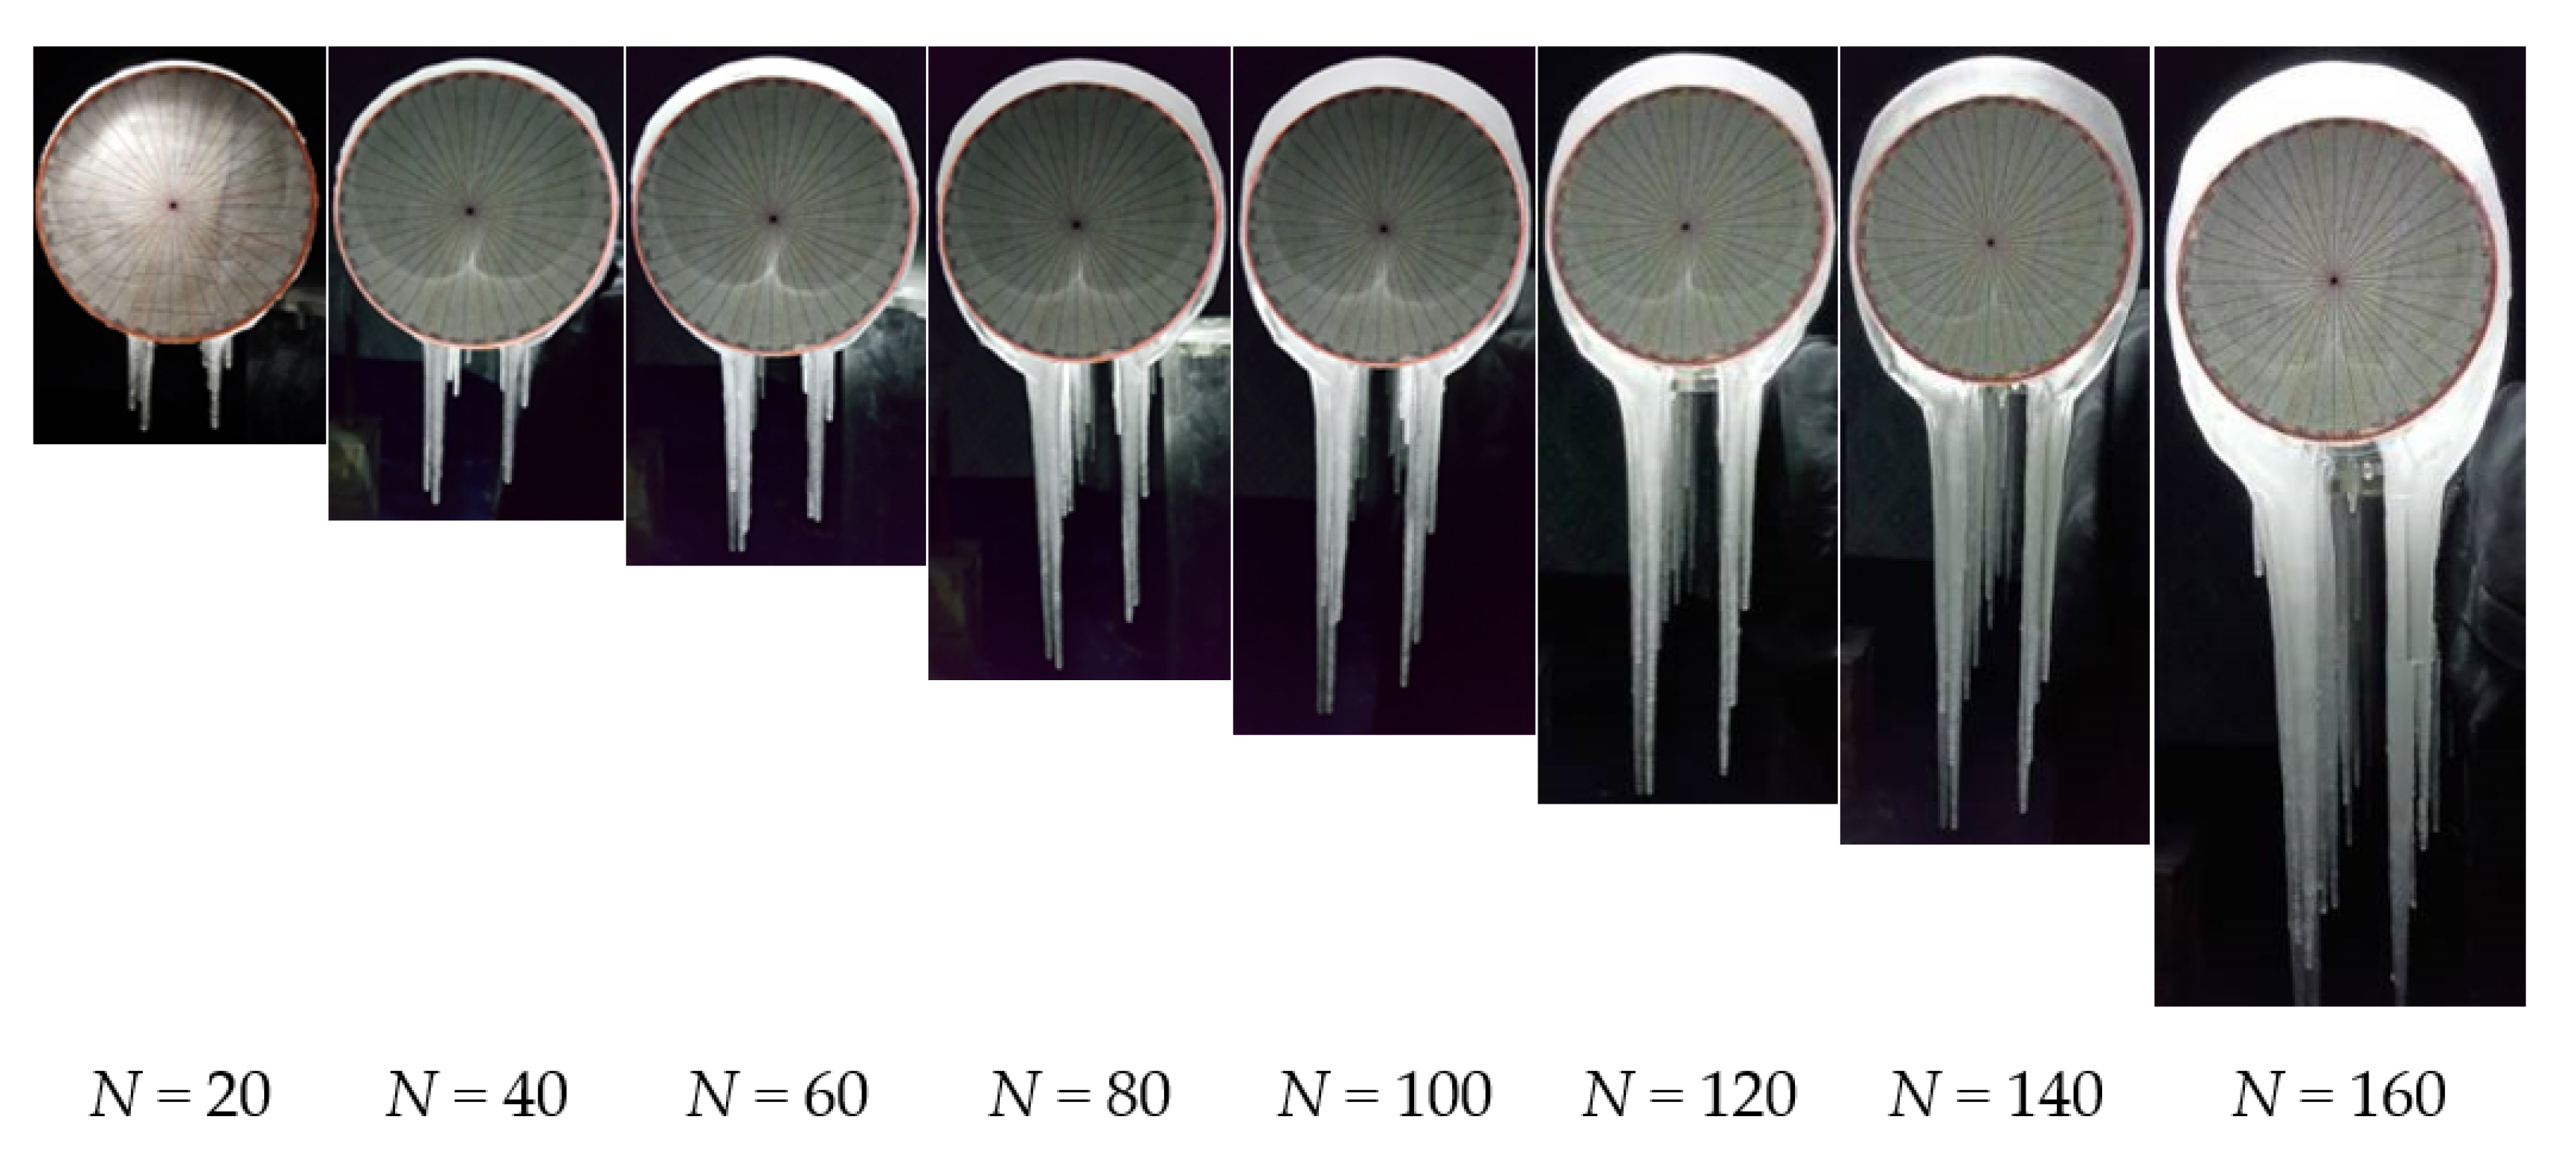
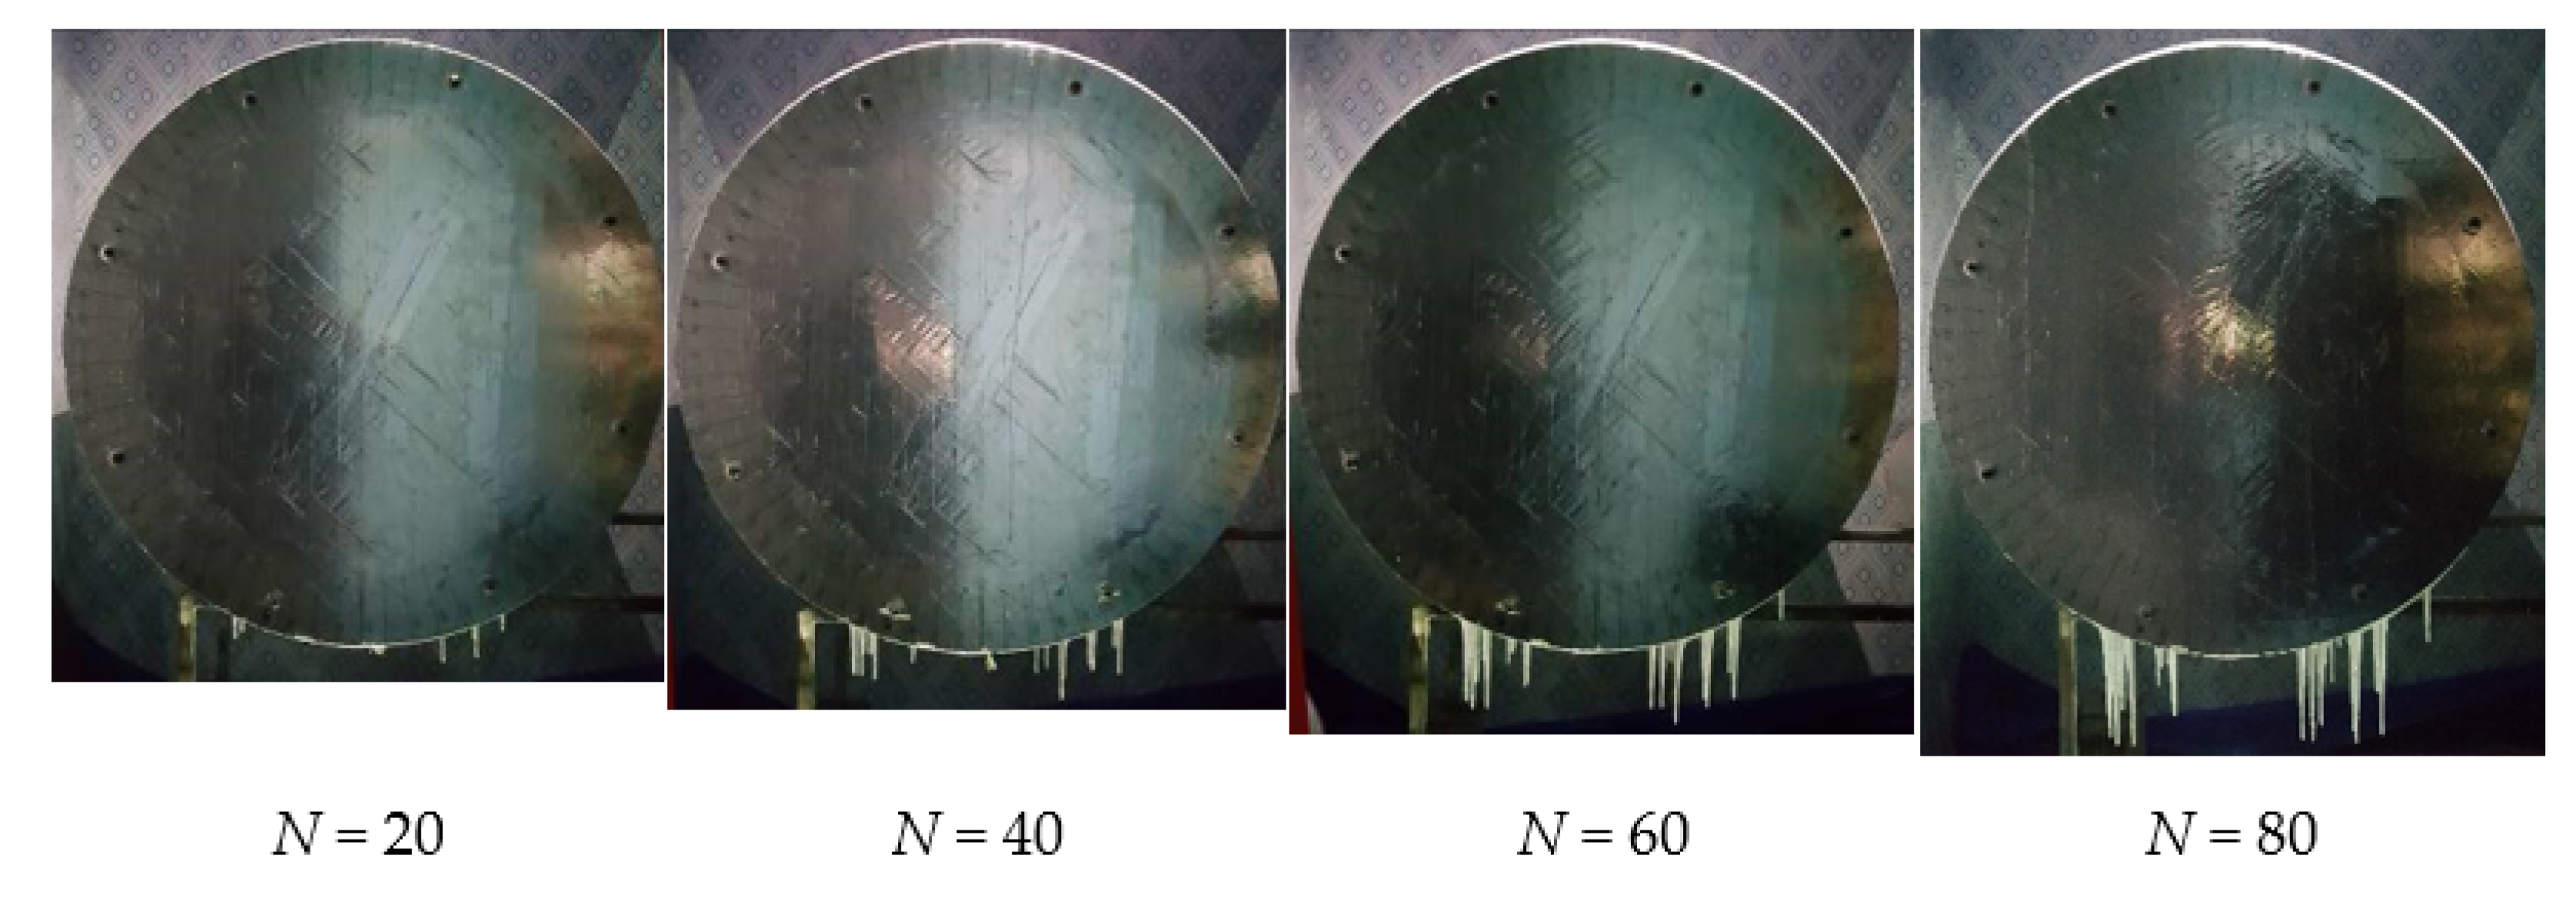
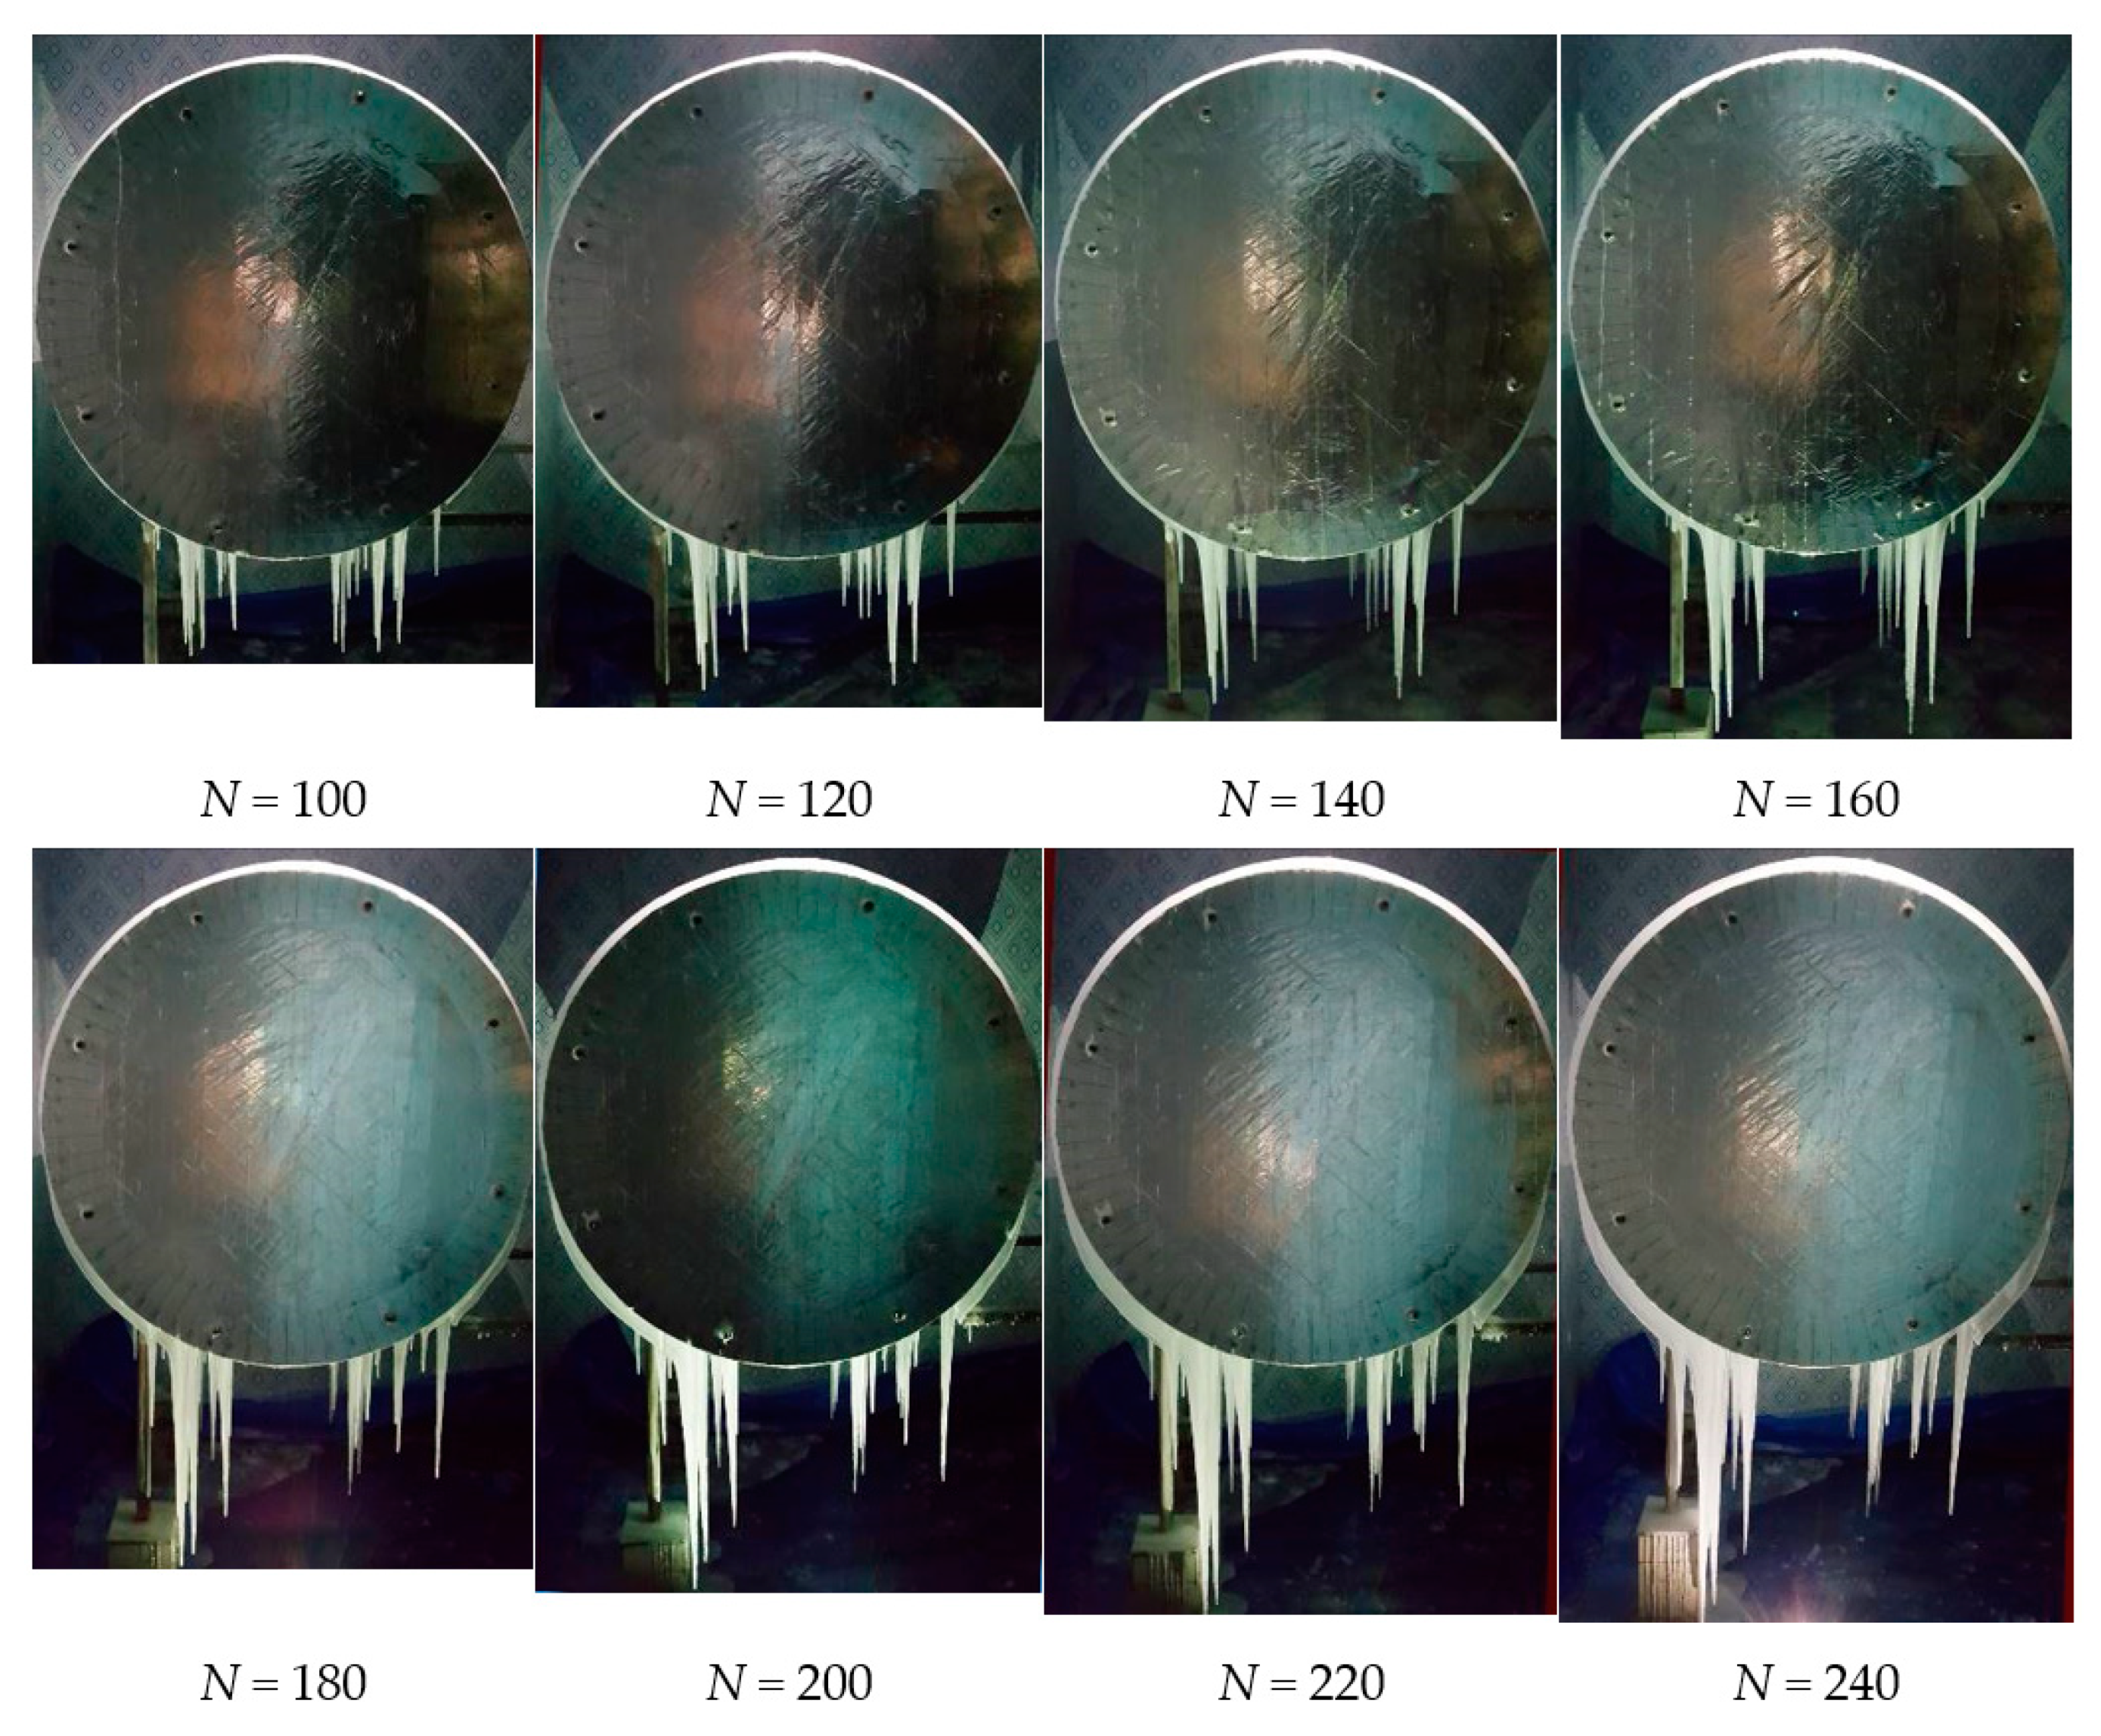
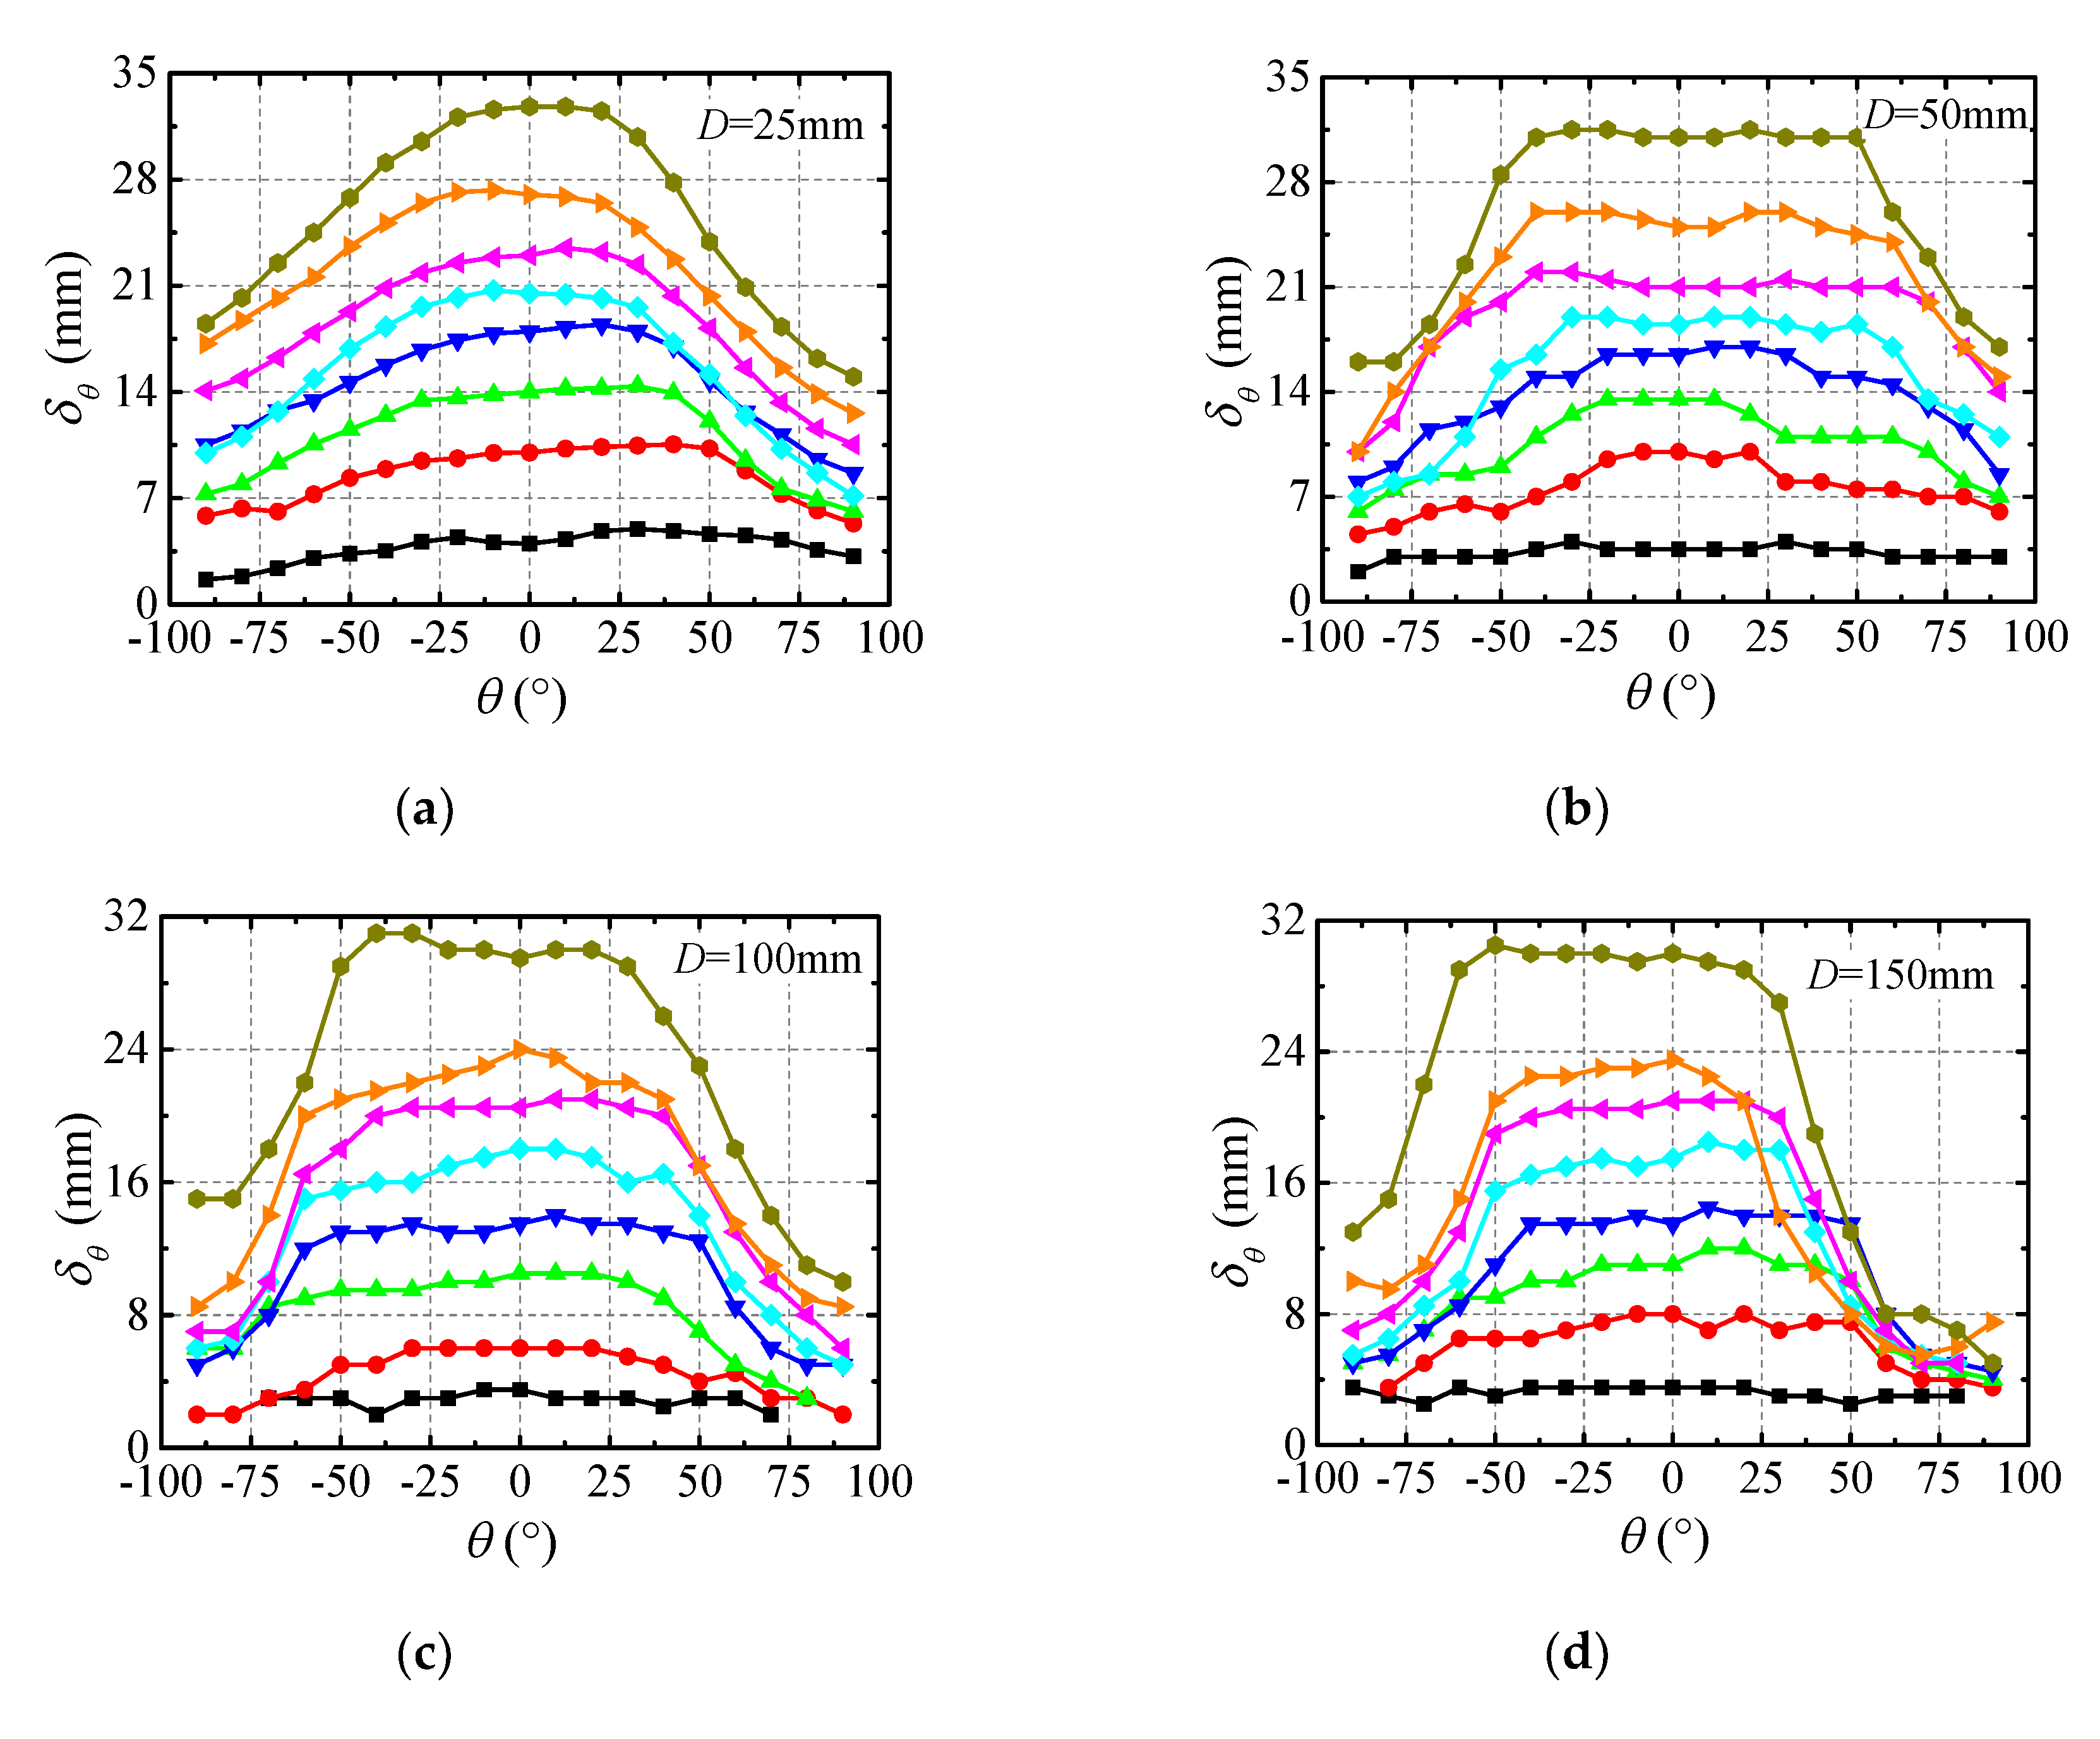
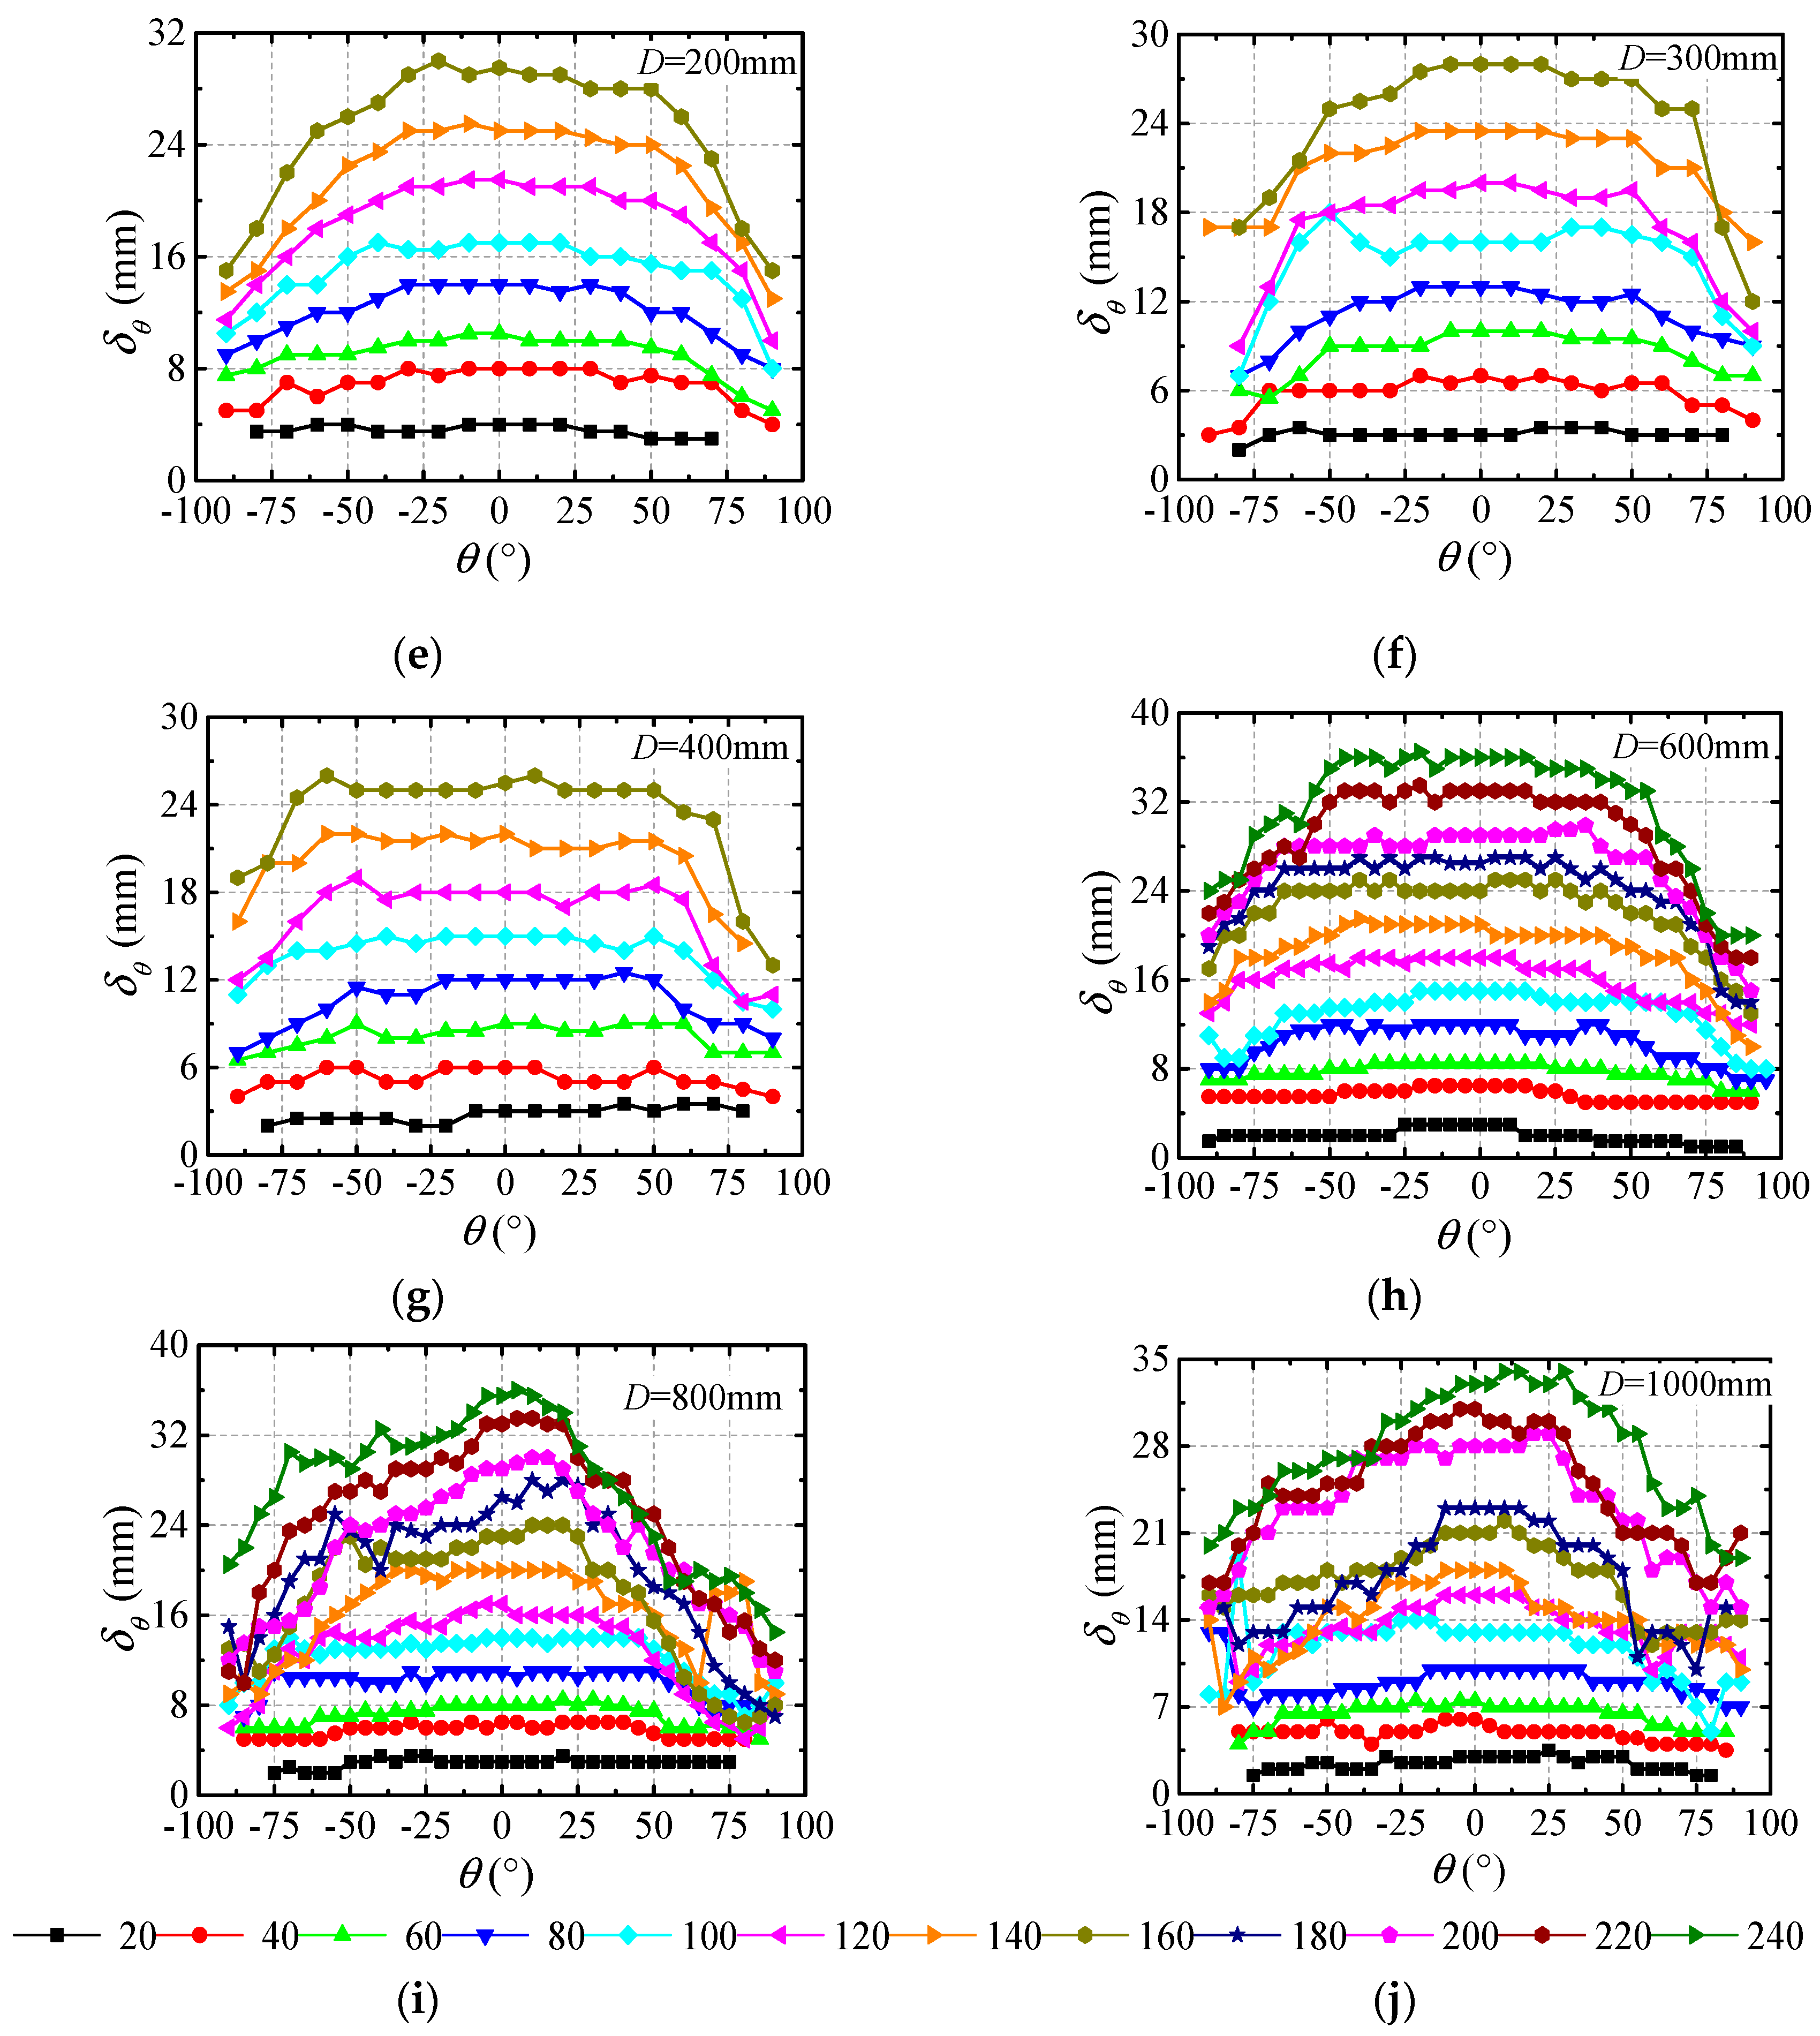
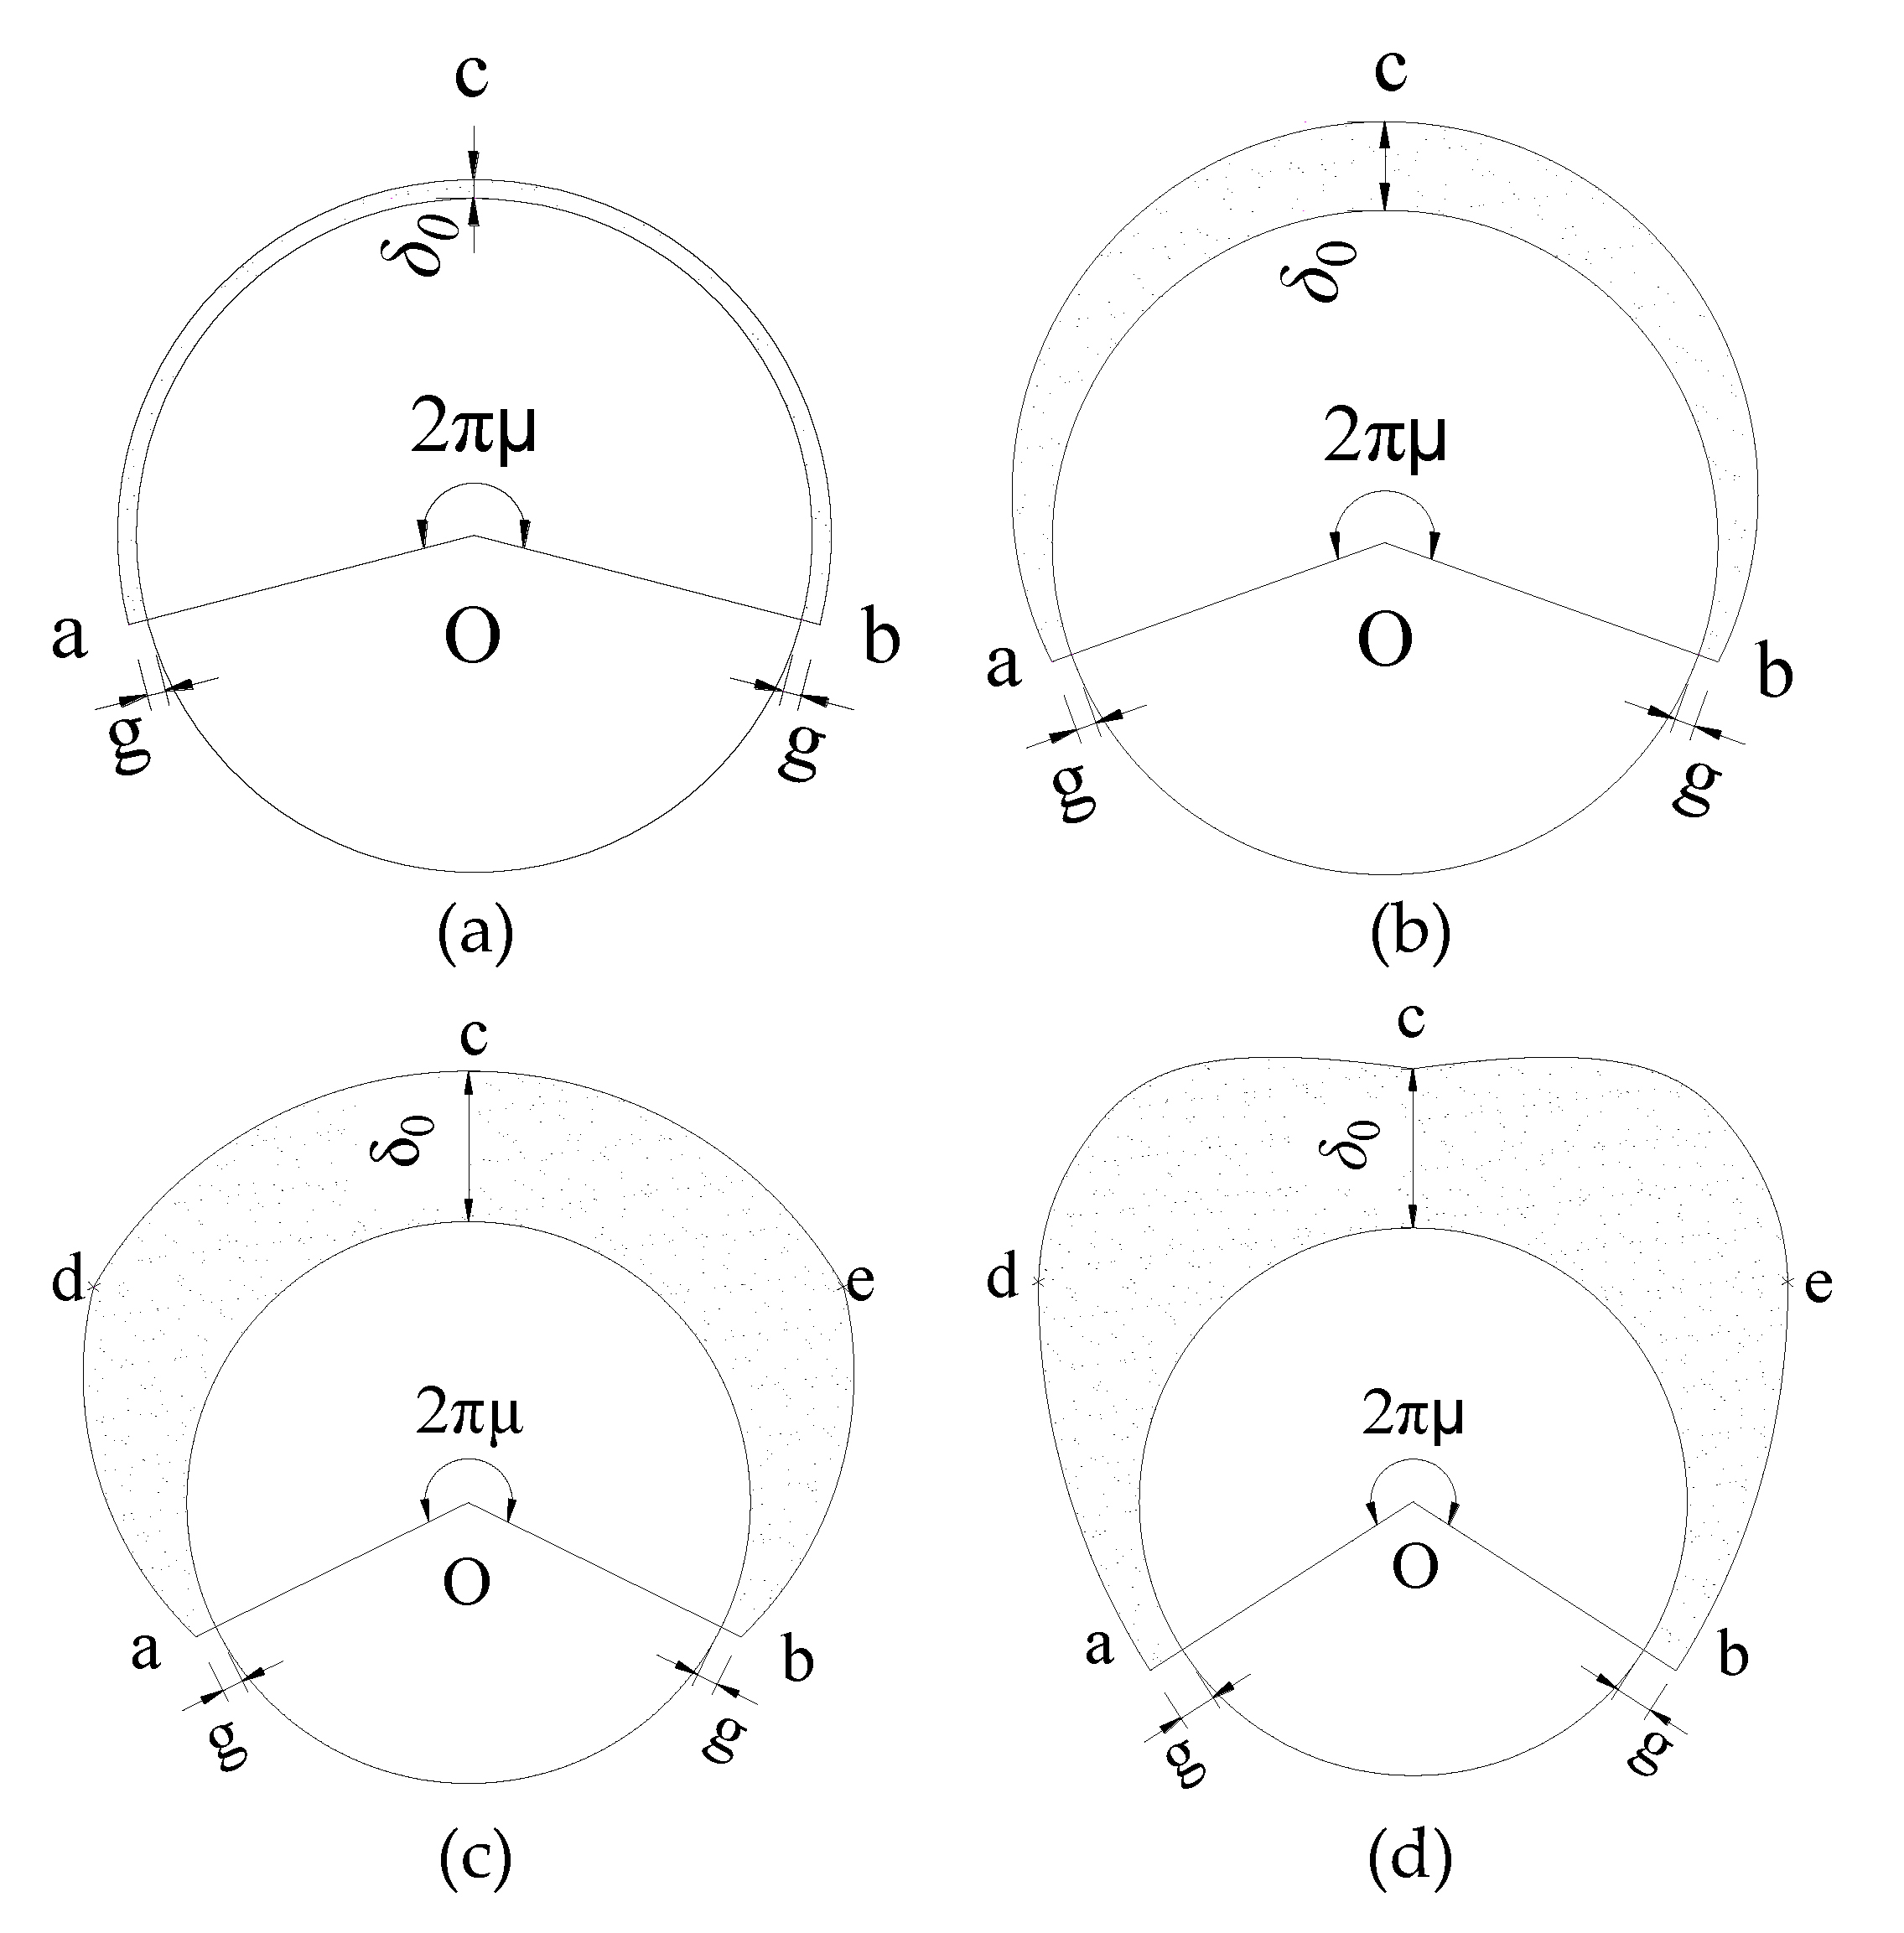
- The ice profile changed with increasing N. A thin layer of annular-shaped ice formed at the early stage, the ice profile then changed from a crescent shape to a sector shape and finally to a D shape with increasing N, which can be simplified as the models shown in Figure 14. The annular-shaped ice had almost the same ice thickness at different positions. The crescent-shaped ice could be simplified as an arc, which could be characterized by several parameters: g (the thicknesses at the end point of the radial ice), δ0, and μ. The sector-shaped ice can be divided into three curved segments: ad, be, and dce, and the ice thicknesses at points d, c, and e were the same. The D-shaped ice could also be divided into three curved segments: ad, be, and dce, which had a smaller thickness at point c than that at points d and e. The annular-shaped ice was similar to the ice shape in Koss et al. [14] for high airstream velocities U = 30 m/s and T = −1 °C. The crescent-shaped and sector-shaped ice profiles were similar to those presented by Fukusako et al. [26] (U = 6 and 10 m/s, T = −15 °C) and Koss et al. [14] (U = 10 m/s and 20 m/s, T = −1 to −15 °C). The D-shaped ice was similar to the reverse-triangular ice presented by Fukusako et al. [26] for U = 10 and 20 m/s, T = −15 °C.
- (2)
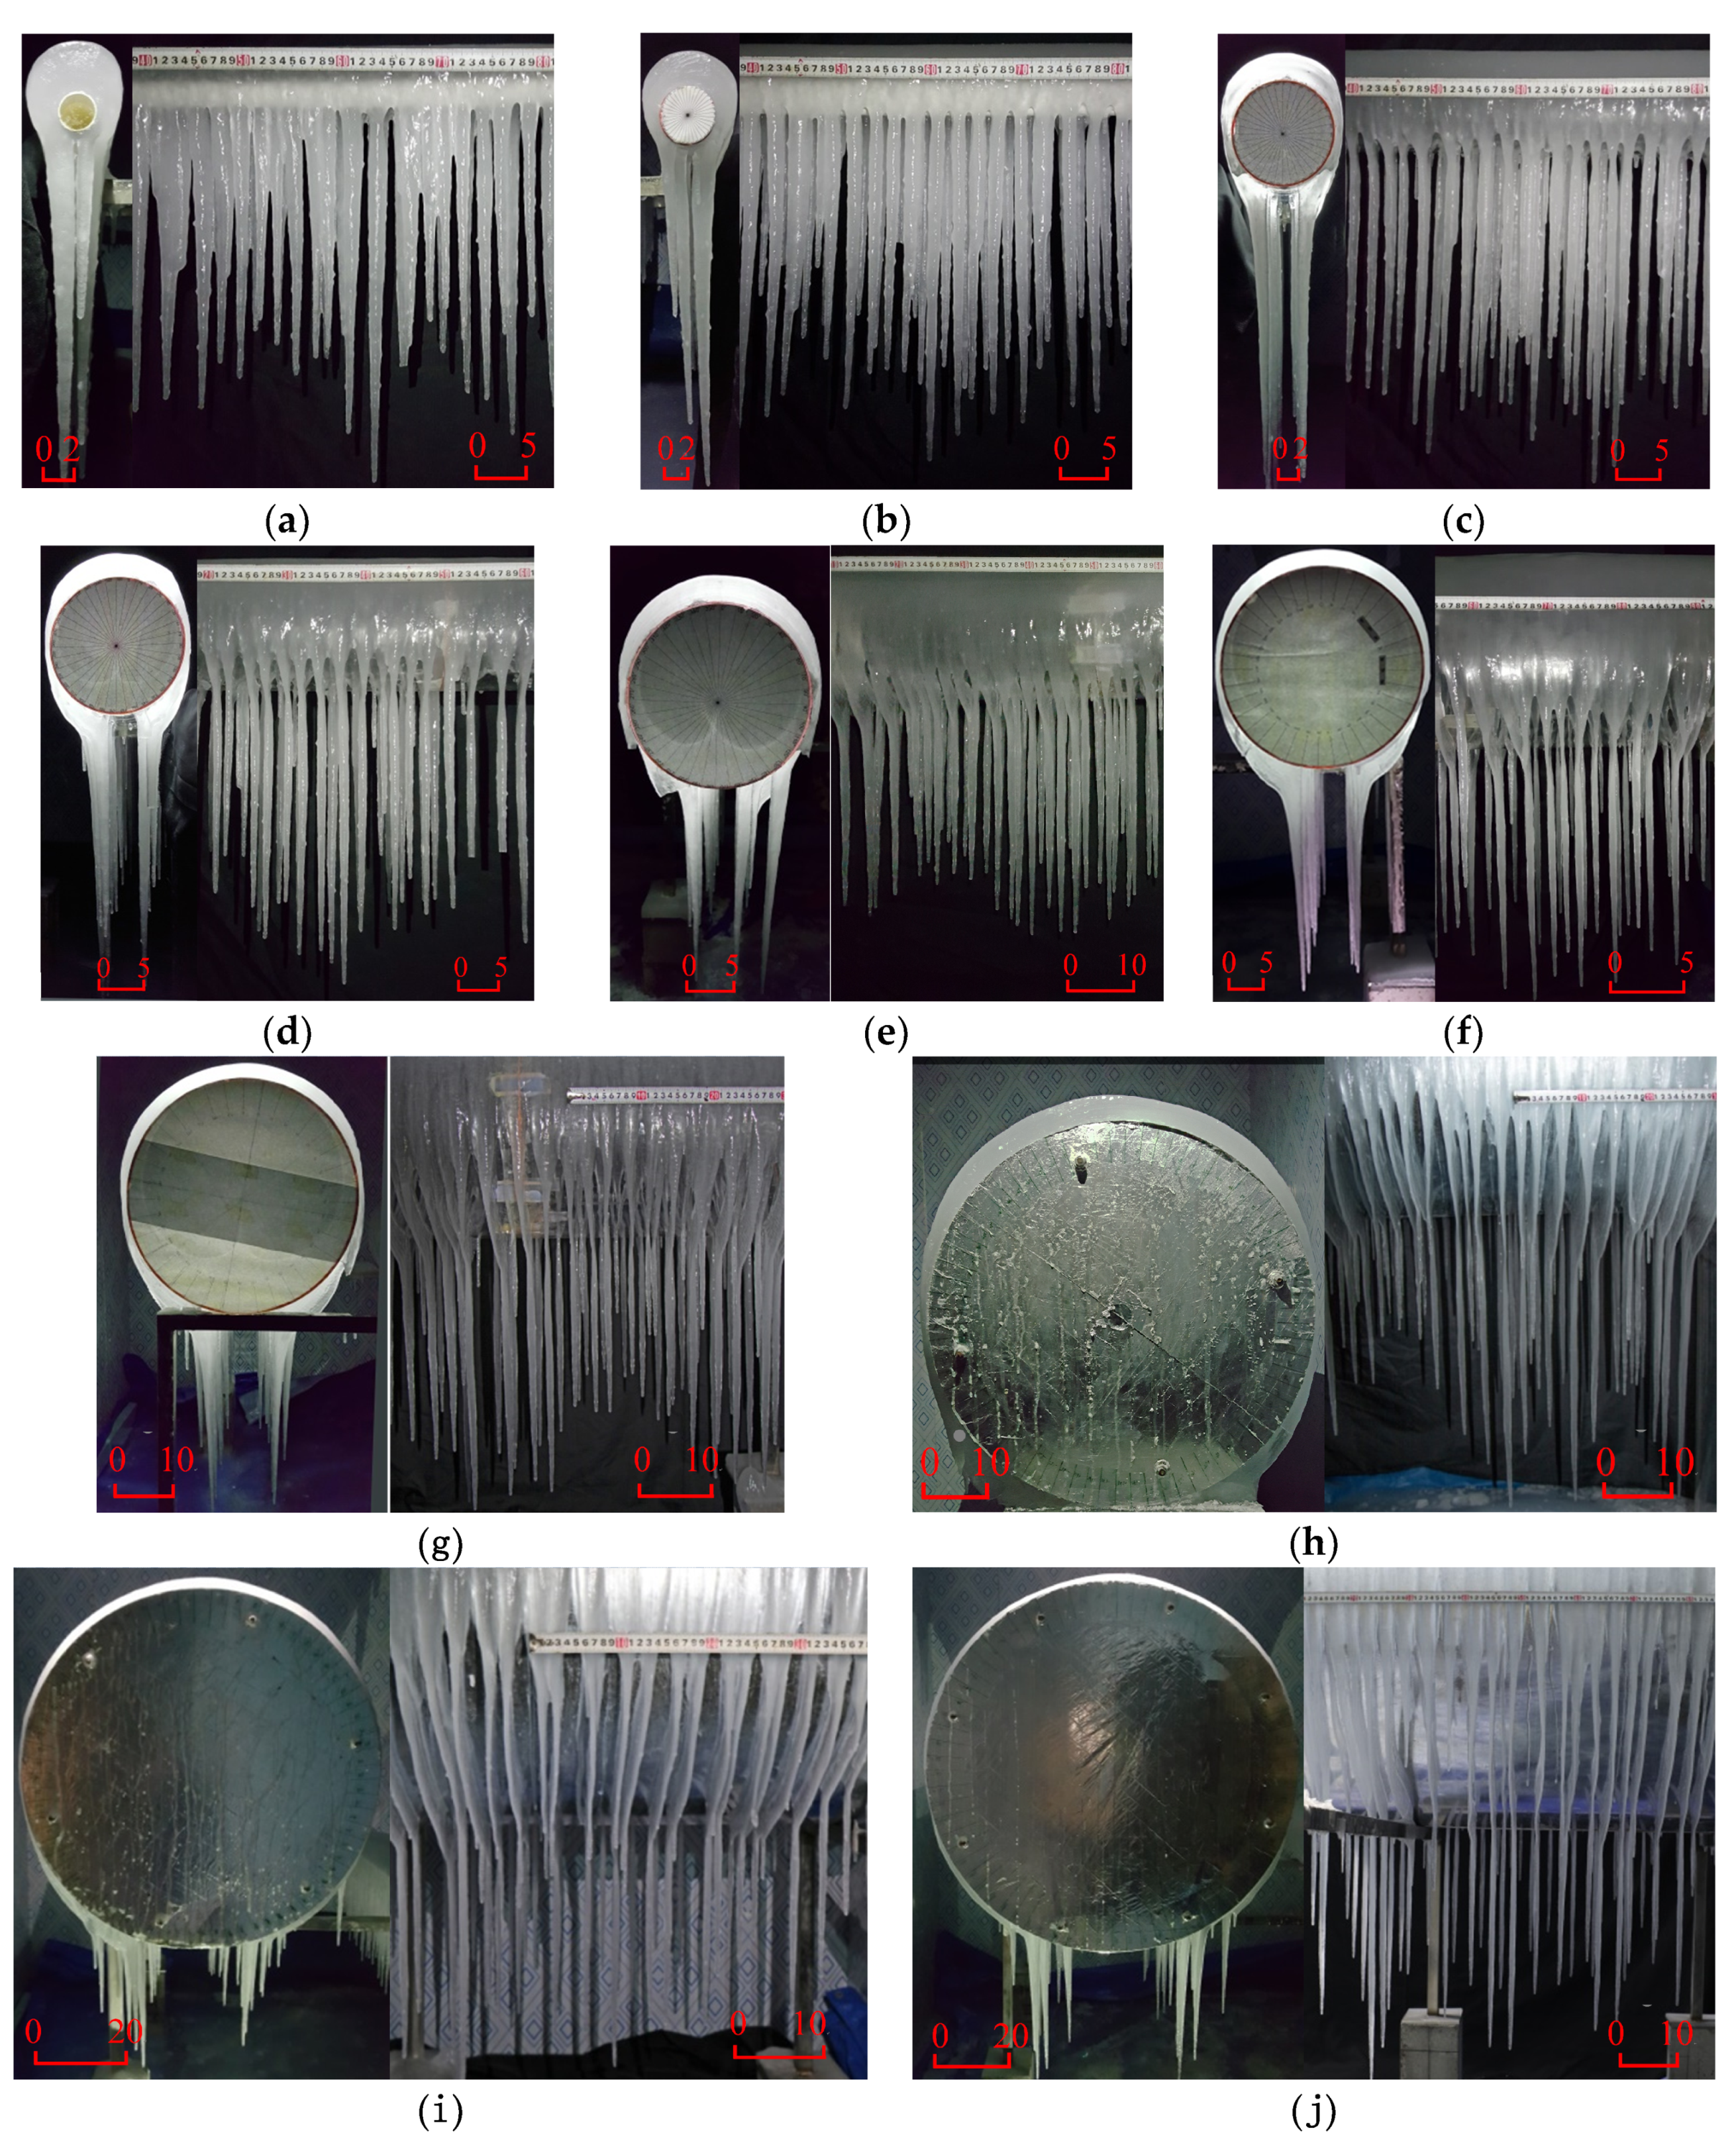
- It is speculated that the larger diameter pipelines required longer times to form a specific type of radial ice under the same conditions. For example, for a pipeline with D = 25 mm (Figure 8), the ice profile was crescent shape when N = 20–40, and it became into sector shape when N = 60–160. For a pipeline with D = 150 mm (Figure 10), the ice profile was an annular shape when N = 20, and it became a crescent shape when N = 40 and 60, it became a sector shape when N = 80–140 and finally became D shape when N = 160. For a pipeline with D = 1000 mm (Figure 11), the ice profile was annular shape when N = 20–100, and it became crescent shape when N = 120–240.
- (3)
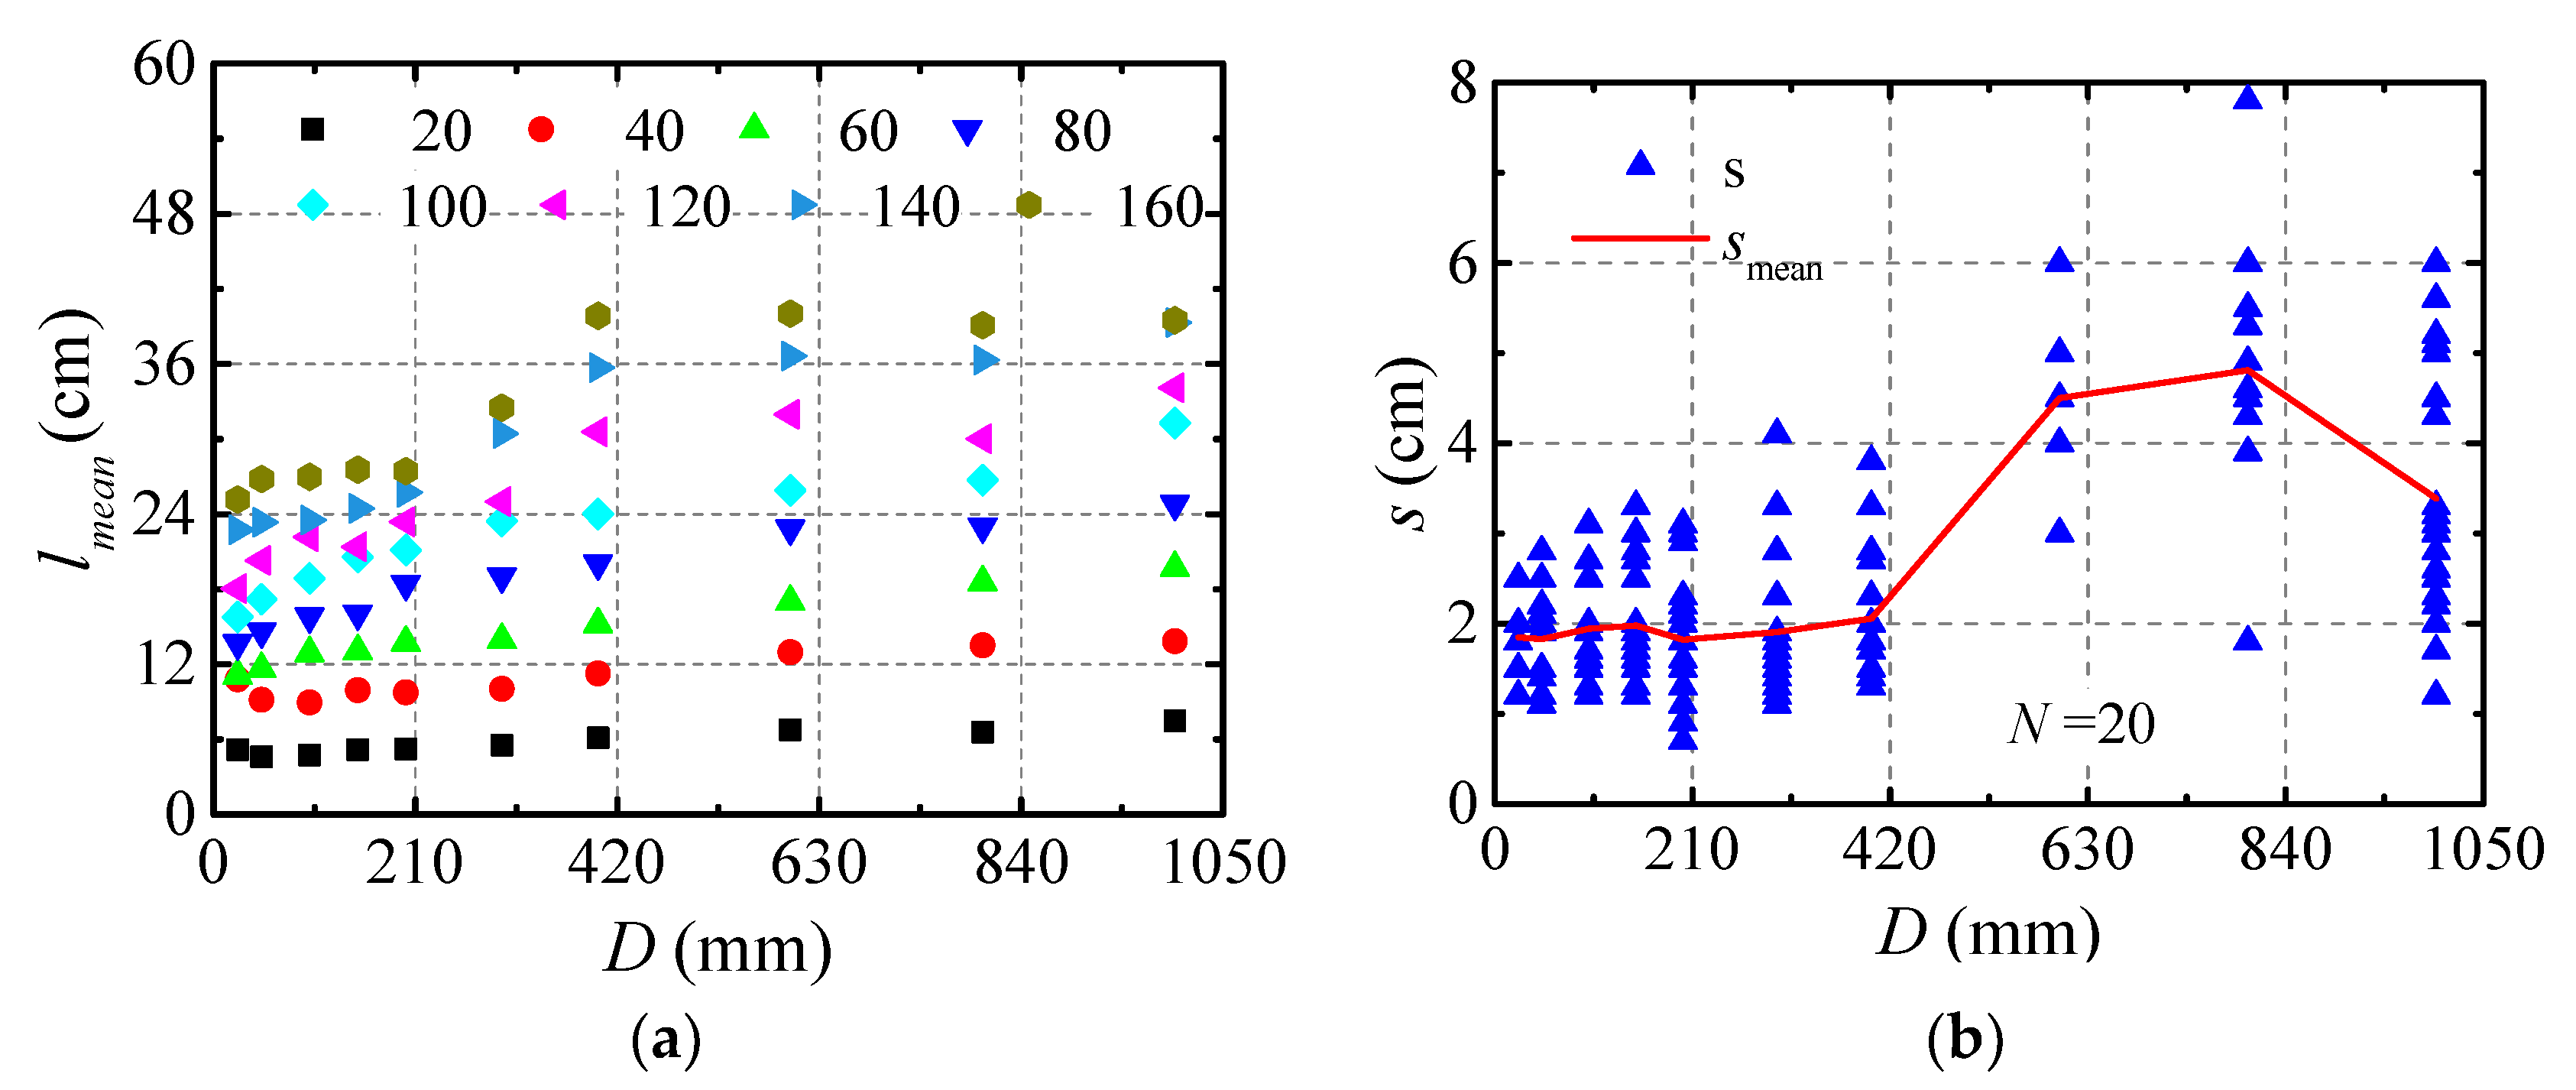
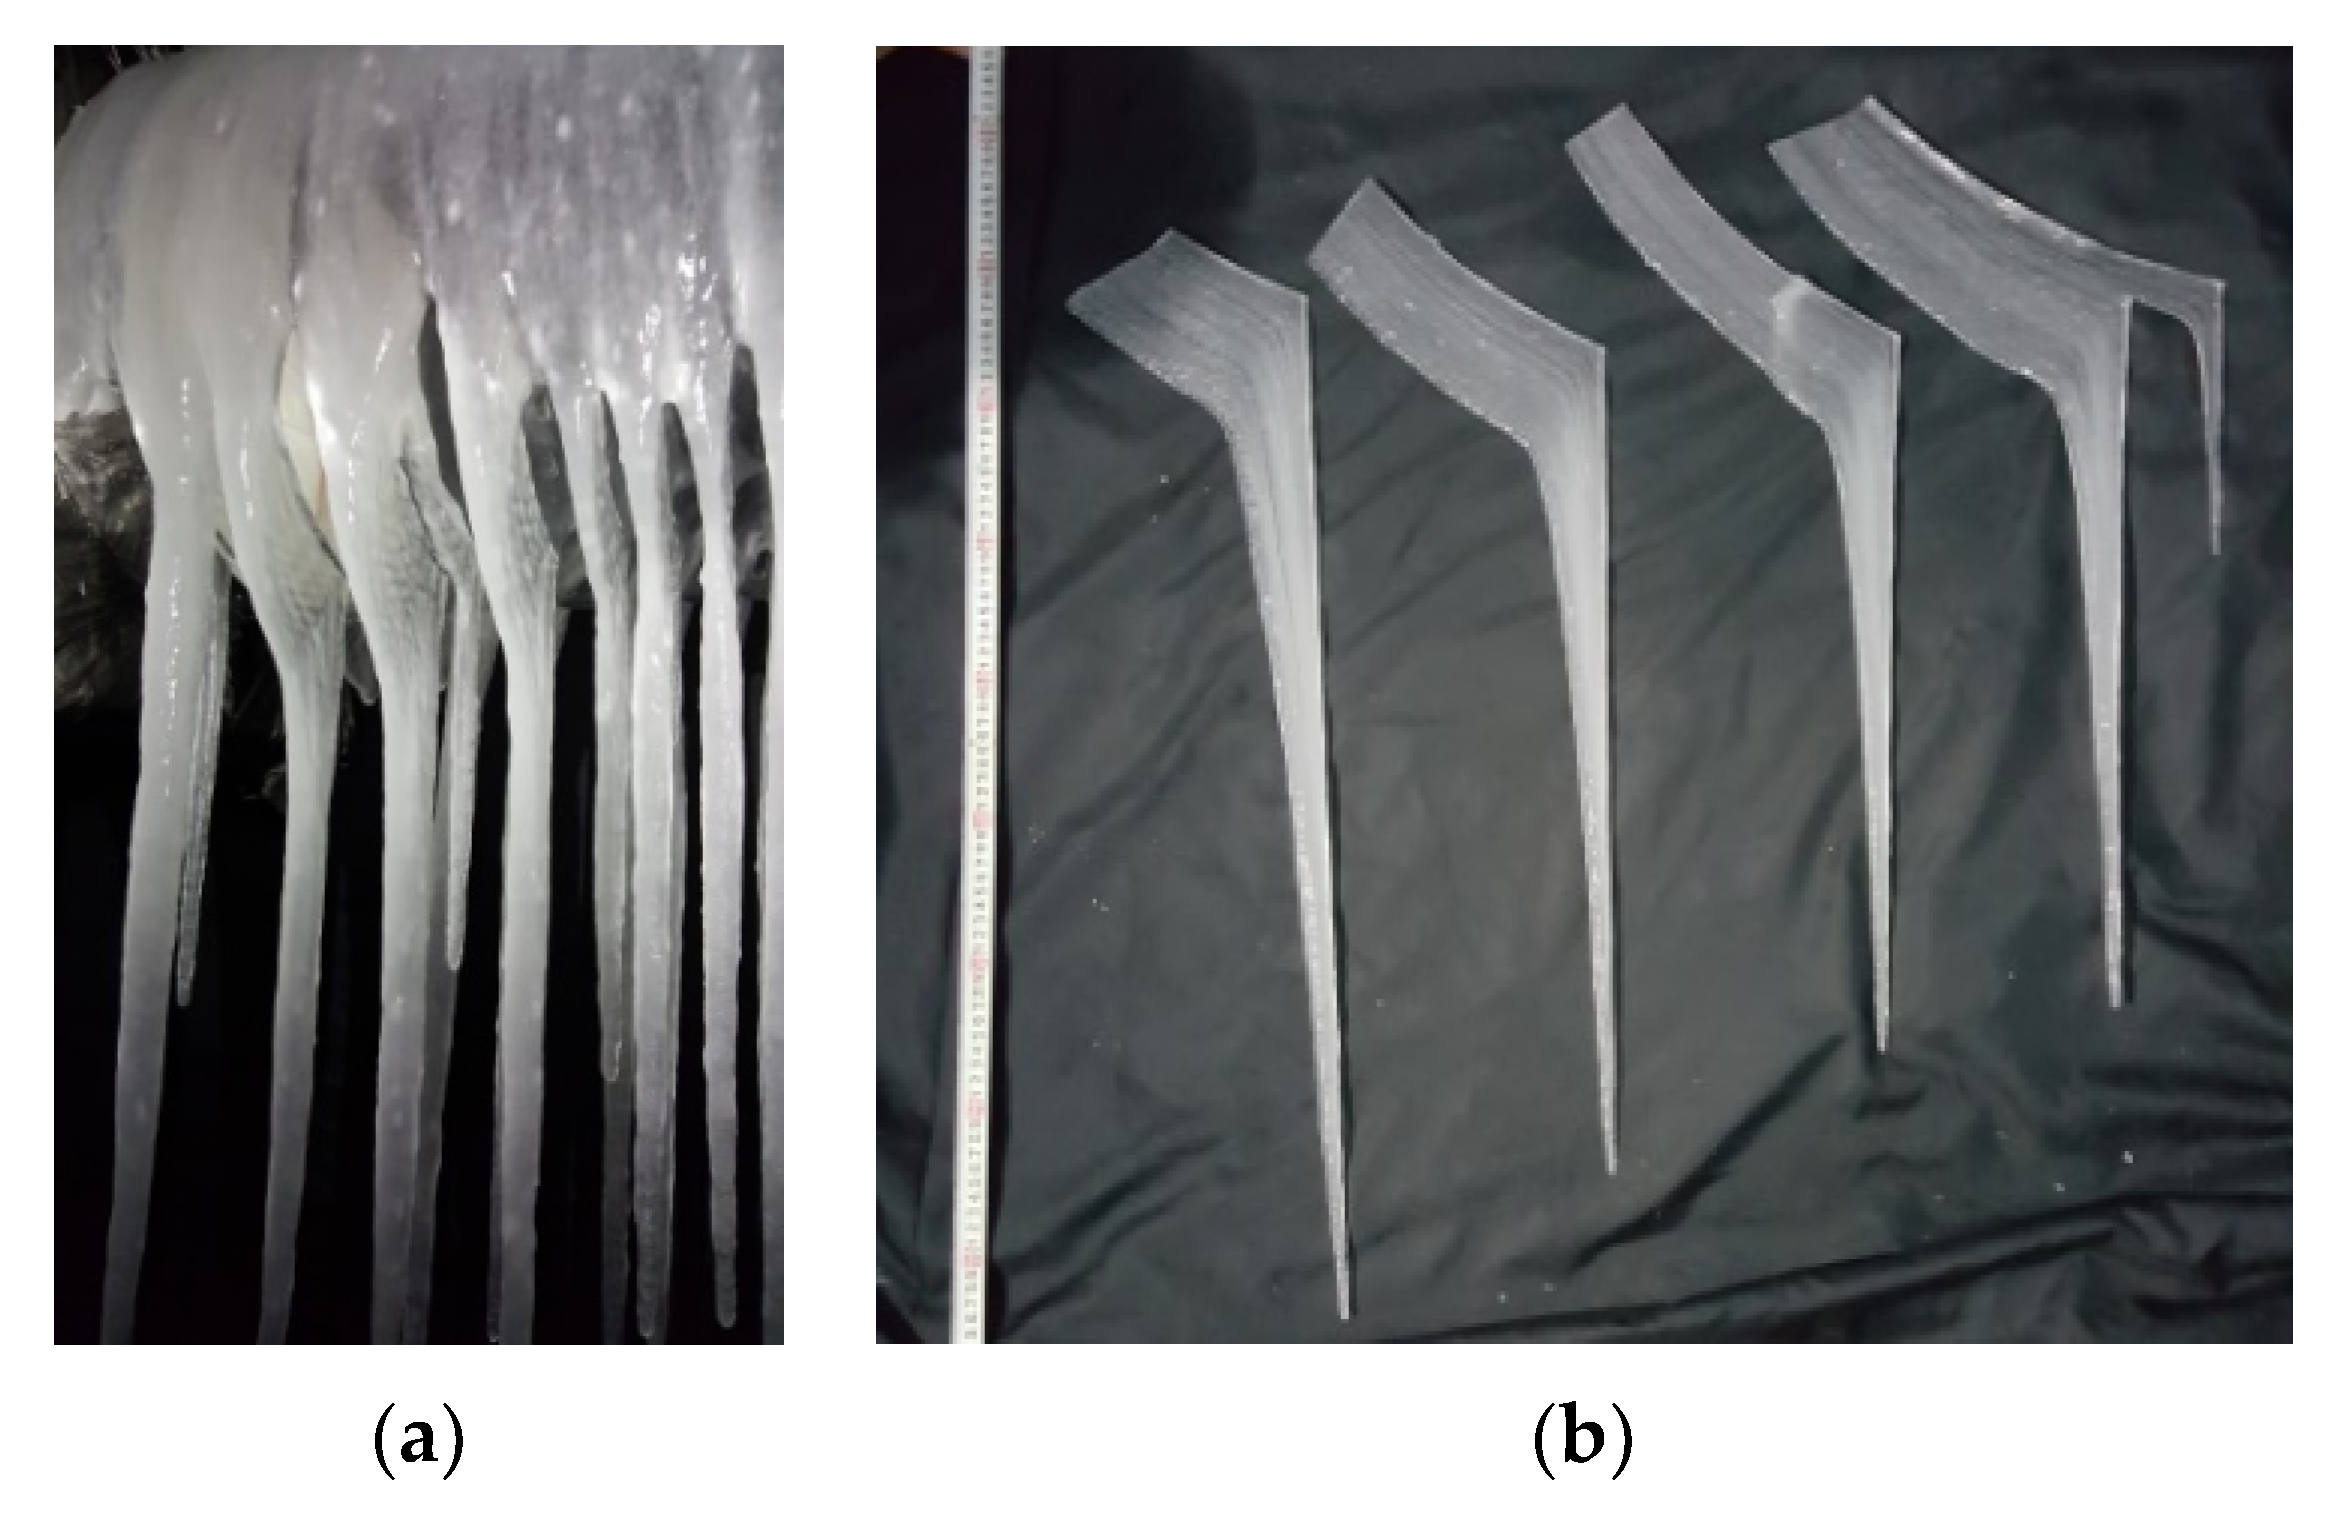
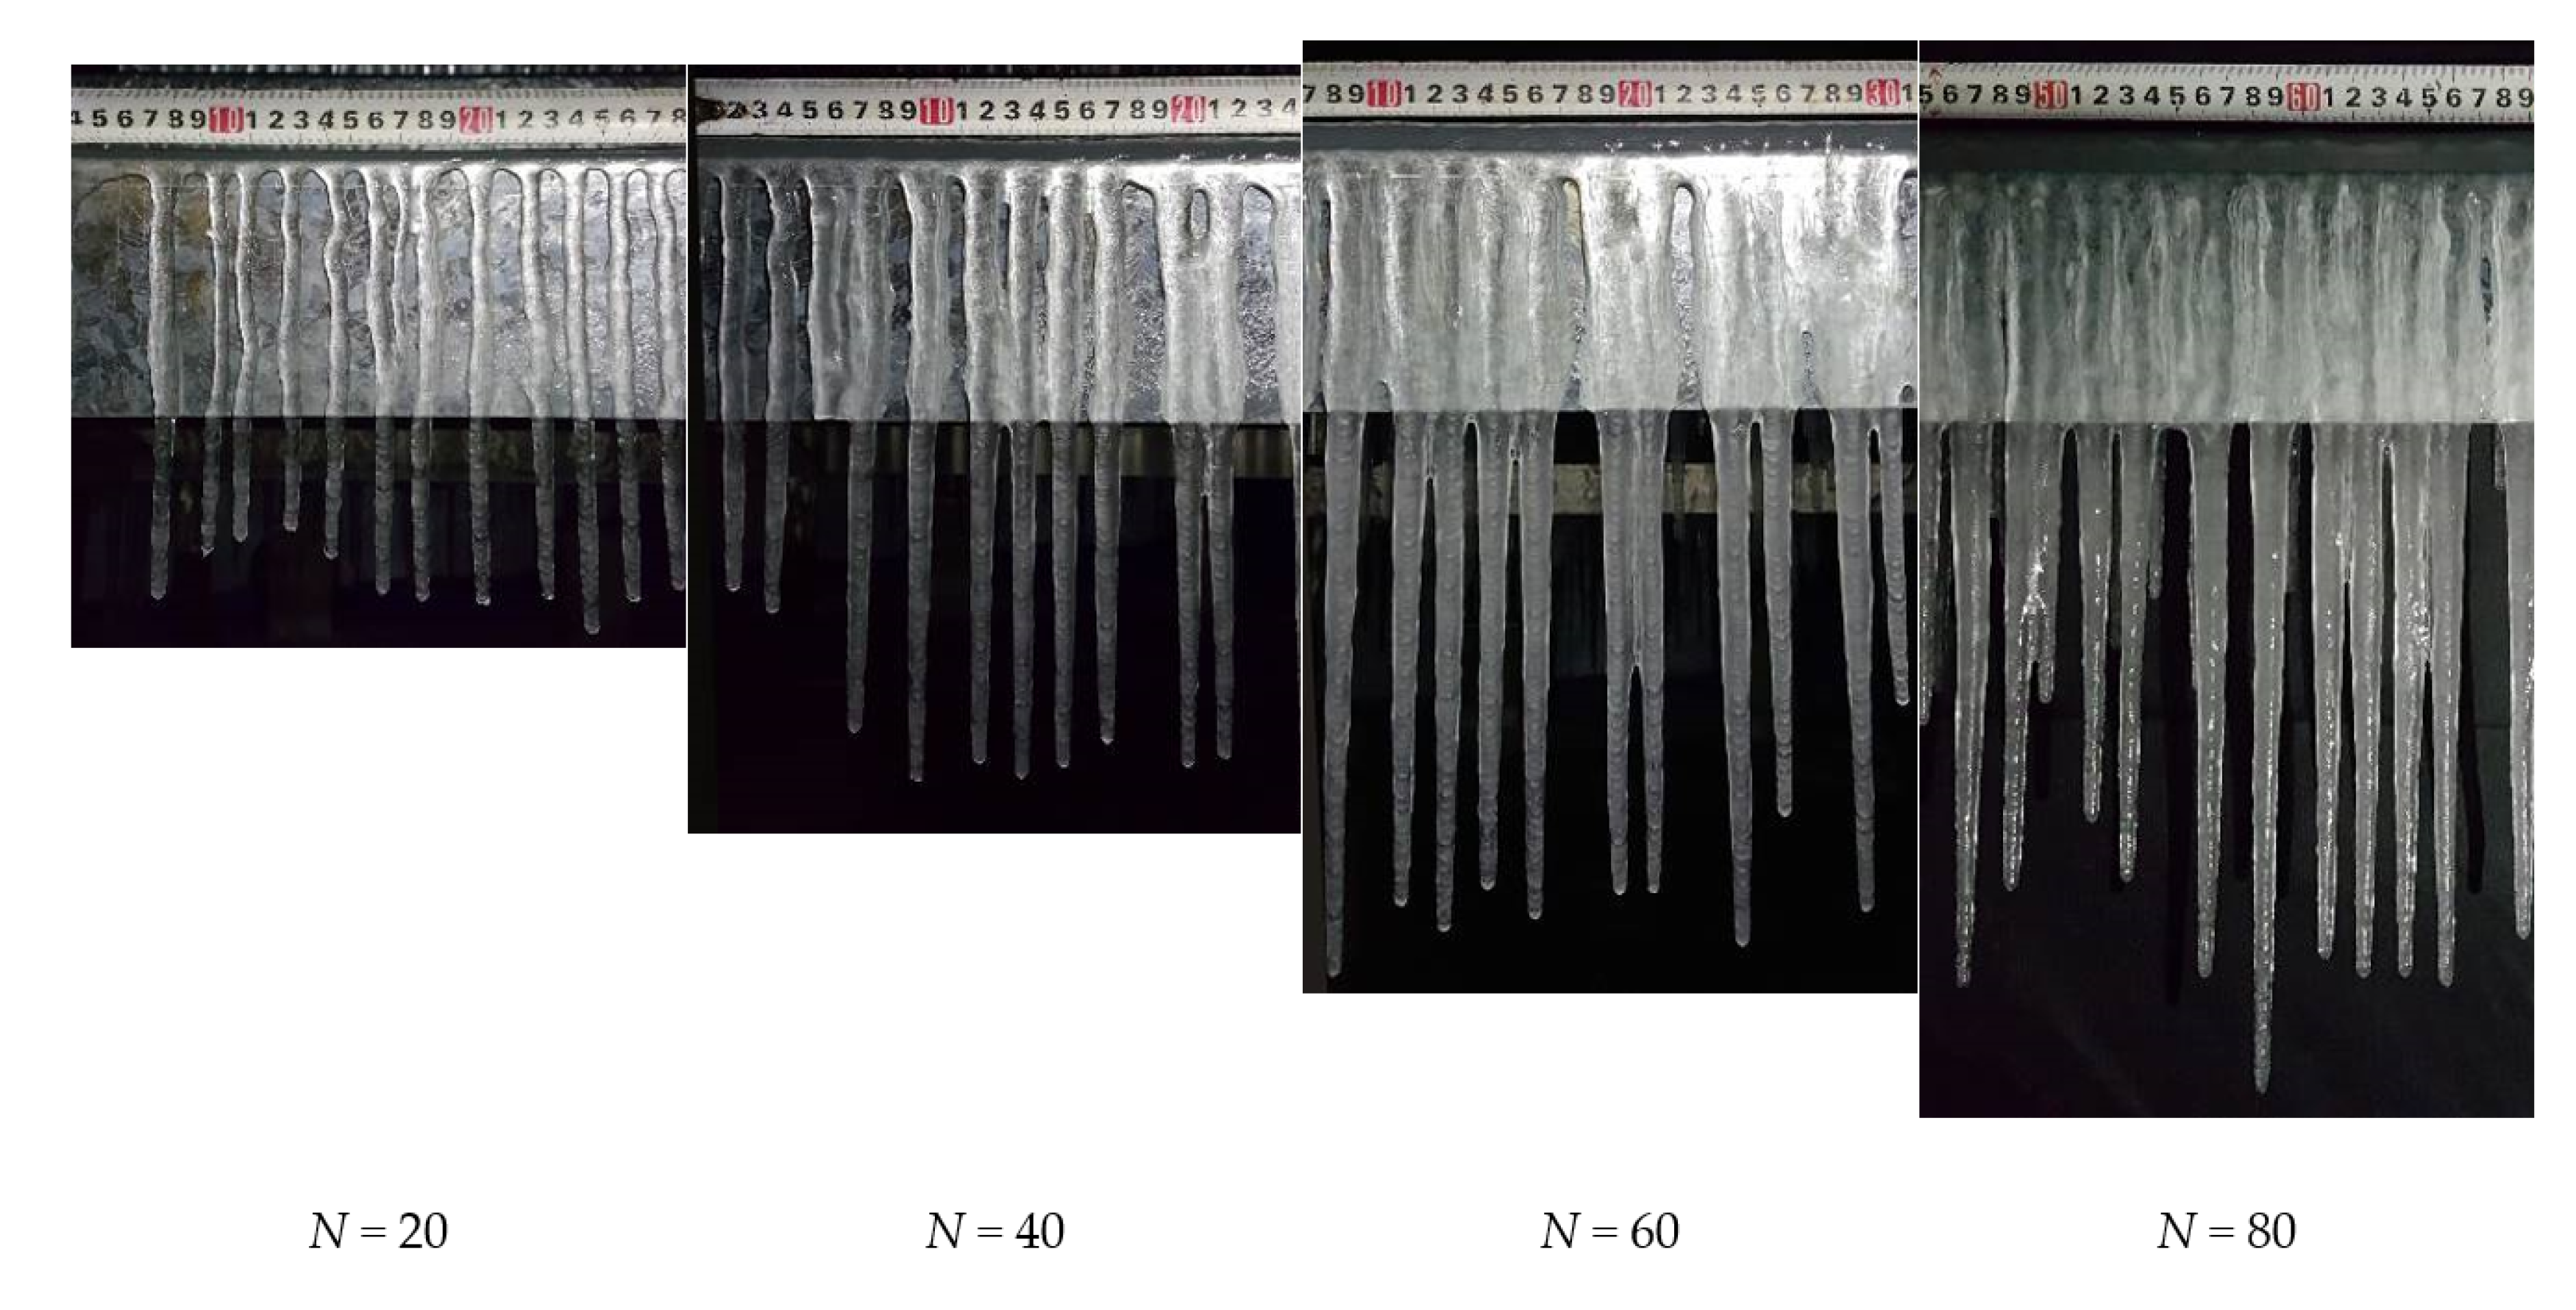
- δ, μ, and l increased with increasing N (Figure 12 and Figure 13). The shape of the icicle changed with increasing N. For D = 150 mm (Figure 10), the top and bottom diameters of the linear part of the icicle were almost the same at N = 20, which could be simplified as a circular cylinder, it was similar to icicle shape presented by Fukusako et al. [26] (U = 6 m/s, T = −15 °C, 5 min elapsed); the top diameter then increased faster than the bottom diameter, and the linear part could be simplified as a circular truncated cone at N = 60, which was were similar to icicle shape presented by Fukusako et al. [26] (U = 6 m/s, T = −15 °C, 20 min elapsed); the linear part could be simplified as an elliptical cone since the transverse size of the icicle grew faster than the longitudinal size at N = 160. The curved part could be simplified as a sickle (Figure 15), whose longitudinal thickness was about 5 mm, and the transversal width increased with increasing N.
3.2. Ice Accretion on Wind Hanger
3.3. Ice Accretion on Section Steel
- (1)
- (2)
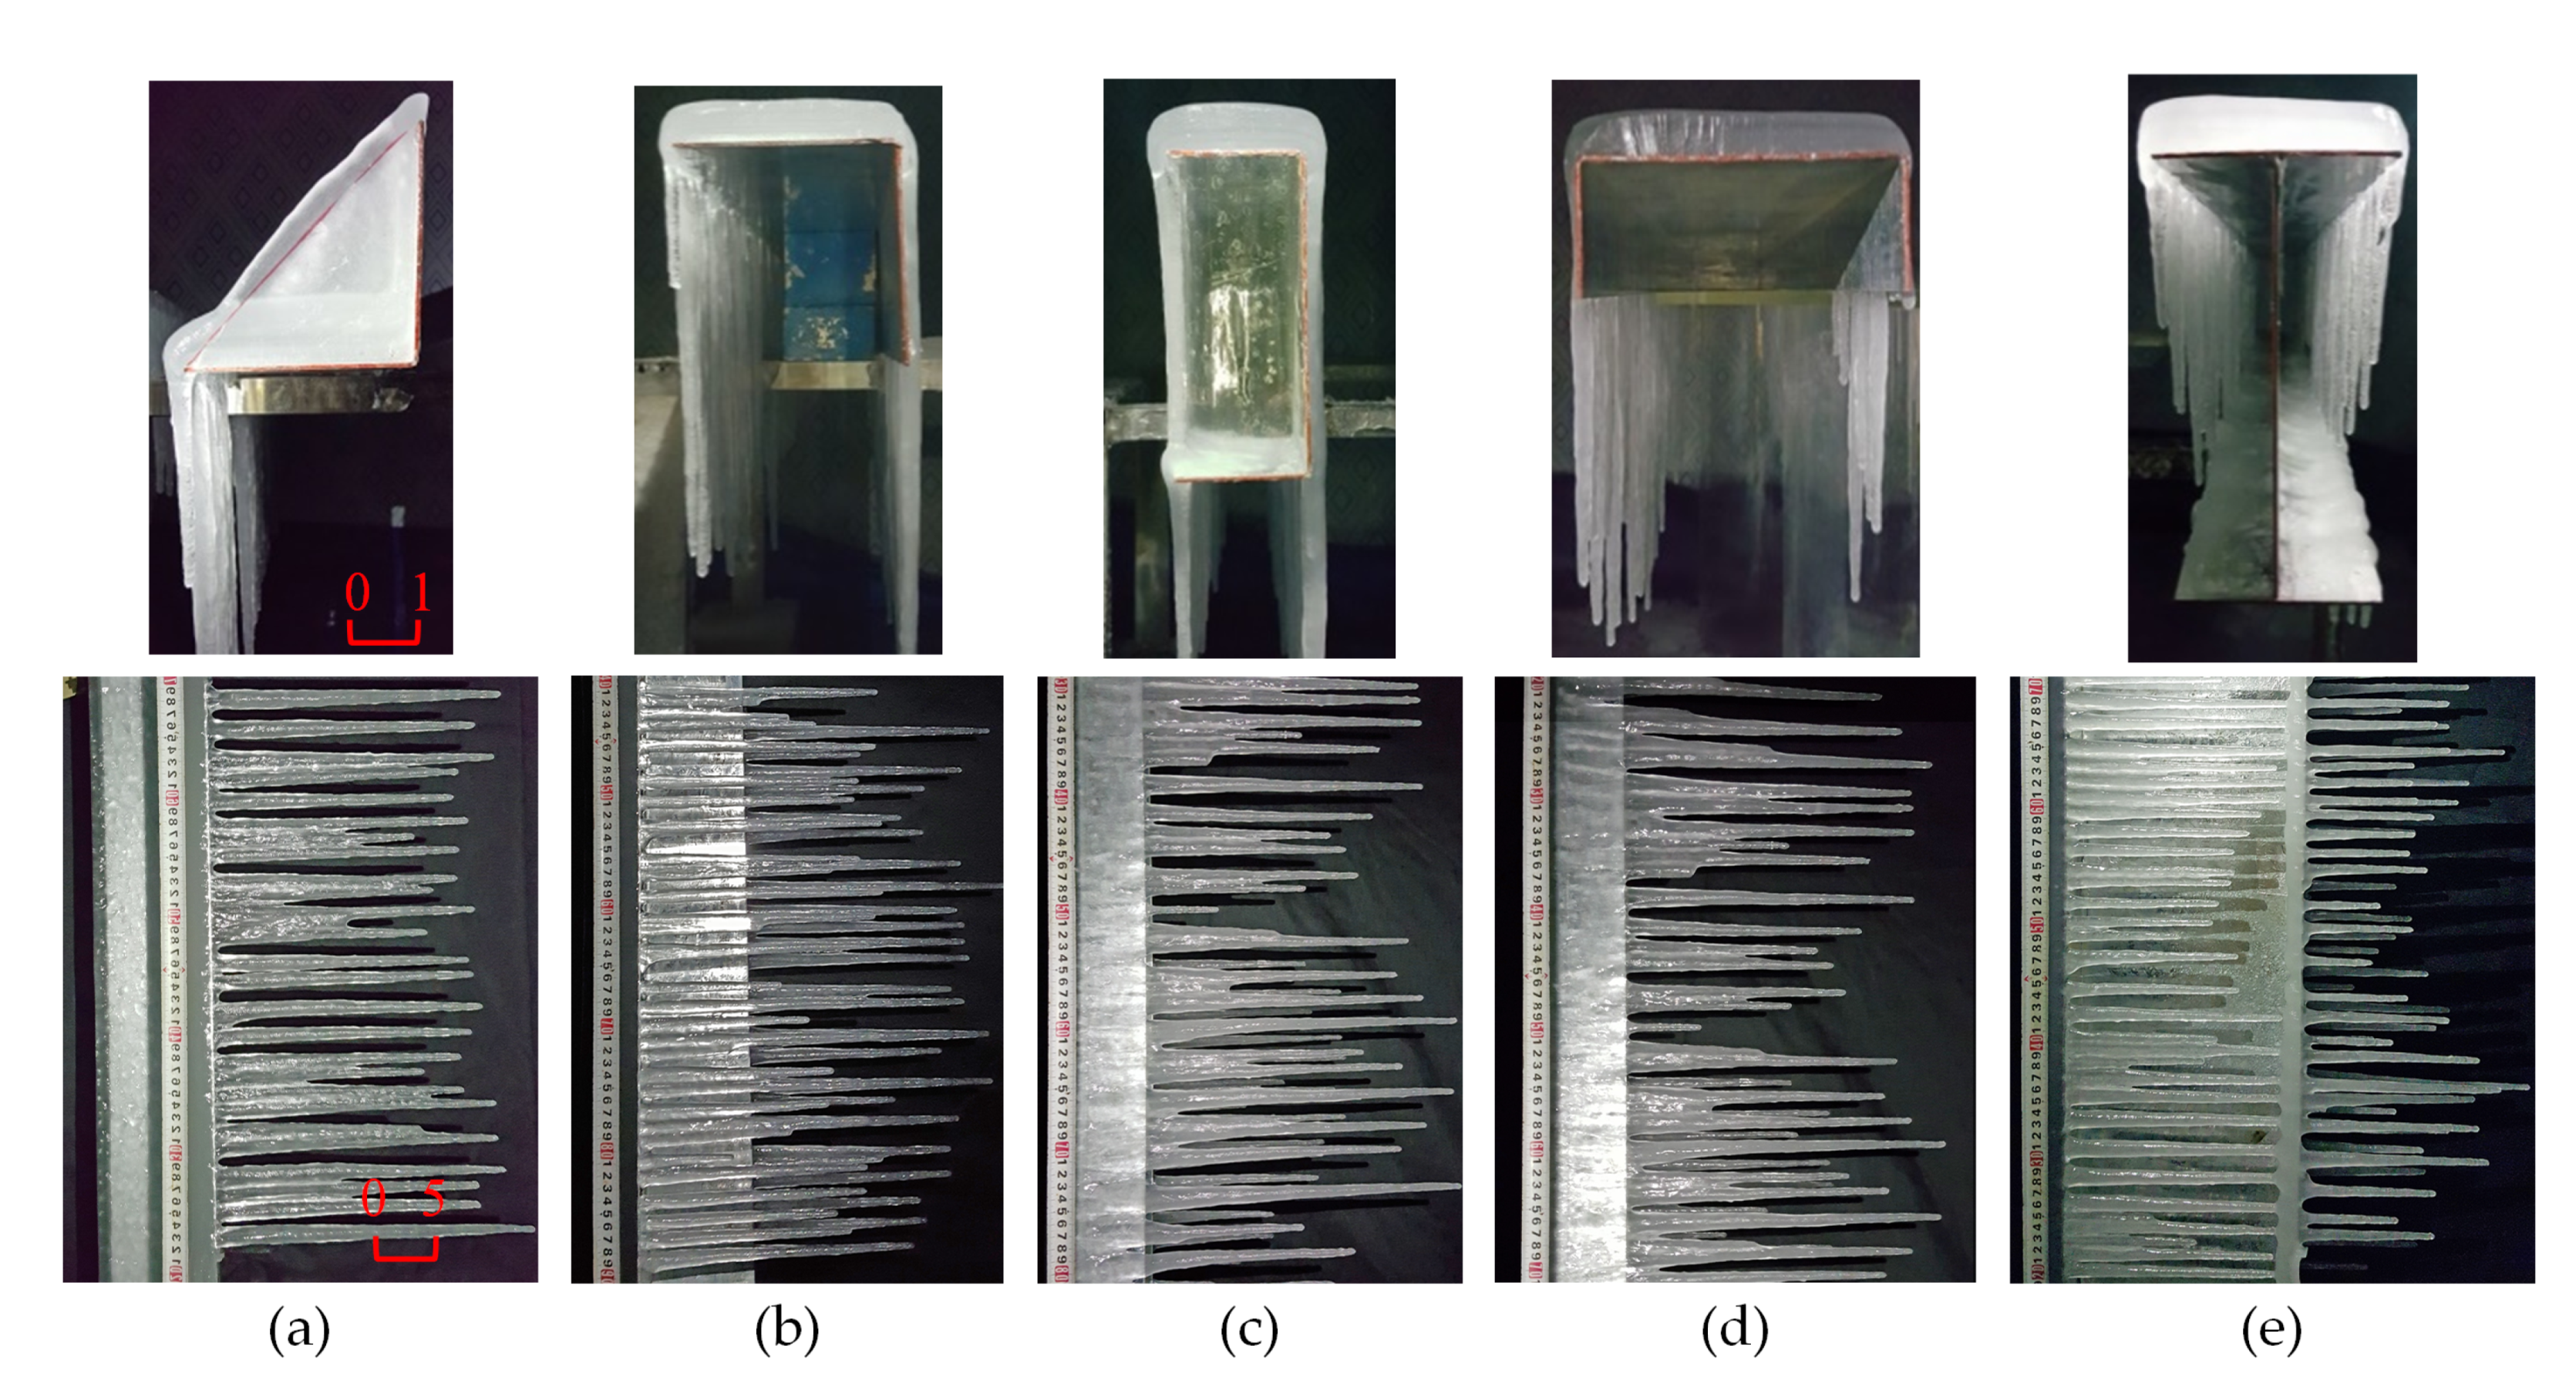
- For the angle steel, the ice thickness on the top wall (γ = 90°) was smaller than that on the bottom wall (γ = 0°). This was due to some of the droplets being prevented from flowing down by the lateral wall for γ = 0°, and consequently, Bb > Bt. ls for γ = 0° was much larger than that for γ = 90°. For the U-steel and I beams with γ = 0°, most of the icicles were connected to the bottom wall, and therefore, the lt values in Table 2 were inaccurate.
- (3)
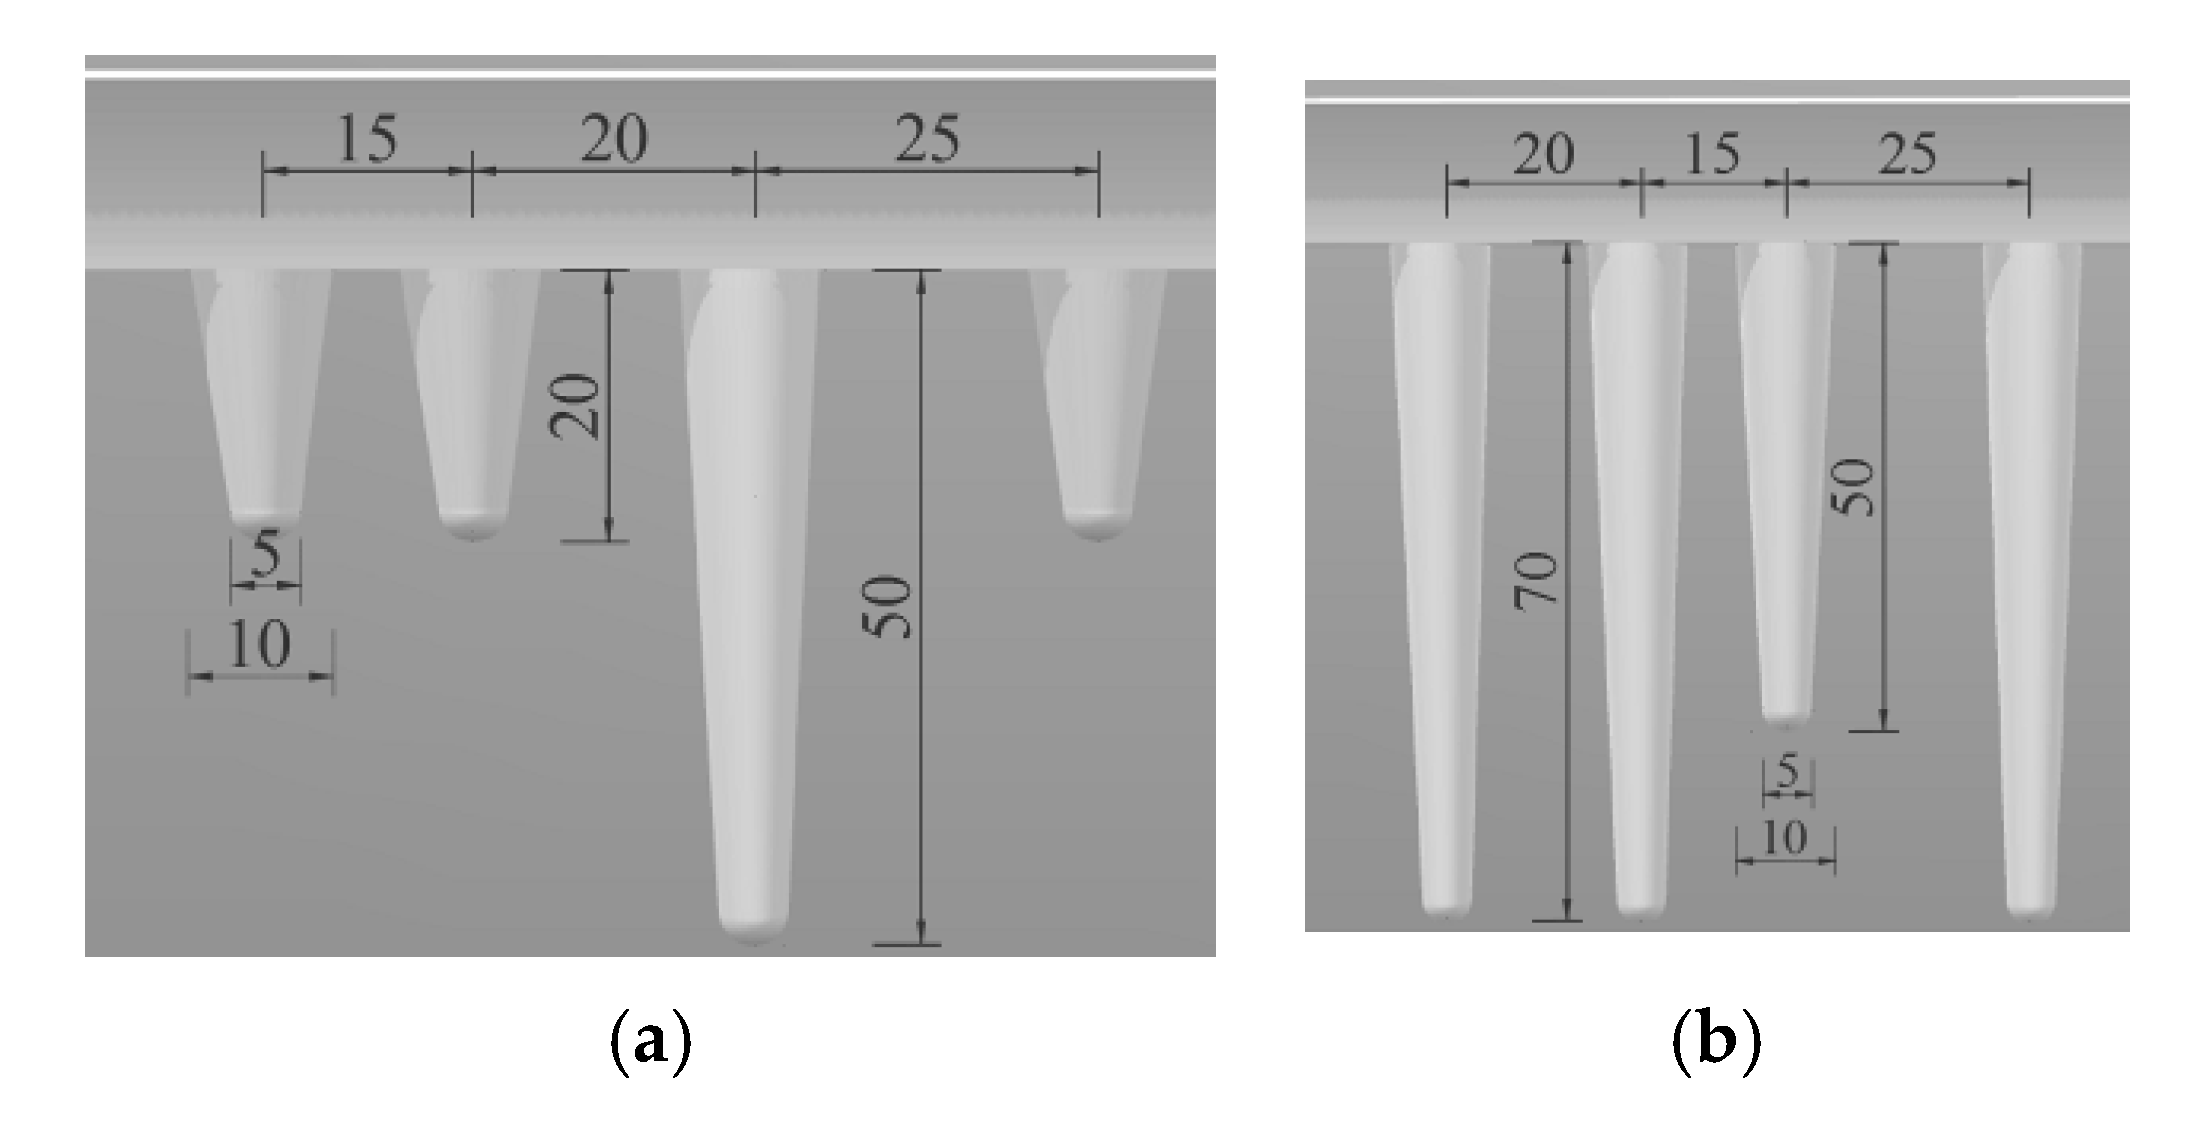
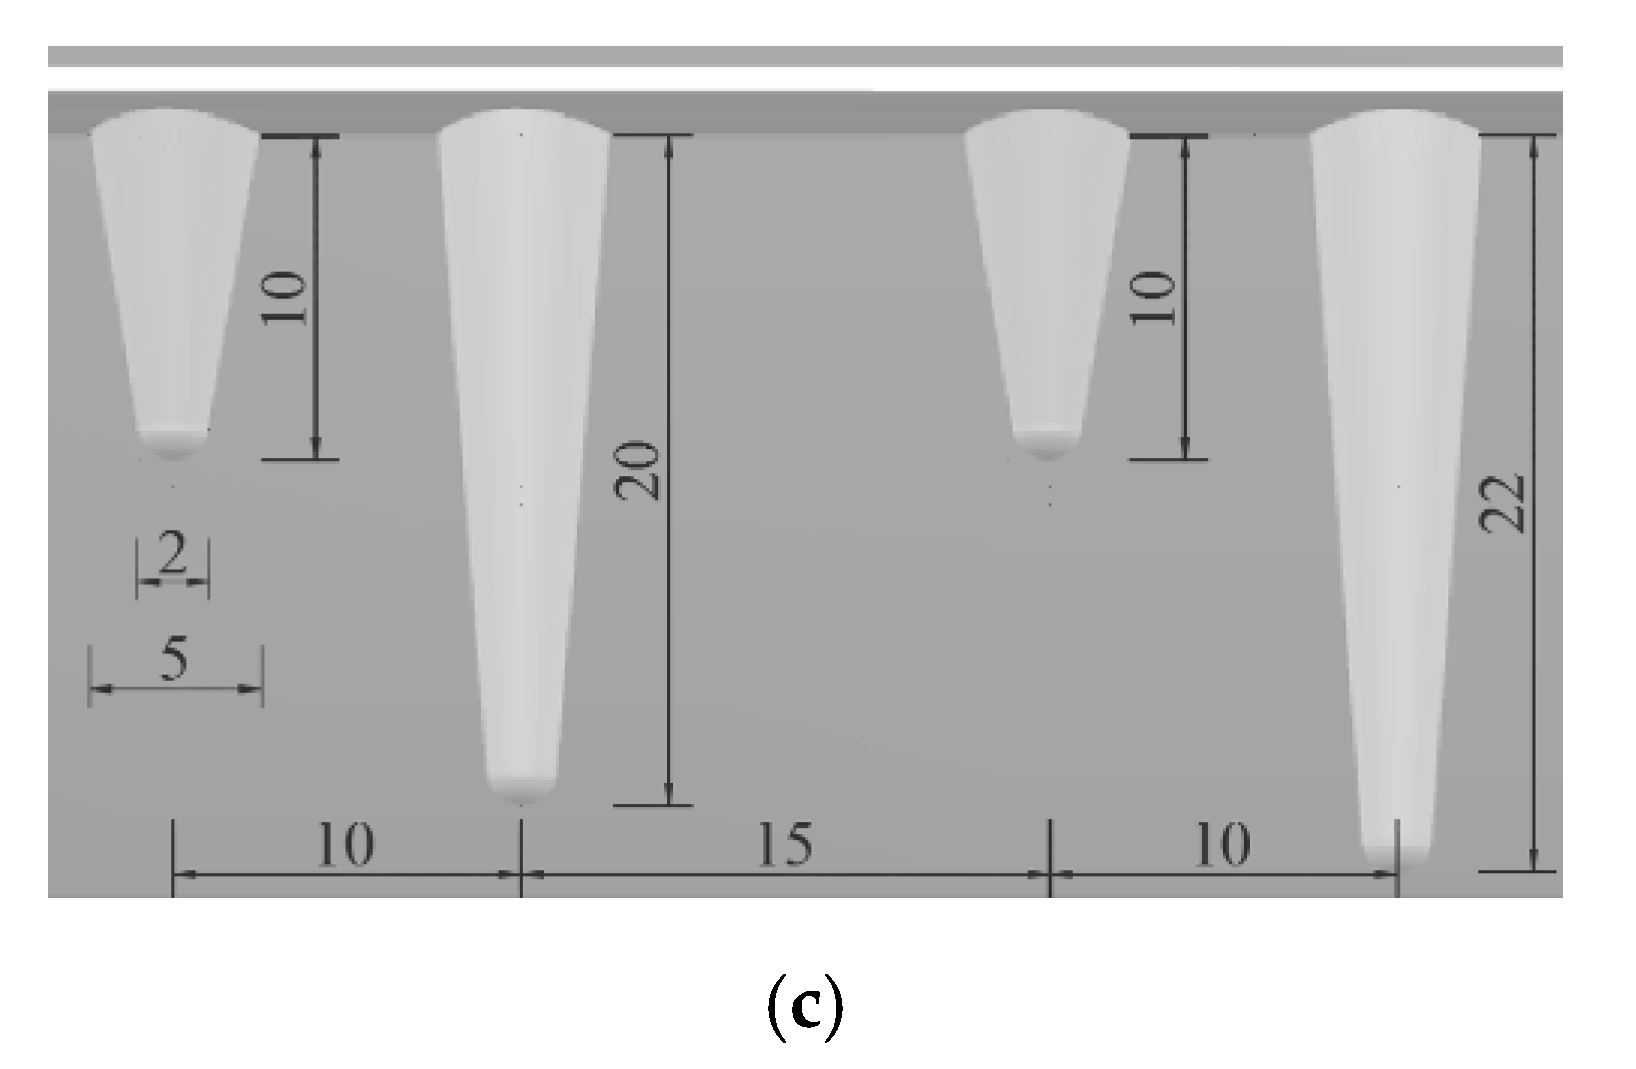
- As shown in Figure 18 and Figure 19, the icicles on all components could be simplified as circular truncated cones with s = 2–52 mm. The db of the icicle was about 5 mm, while dt increased with increasing N, and the adjacent icicles would connect after dt > s, therefore the individual icicles begin to merge into an icicle curtain. At the early stage, ice on the lateral wall was in the form of flat icicles, and only some local areas accreted ice. The whole range was almost uniformly covered by ice when N was large enough.
3.4. Ice Accretion on Sectional Model
- (1)
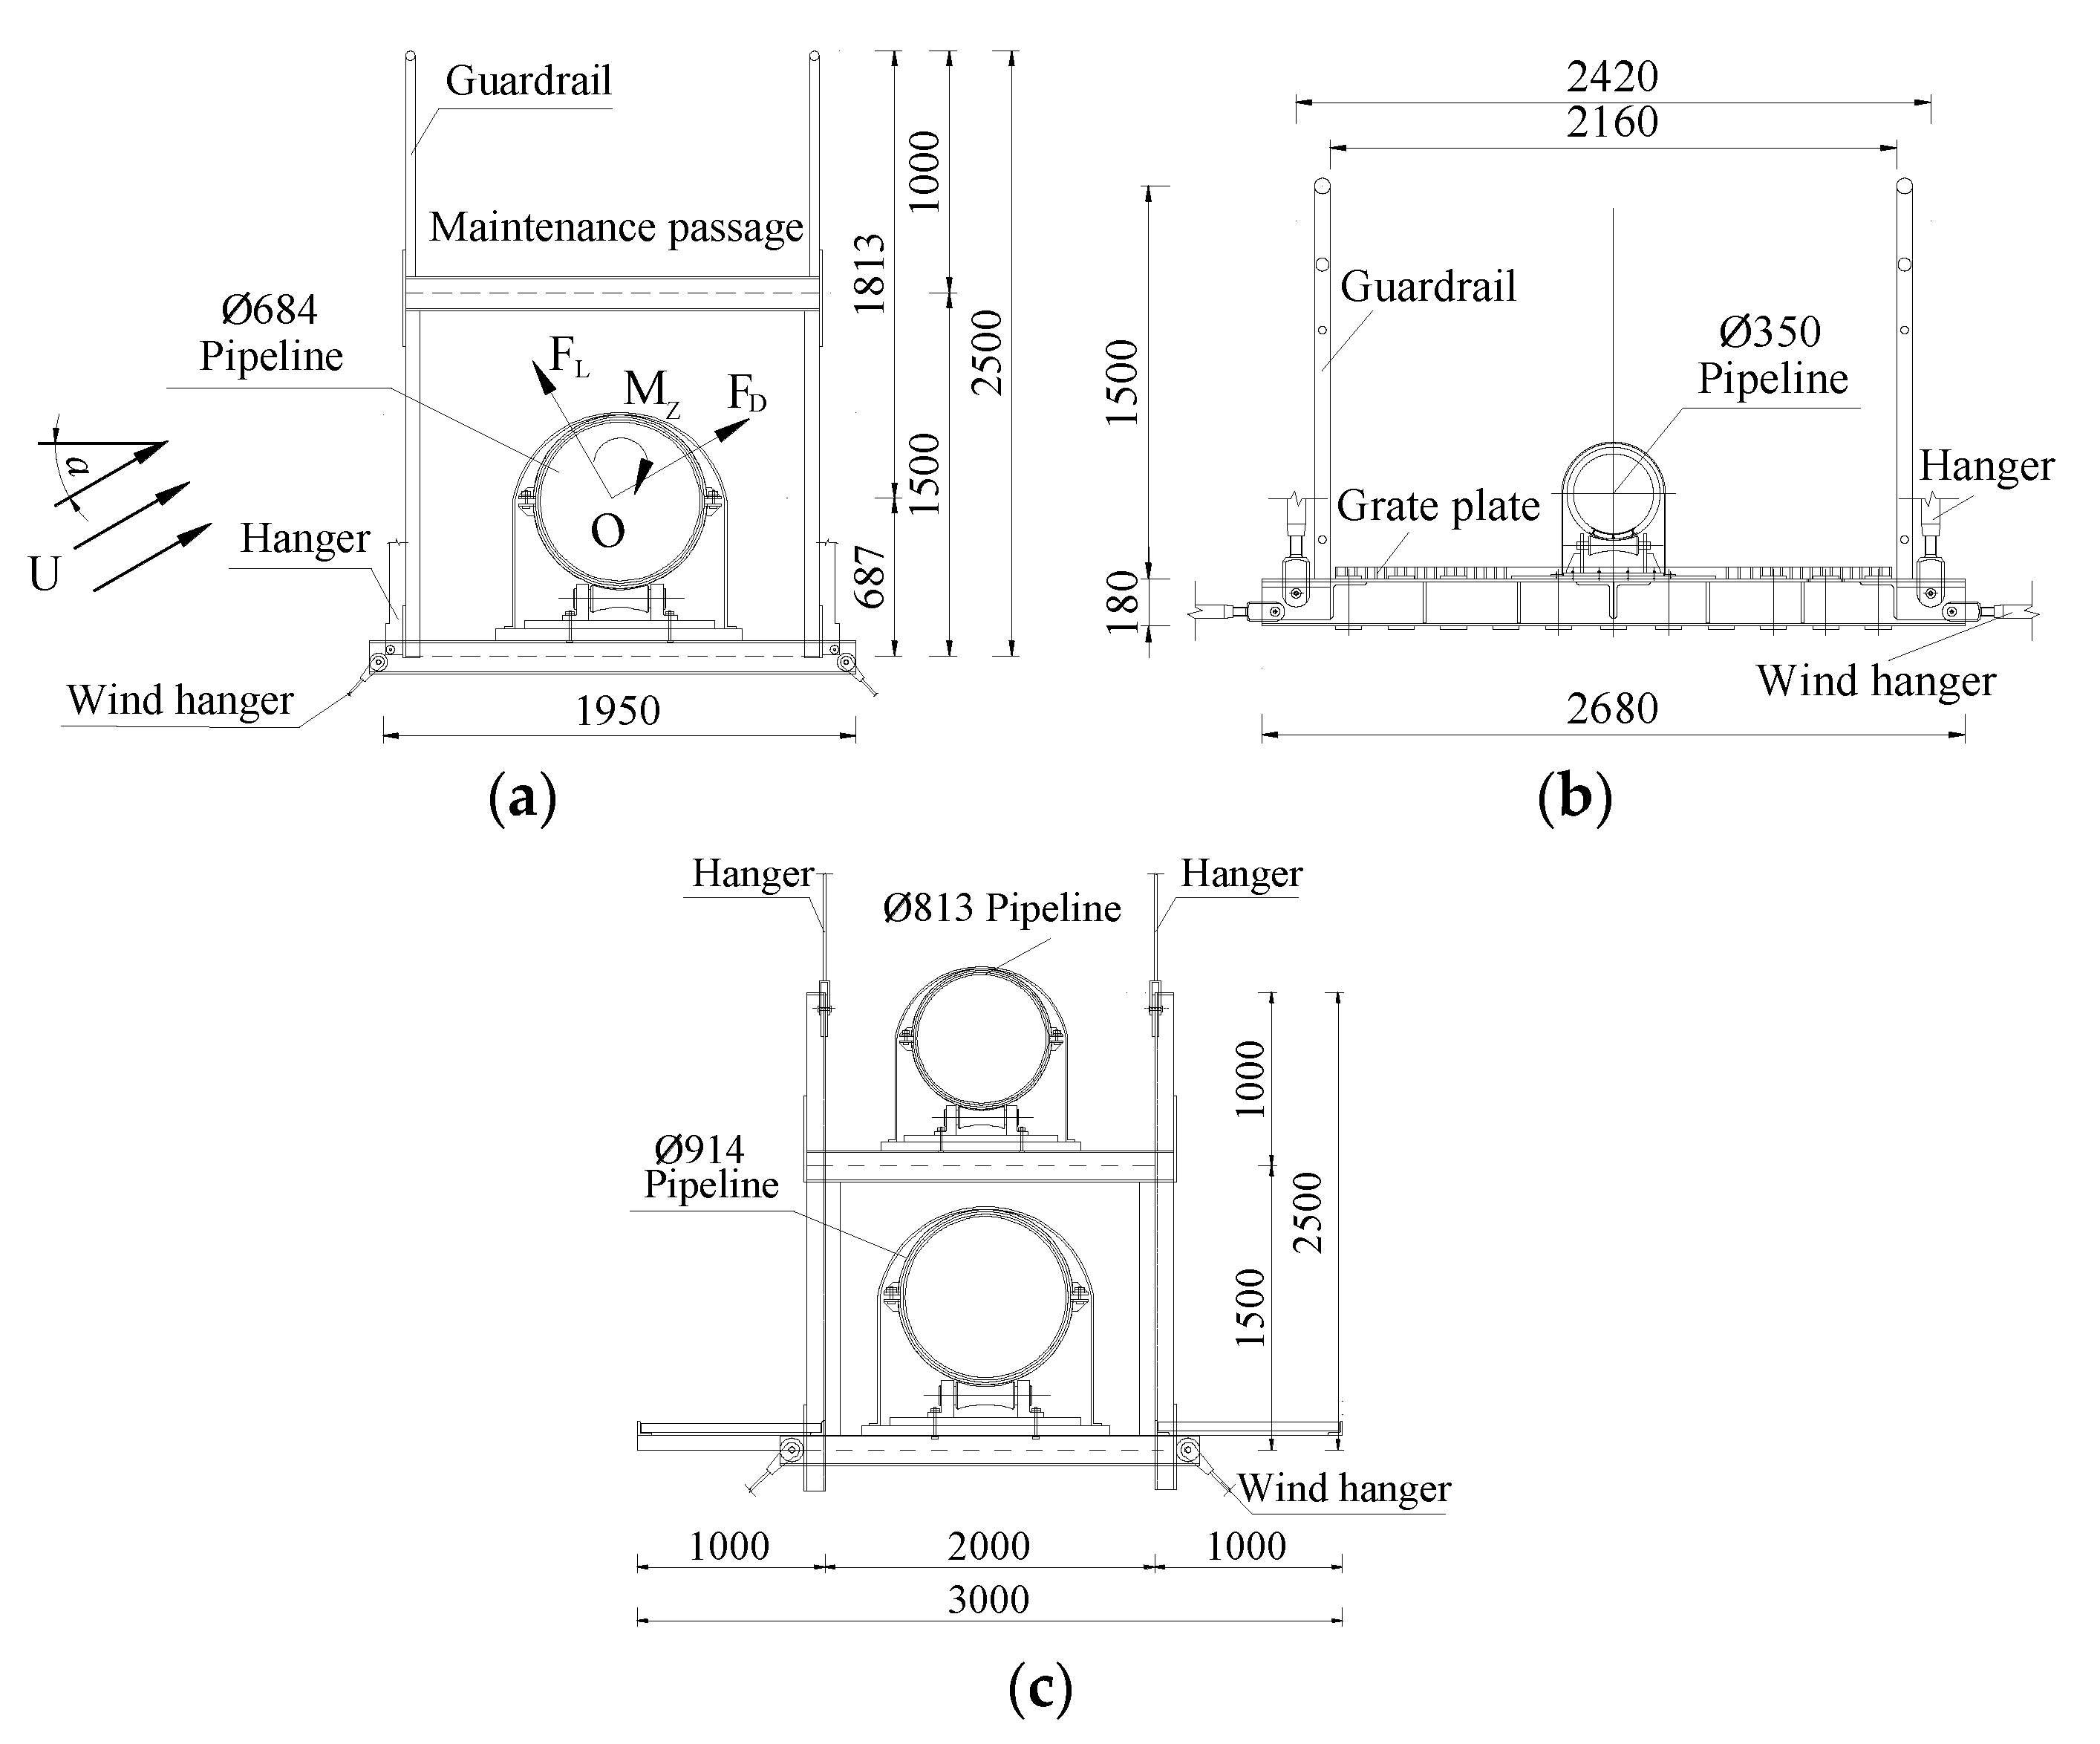
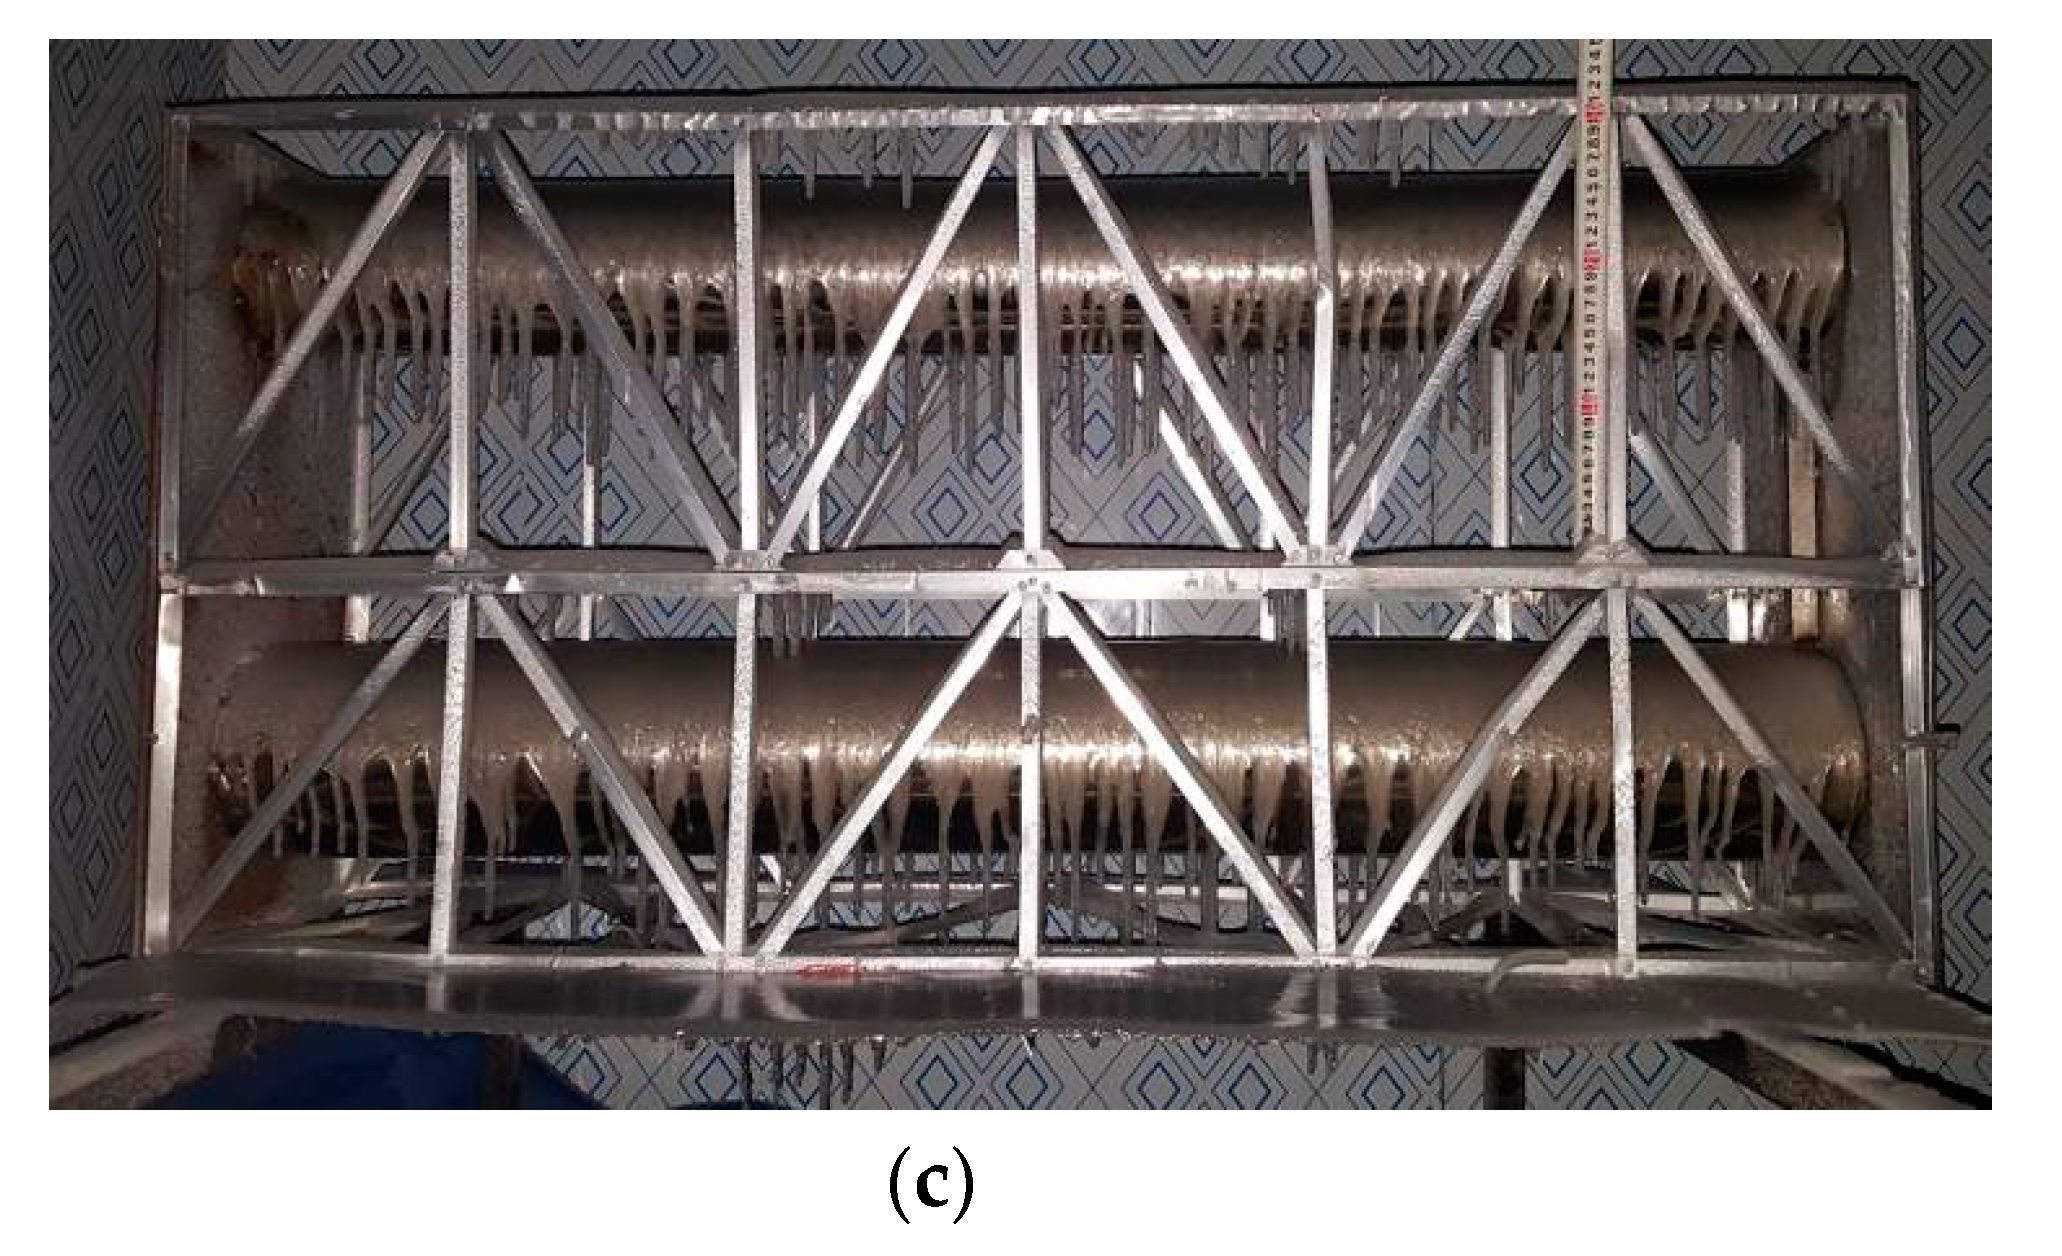
- The ice thicknesses and ice shapes on the pipelines of the section models were roughly the same as those on the circular cylinders described in Section 3.1. Only one row of icicles was formed under each guardrail of girders A and B due to its small diameter (D = 10 mm), which agreed with the results for ice accretion on transmission lines [37].
- (2)
- The ice shape of the truss stiffening girder was related to the γ of its components. A large amount of ice accumulated on the upper surface for the horizontal and inclined bars, while only a slight amount of ice with a rough surface grew on the surfaces of the vertical bars, and the other surface of the truss stiffening girder had little ice. The areas and thicknesses of the components facing the droplets were increased by the ice on the truss stiffening girder. These results agreed with those in Section 3.3. Therefore, the above results for pipelines and section steels could be used as references for simulating the ice accretion on pipeline girders.
- (3)
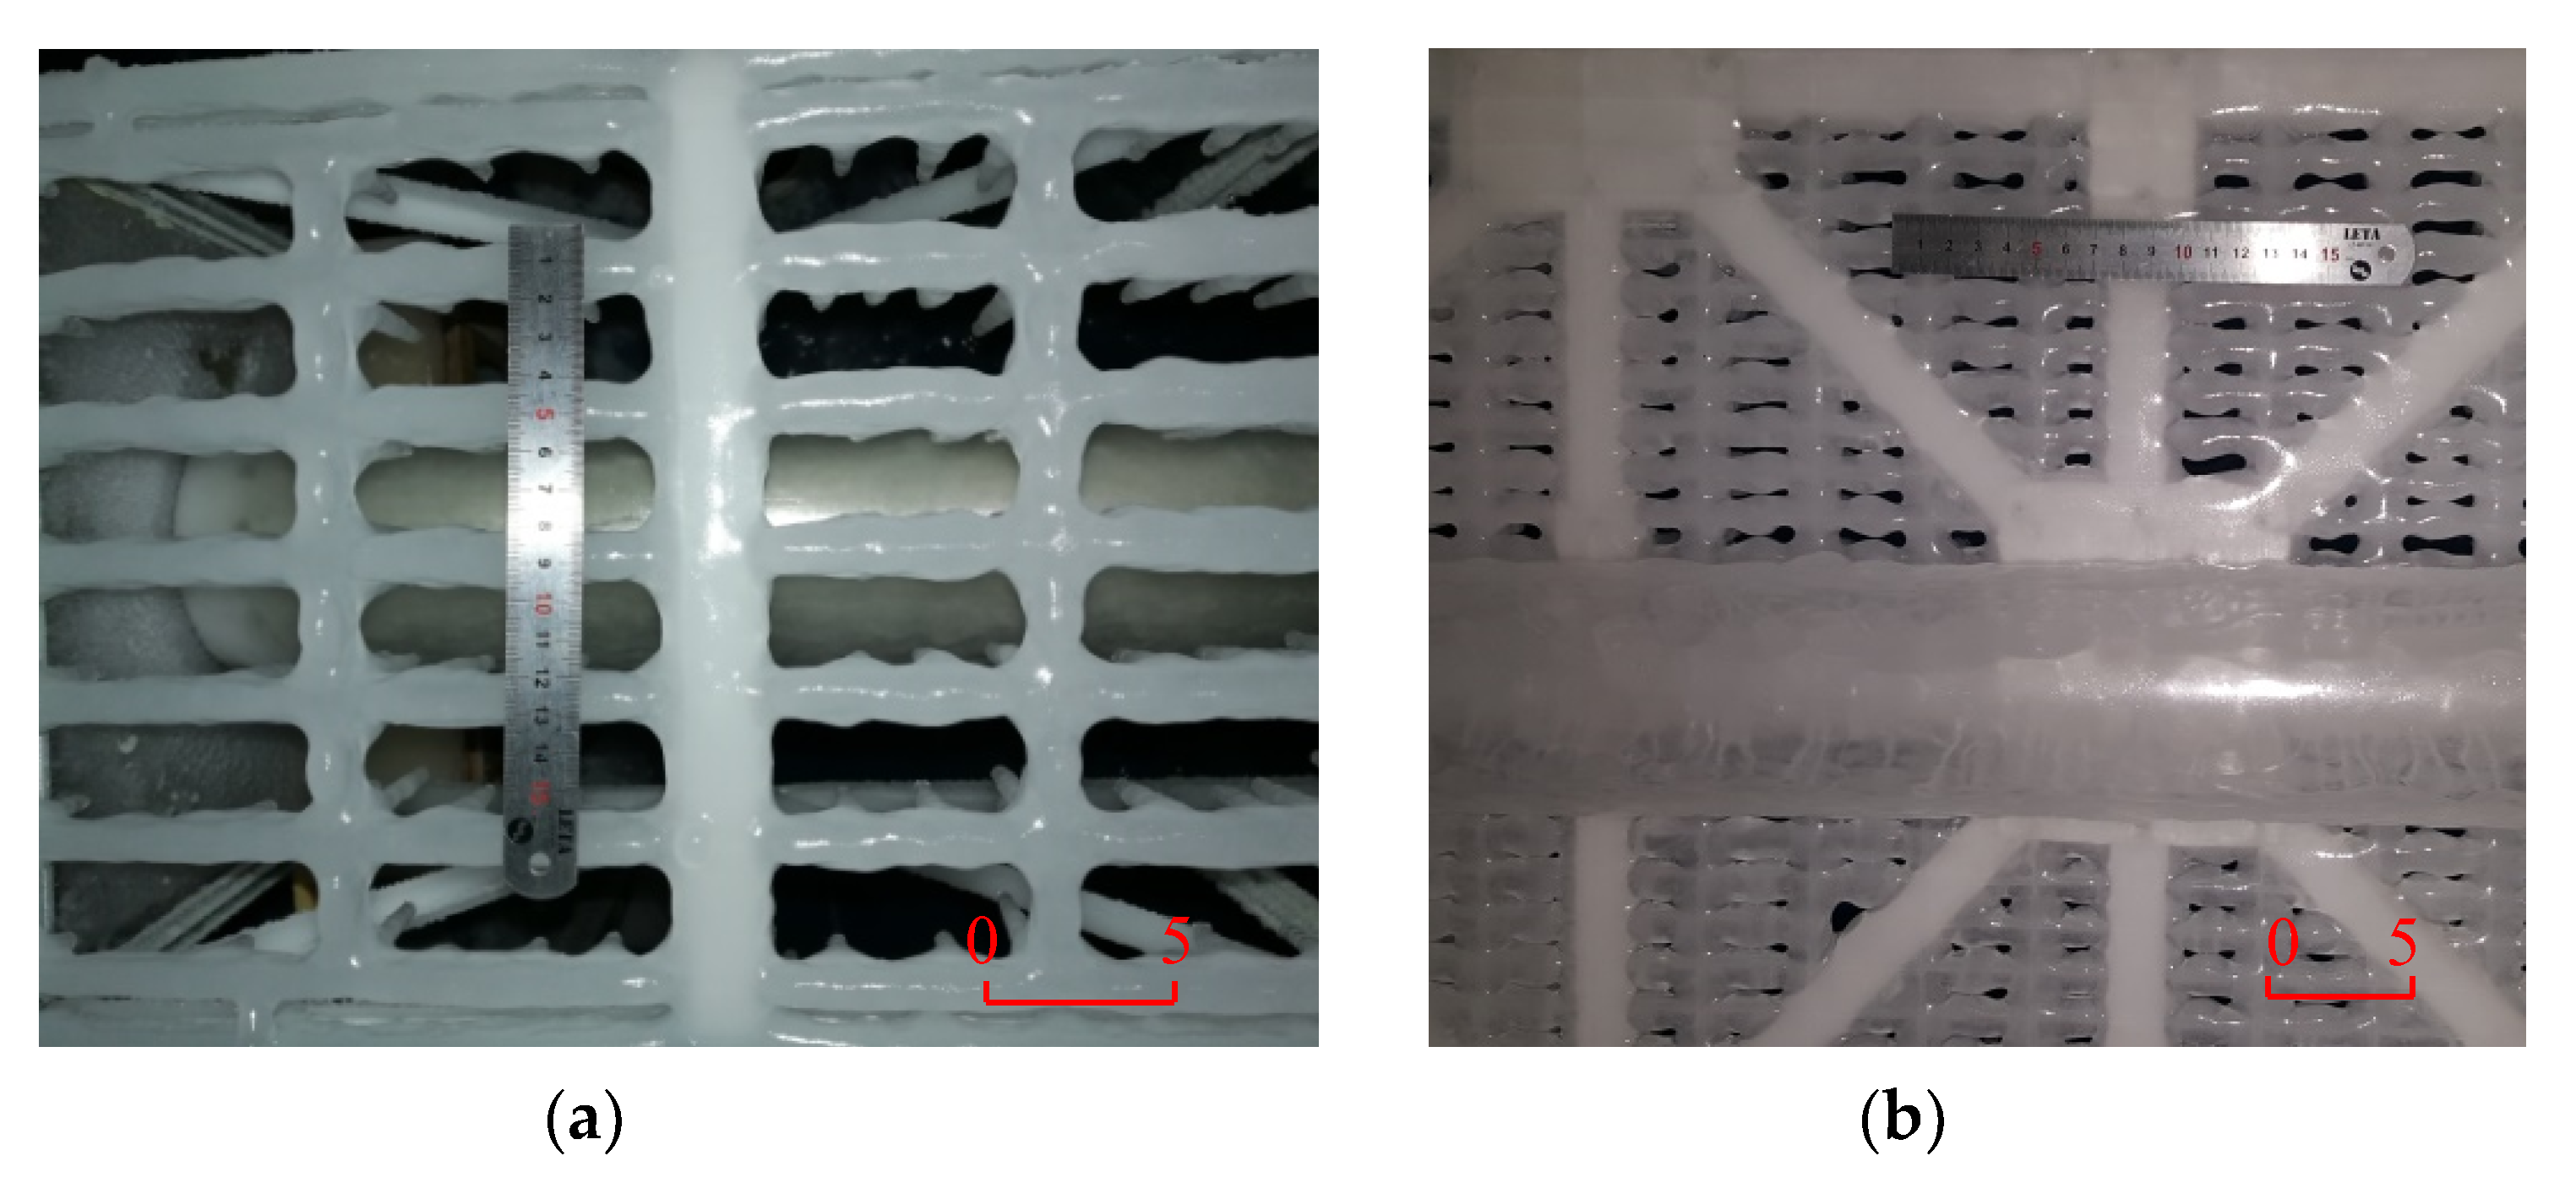
- Since the grate plate was composed of interconnected slender elements, the ice accretion on adjacent elements connected, which resulted in a decreased porosity and an increased thickness, respectively (Figure 21). Meanwhile, a large number of icicles were produced under the grate plate, which was like a large icicle matrix. However, the sizes of the icicles under the grate plate had upper limit, and they would stop growing after the porosity of the grate plate became zero.
- (4)
- For girder C, due to the obstruction of the upper pipeline and truss, the δ0 of the upper layer (5 mm) was much larger than that of the lower layer (2 mm), and the lmean of the upper pipeline (85 mm) was larger than that of the lower pipeline (59 mm). Bt of the middle horizontal trusses (13.6 mm) was larger than that of the top ones (10.5 mm), while the average Bt of the bottom section steel was the smallest one (7.7 mm).
4. Shape Simulation of Ice Accretion on Sectional Model
5. Wind Tunnel Tests
5.1. Experimental Setup
5.2. Aerodynamic Characteristics of Pipeline Girder with Ice Accretion
6. Conclusions
Author Contributions
Funding
Acknowledgments
Conflicts of Interest
References
- John, A.H.; John, J.G.; Carol, J.C. Pipeline Accident Report; NTS Board: Washington, DC, USA, 2003; NTSB/PAR-03/01 PB2003-916501. [Google Scholar]
- Li, J.J.; Zhu, Y.; Chen, G.M. Comparative analysis on emergency management for leakage explosion accidents of urban oil and gas pipeline. J. Saf. Sci. Technol. 2014, 8, 11–15. [Google Scholar]
- Gjelstrup, H.; Georgakis, C.; Larsen, A. A preliminary investigation of the hanger vibrations on the Great Belt East Bridge. In Proceedings of the Seventh International Symposium on Cable Dynamics, Vienna, Austria, 1 January 2007. [Google Scholar]
- Gjelstrup, H.; Georgakis, C.T.; Larsen, A. An evaluation of iced bridge hanger vibrations through wind tunnel testing and quasi-steady theory. Wind Struct. 2012, 15, 385–407. [Google Scholar] [CrossRef]
- Koss, H.H.; Lund, M.S.M. Experimental investigation of aerodynamic instability of iced bridge cable sections. In Proceedings of the 6th European and African Wind Engineering Conference, Cambridge, UK, 7–13 July 2013. [Google Scholar]
- Marušić, A.; Kozmar, H. Aerodynamic Behavior of Bridge Cables in Icing Conditions. Ph.D. Thesis, University of Zagreb, Croatia, Balkans, 2014. [Google Scholar]
- Demartino, C.; Koss, H.H.; Georgakis, C.T.; Ricciardelli, F. Effects of ice accretion on the aerodynamics of bridge cables. J. Wind Eng. Ind. Aerodyn. 2015, 138, 98–119. [Google Scholar] [CrossRef]
- Demartino, C.; Ricciardelli, F. Aerodynamics of nominally circular cylinders: A review of experimental results for Civil Engineering applications. Eng. Struct. 2017, 137, 76–114. [Google Scholar] [CrossRef]
- Guo, P.; Li, S.; Wang, D. Effects of aerodynamic interference on the iced straddling hangers of suspension bridges by wind tunnel tests. J. Wind Eng. Ind. Aerodyn. 2019, 184, 162–173. [Google Scholar] [CrossRef]
- Jafari, M.; Hou, F.; Abdelkefi, A. Wind-induced vibration of structural cables. Nonlinear Dyn. 2020, 100, 351–421. [Google Scholar] [CrossRef]
- Zhang, M.; Xu, F.; Han, Y. Assessment of wind-induced nonlinear post-critical performance of bridge decks. J. Wind Eng. Ind. Aerodyn. 2020, 203, 104251. [Google Scholar] [CrossRef]
- Zhang, M.; Xu, F.; Zhang, Z.; Ying, X. Energy budget analysis and engineering modeling of post-flutter limit cycle oscillation of a bridge deck. J. Wind Eng. Ind. Aerodyn. 2019, 188, 410–420. [Google Scholar] [CrossRef]
- Kollár, L.E.; Farzaneh, M. Wind-tunnel investigation of icing of an inclined cylinder. Int. J. Heat Mass Transf. 2010, 53, 849–861. [Google Scholar] [CrossRef]
- Koss, H.H.; Gjelstrup, H.; Georgakis, C.T. Experimental study of ice accretion on circular cylinders at moderate low temperatures. J. Wind Eng. Ind. Aerodyn. 2012, 104, 540–546. [Google Scholar] [CrossRef]
- Demartino, C.; Ricciardelli, F. Aerodynamic stability of ice-accreted bridge cables. J. Fluids Struct. 2015, 52, 81–100. [Google Scholar] [CrossRef]
- Lébatto, E.B.; Farzaneh, M.; Lozowski, E.P. Conductor icing: Comparison of a glaze icing model with experiments under severe laboratory conditions with moderate wind speed. Cold Reg. Sci. Technol. 2015, 113, 20–30. [Google Scholar] [CrossRef]
- Górski, P.; Pospíšil, S.; Kuznetsov, S.; Tatara, M.; Marušić, A. Strouhal number of bridge cables with ice accretion at low flow turbulence. Wind Struct. 2016, 22, 253–272. [Google Scholar] [CrossRef]
- Szilder, K. Theoretical and experimental study of ice accretion due to freezing rain on an inclined cylinder. Cold Reg. Sci. Technol. 2018, 150, 25–34. [Google Scholar] [CrossRef]
- Farzaneh, M.; Baker, T.; Bernstorf, A.; Brown, K.; Chisholm, W.A.A.; De Tourreil, C.; Drapeau, J.F.; Fikke, S.; George, J.M.; Gnandt, E.; et al. Insulator icing test methods and procedures: A position paper prepared by the IEEE task force on insulator icing test methods. IEEE Trans. Power Deliv. 2003, 18, 1503–1515. [Google Scholar] [CrossRef]
- Farzaneh, M. Insulator flashover under icing conditions. IEEE Trans. Dielectr. Electr. Insul. 2014, 21, 1997–2011. [Google Scholar] [CrossRef]
- Lynch, F.T.; Abdollah, K. Effects of ice accretions on aircraft aerodynamics. Prog. Aerosp. Sci. 2002, 37, 669–767. [Google Scholar]
- Cao, Y.; Huang, J.; Yin, J. Numerical simulation of three-dimensional ice accretion on an aircraft wing. Int. J. Heat Mass Transf. 2016, 92, 34–54. [Google Scholar] [CrossRef]
- Kraj, A.G.; Bibeau, E.L. Phases of icing on wind turbine blades characterized by ice accumulation. Renew. Energy 2010, 35, 966–972. [Google Scholar] [CrossRef]
- Han, Y.; Palacios, J.; Schmitz, S. Scaled ice accretion experiments on a rotating wind turbine blade. J. Wind Eng. Ind. Aerodyn. 2012, 109, 55–67. [Google Scholar] [CrossRef]
- Chabart, O.; Lilien, J.L. Galloping of electrical lines in wind tunnel facilities. J. Wind Eng. Ind. Aerodyn. 1998, 74, 967–976. [Google Scholar] [CrossRef]
- Fukusako, S.; Horibe, A.; Tago, M. Ice accretion characteristics along a circular cylinder immersed in a cold air stream with seawater spray. Exp. Therm. Fluid Sci. 1989, 2, 81–90. [Google Scholar] [CrossRef]
- Li, X.M.; Zhu, K.J.; Liu, B. Research of experimental simulation on aerodynamic character for typed iced conductor. Aasri Procedia 2012, 2, 106–111. [Google Scholar]
- Kim, J.W.; Sohn, J.H. Galloping simulation of the power transmission line under the fluctuating wind. Int. J. Precis. Eng. Manuf. 2018, 19, 1393–1398. [Google Scholar] [CrossRef]
- Górski, P.; Tatara, M.; Pospíšil, S.; Kuznetsov, S. Model investigations of the aerodynamic coefficients of iced cables in cable-stayed bridges. Tech. Trans. 2019, 12, 115–127. [Google Scholar] [CrossRef]
- Jones, K.F. Ice Accretion in Freezing Rain (No. CRREL-96-2); Cold Regions Research and Engineering Lab Hanover NH: Hanover, NH, USA, 1996. [Google Scholar]
- Langmuir, I.; Blodgett, K.B. A mathematical investigation of water droplet trajectories. In Collected Works of Irving Langmuir; Pergamon Press: Oxford, UK, 1946; Volume 10, pp. 348–393. [Google Scholar]
- Finstad, K.J.; Lozowski, E.P.; Makkonen, L. On the median volume diameter approximation for droplet collision efficiency. J. Atmos. Sci. 1988, 45, 4008–4012. [Google Scholar] [CrossRef]
- Jeck, R. Representative values of icing-related variables aloft in freezing rain and freezing drizzle. In Proceedings of the 34th Aerospace Sciences Meeting and Exhibit, Reno, NV, USA, 15–18 January 1996; p. 930. [Google Scholar]
- Huffman, G.J.; Norman, G.A., Jr. The supercooled warm rain process and the specification of freezing precipitation. Mon. Weather. Rev. 1988, 116, 2172–2182. [Google Scholar] [CrossRef]
- Jiang, X.L.; Yi, H. Ice Accretion and Protection of Transmission Lines; China Electric Power Press: Beijing, China, 2002. [Google Scholar]
- Makkonen, L. Modeling power line icing in freezing precipitation. Atmos. Res. 1998, 46, 131–142. [Google Scholar] [CrossRef]
- Makkonen, L.; Fujii, Y. Spacing of icicles. Cold Reg. Sci. Technol. 1993, 21, 317–322. [Google Scholar] [CrossRef]
- International Organization for Standardization. ISO 12494: Atmospheric Icing of Structures, 2nd ed.; ISO: Geneva, Switzerland, 2017. [Google Scholar]
- Maeno, N.; Makkonen, L.; Nishimura, K.; Kosugi, K.; Takahashi, T. Growth rates of icicles. J. Glaciol. 1994, 40, 319–326. [Google Scholar] [CrossRef]
- Niu, L.; Huang, F.; Wang, G.F. Creation of a New Freezing Rain Genesis Potential Index over China. Period. Ocean Univ. China 2015, 45, 8–15. [Google Scholar]
- Makkonen, L. Models for the growth of rime, glaze, icicles and wet snow on structures. Philos. Trans. R. Soc. Ser. A Math. Phys. Eng. Sci. 2000, 358, 2913–2939. [Google Scholar] [CrossRef]
- Taylor, G. The instability of liquid surfaces when accelerated in a direction perpendicular to their planes. Proc. R. Soc. Lond. 1950, 201, 192–196. [Google Scholar]
- De Bruyn, J.R. On the formation of periodic arrays of icicles. Cold Reg. Sci. Technol. 1997, 25, 225–229. [Google Scholar] [CrossRef]
- Makkonen, L. A model of icicle growth. J. Glaciol. 1988, 34, 64–70. [Google Scholar] [CrossRef][Green Version]
- Maeno, N.; Takahashi, T. Studies on icicles. I. General aspects of the structure and growth of an icicle. Low Temp. Sci. 1984, 43, 125–138. [Google Scholar]
- Makkonen, L. Heat transfer and icing of a rough cylinder. Cold Reg. Sci. Technol. 1985, 10, 105–116. [Google Scholar] [CrossRef]









| Section Type | Section Size (mm) | Length L (mm) | Angle γ (°) | Spraying Times N |
|---|---|---|---|---|
| Circular cylinder | Ø1000, Ø800, Ø600 | 1000 | 0 | 240 |
| Circular cylinder | Ø400, Ø300, Ø200, Ø150, Ø100, Ø50, Ø25 | 1000 | 0 | 160 |
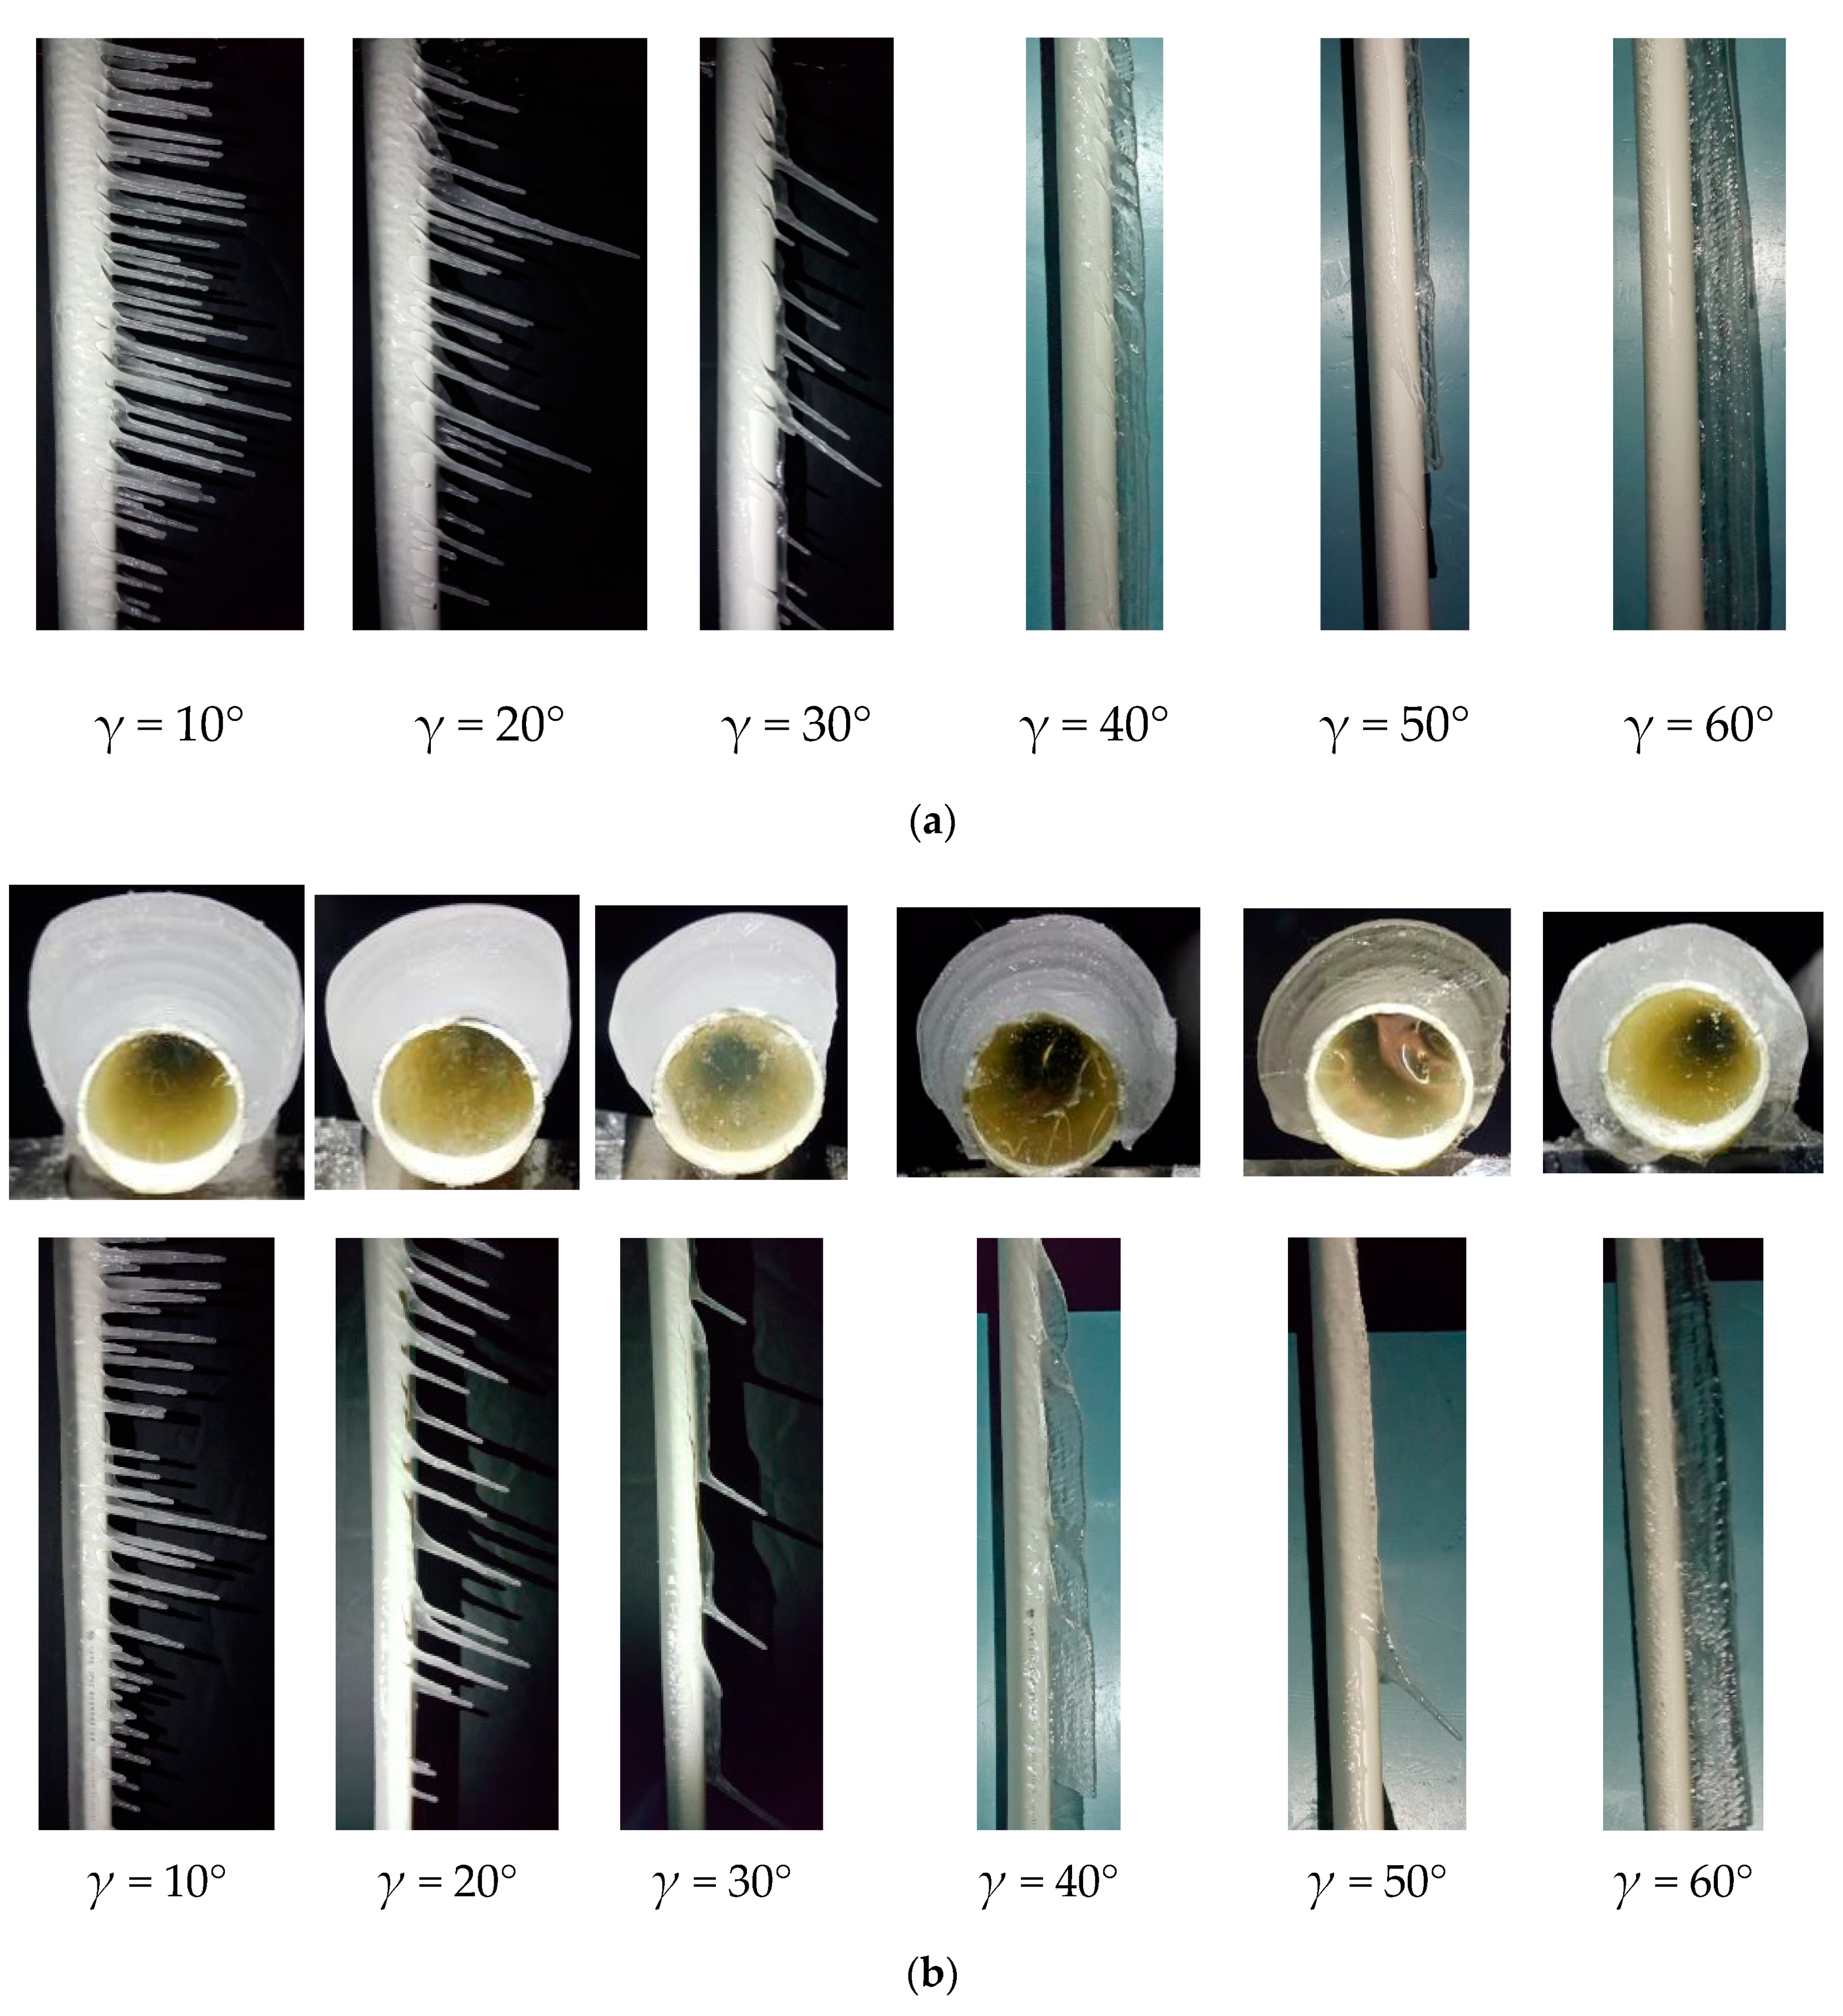
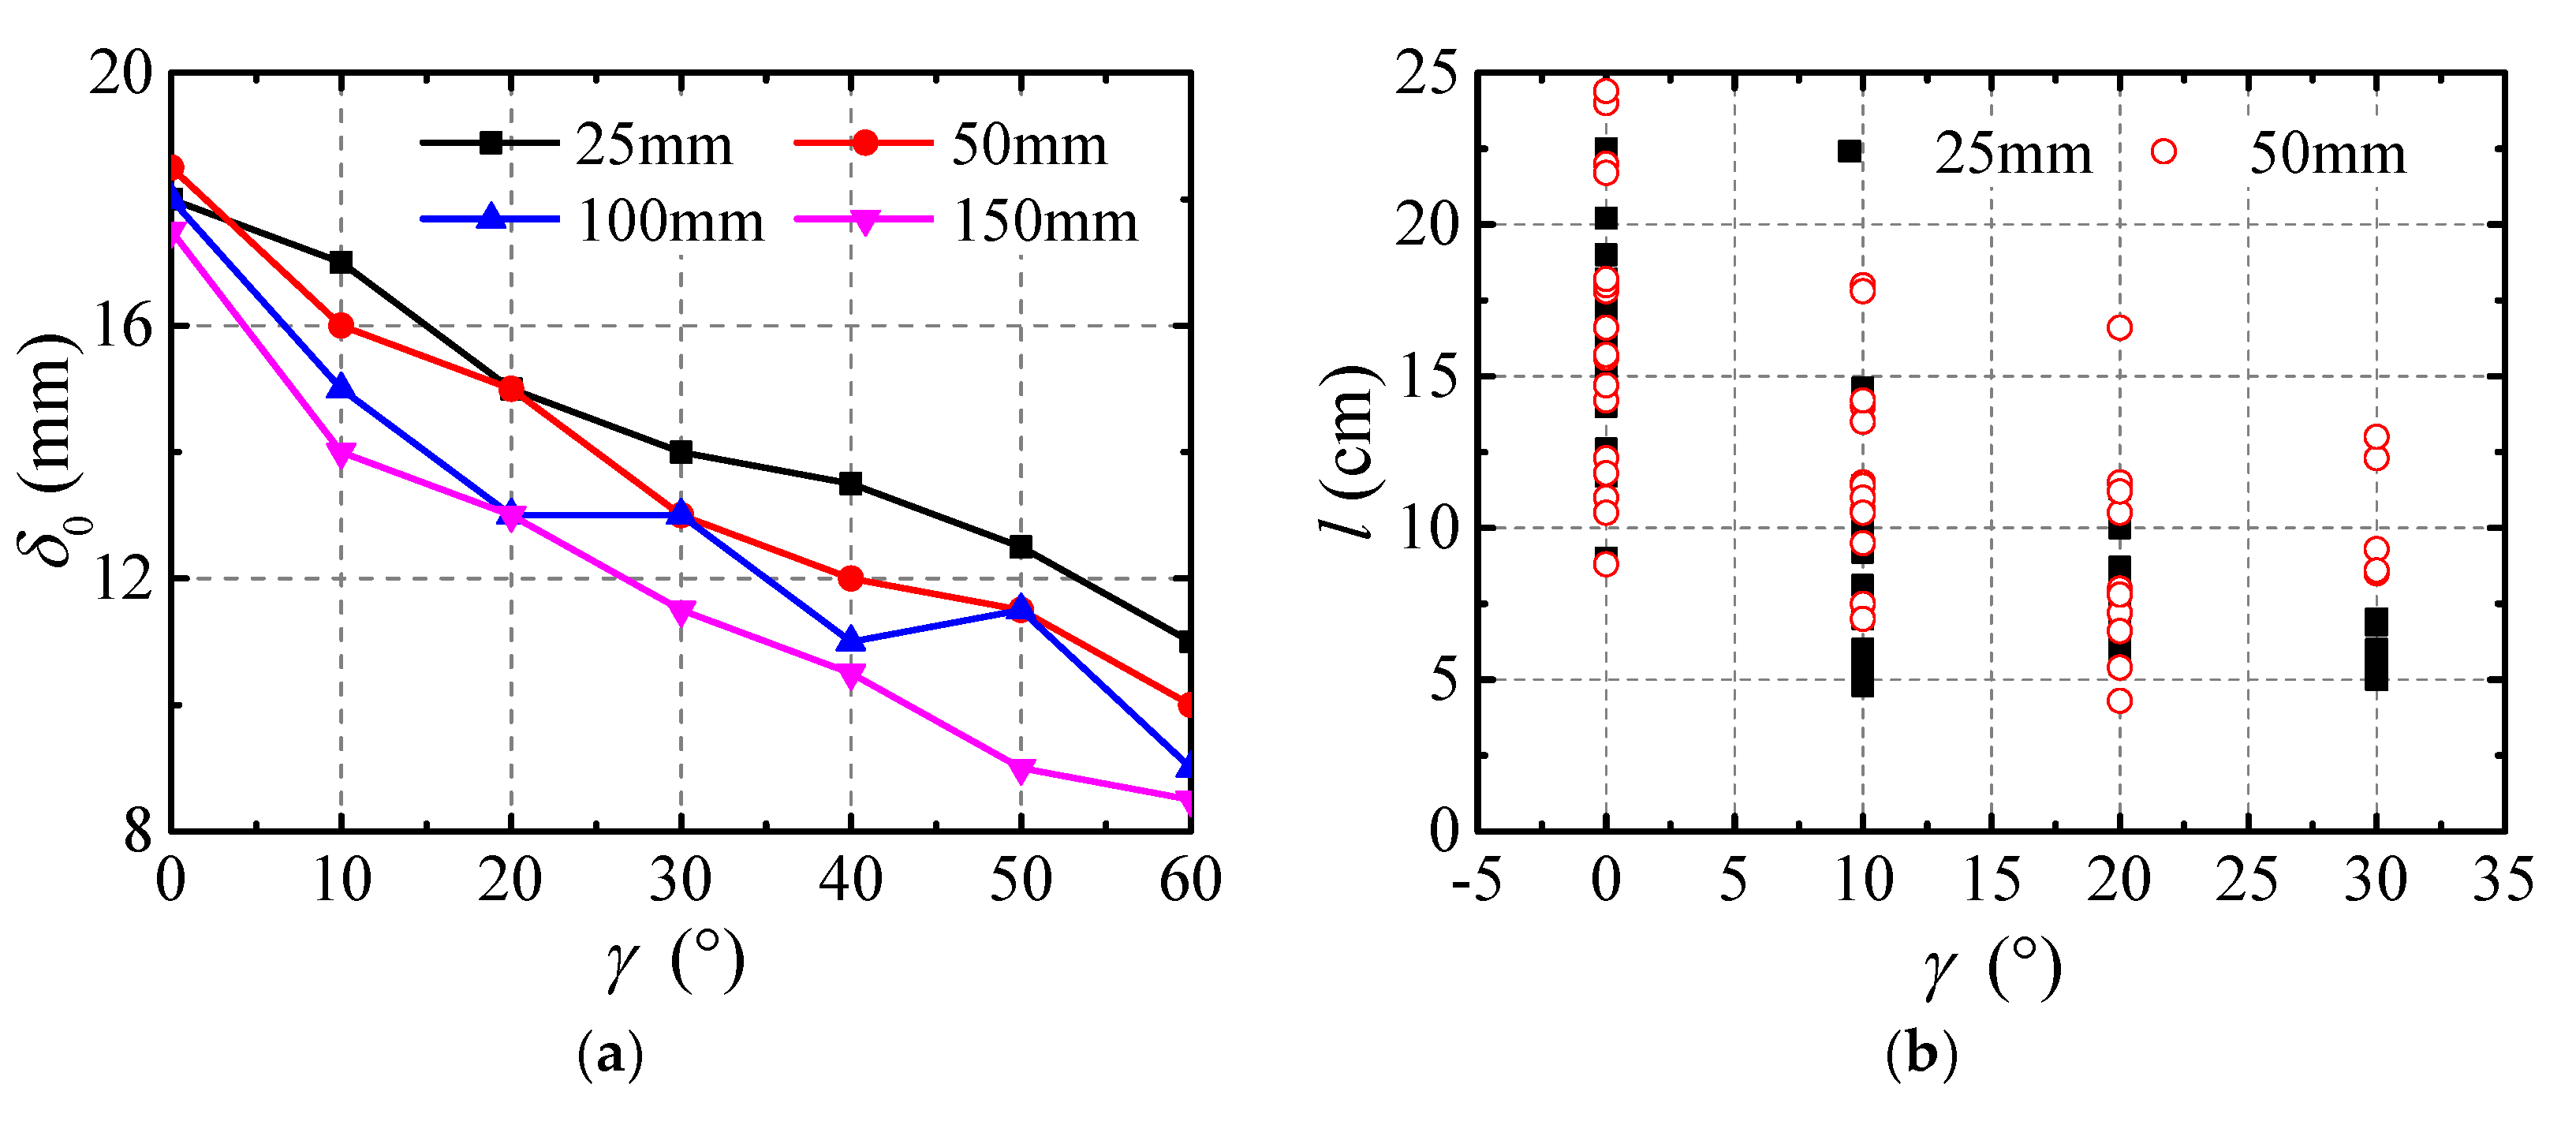
| Circular cylinder | Ø150, Ø100, Ø50, Ø25 | 1000 | 10, 20, 30,40, 50, 60 | 80 |
| Angle steel | L160, L100, L50 | 1000 | 0, 180 | 80 |
| U-steel | U200, U140, U100 | 1000 | 0, 90 | 80 |
| I-beam | I250, I200, I100 | 1000 | 0 | 80 |
| Girder A | 324 × 417 (scale 1: 6) | 1030 | 0 | 30 |
| Girder B | 536 × 336 (scale 1: 5) | 1000 | 0 | 30 |
| Girder C | 625 × 453 (scale 1:6. 4) | 1200 | 0 | 30 |
| Cases | L160 | L100 | L50 | U200 | U140 | U100 | Ⅰ250 | Ⅰ200 | Ⅰ100 | ||||||
|---|---|---|---|---|---|---|---|---|---|---|---|---|---|---|---|
| 0° | 90° | 0° | 90° | 0° | 90° | 0° | 90° | 0° | 90° | 0° | 90° | 0° | 0° | 0° | |
| Bt | - | 16 | - | 19 | - | 19 | 19 | 19 | 21 | 21 | 18 | 20 | 25 | 28 | 19 |
| Bb | 27 | - | 29 | - | 29 | - | 9 | - | 9 | - | 9 | - | 24 | 19 | 12 |
| Bs | 14 | 4 | 13 | 5 | 15 | 3 | 9 | - | 11 | - | 10 | - | - | - | - |
| lt | - | 244 | - | 200 | - | 171 | - | - | - | ||||||
| lb | 170 | - | 221 | - | 148 | - | 174 | - | 135 | - | 134 | - | 118 | 115 | 172 |
| ls | 45 | 169 | 4 | 208 | 68 | 175 | 200 | 188 | 178 | 197 | 174 | 170 | - | - | - |
| st | - | 20 | - | 38 | - | 19 | 17 | 21 | 22 | 24 | 18 | 23 | 18 | 18 | 22 |
| sb | 25 | - | 18 | - | 25 | - | 20 | - | 25 | - | 21 | - | 21 | 19 | 26 |
| ss | 11 | 24 | 13 | 20 | 19 | 20 | 22 | - | 23 | - | 18 | - | - | - | - |
Publisher’s Note: MDPI stays neutral with regard to jurisdictional claims in published maps and institutional affiliations. |
© 2020 by the authors. Licensee MDPI, Basel, Switzerland. This article is an open access article distributed under the terms and conditions of the Creative Commons Attribution (CC BY) license (http://creativecommons.org/licenses/by/4.0/).
Share and Cite
Yu, H.; Xu, F.; Zhang, M.; Zhou, A. Experimental Investigation on Glaze Ice Accretion and Its Influence on Aerodynamic Characteristics of Pipeline Suspension Bridges. Appl. Sci. 2020, 10, 7167. https://doi.org/10.3390/app10207167
Yu H, Xu F, Zhang M, Zhou A. Experimental Investigation on Glaze Ice Accretion and Its Influence on Aerodynamic Characteristics of Pipeline Suspension Bridges. Applied Sciences. 2020; 10(20):7167. https://doi.org/10.3390/app10207167
Chicago/Turabian StyleYu, Haiyan, Fuyou Xu, Mingjie Zhang, and Aoqiu Zhou. 2020. "Experimental Investigation on Glaze Ice Accretion and Its Influence on Aerodynamic Characteristics of Pipeline Suspension Bridges" Applied Sciences 10, no. 20: 7167. https://doi.org/10.3390/app10207167
APA StyleYu, H., Xu, F., Zhang, M., & Zhou, A. (2020). Experimental Investigation on Glaze Ice Accretion and Its Influence on Aerodynamic Characteristics of Pipeline Suspension Bridges. Applied Sciences, 10(20), 7167. https://doi.org/10.3390/app10207167


