Abstract
Moisture strongly affects the quality and mechanical specificity of carbon fiber reinforced plastic (CFRP) when using lubrication fluids during machining, and the significant impact of the cutting tool geometry and cryogenic gas cooling on CFRP machining capabilities are observed. The main body of this paper aims at making decisions about the optimum parameter of the drilling process while machining on CFRP base on the grey relational coefficient embed to the technique for order of preference by similarity to an ideal solution (Grey-TOPSIS). The entropy method was used to determine the weight of decision-making for handling a multiple measure decision-making response. The twist angle of the tool drill, lubrication, and feed rate were used as the input variables, and were analyzed while taking into account several multi-response outputs, such as the surface roughness, uncut fiber, and delamination. The result showed that a feed rate of 228 mm/min, the high-helix twist angle, and cryogenic CO2 lubrication leads the calculated value to close the relative value, which minimizes the value of the surface roughness, the uncut fiber, and the delamination. Finally, verification of the valid effect of each parameter process was conducted using analysis of variance. The results indicated that the lubrication was the highest remarkable criterion on the uncut fiber, the delamination, and the surface roughness. By integrating the advantage of grey systems theory, and the technique for order preference by similarity to an ideal solution, to evaluate and optimize the machining parameter, the results indicate that the proposed model is useful to facilitate the multi-criteria decision-making problem under the environment of uncertainty and vagueness. This relatively advanced approach is very effectual in rejecting process variation and a great assistive strategy than other multi-criteria decision-making approaches.
1. Introduction
In the aerospace and vehicle transport industries, the carbon fiber reinforced polymers are being increasingly researched and more widely developed in many applications due to their strength, hardness, and high fatigue resistance [1]. Carbon fiber reinforced plastic (CFRP) drilling machining technology has been widely developed, and includes methods such as the traditional drilling technique, the fiber laser drilling technique [2], and the abrasive water-jet drilling technique [3]. The traditional drilling method is simple, saves money, and achieves a certain efficiency. The input factors that affect product quality, as well as ensure the output evaluation criteria of the processing process, were invested and studied. In addition to the accuracy of the bore diameter tolerances and the surface roughness of the hole, the peripheral geometry, such as uncut fiber and the delamination, was also emphasized. The influence of the drill geometry under the action of thrust force causes the delamination to indicate that the thrust force is distributed toward the boundary of the drill in place of being located at the centerline. The feed rate can also be increased without affecting on the delamination [4]. The use of a multi-facet drill can help to release the delamination and improve the quality of the surface [5]. Soaked experiments with different machining fluids, such as Hocut 795B, Hocut GR3000, Cindolube V30ML, and Metalina B800 were used at a temperature of 60 °C. The adhesive strength and beam shear test were applied to verify the mechanical debasement of the sample. The lowest prejudicial effect on the mechanical properties and non-hygroscopic properties of the specimen test were found when used with Cindolube V30ML [6]. The fracture toughness of a concrete/CFRP bonded test was reduced to 62.8% after exposed to water at 23 °C and 50 °C for 8 weeks [7]. The load deflection relationship of CFRP-bond wood test is decreased from 57.53 kN to 33.15 kN when the time of humidity exposure of the sample is increased from 0 to 8 weeks [8]. The benefit of cryogenic combined minimum lubrication is that it has the ability to ameliorate the tool life, and the surface roughness, compared with the regular coolant method. The experiment was observed at a cutting speed of 100 m/min [9,10]. From the above, in this study, the new characteristic concept of the tool drill geometry is the twist angle of the cutting edge, namely, the twist angle of the drill blade on the quality of the drill hole, which was chosen as the survey input factor. At the same time, cryogenic CO2 is also investigated as another input parameter of the drilling process.
With the advanced quality machining, studies about CFRP machining have studied the parameter process, and improvement by compounding hybrid material. With the aim of achieving quality parameters for the tool wear, thrust force, and torque, the Nelder–Mead and genetic algorithm were applied to optimize the input parameters of the coir fiber-reinforced composites drilling process, such as drill diameter, spindle speed, and feed rate [11]. A full factorial experiments design was applied to quantify the geometrical parameters of the drill tool, such as helicoidal, brad center, step, and reamer. The use of the response surface methodology generates the optimum response output of the torque, the delamination, and the thrust force [12]. The combination of the multi-response optimization method with principal component analysis (PCA), and the Taguchi base on fuzzy inference system (FIS), has been proposed to evaluate the suitable parameter settings in direction of the optimization of the delamination, thrust force, and torque factor in the CFRP drilling process [13]. Recently, many handling techniques, such as Response Surface Methodology [14], the Genetic Algorithm [14], Particle Swarm Optimization (PSO) [15,16,17,18], and Neural Networks [15,19,20] have developed to optimize machining parameters that are time consuming and require a coding system to resolve multi-criteria decision-making (MCDM) problems.
Grey relational analysis (GRA) was conducted to optimize the multi-input factors for performing the best response of output factors [21,22,23]. GRA is a section in the grey system first deduced [24,25], which is an advantageous technique to deal with poor-quality, deficient, and dim data [26] that is nominated for grey data. The GRA was further improved with the extension of fuzzy logic theory into the system with more quantities of variables to achieve a more advantageous response output [27,28,29]. The technique for order of preference by similarity to an ideal solution (TOPSIS) method is a simple and efficient way to solve processes using MCDM [30,31]. In general, it is not easy to produce the ultimate solution to a problem in real-time. Thus, TOPSIS method is available with two different classes of the ultimate decision based on the strongest or weakest response of the option correlated with various measures. The classify-based approach [32] is studied to choose the strongest and weakest response, as short as possible, from and to the ultimate decision. The TOPSIS method expects the probable input data for resolving multiple criteria problems. The weight ratio determination helps to give exact correlated output responses in real-time problems [33,34]. The benefits of TOPSIS come from it being simple and understandable, and applying deftly computation techniques [35]. Previous studies usually only assessed the weight and percentage contribution of the input factors. However, the weight of the output factors plays a very important role in attribute group decision-making. Determining and measuring the weight of decision-making is an interesting study field. The goal of this study was to propose a novel approach to determine the optimal parameter of the CFRP drilling process, as shown in Figure 1, in which an extended TOPSIS technique, based on the grey coefficient with the contribution of the entropy weights, is presented.
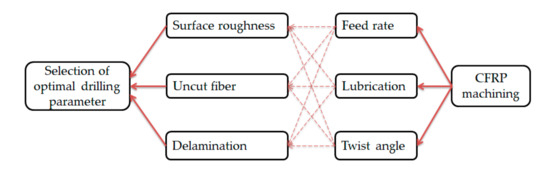
Figure 1.
Marking diagram of carbon fiber reinforced plastic (CFRP) drilling process parameter election.
The remaining part of this study was presented as follows: Section 2 gives the material and method. The design of the experiment included the selection of the material characteristic, the specification of the drilling tool, the design of the parameter process, and measurement process. The grey relational coefficient embed to the technique for order of preference by similarity to an ideal solution (Grey-TOPSIS) algorithm was also described. Then, the analysis and discussion was shown in Section 3. The proposed method of applying the data results from the experiment was performed and the optimal results are analyzed and discussed. In Section 4, a confirmation test was suggested to validate the benefits of the proposed method. Section 5 presents the conclusion.
2. Material and Method
2.1. Workpiece Details
A CFRP composite, with a size of 95 mm square and a thickness of 5 mm, was employed as workpiece material in this study. The workpiece was made by laminating prepreg many layers. The thickness of each layer is 0.18 mm. The orient fiber is 0 degrees and 90 degrees. The specification of the material was given in Table 1.

Table 1.
Specifications of the workpiece materials.
2.2. Drilling Tool
The drilling tool was proposed with three different twist angles, as shown in Table 2, and was made of a premium high-performance diamond-coated carbide, which was chosen such as a special tool material for CFRP machining. Its geometry is illustrated in Figure 2.
Table 2.
Specification of the tool.
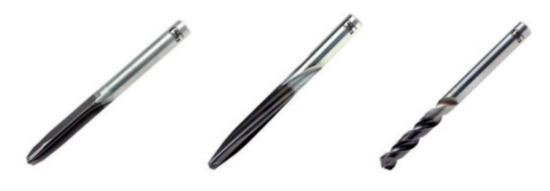
Figure 2.
The geometry of the tool.
2.3. Design of Experiment
The drilling process was performed on Litz Hitech TV-600 Tap and Drill computer numerical control (CNC) machine (Litz Hitech Corp., Taichung City, Taiwan) with a two line system consisting of air and cryogenic gas. The spray pressure system was adjusted by a regular valve and was observed by an airflow monitor. The injection nozzle was located 45 degrees vertical to the drilling tool. The tool diameter was three times bigger than the workpiece thickness. Thus, the drilling method was programed in the form of a counter-bore drilling cycle. Based on the reference standard of the cutting tool supplier, the spindle speed was set at 6100 rpm. Three levels of the feed rate were proposed at 228 mm/min, 589 mm/min, and 1006 mm/min, respectively. The three difference lubrication modes were set by cryogenic CO2, dry air, and no lubrication (dry mode) with the pressure set at 1.5 bar. The experimental system is illustrated in Figure 3.
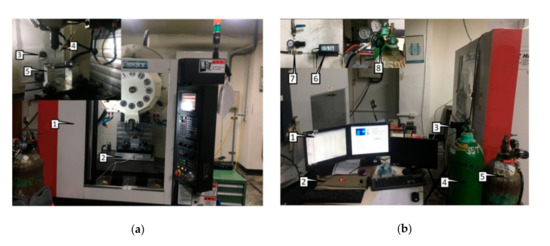
Figure 3.
The drilling process system (a) 1. Litz Hitech TV-600 Tap and Drill computer numerical control (CNC) machine; 2. Dynamometer; 3. Thermal camera; 4. Air nozzle; 5. Fixture; (b) 1. Computer; 2. Data Acquisition Device (DAQ); 3. Camera; 4–5. Cryogenic Gas; 6. Air flow meter; 7. Air regulator; 8. Gas regulator.
The cutting parameters were designed using the orthogonal array method with three different levels for each parameter. The details are presented in Table 3.
Table 3.
Parameter of drilling process.
The surface roughness (Ra), the uncut fiber (Uc), and the delamination (DL) were used to evaluate the quality of the hole. Measuring equipment (VK-X200, Keyence, Osaka, Japan) was used to verify the surface roughness. Microscope equipment (MF-A2017D, Mitutoyo, Sakado, Japan) was used to measure the uncut fiber and the delamination of the hole [36]. The uncut fiber area and the delamination are shown in Figure 4.
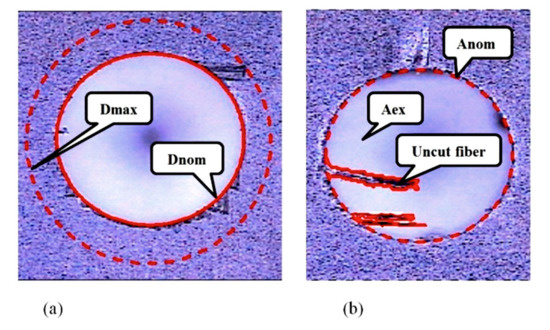
Figure 4.
(a) The delamination and (b) the uncut fiber area.
The delamination is computed from the ratio of Dmax with Dnom of the hole by Equation (1).
where Dmax is calculated by double distance from the center of the nominal hole to the furthest point extension, the nominal diameter (Dnom), and the tool diameter are similar.
The uncut fiber area was computed from the section of the fiber that has not been cut by Equation (2).
where Anom is the circle area with the diameter of the tool drill. Aex is the area of the surface without areas of uncut fiber.
2.4. Grey Relational Analysis (GRA)
GRA [24] is one of the progressive methods for optimizing process parameters, especially when dealing with ambiguous input parameters. It is used to alter responses from multiple targets to single targets using fuzzy social surveys. The dark test, which is based on the unpredictability of the tests, is shaped into an evaluation method to solve obvious structural problems that are jamming with fragmented information. This dark inspection arrangement is divided into two parts. The relative data that are entirely known are contained in the white frame, and the relatively obscured data are contained in the black frame.
The quality response targets of the drilling process were the surface roughness, the uncut fiber, and the delamination. The machining parameters, such as cryogenic lubrication, feed rate, and twist angle were used to analyze to minimize the effects of response on bore quality. The grey analysis was grouped into two phases regarding the accompanying progress recorded below. The fundamental ability of GRA standardization for test values in the range 0 to 1 is known as grey relational information.
The surface roughness, uncut fiber, delamination responses were considered “lower is better”. The normalized value could be expressed as follows:
where i = 1, …, m. m is the number of experimental data items. a = 1, …, n. n is the number of parameters. denote the original sequence, is the sequence after the data pre-processing. is the largest value of , is the smallest value of .
The grey relational coefficient (GRC) was estimated for Ra, Uc, DL as follows:
with
where and denote the reference sequence and the comparability sequence, respectively. Δ0i is the deviation sequence of the and . ξ is the distinguishing coefficient, ξ Є [0, 1]. Normally, ξ is general set at 0.5.
The grey relational grade (GRG) was calculated by averaging the corresponding GRCs.
However, in a real engineering system, the importance of various factors to the system varies. In the real condition of unequal weight being carried by the various factors, the grey relational grade in Equation (8) was extended and defined as:
where wa is norm weight of factor a. Given and with same weights, Equations (8) and (9) are equal [37,38].
2.5. TOPSIS Methods
The classification diagram of the TOPSIS method was given in Figure 5.
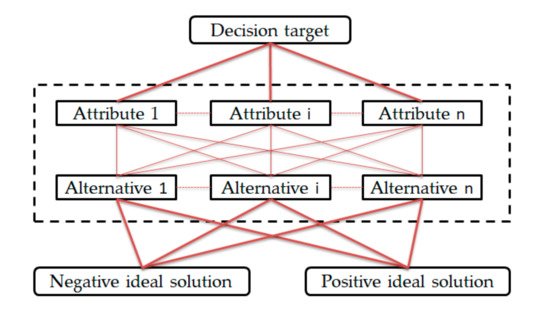
Figure 5.
The classify diagram of the technique for order of preference by similarity to an ideal solution (TOPSIS) method.
For a multi-attribute decision-making (MADM) issue, theorize each alternative is measured with particular to the n attributes, whose values institute a decision matrix [32].
The technique for order of preference by similarity to an ideal process was shown as follows [32]:
- Step 1:
- present the decision matrix.
In general, the attribute consists of benefits attribute and cost attribute. In order to meet all characteristics in dimensionless units and allow for easier comparisons between each inter-attribute, the following formulas are used to normalize each attribute value xuv in decision matrix X = (xuv)mxn into a correlate factor guv in a normalized decision matrix given by:
where
and
- Step 2:
- compute the weighted normalized decision matrix.
The entropy method is one of the advanced methods used to determine uncertain information formulated using probability theory [39]. To determine the entropy weights, the entropy value, denoted as Ev, is first computed according to the following equations:
where
Therefore, the degree of deviation (dv) of the mean native information given by the correlates, with assignment ratings on point of reference pv can be defined as:
The value of dv deputize the natural contrast intensity of pv, and the entropy weight of vth is:
The weighted normalized decision matrix is given as
- Step 3:
- compute the positive and negative ideal solutions.
The positive ideal solution and negative ideal solution are computed as follows:
- Step 4:
- compute the distance from positive ideal solution (PIS) and negative ideal position (NIS) based on the Euclidean distance.
The division of each alternative forms the PIS as follows
The division of each alternative forms the NIS as follows
where and denote the distances of the uth alternative from PIS and NIS.
- Step 5:
- compute the nearness coefficient to the ideal solutions.
The nearness coefficient of the uth alternative Du with correlation to the ideal solution is given as
- Step 6:
- the ranking order and evaluation.
The selection of alternatives can be classified by priority according to the descending order of . A larger is a better choice.
2.6. Grey–TOPSIS Study
The combination of multiple multi-criteria optimization methods help to simplify data processing, time-saving, providing decision-makers with a more efficient way to choose the right criteria. The decision-making model is developed to determine the laser beam micro-marking parameter and the performance criteria, and the fuzzy TOPSIS is studied for selecting the best parametric combination [40]. To evaluate the performance of three different drill bit types (High-speed steel (HSS), Titanium Aluminum Nitride (TiAlN), and Titanium Nitride (TiN)), the machining parameters, such as cutting speed and feed rate, are optimized with multiple performance characteristics as surface roughness, circularity, and cylindricity using the multi-objective Taguchi technique and TOPSIS [41]. The TOPSIS and Analytic Hierarchy Process (TOPSIS–AHP) hybrid MCDM approach has simpler calculations than the other traditional optimization methods, and reduces computational efforts. Therefore, this optimization method can be applied to different conflicting responses in machining situations [42]. In this study, the hybrid method was used to substitute the GRC into the TOPSIS process to evaluate the distances between the data chain. The computational process is presented in Figure 6.
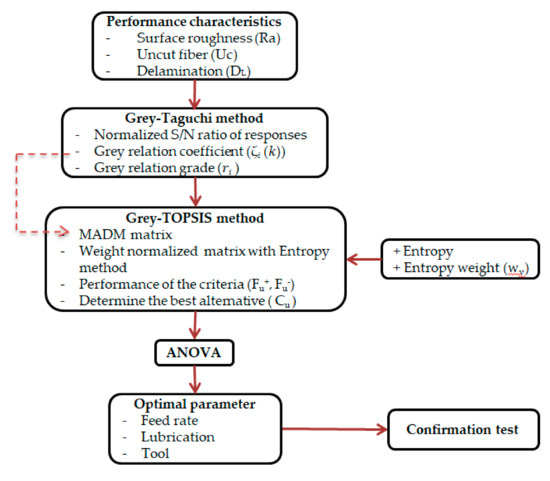
Figure 6.
Flow diagram of the optimization and evaluation.
The TOPSIS method is used to solve problems that require the concurrent optimization of a particular part or feature. It separates the output responses into beneficial attribute and cost attribute. The maximized beneficial attribute and minimized cost attribute effectuate the best solution. TOPSIS solves out the positive best alternative and negative best alternative, which are used as references for the optimal solution. The positive best alternative has the efficiency of maximizing the beneficial attribute and minimizing the cost attribute. In the same way, the negative best alternative derogates the beneficial attribute and increases the cost attribute. All of the potential alternatives are assimilated with the positive best alternative and negative best alternative to figure out the alternative that is nearest to the positive best and furthest from negative best. The greatest alternative has the closest range from positive best alternative and the furthest range from negative best alternative. In this case, the surface roughness, uncut fiber, and delamination attributes were all considered beneficial attributes, in which the smallest values were desired.
3. Analysis and Discussion
The GRA is conditioned by the data results, which was inducted out following the previous step. First, based on the target of the response output, in this study, normalization was presented according to the “smaller is better” approach. Second, divergence from the relation list was computed. Next, the GRC of each experiment were computed. Finally, the mean value of the GRG for the surface roughness, uncut fiber, and delamination were computed using Equations (3)–(9). The result is illustrated in Table 4.
Table 4.
Experiment measurement and grey relational analysis (GRA) result.
The GRG with highest value was always yearned. It was presented that the drilling parameter of the 25th experiment had the highest, with a grey relation grade of 0.923, as shown in Table 4 and illustrated in Figure 7. Thus, the 25th experiment had the best multi-response output among the 27 experiments.
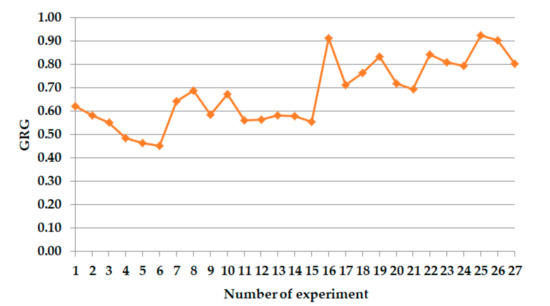
Figure 7.
The grey relational grade (GRG) of the experiments.
The GRG was used to express the rank of a correlation between the consultation series and the referenced series. With the larger GRG, it means that the comparability series are significantly correlated with the consultation series. The signal to noise (S/N) ratio analysis is used to specify the optimal drilling parameter constraints for each attribute L, T, F, respectively. As the response value for S/N ratios of GRG in Figure 8, the optimal combination of the drilling parameter was observed at L3T3F1. Table 5 shows the response table for the means, which specify the delta value of the drilling process parameter.
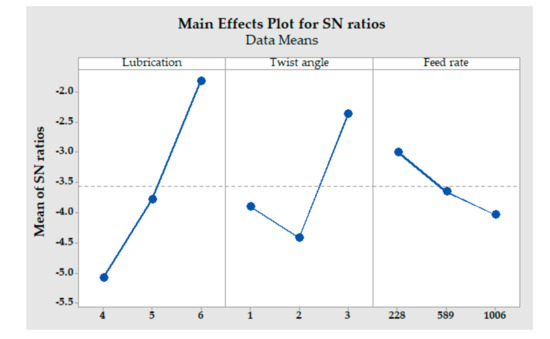
Figure 8.
Main effects plot for the signal to noise (S/N) ratios.
Table 5.
Main response table of the grey relational grade (GRG).
The quality of the drill process was observed at the feed rate of 228 mm/min, high helix twist angle, and cryogenic gas lubrication, respectively.
The first step of the TOPSIS method used in this study was to sort the attributes and alternatives as the input parameters and response output of the experiment, which is transformed into the grey relation coefficient by the GRA process, placed to the decision matrix X. Equations (10) and (11) were used to normalize the decision matrix X with matrix G. The benefit attribute and cost attribute have a relationship that is computed by Equation (13). The value of the two attributes is inversely proportional. When the value of the benefit attribute is increased, the value of the cost attribute is decreased. Moreover, the amount of change is the same. Therefore, the benefit attribute was chosen for analysis. In this paper, the entropy method was applied to specify the attribute weight using Equations (14)–(17), respectively. The results are given in Table 6. Matrix Y was computed by Equation (18) with attribute weight .
Table 6.
Decision matrix [X], [G], [Y].
In the next step, the positive and negative ideal solutions were computed using Equations (19) and (20). The closest alternative range from PIS and the furthest alternative range from NIS were observed by Equations (21) and (22). The nearest coefficient is computed using Equation (23). The final step was the selection of alternatives according to the value of , in which the largest was the best choice. The resulting values are presented in Table 7.
Table 7.
Nearness coefficient values and alternative ranking.
According to the 27 experiments described above, the 25th experiment showed the highest closeness coefficient, indicating that it was nearest to the ideal value. The optimal parameter was determined to be (L3T3F1). Even so, the Taguchi technique was applied to great value, to find an even more profitable experimental parameter that could locate areas outside the range of the experiment domain. The result is shown in Table 8.
Table 8.
Main response table of correlation to the ideal solution (Cu).
The S/N ratio data and raw data provided the same optimal level by drawing the main effects plot. The result is illustrated in Figure 9.
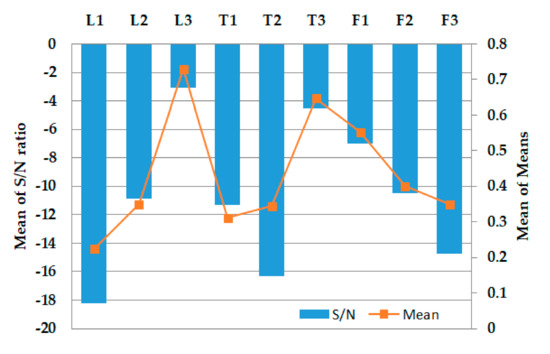
Figure 9.
The main effect plot for Mean and S/N ratios.
Analysis of variance (ANOVA) was applied to verify the essential level of the parameter input influencing the multi–response output of the CFRP drilling process. The referred confidence and significance level were 0.95 and 0.05, respectively.
As shown in Table 9, the lubrication, twist angle, and feed rate were remarkable factors, and the interaction of the lubrication and twist angle also had significant value. The lubrication had the highest contribution ratio at 52.88%. Therefore, the cryogenic gas had the most significant impact on the quality of the drilling hole based on the preferred criterion output. The contribution ratio of the twist angle and feed rate was at 26.10% and 8.43%, respectively. R squared was observed at 96.88%, which means this linear regression model was suitable for the data set at 96.88%.
| S | R_sq | R_sq(adj) | PRESS | R_sq(pred) |
| 0.0959580 | 96.88% | 89.87% | 0.839074 | 64.51% |
Table 9.
Analysis of variance (ANOVA) result.
4. Evaluation Test
After validating the best level of the drilling process parameter, a verification test was proposed to authenticate the quality increase of the response output. The predicted optimal value was computed using Equation (24).
where
ηtm is the total mean value of response, ηi is the mean of the response at the best level, and it is the number of parameter inputs. In this case study, it was equal to 3.
In Table 10, the initial parameters from tool supplier were a feed rate of 589 mm/min, a high helix twist angle, and normal conditions (dry mode). The optimal parameters, which were computed by GRA and Grey-TOPSIS, had carried out the same value with a feed rate of 228 mm/min, a high helix twist angle, and cryogenic lubrication (CO2 gas). However, the analyzed result showed that the evaluation coefficient according to the Grey-TOPSIS method had greater improvement than that found using GRA method. It was clear that the quality response of the CFRP drilling process is improved using this proposed method.
Table 10.
Initial, predicted, and compared evaluation test.
5. Conclusions
With a particular aspect of the CFRP composites machining technology, the lubrication and tool geometry were investigated in many studies. Based on the experimental and processing data, the lubrication cryogenic gas was the most remarkable attribute when observing quality criteria, such as the surface roughness, the uncut fiber, and the delamination caused during the drilling process.
In this study, the TOPSIS optimization technique based on the GRC was proposed to validate the optimal parameter process. The closest coefficient value was used to specify the greatest parameters to achieve minimized surface roughness, uncut fiber, and delamination of the drilling hole. The optimal result was detected by L3T3F1 (cryogenic CO2 lubrication, a high helix twist angle, feed rate of 228 mm/min) to obtain the greatest response, and a minimized surface roughness of 14.9567 μm, no uncut fiber, and a delamination of 1.02 mm2. ANOVA was used to confirm the distribution impact of the input parameters of the drilling process. The contributions of the lubrication, twist angle, and feed rate were 52.88%, 26.1%, and 8.43%, respectively. The analyzed results could be used to achieve the desired response quality under practical parameters in the drilling process.
The results indicate that the proposed model is useful to facilitate the MCDM problem under an environment of uncertainty and vagueness. This relatively advanced approach is very effectual in rejecting process variation, and is a great assistive strategy compared to other MCDM approaches. Each response has been weighted and diminishes the versatility of the process of decision-making (DM).
The productiveness of the method could reach further capacity, and could be applied with a large quantity of multi-criteria inputs and response outputs. The experimental method could be enlarged to other drilling parameter processes and evaluations. Furthermore, this optimization method could be meaningfully and beneficially applied to other machining technologies.
Author Contributions
Conceptualization, Q.-P.T. and S.-C.H.; methodology, Q.-P.T. and S.-C.H.; software, Q.-P.T., V.-N.N.; validation, Q.-P.T. and S.-C.H.; formal analysis, S.-C.H.; investigation, Q.-P.T.; data curation, Q.-P.T., V.-N.N.; writing—original draft preparation, Q.-P.T., V.-N.N.; writing—review and editing, Q.-P.T. and S.-C.H.; supervision, S.-C.H. All authors have read and agreed to the published version of the manuscript.
Funding
This research was funded by the Ministry of Science and Technology of the Republic of China MOST 109-2622-E-992-008-CC3.
Conflicts of Interest
The authors declare no conflict of interest.
References
- Liu, D.; Tang, Y.; Cong, W.L. A review of mechanical drilling for composite laminates. Composite Structures 2012, 94, 1265–1279. [Google Scholar] [CrossRef]
- Li, X.; Hou, W.; Han, B.; Xu, L.; Li, Z.; Nan, P.; Ni, X. Investigation on the Continuous Wave Mode and the ms Pulse Mode Fiber Laser Drilling Mechanisms of the Carbon Fiber Reinforced Composite. Polymers 2020, 12, 706. [Google Scholar] [CrossRef]
- Ruiz-Garcia, R.; Mayuet Ares, P.F.; Vazquez-Martinez, J.M.; Salguero Gomez, J. Influence of Abrasive Waterjet Parameters on the Cutting and Drilling of CFRP/UNS A97075 and UNS A97075/CFRP Stacks. Materials 2018, 12, 107. [Google Scholar] [CrossRef]
- Hocheng, H.; Tsao, C.C. Effects of special drill bits on drilling-induced delamination of composite materials. Int. J. Mach. Tools Manuf. 2006, 46, 1403–1416. [Google Scholar] [CrossRef]
- Wei, Y.; An, Q.; Ming, W.; Chen, M. Effect of drilling parameters and tool geometry on drilling performance in drilling carbon fiber–reinforced plastic/titanium alloy stacks. Adv. Mech. Eng. 2016, 8. [Google Scholar] [CrossRef]
- Turner, J.; Scaife, R.J.; El-Dessouky, H.M. Effect of machining coolant on integrity of CFRP composites. Adv. Manuf. Polym. Compos. Sci. 2015, 1, 54–60. [Google Scholar] [CrossRef]
- Au, C.; Büyüköztürk, O. Peel and shear fracture characterization of debonding in FRP plated concrete affected by moisture. J. Compos. Constr. 2006, 10, 35–47. [Google Scholar] [CrossRef]
- Zhou, A.; Tam, L.-h.; Yu, Z.; Lau, D. Effect of moisture on the mechanical properties of CFRP–wood composite: An experimental and atomistic investigation. Compos. B: Eng. 2015, 71, 63–73. [Google Scholar] [CrossRef]
- Tapoglou, N.; Lopez, M.I.A.; Cook, I.; Taylor, C.M. Investigation of the Influence of CO2 Cryogenic Coolant Application on Tool Wear. Procedia CIRP 2017, 63, 745–749. [Google Scholar] [CrossRef]
- Basmaci, G.; Yoruk, A.; Koklu, U.; Morkavuk, S. Impact of Cryogenic Condition and Drill Diameter on Drilling Performance of CFRP. Appl. Sci. 2017, 7, 667. [Google Scholar] [CrossRef]
- Jayabal, S.; Natarajan, U. Optimization of thrust force, torque, and tool wear in drilling of coir fiber-reinforced composites using Nelder–Mead and genetic algorithm methods. Int. J. Adv. Manuf. Technol. 2010, 51, 371–381. [Google Scholar] [CrossRef]
- Feito, N.; Muñoz-Sánchez, A.; Díaz-Álvarez, A.; Miguelez, M.H. Multi-objective optimization analysis of cutting parameters when drilling composite materials with special geometry drills. Compos. Struct. 2019, 225, 111187. [Google Scholar] [CrossRef]
- Abhishek, K.; Datta, S.; Mahapatra, S.S. Optimization of thrust, torque, entry, and exist delamination factor during drilling of CFRP composites. Int. J. Adv. Manuf. Technol. 2014, 76, 401–416. [Google Scholar] [CrossRef]
- Kilickap, E.; Huseyinoglu, M. Selection of Optimum Drilling Parameters on Burr Height Using Response Surface Methodology and Genetic Algorithm in Drilling of AISI 304 Stainless Steel. Mater. Manuf. Process. 2010, 25, 1068–1076. [Google Scholar] [CrossRef]
- Ciurana, J.; Arias, G.; Ozel, T. Neural Network Modeling and Particle Swarm Optimization (PSO) of Process Parameters in Pulsed Laser Micromachining of Hardened AISI H13 Steel. Mater. Manuf. Process. 2009, 24, 358–368. [Google Scholar] [CrossRef]
- Pawar, P.J.; Rao, R.V.; Davim, J.P. Multiobjective Optimization of Grinding Process Parameters Using Particle Swarm Optimization Algorithm. Mater. Manuf. Process. 2010, 25, 424–431. [Google Scholar] [CrossRef]
- Ulutan, D.; Özel, T. Multiobjective Optimization of Experimental and Simulated Residual Stresses in Turning of Nickel-Alloy IN100. Mater. Manuf. Process. 2013, 28, 835–841. [Google Scholar] [CrossRef]
- Vázquez, E.; Ciurana, J.; Rodríguez, C.A.; Thepsonthi, T.; Özel, T. Swarm Intelligent Selection and Optimization of Machining System Parameters for Microchannel Fabrication in Medical Devices. Mater. Manuf. Process. 2011, 26, 403–414. [Google Scholar] [CrossRef]
- Yenigun, B.; Kilickap, E. Prediction of the Tensile Load of Drilled CFRP by Artificial Neural Network. Appl. Sci. 2018, 8, 549. [Google Scholar] [CrossRef]
- Teti, R.; Segreto, T.; Caggiano, A.; Nele, L. Smart Multi-Sensor Monitoring in Drilling of CFRP/CFRP Composite Material Stacks for Aerospace Assembly Applications. Appl. Sci. 2020, 10, 758. [Google Scholar] [CrossRef]
- Haq, A.N.; Marimuthu, P.; Jeyapaul, R. Multi response optimization of machining parameters of drilling Al/SiC metal matrix composite using grey relational analysis in the Taguchi method. Int. J. Adv. Manuf. Technol. 2007, 37, 250–255. [Google Scholar] [CrossRef]
- Kurt, M.; Bagci, E.; Kaynak, Y. Application of Taguchi methods in the optimization of cutting parameters for surface finish and hole diameter accuracy in dry drilling processes. Int. J. Adv. Manuf. Technol. 2008, 40, 458–469. [Google Scholar] [CrossRef]
- Tosun, N. Determination of optimum parameters for multi-performance characteristics in drilling by using grey relational analysis. Int. J. Adv. Manuf. Technol. 2005, 28, 450–455. [Google Scholar] [CrossRef]
- Julong, D. Introduction to grey system theory. J. Grey Syst. 1989, 1, 1–24. [Google Scholar]
- Ju-Long, D. Control problems of grey systems. Syst. Control lett. 1982, 1, 288–294. [Google Scholar] [CrossRef]
- Asokan, P.; Ravi Kumar, R.; Jeyapaul, R.; Santhi, M. Development of multi-objective optimization models for electrochemical machining process. Int. J. Adv. Manuf. Technol. 2007, 39, 55–63. [Google Scholar] [CrossRef]
- Krishnamoorthy, A.; Rajendra Boopathy, S.; Palanikumar, K.; Paulo Davim, J. Application of grey fuzzy logic for the optimization of drilling parameters for CFRP composites with multiple performance characteristics. Measurement 2012, 45, 1286–1296. [Google Scholar] [CrossRef]
- Kumar, V.; Das, P.P.; Chakraborty, S. Grey-fuzzy method-based parametric analysis of abrasive water jet machining on GFRP composites. Sādhanā 2020, 45. [Google Scholar] [CrossRef]
- Rajmohan, T.; Palanikumar, K.; Prakash, S. Grey-fuzzy algorithm to optimise machining parameters in drilling of hybrid metal matrix composites. Compos. B Eng. 2013, 50, 297–308. [Google Scholar] [CrossRef]
- Guo, S.; Zhao, H. Optimal site selection of electric vehicle charging station by using fuzzy TOPSIS based on sustainability perspective. Appl. Energy 2015, 158, 390–402. [Google Scholar] [CrossRef]
- Hussein, Y.S.; Ali, B.M.; Rasid, M.F.A.; Sali, A.; Mansoor, A.M. A novel cell-selection optimization handover for long-term evolution (LTE) macrocellusing fuzzy TOPSIS. Comput. Commun. 2016, 73, 22–33. [Google Scholar] [CrossRef]
- Hwang, C.-L.; Yoon, K. Methods for Multiple Attribute Decision Making; Springer: Berlin/Heidelberg, Germany, 1981; pp. 58–191. [Google Scholar]
- Olson, D.L. Comparison of weights in TOPSIS models. Math. Comput. Model. 2004, 40, 721–727. [Google Scholar] [CrossRef]
- Figueira, J.; Roy, B. Determining the weights of criteria in the ELECTRE type methods with a revised Simos’ procedure. Eur. J. Oper. Res. 2002, 139, 317–326. [Google Scholar] [CrossRef]
- Temuçin, T.; Tozan, H.; Vayvay, Ö.; Harničárová, M.; Valíček, J. A fuzzy based decision model for nontraditional machining process selection. Int. J. Adv. Manuf. Technol. 2013, 70, 2275–2282. [Google Scholar] [CrossRef]
- Tran, Q.-P.; Tsai, M.-C.; Hsiao, T.-C.; Huang, S.-C. Experimental influence of twist angle and cryogenic gas on quality of drilled hole in carbon fiber reinforced plastic composites. Meas. Control 2020, 53, 943–953. [Google Scholar] [CrossRef]
- Ho, C.-Y.; Lin, Z.-C. Analysis and application of grey relation and ANOVA in chemical–mechanical polishing process parameters. Int. J. Adv. Manuf. Technol. 2003, 21, 10–14. [Google Scholar] [CrossRef]
- Lo, S.-P. The application of an ANFIS and grey system method in turning tool-failure detection. Int. J. Adv. Manuf. Technol. 2002, 19, 564–572. [Google Scholar] [CrossRef]
- Zardari, N.H.; Ahmed, K.; Shirazi, S.M.; Yusop, Z.B. Weighting Methods and Their Effects on Multi-Criteria Decision Making Model Outcomes in Water Resources Management; Springer International Publishing: Cham, Switzerland, 2015. [Google Scholar]
- Shivakoti, I.; Pradhan, B.B.; Diyaley, S.; Ghadai, R.K.; Kalita, K. Fuzzy TOPSIS-Based Selection of Laser Beam Micro-marking Process Parameters. Arab. J. Sci. Eng. 2017, 42, 4825–4831. [Google Scholar] [CrossRef]
- Shunmugesh, K.; Panneerselvam, K. Optimization of machining process parameters in drilling of CFRP using multi-objective taguchi technique, TOPSIS and RSA techniques. Polym. Polym. Compos. 2017, 25, 185–192. [Google Scholar] [CrossRef]
- Kumar, J.; Verma, R. Experimental investigations and multiple criteria optimization during milling of Graphene Oxide (GO) doped epoxy/CFRP composites using TOPSIS-AHP hybrid module. FME Trans. 2020, 48, 628–635. [Google Scholar] [CrossRef]


Publisher’s Note: MDPI stays neutral with regard to jurisdictional claims in published maps and institutional affiliations. |
© 2020 by the authors. Licensee MDPI, Basel, Switzerland. This article is an open access article distributed under the terms and conditions of the Creative Commons Attribution (CC BY) license (http://creativecommons.org/licenses/by/4.0/).