Abstract
A model to forecast the underground temperature in a mine ventilation circuit was developed on the basis of a case study and actual data describing temperature, airflow, and drift length collected over several years. A mathematical model featuring seven variables with interactions provided reliable predicted temperatures, achieving a correlation of R2 = 0.933 with an estimation error of ±2 °C. Its soundness was proven using both the node-to-node analysis and the multi-node approach. The multi-node approach was shown to be an interesting option to model underground mining environments. This model can be very useful to predict the temperature evolution along the main ventilation system, determine the best workplace conditions in terms of temperature, and analyze different planning scenarios of the mine. Moreover, some recommendations are presented for obtaining reliable data when using temperature sensors and the model in a U-shaped ventilation system.
1. Introduction
The environmental conditions in an underground mine are crucial in terms of efficiency and health and safety conditions [1,2]. Furthermore, these factors have to be taken into account for mine planning due to the restrictions imposed by proper ventilation conditions. This becomes increasingly relevant as shallow deposits run out and mineral resources are extracted at greater depth, and as mines increase in size with more infrastructure, with an intensification in the use of mining equipment [3,4] and human resources [5]. This creates a situation where the potential effects must be defined [6], with a need to determine the best possible conditions related to performance in the workplace [7,8,9,10].
One of the most important variables regarding environmental conditions in an underground mine is temperature [11,12,13]. It not only affects the concentration levels of the workers [14], but also creates unsafe conditions [15,16]. Currently, there is an increasing interest in the characteristics of underground spaces [17], with previous studies creating a model to predict the temperature at the bottoms of shafts in metal mines [18], simulating the temperature at the working face of a coal mine [19], and determining the main parameters of heat from the intrinsic properties of the deposit [20]. In this regard, airflow is crucial to maintain adequate temperatures in the workplace, ensuring its supply during the whole lifespan of the mine and any future changes in the ventilation circuit [21].
There were even some studies focusing on potash mining [3] or applying cooling systems [22,23,24]. However, it is necessary to not only identify the current conditions in terms of temperature, but also to predict the future conditions in order to plan the necessary actions. Some recent studies focused on obtaining an equation to determine temperature at working faces [25], or determine the most efficient airflow velocity for thermal comfort in underground mines [18]; however, there is still a lack of knowledge pertaining to other types of mining activities with regard to identifying the temperature in the main ventilation system, as well as developing a system able to test different possible scenarios in the future development of the mine.
Knowledge of the temperature in the drifts is crucial to understanding the future conditions of the workplace and working faces and, therefore, correctly planning the airflow required over time [26], and improving the main ventilation system. There are many factors that contribute to increasing the temperature; among them, some of the most important are equipment, autocompression, and geothermal gradient [27]. However, each mine has its own weaknesses and constraints, whether related to the deposit or otherwise.
Many modeling methods have been proposed to develop predictive models in the engineering field in recent years [28]. Multivariate regression analysis is one of the methods most commonly used [29,30], whereas other techniques such as artificial neural network and support vector regression are also implemented [31]. A mathematical model for underground coal mining was proposed by [32], while an initial model was also proposed for a deep gold mine [33]; however, they were validated with only a few temperature measurements. The intrinsic characteristics and high variability of the environmental conditions in an underground mine require the use of a large database recorded over a long period of time to validate any model proposed.
The aim of this research was to find a model able to predict temperature in the main ventilation system from a case study, which was also easy to implement in any mine and was versatile depending on the data available and requirements. Actual data collected from the main ventilation circuit over three and a half years were used.
2. Case Study
The research was based on an underground mine that extracts potash using an irregular room and pillar method, at a depth between 700 and 1000 m. The layout of the mine involves two main levels with a U-shaped ventilation circuit. The principal ventilation circuit is placed on the lower level, while the higher level contains the workings faces, with several splits of airflow from the level below, as well as the auxiliary ventilation system. The main ventilation system consists of a single exhausting fan. Extraction is achieved via three shifts lasting eight hours each, working continuously throughout the day.
The different exploitation panels include an extension of the lower level and, subsequently, an extension of the same panel above. Therefore, it is important to know, in advance, the temperature evolution along the principal circuit, to determine the environmental conditions at the entrance of the panel and to be able to analyze different scenarios.
3. Methods
3.1. Data Collection
Determination of the necessary data required to define the ventilation characteristics of the drifts in a mine was previously considered in a case study [27,34]. Seven control points representing the main ventilation system were established, from the entry to the end of the intake, collecting data every 3 min between January 2016 and June 2019. The following variables were collected:
- -
- Time of the measurement (date and hour);
- -
- Control point (X, Y, and Z coordinates);
- -
- Actual distance between control points (m);
- -
- Dry temperature (°C);
- -
- Wet temperature (°C);
- -
- Effective temperature (°C);
- -
- Airflow (m3/s).
Wet and dry temperatures are crucial to understanding the environmental conditions in an underground mine [35]; however, an analysis of the humidity evolution along the intake does not show appreciative changes. Therefore, the effective temperature, described by Spanish law (RGNBSM, ITC 04.7.02), was taken into account as a predictive variable, which includes wet and dry temperatures combined into a single value with a certain proportion, as shown in Equation (1).
where Tef is the effective temperature (°C), Tw is the wet temperature (°C), and Td is the dry temperature (°C).
3.2. Data Processing and Analysis
The equipment to record and collect data was calibrated regularly to avoid inaccurate measurements [36]. The effective temperature was transformed into daily average values, resulting in a total of 1155 daily records. Figure 1 shows the temperatures measured in each node, corresponding to the fixed control points representing the ventilation conditions of the intake. As can be seen in Figure 1, there was a higher dispersion in the initial nodes due to the influence of outside conditions, which were quite variable depending on the season of the year.
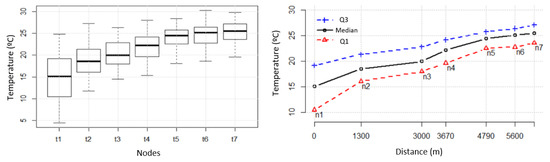
Figure 1.
Effective temperature measurements in each node (left) and as a function of distance (right).
According to Navarro et al. [37], variations in temperature in an underground mine are caused by several intrinsic and extrinsic characteristics, as shown in Equation (2).
where ΔTac represents autocompression (°C), ΔTrp represents thermal rock properties (°C), ΔTee represents heat emission from electrical equipment (°C), ΔTde represents heat emission from diesel equipment (°C), ΔThm represents human metabolism (°C), and ΔTw represents thermal water (°C).
The underground atmospheric temperature, at any location inside the mine, can be expressed as a function of the underground initial temperature, eliminating the autocompression factor from Equation (2), since the temperature at the bottom of the shaft is taken into account, thereby obtaining Equation (3).
where t2 is the underground atmospheric temperature (°C), and t1 is the underground initial temperature (°C).
The intake drifts from the case study had very steady conditions in terms of equipment usage, working force, and thermal rock properties, due to them being opened for a long time. It was also considered that the thermal water had no influence, due to the intrinsic characteristics of the type of mineral extracted in the case study. The physicochemical properties of the air conditions were not considered either. Therefore, the more developed form of Equation (3), with simplifications, can be written as Equation (4).
where ΔTintake depends on the dry and wet temperatures expressed as equivalent temperature (°C).
However, the airflow is not steady throughout the main ventilation circuit, with some leakages existing along the intake and/or return, especially in U-shaped circuits as considered in this study, as well as airflow splits to different extracting panels.
In this case, the cross-section did not have a substantial variation along the intake drift. Therefore, the heat contribution was similar along the intake drifts and the airflow was mainly reduced due to its distribution to the workplace. Distance was also very important to consider because of the interaction between the air and heat sources along the drifts. Equation (5) describes the factors influencing temperature variation along a drift.
where C is the airflow (m3/s), and D is the distance (m).
A mathematical model is a simplified representation of reality with predictive variables (x1, x2, …, xn) and target variables that need to be estimated [38]. The model presented herein was based on the variables detailed in the previous paragraph, with the aim of forecasting the temperature using in situ measurements of temperature and airflow along the ventilation circuit, taking into account seven preset control points (see Figure 2).
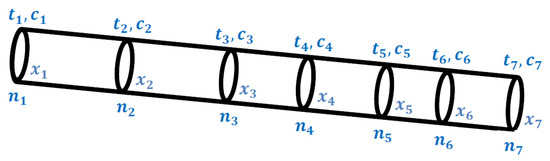
Figure 2.
Representation of the system modeled. Here, tn is the temperature, whether measured or estimated (°C), cn is the airflow measured (m3/s), xn is the relative position of the control points or nodes (m), and ni is the node number.
An analysis of the real data suggested a strong linear relationship among the effective temperatures in the nodes, especially in the case of adjacent nodes, as can be seen in Figure 3.
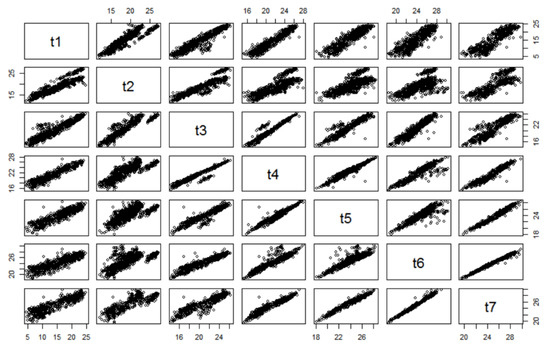
Figure 3.
Scatter plot of the effective temperatures (°C) measured in situ, corresponding to the seven nodes.
3.3. Model Used
On the basis of data analysis, a generalized linear model with four parameters (see Equation (6)) and a linear model with interactions and seven parameters (see Equation (7)) were chosen for this study. A sensitivity analysis was carried out to assess the significance of the parameters from the model [39].
where ti is the temperature at the beginning of the stretch (°C), tf is the temperature at the end of the stretch (°C), Dx is the length of the stretch (m), and Dc is the airflow change along the stretch (m3/s).
The model estimated the daily mean temperature at the end of the stretch as a function of the daily mean temperature at the beginning of the stretch, the length of the stretch, and airflow variation. The prediction was achieved using information from node to node, as well as with a multi-node approach. Despite the quantity of data being very large, it was necessary to obtain all parameters in all nodes to use the models proposed in Equations (6) and (7). The final amount of data could be substantially reduced due to various causes, such as sensors being broken or lost due to aggressive operation conditions, abnormal values due to heavy equipment working close to the sensor, or sensor malfunction. The use of a multi-node approach with a lag step allows obtaining more data. In this study, the following lag steps were applied:
- -
- Lags step of one node, using six stretches created by nodes 1, 2, 3, 4, 5, 6, and 7;
- -
- Lag step of two nodes, using five stretches created by nodes 1–3, 2–4, 3–5, 4–6, and 5–7;
- -
- Lag step of three nodes, using four stretches created by nodes 1–4, 2–5, 3–6, and 4–7.
In addition, the multi-node system reduces the tendency toward the prediction of mean values. Figure 4 displays the variables used in the model, while Table 1 details the length, Dx, and the airflow variation along the intake, Dc.
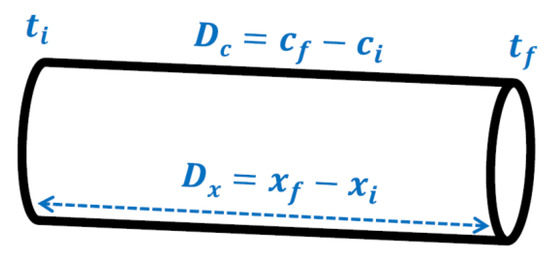
Figure 4.
Scheme of the prediction system created. Here, ci is the airflow at the beginning of the stretch (m3/s), cf is the airflow at the end of the stretch (m3/s), xi is the initial relative position (m), and xf is the final relative position (m).

Table 1.
Characteristics of the stretches used in the model.
Airflow variation was caused by its allocation depending on mine planning and air requirements in different workplaces, which could vary over time. Moreover, stretches S3 and S4 had a small reduction in airflow due to leakages in the circuit.
4. Results and Discussion
The generalized linear model (Equation (6)) and the model with interactions (Equation (7)) exhibited correlations of R2 = 0.858 and 0.887, respectively. However 5.96% of the data recorded by the sensors displayed irregular behavior compared to the dataset, i.e., extremely high temperatures (greater than IQR (interquartile range)), probably due to the exhaust pipe of the diesel equipment passing close to the sensor during some specific maneuvers in the drift. The data analysis also suggested that some outliers could have been caused by erroneous sensor recording [38]. These outliers were avoided for the creation of the model.
The model fully developed with only regular data is displayed in Equation (8). The R2 of the model with interactions was higher than that of the generalized linear model; thus, it was used moving forward, attaining R2 = 0.933 and an estimation error of ±2 °C, with 100% of the residual values lying in the range of ±2.5 °C (Figure 5), which can be considered acceptable for mine ventilation analysis according to the literature [27]. Furthermore, it can be modified according to the needs of the user and characteristics of the mine.
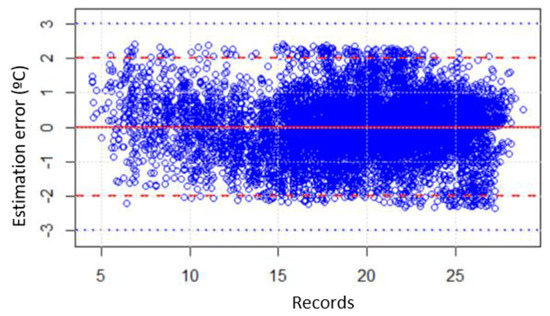
Figure 5.
Residual values from the linear model with interactions.
Figure 6 displays the stretches used in the analysis of the estimation error using the node-to-node and multi-node approaches. The x-axis includes the combination of nodes used in the multi-node approach, as detailed in Section 3.3.
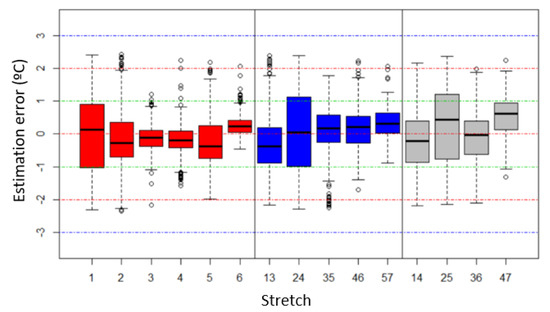
Figure 6.
Error distribution as a function of stretch, node-to-node (red), and multi-node lag steps (blue represents two steps and gray represents three steps).
The highest error was concentrated in nodes 1 and 2, when the lag step was 1, 2 or 3. This was due to the ventilation circuit of the case study (a U-shaped system) having a high variability in temperature at the entrance of the intake, as well as potential problems with connections between the return and intake drifts through doors, and other disturbing factors in areas with a high pressure difference. This issue coincided mainly with nodes 1 and 2, which were within an area with a high airflow and pressure difference. If only nodes 3–6 were considered, the relative error was reduced to <10%.
When the estimated temperatures were compared to the observed values in Figure 7 (i.e., those at the end of the stretch (tf)), it can be seen that the estimation was quite good, with a deviation lower than 2 °C in most of the cases. Furthermore, the correlation was also good, whether using node-to-node or multi-node analysis with a lag step of 2 and 3 nodes (see Figure 8); there was important consistency between the temperatures measured and those estimated at the end of the stretches. The temperature oscillations corresponded to the different seasons of the year, influencing the effective temperature at the bottom of the shaft and along the intake.
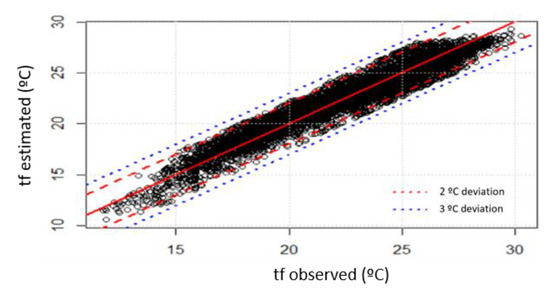
Figure 7.
Comparison between values observed and estimated.
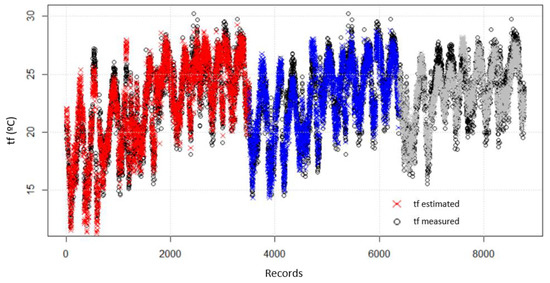
Figure 8.
Final temperature comparison for different node lag steps as a function of node-to-node (red) and multi-node lag steps (blue represents two steps and gray represents three steps).
If the analysis was carried out with the intermediate or final nodes, the correlation between observed and estimated values increased considerably (see Figure 9). Additionally, there was a substantial reduction in terms of range of deviation (~50%) compared to the analysis of the whole system detailed in Figure 7. This means that the model can be used to predict the temperature in a possible extension of the ventilation circuit, even when only using data from a part of the intake drift, by determining the effective temperature at the entrance of each extracting panel of the mine.
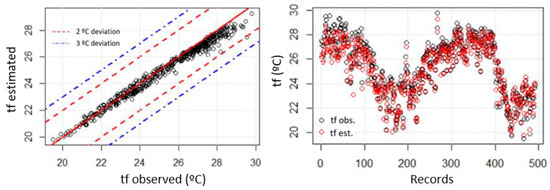
Figure 9.
Analysis of temperature correlation and deviation between nodes 6 and 7.
Further research should be done to analyze different ventilation circuits and additional variables related to the underground mining environment, such as pollutants or humidity. The prediction of temperatures in other sectors was studied using machine learning techniques [40]. Other models and approaches should also be explored in the future.
5. Conclusions
A model with interactions and seven parameters was found to be the most appropriate to describe the main ventilation system in an underground mine, showing good correlation between estimated and observed temperatures (R2 = 0.933), with an estimation error of ±2 °C. Furthermore, its soundness was proven in both node-to-node and multi-node analyses. The model obtained can be useful to predict temperature evolution along the principal circuit, find the best workplace conditions in terms of temperature, and analyze different mine planning scenarios. It is simple to use, adaptable to further modifications depending on the data and requirements of the mine, and accurate in temperature predictions.
The higher error seen in nodes 1 and 2 suggests that the analysis and model of a U-shaped ventilation system should begin at least several hundred meters away from the bottom of the shafts or ramp (>2 km in this case study) in order to obtain the highest accuracy (as seen in nodes 3–7); otherwise, the range of the estimation error may be considerable due to the influence of potential disturbances in areas with a high pressure differential and large amounts of airflow. The multi-node approach is an interesting option in underground mining, due to there being many factors that can affect the availability of data from the sensors. The placement of sensors was also found to be crucial for obtaining representative data and, subsequently, an accurate model. It is important to find zones of drift with the lowest possible disturbance, especially regarding the operation of diesel equipment, due to the high temperature of exhaust fumes. In addition, it is necessary to have an accurate calibration protocol to avoid outliers.
Author Contributions
Conceptualization, M.B., J.M.R., L.S., and H.A.; methodology, M.B. and J.M.R.; validation, M.B. and J.M.R.; formal analysis, M.B., J.M.R., L.S., and H.A.; investigation, M.B., J.M.R., L.S., and H.A.; writing—original draft preparation, M.B., J.M.R., L.S., and H.A.; writing—review and editing, M.B. and J.M.R. All authors read and agreed to the published version of the manuscript.
Funding
This research received no external funding.
Acknowledgments
The authors would like to thank ICL and the ICL Chair in Sustainable Mining for their collaboration during the data acquisition process.
Conflicts of Interest
The authors declare no conflict of interest.
References
- Debia, M.; Couture, C.; Njanga, P.E.; Neesham-Grenon, E.; Lachapelle, G.; Coulombe, H.; Hallé, S.; Aubin, S. Diesel engine exhaust exposures in two underground mines. Int. J. Min. Sci. Technol. 2017, 27, 641–645. [Google Scholar] [CrossRef]
- Sunkpal, M.; Roghanchi, P.; Kocsis, K.C. A method to protect mine workers in hot and humid environments. Saf. Health Work 2018, 9, 149–158. [Google Scholar] [CrossRef] [PubMed]
- Ryan, A.; Euler, D.S. Heat stress management in underground mines. Int. J. Min. Sci. Technol. 2017, 27, 651–655. [Google Scholar] [CrossRef]
- Samatemba, B.; Zhang, L.; Besa, B. Evaluating and optimizing the effectiveness of mining equipment; the case of chibuluma south underground mine. J. Clean. Prod. 2020, 252. [Google Scholar] [CrossRef]
- Eslambolchi, S.S.; Grayson, R.L.; Gernand, J.M. Policy changes in safety enforcement for underground coal mines show mine-size-dependent effects. Saf. Sci. 2019, 112, 223–231. [Google Scholar] [CrossRef]
- Brake, D.J.; Bates, G.P. Limiting metabolic rate (thermal work limit) as an index of thermal stress. Appl. Occup. Environ. Hyg. 2002, 17, 176–186. [Google Scholar] [CrossRef]
- Meade, R.D.; Poirier, M.P.; Flouris, A.D.; Hardcastle, S.G.; Kenny, G.P. Do the threshold limit values for work in hot conditions adequately protect workers? Med. Sci. Sports Exerc. 2016, 48, 1187–1196. [Google Scholar] [CrossRef] [PubMed]
- Xu, G.; Huang, J.; Nie, B.; Chalmers, D.; Yang, Z. Calibration of mine ventilation network models using the non-linear optimization algorithm. Energies 2018, 11, 31. [Google Scholar] [CrossRef]
- Cicioğlu, M.; Çalhan, A. Performance analysis of IEEE 802.15.6 for underground disaster cases. Comput. Stand. Interfaces 2019, 66. [Google Scholar] [CrossRef]
- Liu, H.; Mao, S.; Li, M.; Wang, S. A tightly coupled GIS and spatiotemporal modeling for methane emission simulation in the underground coal mine system. Appl. Sci. 2019, 9, 1931. [Google Scholar] [CrossRef]
- Yi, X.; Ren, L.; Ma, L.; Wei, G.; Yu, W.; Deng, J.; Shu, C. Effects of seasonal air temperature variation on airflow and surrounding rock temperature of mines. Int. J. Coal Sci. Technol. 2019, 6, 388–398. [Google Scholar] [CrossRef]
- Wang, Y.; Zheng, G.; Wang, X. Development and application of a goaf-safety monitoring system using multi-sensor information fusion. Tunn. Undergr. Space Technol. 2019, 94. [Google Scholar] [CrossRef]
- Zhang, L.; Xin, S.; Zhang, Q. Establishment of a mathematical model for non-steady heat dissipation of surrounding rocks in roadways and its main influence factors. Geotech. Geol. Eng. 2019, 37, 2513–2522. [Google Scholar] [CrossRef]
- Mazlomi, A.; Golbabaei, F.; Farhang Dehghan, S.; Abbasinia, M.; Mahmoud Khani, S.; Ansari, M.; Hosseini, M. The influence of occupational heat exposure on cognitive performance and blood level of stress hormones: A field study report. Int. J. Occup. Saf. Ergon. 2017, 23, 431–439. [Google Scholar] [CrossRef]
- Ramsey, J.D.; Burford, C.L.; Beshir, M.Y.; Jensen, R.C. Effects of workplace thermal conditions on safe work behavior. J. Saf. Res. 1983, 14, 105–114. [Google Scholar] [CrossRef]
- Varghese, B.M.; Hansen, A.; Bi, P.; Pisaniello, D. Are workers at risk of occupational injuries due to heat exposure? A comprehensive literature review. Saf. Sci. 2018, 110, 380–392. [Google Scholar] [CrossRef]
- Tan, Z.; Roberts, A.C.; Christopoulos, G.I.; Kwok, K.W.; Car, J.; Li, X.Z.; Soh, C.K. Working in underground spaces: Architectural parameters, perceptions and thermal comfort measurements. Tunn. Undergr. Space Technol. 2018, 71, 428–439. [Google Scholar] [CrossRef]
- Roghanchi, P.; Kocsis, K.C.; Sunkpal, M. Sensitivity analysis of the effect of airflow velocity on the thermal comfort in underground mines. J. Sustain. Min. 2016, 15, 175–180. [Google Scholar] [CrossRef]
- Liu, J.-X.; Wang, X.-F. Temperature field and ventilation simulation of stope in Hongtoushan mine. J. Coal Sci. Eng. 2008, 14, 276–279. [Google Scholar] [CrossRef]
- Singh, T.N.; Sinha, S.; Singh, V.K. Prediction of thermal conductivity of rock through physico-mechanical properties. Build. Environ. 2007, 42, 146–155. [Google Scholar] [CrossRef]
- Semin, M.A.; Levin, L.Y. Stability of air flows in mine ventilation networks. Process Saf. Environ. Prot. 2019, 124, 167–171. [Google Scholar] [CrossRef]
- Du Plessis, G.E.; Liebenberg, L.; Mathews, E.H. Case study: The effects of a variable flow energy saving strategy on a deep-mine cooling system. Appl. Energy 2013, 102, 700–709. [Google Scholar] [CrossRef]
- Trapani, K.; Romero, A.; Millar, D. Deep mine cooling, a case for Northern Ontario: Part II. Int. J. Min. Sci. Technol. 2016, 26, 1033–1042. [Google Scholar] [CrossRef]
- Nie, X.; Wei, X.; Li, X.; Lu, C. Heat Treatment and Ventilation Optimization in a Deep Mine. Adv. Civ. Eng. 2018, 2018. [Google Scholar] [CrossRef]
- Belle, B.; Biffi, M. Cooling pathways for deep Australian longwall coal mines of the future. Int. J. Min. Sci. Technol. 2018, 28, 865–875. [Google Scholar] [CrossRef]
- Khokholov, Y.A.; Solov, D.E. Procedure of Joint Calculation of Temperature and Ventilation Mode in Uninterrupted Mining in Permafrost Zone. J. Min. Sci. 2013, 49, 126–131. [Google Scholar] [CrossRef]
- McPherson, M.J. Subsurface Ventilation and Environmental Engineering; Mine Ventilation Services, Inc.: Fresno, CA, USA, 2009; ISBN 978-0-692.00024-3. [Google Scholar]
- Shahri, A.A.; Larsson, S.; Johansson, F. Updated relations for the uniaxial compressive strength of marlstones based on P-wave velocity and point load index test. Innov. Infrastruct. Solut. 2016, 1, 1–7. [Google Scholar] [CrossRef]
- Mishra, D.A.; Basu, A. Estimation of uniaxial compressive strength of rock materials by index tests using regression analysis and fuzzy inference system. Eng. Geol. 2013, 160, 54–68. [Google Scholar] [CrossRef]
- Yurdakula, M.; Akdas, H. Modeling uniaxial compressive strength of building stones using non-destructive test results as neural networks input parameters. Constr. Build. Mater. 2013, 47, 1010–1019. [Google Scholar] [CrossRef]
- Shahri, A.A.; Asheghi, R.; Khorsand Zak, M. A hybridized intelligence model to improve the predictability level of strength index parameters of rocks. Neural Comput. Appl. 2020, 9. [Google Scholar] [CrossRef]
- Zhu, S.; Wu, S.; Cheng, J.; Li, S.; Li, M. An underground air-route temperature prediction model for ultra-deep coal mines. Minerals 2015, 5, 527–545. [Google Scholar] [CrossRef]
- Lyu, W.; Cai, S.; Yang, P.; Zhang, Y. Underground environment parameter prediction in a deep mine. In Deep Mining 2017, Proceedings of the Eighth International Conference on Deep and High Stress Mining, Perth, Western Australia, 28–30 March 2017; Australian Centre for Geomechanics: Perth, Australia, 2017; pp. 949–960. [Google Scholar] [CrossRef]
- Cheng, J.; Yang, S. Data mining applications in evaluating mine ventilation system. Saf. Sci. 2012, 50, 918–922. [Google Scholar] [CrossRef]
- Hardcastle, S.; Butler, K. A comparison of globe, wet and dry temperature and humidity measuring devices available for heat stress assessment. In Proceedings of the 12th U.S./North American Mine Ventilation Symposium, Reno, NV, USA, 9–11 June 2008; pp. 181–190. [Google Scholar]
- Shannon, H.S.; Robson, L.S.; Guastello, S.J. Methodological criteria for evaluating occupational safety intervention research. Saf. Sci. 1999, 31, 161–179. [Google Scholar] [CrossRef]
- Navarro Torres, V.F.; Dinis da Gama, C.; Singh, R.N. Mathematical modelling of thermal state in underground mining. Acta Geodyn. Geomater 2008, 5, 341–349. [Google Scholar]
- Ciaburro, J. Regression Analysis with R: Design and Develop Statistical Nodes to Identify Unique Relationships within Data at Scale; Packt Publishing: Birmingham, UK, 2018; ISBN 978-1788627306. [Google Scholar]
- Asheghi, R.; Hosseini, S.A.; Saneie, M.; Shahri, A.A. Updating the neural network sediment load models using different sensitivity analysis methods: A regional application. J. Hydroinform. 2020, 22, 562–577. [Google Scholar] [CrossRef]
- Zhang, K.; Guliani, A.; Ogrenci-Memik, S.; Memik, G.; Yoshii, K.; Sankaran, R.; Beckman, P. Machine Learning-Based Temperature Prediction for Runtime Thermal Management Across System Components. IEEE Trans. Parallel Distrib. Syst. 2018, 29, 405–419. [Google Scholar] [CrossRef]


Publisher’s Note: MDPI stays neutral with regard to jurisdictional claims in published maps and institutional affiliations. |
© 2020 by the authors. Licensee MDPI, Basel, Switzerland. This article is an open access article distributed under the terms and conditions of the Creative Commons Attribution (CC BY) license (http://creativecommons.org/licenses/by/4.0/).