Article

Experimental Study on Aerodynamic Characteristics of a Gurney Flap on a Wind Turbine Airfoil under High Turbulent Flow Condition

1
College of Electrical, Energy and Power Engineering, Yangzhou University, Yangzhou 225127, China
2
New Energy Research Center, Yangzhou University, Yangzhou 225009, China
3
College of Hydraulic Science and Engineering, Yangzhou University, Yangzhou 225009, China
4
Jiangsu Key Laboratory of Hi-Tech Research for Wind Turbine Design, Nanjing University of Aeronautics and Astronautics, Nanjing 210016, China
*
Author to whom correspondence should be addressed.
Appl. Sci. 2020, 10(20), 7258; https://doi.org/10.3390/app10207258
Submission received: 20 September 2020 / Revised: 12 October 2020 / Accepted: 14 October 2020 / Published: 16 October 2020
(This article belongs to the Special Issue Wind Turbine Aerodynamics II)

Abstract

:
The objective of the current work is to experimentally investigate the effect of turbulent flow on an airfoil with a Gurney flap. The wind tunnel experiments were performed for the DTU-LN221 airfoil under different turbulence level (T.I. of 0.2%, 10.5% and 19.0%) and various flap configurations. The height of the Gurney flaps varies from 1% to 2% of the chord length; the thickness of the Gurney flaps varies from 0.25% to 0.75% of the chord length. The Gurney flap was vertical fixed on the pressure side of the airfoil at nearly 100% measured from the leading edge. By replacing the turbulence grille in the wind tunnel, measured data indicated a stall delay phenomenon while increasing the inflow turbulence level. By further changing the height and the thickness of the Gurney flap, it was found that the height of the Gurney flap is a very important parameter whereas the thickness parameter has little influence. Besides, velocity in the near wake zone was measured by hot-wire anemometry, showing the mechanisms of lift enhancement. The results demonstrate that under low turbulent inflow condition, the maximum lift coefficient of the airfoil with flaps increased by 8.47% to 13.50% (i.e., thickness of 0.75%), and the Gurney flap became less effective after stall angle. The Gurney flap with different heights increased the lift-to-drag ratio from 2.74% to 14.35% under 10.5% of turbulence intensity (i.e., thickness of 0.75%). However, under much a larger turbulence environment (19.0%), the benefit to the aerodynamic performance was negligible.

1. Introduction

Wind power generation technology has been maturely developed in the past decades. Airfoil is a basic element of a wind turbine blade, and its aerodynamic characteristics have a major influence on the wind energy conversion efficiency. Among the conventional rotor aerodynamic design strategy, the blade add-ons were of particular interest to further improve wind energy efficiency. Therefore, mounting flap to the airfoil trailing edge was one of the most feasible methods to improve the aerodynamic performance of wind turbines. In addition to power production, such a technique can also effectively reduce the aerodynamic loads both of wind turbine blades and tower. If a sophisticated controller was implemented, the flap can further reduce turbulence-induced fatigue loads, so that longer lifetime was guaranteed. After the pioneering work of Liebeck [1], a large number of studies have been conducted to explain the phenomena induced by the presence of this device. More recently, research objects were most focused on airfoil attached various shapes of flaps, such as Gurney flaps [2,3], triangular flaps [4], separate trailing edge flaps [5,6] and deformable trailing edge flaps [7,8]. For experiment tests, Zhang et al. [9] and Amini et al. [10] studied the aerodynamic effect of a Gurney flap based on the airfoil through wind tunnel experiments. T Lee et al. [11] carried out a wind tunnel test of the lift force and pitching moment coefficients of both trailing edge flaps and Gurney flaps with different shape parameters. Based on a 5 MW reference wind turbine, Chen et al. [12] designed and optimized a trailing edge flaps such that the blade mass can be further reduced but still maintain the desired power performance. Medina et al. [13] explored the flow mechanisms of a flap at a high deflection angle. When the flap works in a separated flow region, he provided some ideas for realizing instantaneous action or alleviating extra aerodynamic loads on wind turbines. Elsayed et al. [14] studied the flap tip vortexes and characterized the flow structures behind a flap in a low-speed wind tunnel by using particle image velocimetry. Little et al. [15] designed a trailing edge flap by using a single medium plasma driver which resulted in a higher lift force. Bergami et al. [16] designed an active controller of a trailing edge flap on a 5 MW reference wind turbine and proved that the flap could effectively control aerodynamic loads. Edward et al. [17] also conducted experiments on a flaps noise drop. According to the wind tunnel tests based on a full-size rotor, Straub et al. [18] found that flaps could also be used to control noise and vibration such that the noise generated by blade vortex interaction could be reduced by 6 dB. For numerical simulations and theoretical analyses, Traub et al. [19] fitted a semi-empirical equation by summarizing the performance of a large number of flaps. Lario et al. [20] numerically solved the unsteady flow field of Gurney flaps at high Reynolds numbers through the discontinuous Galerkin method. By analyzing dynamic characteristics of an airfoil with Gurney flaps through the numerical simulation, Li et al. [21] found that flaps were capable to reduce unsteady aerodynamic loads of wind turbines. Zhu et al. [22] numerically simulated the airfoil with trailing edge flaps using the immersed boundary method and found that flaps could be combined with the paddle movement to adjust the aerodynamic loads of a wind turbine airfoil. Ng et al. [23] investigated the trailing edge flap together with an aeroelastic analysis. It was noted that the trailing edge flap could be a smart device to control aeroelastic deformation.
All the above researches on the flaps were built on the uniform inflow of low turbulence intensity. In the past, there were few studies carried out by flow over flaps under high turbulence intensity [24,25], however, such a flow condition often occurs on wind turbines operating in a wind farm. Considering wind turbines operate in a turbulence environment, the conclusions obtained from the previous studies might not be accurate. Therefore, to simulate wind turbines under turbulence environment, active and passive wind tunnel turbulence generation methods can be used. The active technology includes a vibrating grille and multi-fan wind tunnel; the maximum turbulence intensity can reach more than 20% [26]. The passive control structure was relatively simple, which can be divided into grille, wedge, and rough square types among the passive turbulence generators, it was more convenient to construct grilles, which have gain very popular use. In this experiment, specific turbulence levels were passively controlled by a grille with proper grid size.
The investigations presented in this paper were focused on the coupled effects of Gurney flap and turbulence inflow. The Gurney flaps were experimentally investigated under various turbulence intensities and flap configurations. The desired turbulent flow passes the airfoil was achieved by changing the grille size as well as the distance between the grille and the airfoil model. The hot-wire anemometer was used to record the wind speed and turbulence intensity in a flow cross-section. The quantitative information obtained during the experiment includes: (1) turbulent field descriptions, (2) airfoil pressure coefficients, (3) lift-to-drag coefficients, (4) wake measurements. On that basis, the aerodynamic performance of Gurney flaps with different heights and thicknesses was researched. The values of lift and pitching-moment coefficients were obtained through the integration of surface pressures. The wake rake array was also used to determine the values of drag coefficient. Furthermore, the flow fields near the trailing edge of airfoil were tested which could further verify the reason for lift improvement. Finally, concluding remarks accompany the discussion of the experimental investigations.

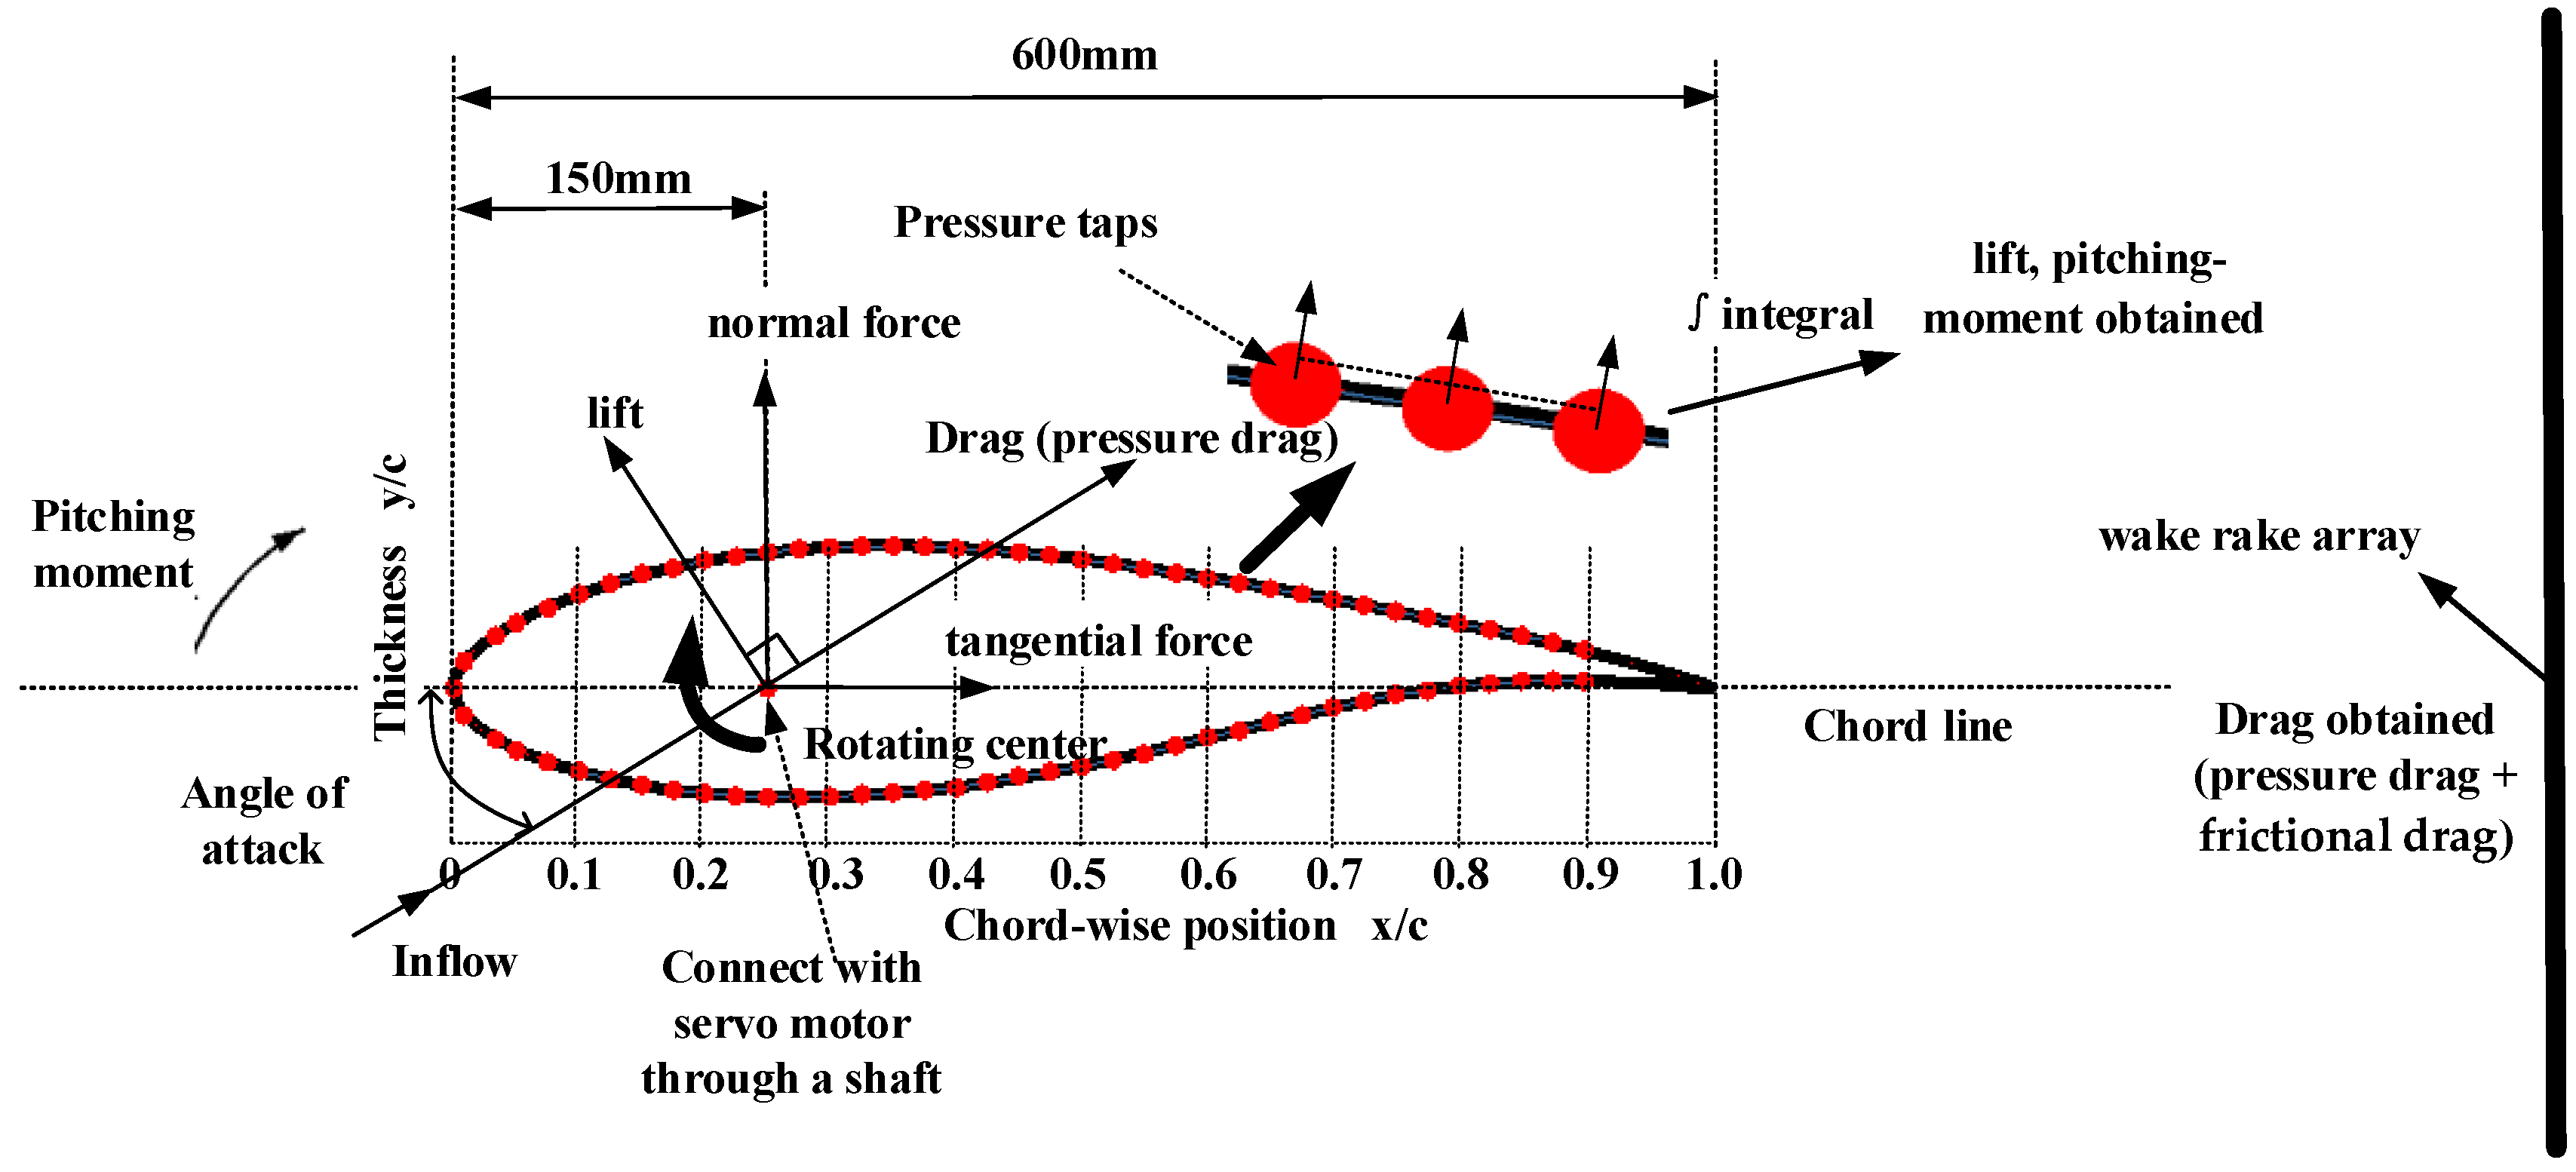
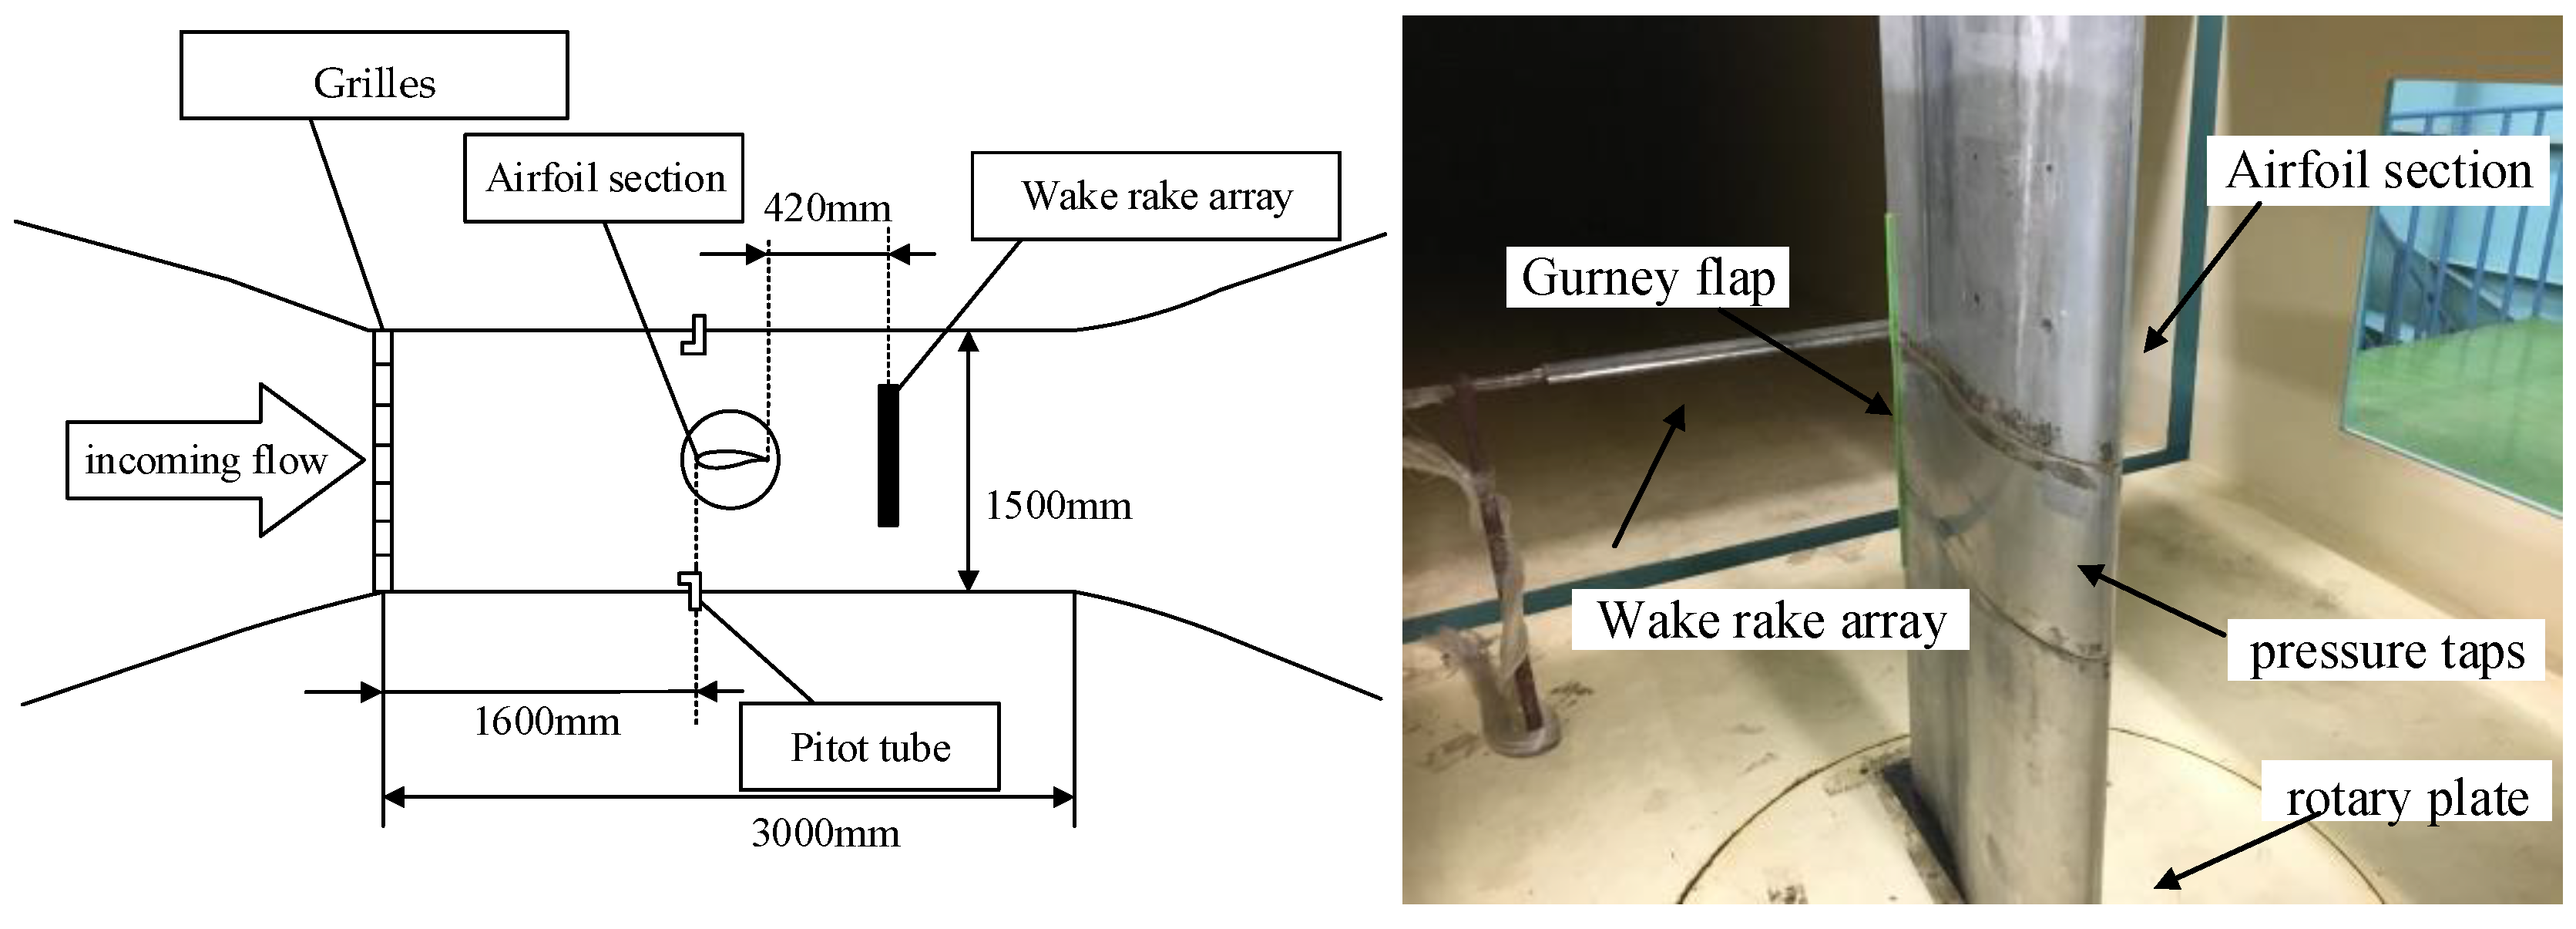
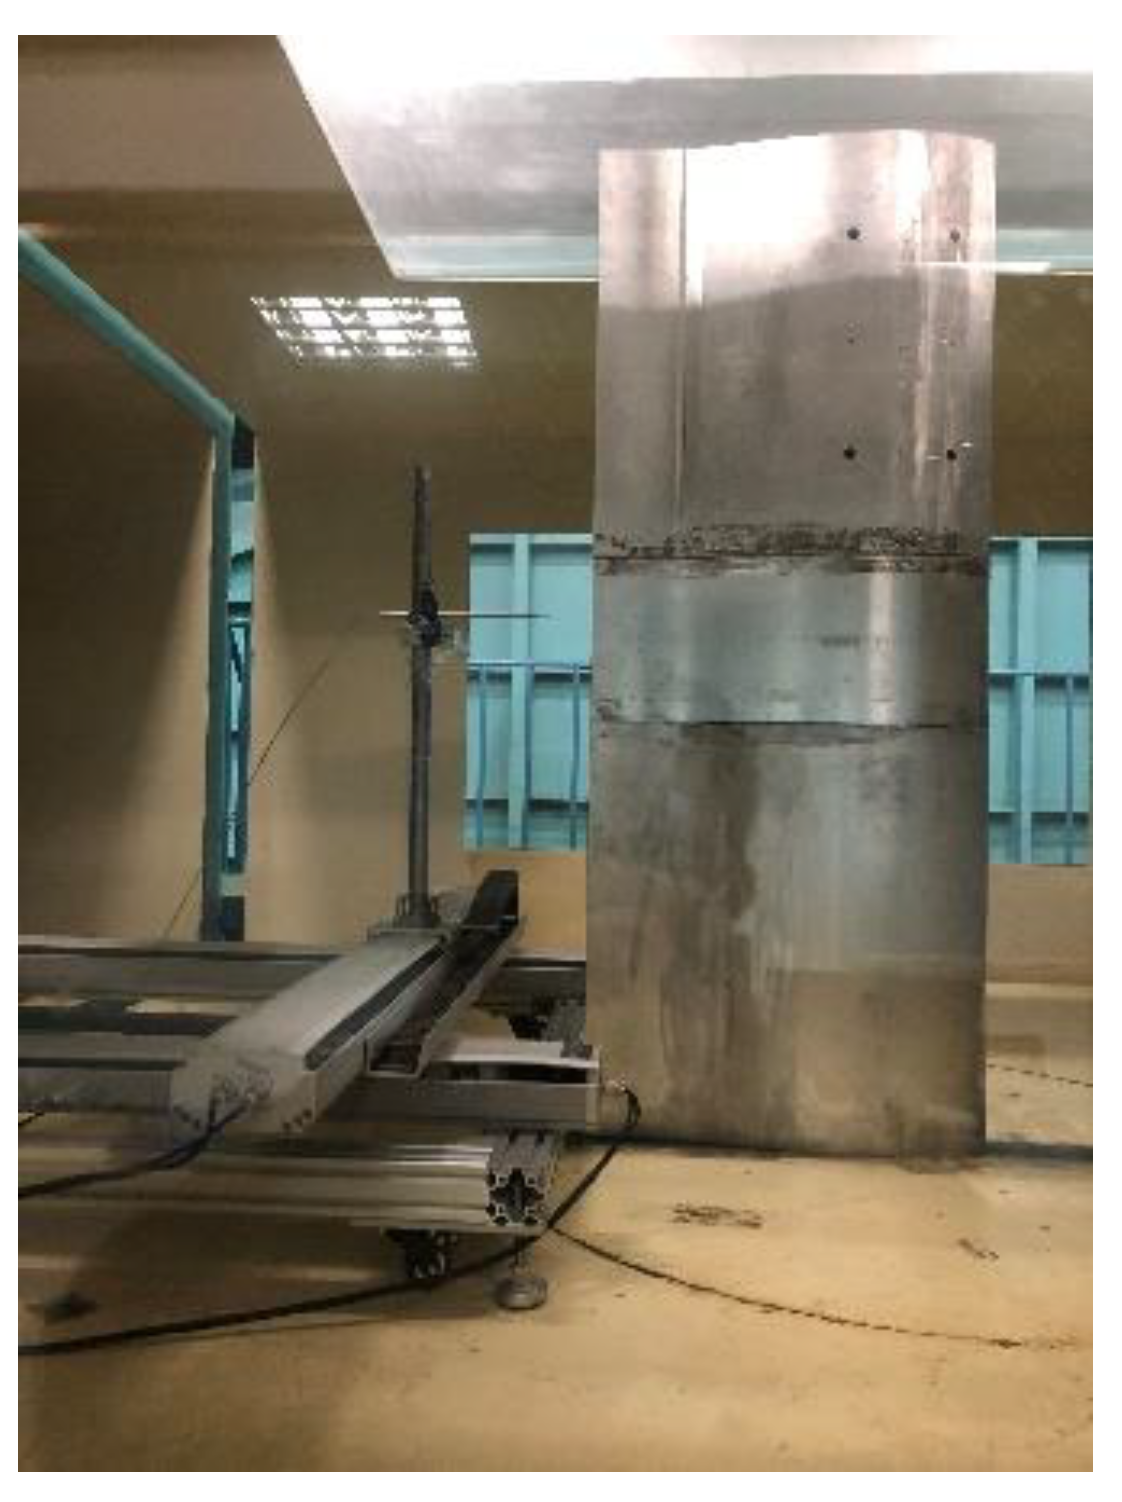
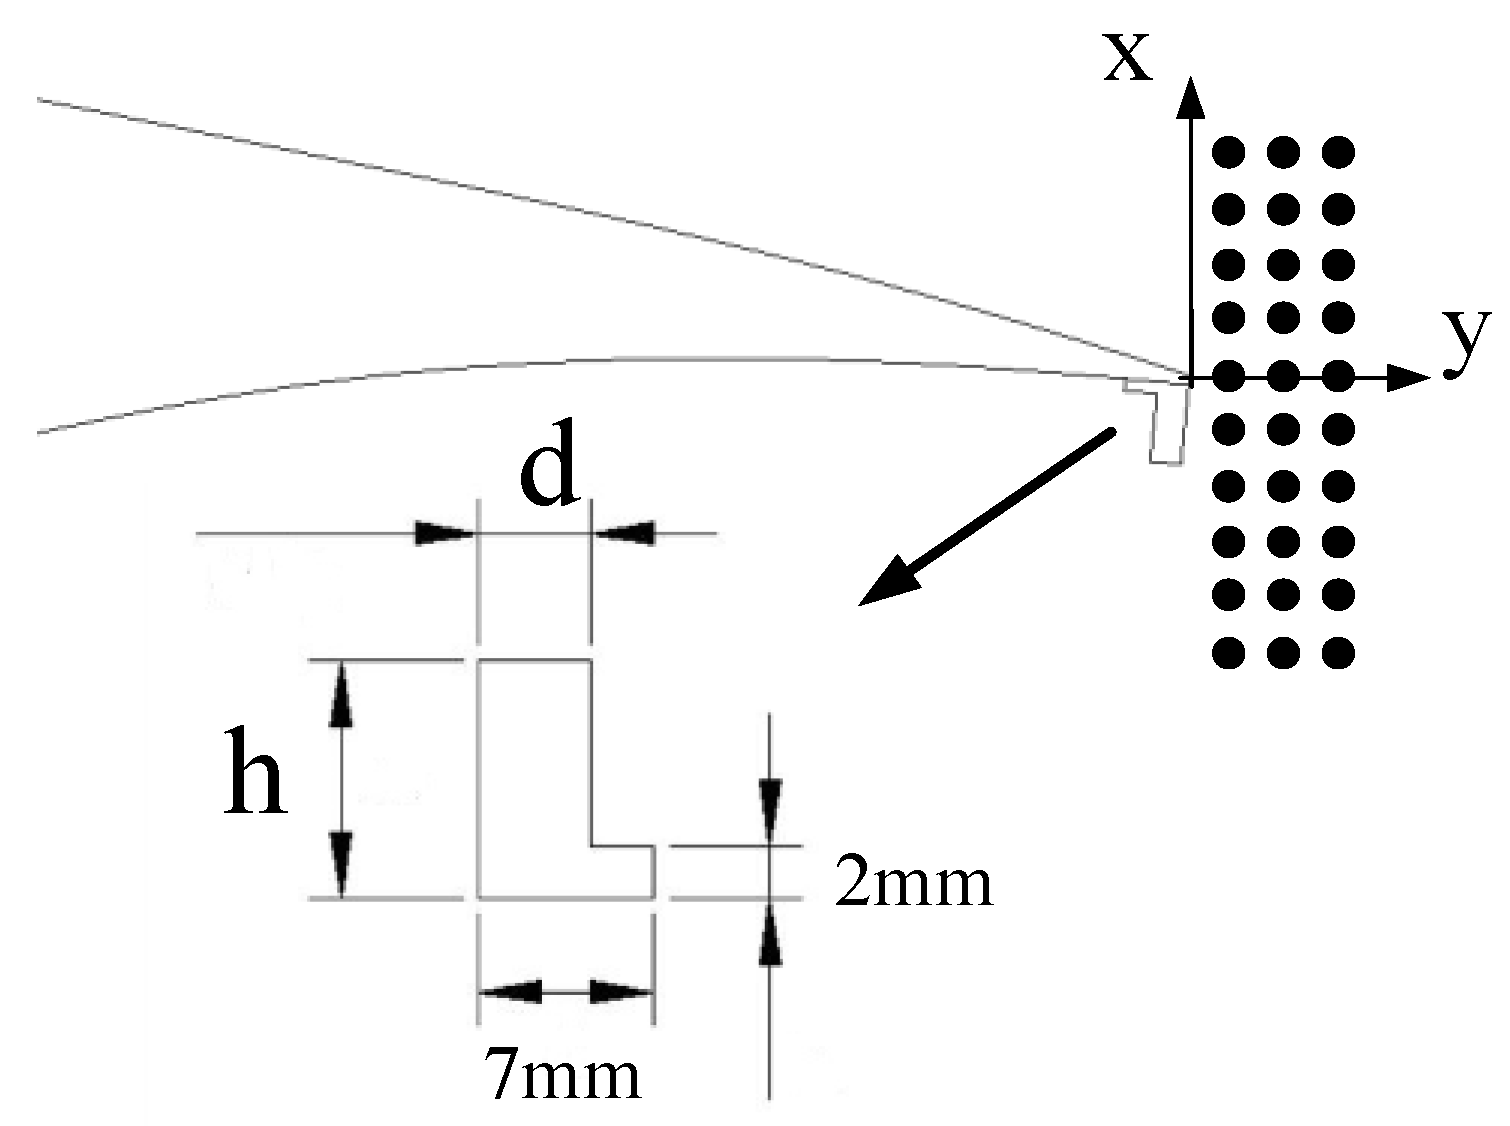
2. Experimental Setup

The experiments were carried out in a wind tunnel located at Yangzhou University. It was a close-loop type wind tunnel which contains two experimental sections. The measurements were conducted in the smaller section with the cross-section parameters of 3 m × 1.5 m, and the length is 3 m. The operational wind speed range was 0~50 m/s and the calibrated maximum turbulence intensity in the free stream was 0.2%. The DTU-LN221 airfoil model [27], as shown in Figure 1, was adopted which has a chord length of 0.6 m and a span length of 1.5 m. The airfoil model was vertically placed in the test section. The bottom part of the airfoil section was connected by the rotating shaft, which was fixed on a rotational plate, as demonstrated in Figure 2. Therefore, the angle of attack can be remotely controlled via a shaft connection with a motor below the wind tunnel. The airfoil model was made of aluminum alloy where small taps were drilled on the surface of the middle section, with the location sketched in Figure 1. The arc length between the taps was approximately spaced every 2.5% of chord length starting from the leading edge to 90% of the trailing edge. The hollow plastic hoses were connected on the reverse side of the airfoil surface which has an outer diameter of 1.2 mm. Thus, a total of 77 pressure taps were arranged for the pressure measurement on the surface of the airfoil. The pressures on the airfoil surface were sensed by the electronic pressure acquisition system of PSI (Pressure Systems Inc., Hampton, VA, USA). The pressure system used in the experiment has a sampling frequency of 333.3 Hz, a measuring range of ±2.5 kPa and a measuring accuracy of ±0.05%. Figure 1 also shows the chord-wise position, so the lift and pitching-moment of the test airfoil were achieved by integrating the pressure and the position of the taps on the surface. The lift coefficient and pitching-moment coefficients were given by
C l = C n cos α C t sin α C m = 0 1 ( C p l C p u ) ( 0.25 x ^ ) d x ^
where
C n = 0 1 ( C p l C p u ) d x ^ C t = y ^ l   m a x y ^ u   m a x ( C p , b e C p , a f ) d y ^
where Cl and Cm are the lift coefficient and pitching-moment coefficient, respectively; αrepresents the angle of attack; x ^ is the relative chord length; y ^ is the thickness value relative to the chord length; Cpu and Cpl are the pressure coefficient on the suction and pressure sides of the airfoil, respectively; Cn and Ct are the normal force coefficient and tangential force coefficient, respectively. Cp,be and Cp,af are the pressure coefficient before and after the maximum thickness of airfoil; y ^ u   m a x and y ^ l   m a x represent the maximum thickness values of the suction and pressure sides relative to chord length.
At a small angle of attack, the aerodynamic drag largely consists of frictional drag, while the data measured by surface pressure taps cannot accurately represent the drag force, so the drag can be measured by the momentum method more precisely. As shown in Figure 2, a wake rake array was placed at 0.7 chord length behind the trailing edge of the airfoil and at the same vertical level as the pressure taps. The measurement range of the wake probes was 80.8 cm, 102 total pressure pipes (with an outer diameter of 1.2 mm) and 4 static pressure pipes (with an outer diameter of 2 mm) were averagely arranged, with an 20 cm apart for the static pressure pipes. To prevent air leakage, all pressure tubes were connected by plastic hoses to the pressure measurement device. Besides, two Pitot tubes were installed at 1.6 m measured from the downstream of grilles where the free stream velocity was recorded. The drag coefficients were given as follows
C d = 2 c w P 01 P P 0 P [ 1 P 01 P P 0 P ] d s
where Cd is the drag coefficient; c is the chord length, w is the range of integration; s is the coordinate along the thickness direction of the wake rake array; P and P0 are the static pressure and total pressure measured by the Pitot tubes; P and P01 are the static pressure and total pressure measured by the wake rake array. It should be noted that there is a total pressure loss along the Pitot tubes to the wake rake array, therefore the total pressure loss should be added to each total pressure measuring point of the wake rake array.
Figure 3 presents the schematic diagram of the grille geometry. The grilles assembled with many squared alloys with geometry specified by four parameters a, b, c and d. These small squares were bolted together and on top of the grille the rubber pads were attached. During the measurements, two types of grilles were implemented. The dimensions of the two grilles were provided in Table 1. The width of the longitudinal grille and the transverse grille were denoted by a and c, respectively; the width and the height of the spacing were denoted by b and d, respectively, the thickness along the flow direction was e.
Behind the grille, there were eight measurement sections designed for velocity recording. At each of the section, 15 measurement points were uniformly spaced. The center of the topmost measurement point corresponds to the geometrical center of the wind tunnel section. The horizontal and vertical spacing of measuring points were 10 cm, as displayed by the black spots in Figure 3a. In addition, we set eight measurement sections one to two meters behind the grille, as shown in Figure 3b. The wind speed was measured through a Dantec hot-wire probe (type 55P61). The sampling frequency was 5 kHz, and the test wind speeds were consistent with that in the airfoil experiment. Figure 4 displays the device of turbulence measurement. Besides, wake measurements in this paper were carried out on an electronically controlled traverser consisting of a two-dimensional probe, as displayed in Figure 5.
The influence of the flap height and thickness were two key parameters which influence the overall aerodynamic performance of the airfoil. For this reason, a total of nine types of flaps were designed in the experiments, namely, the flap with heights h of 1%, 1.5% and 2% chord length (6 mm, 9 mm and 12 mm, respectively) and with relative thicknesses d of 0.25%, 0.5% and 0.75% chord length (1.5 mm, 3 mm and 4.5 mm, respectively). The diagram of the flap used in the experiment was given in Figure 6. As shown, the flap has an L shape; the bottom part has a width of 7 mm which was attached to the pressure side of the airfoil trailing edge. During the experiments, the flap was vertically attached near the position of 100% of the chord length, see Figure 2 with the specific experimental setup. The coordinate system behind the trailing edge was defined for subsequent wake measurements, also the x and y axis were set in the vertical and the forward directions, respectively. The black spots in the Figure 6 represented the hot-wire measuring positions set at downstream of the trailing edge.

3. Experimental Results and Analysis

In the experiment, the free stream flow velocity was 20 m/s, and the corresponding Reynolds number based on the airfoil chord length was 0.8 × 10⁶, although wind turbines often operate at wind speed below 20 m/s, but the magnitude of the Reynolds number was up to an order of 106. Therefore, the experimental value of the Reynolds number was chosen to approach an order of magnitude corresponding to those obtained from full-scale wind turbines. Two types of grilles generate different turbulence levels in the wind tunnel, such that the experiments were mainly separated into low and high turbulence cases. To be specific, a grille was placed at the upstream of the airfoil test section which results in different aerodynamic characteristics of flow over the airfoil with and without a Gurney flap.

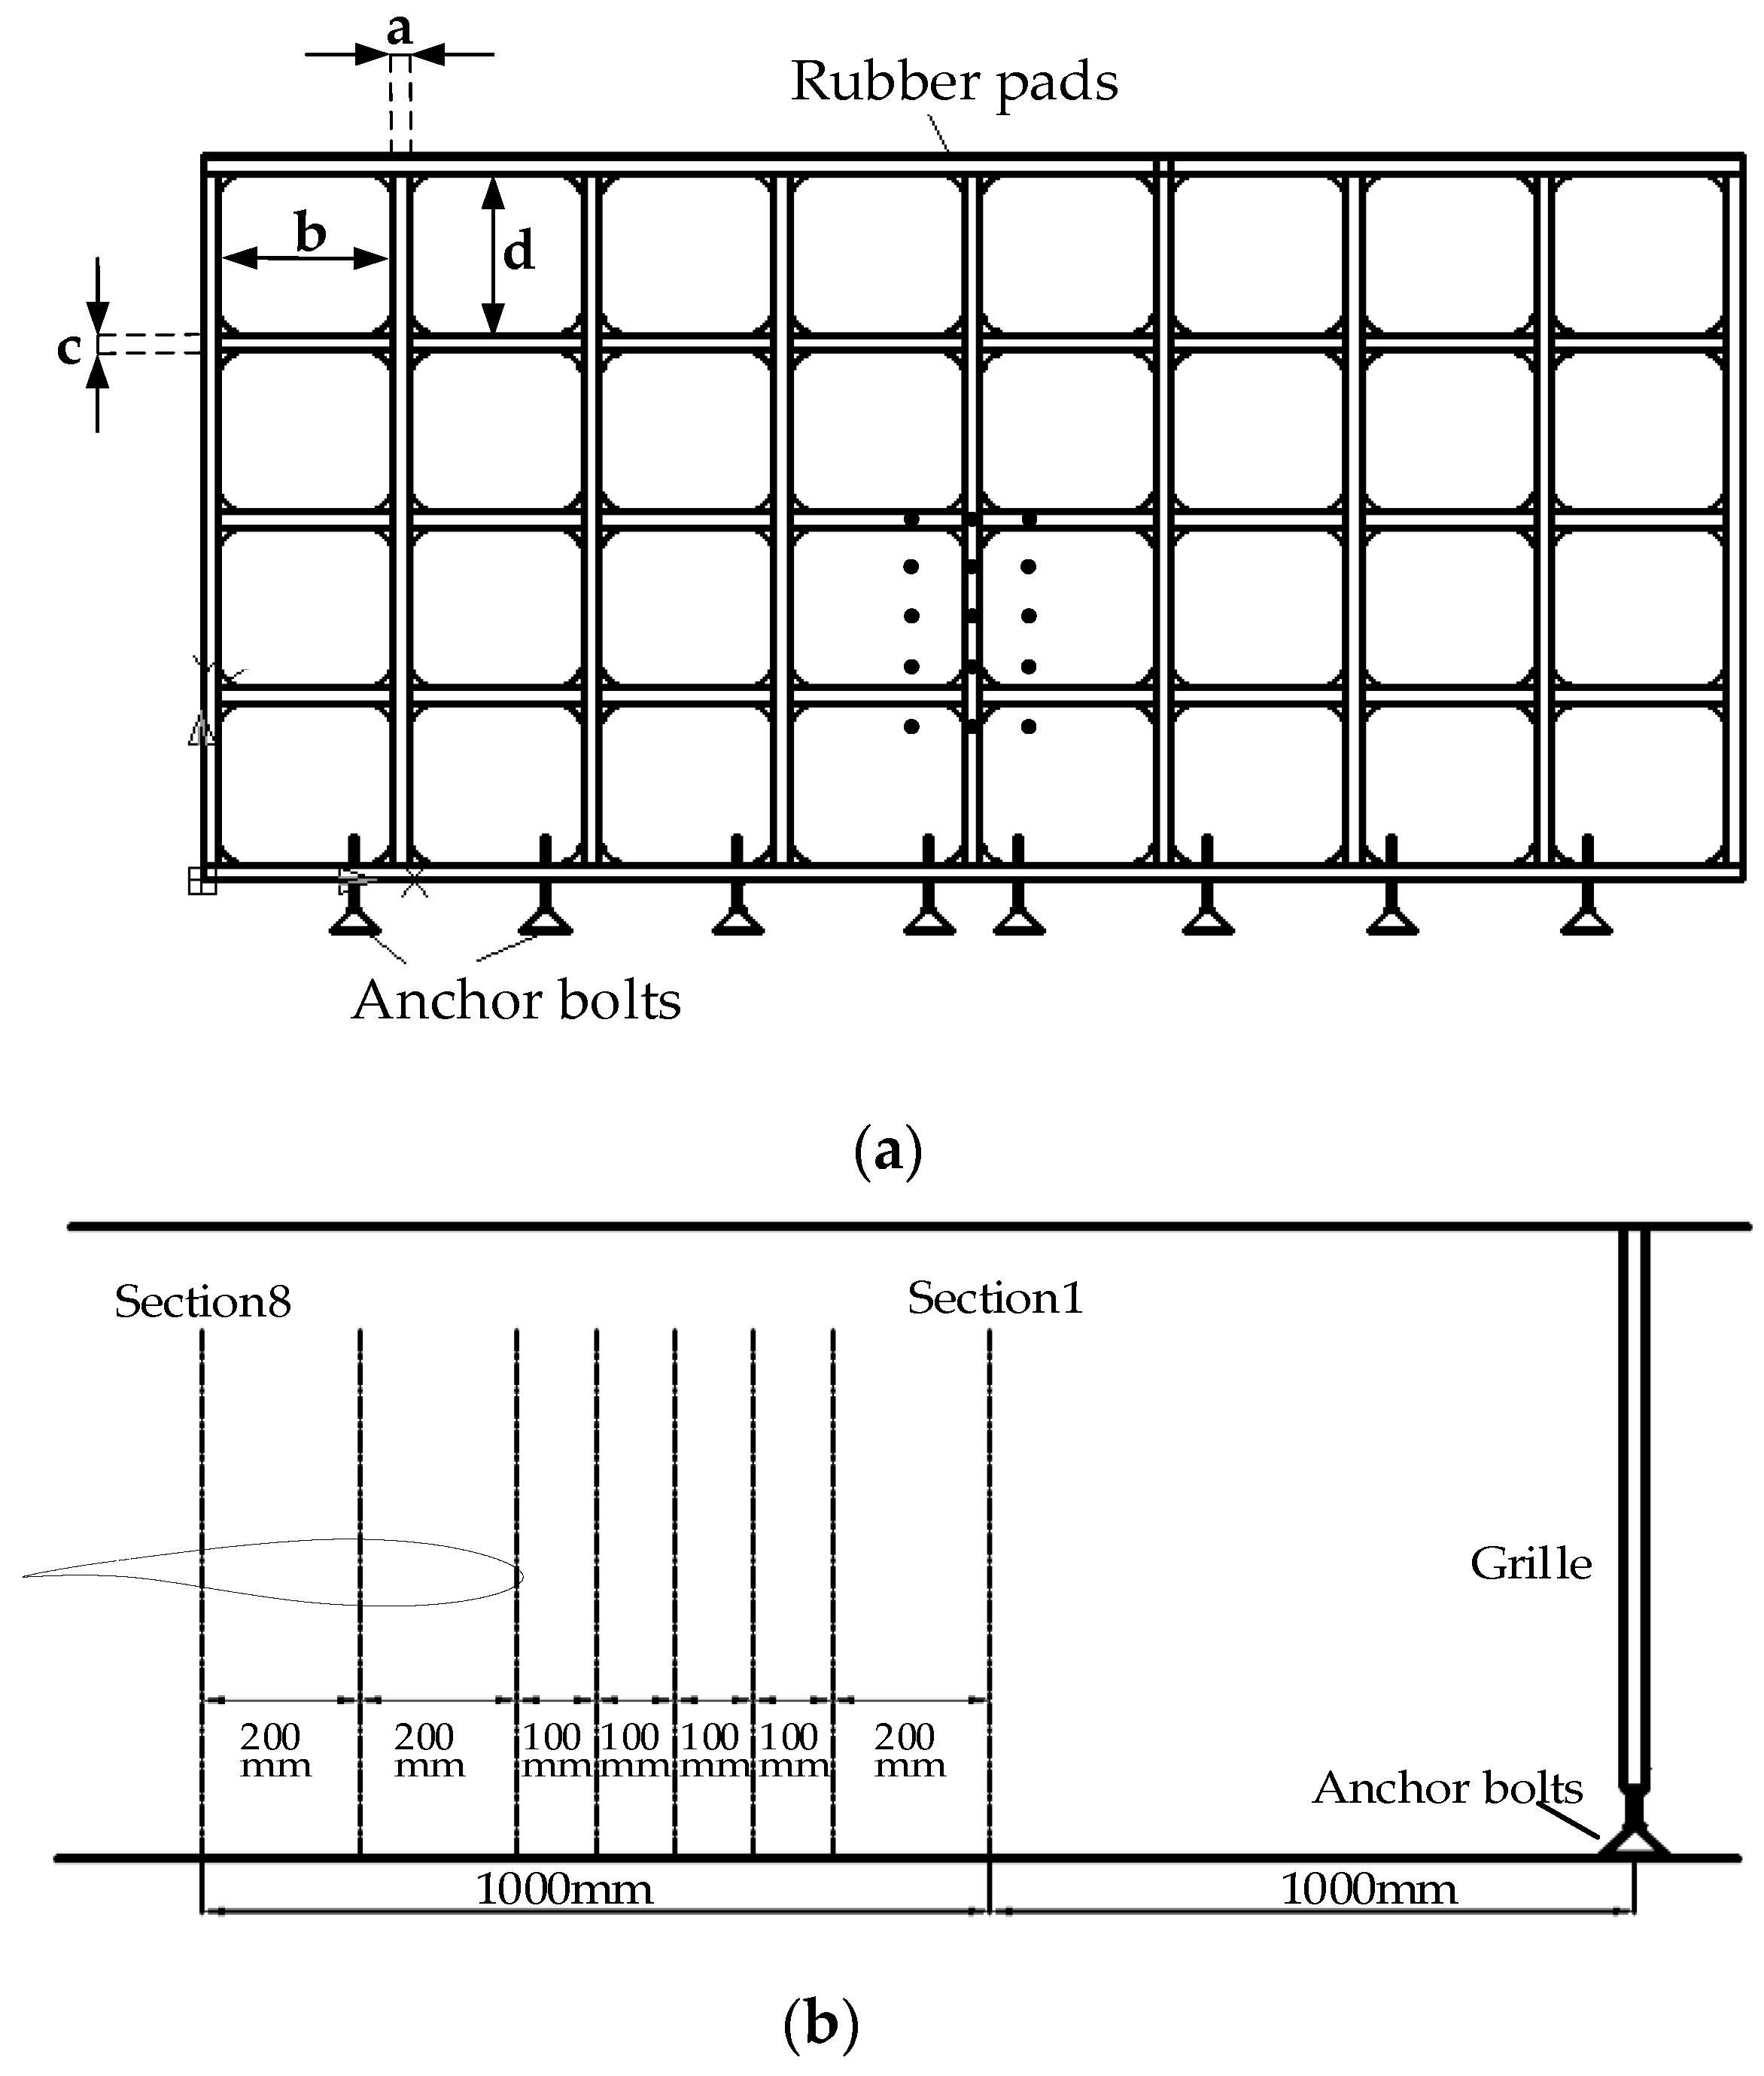
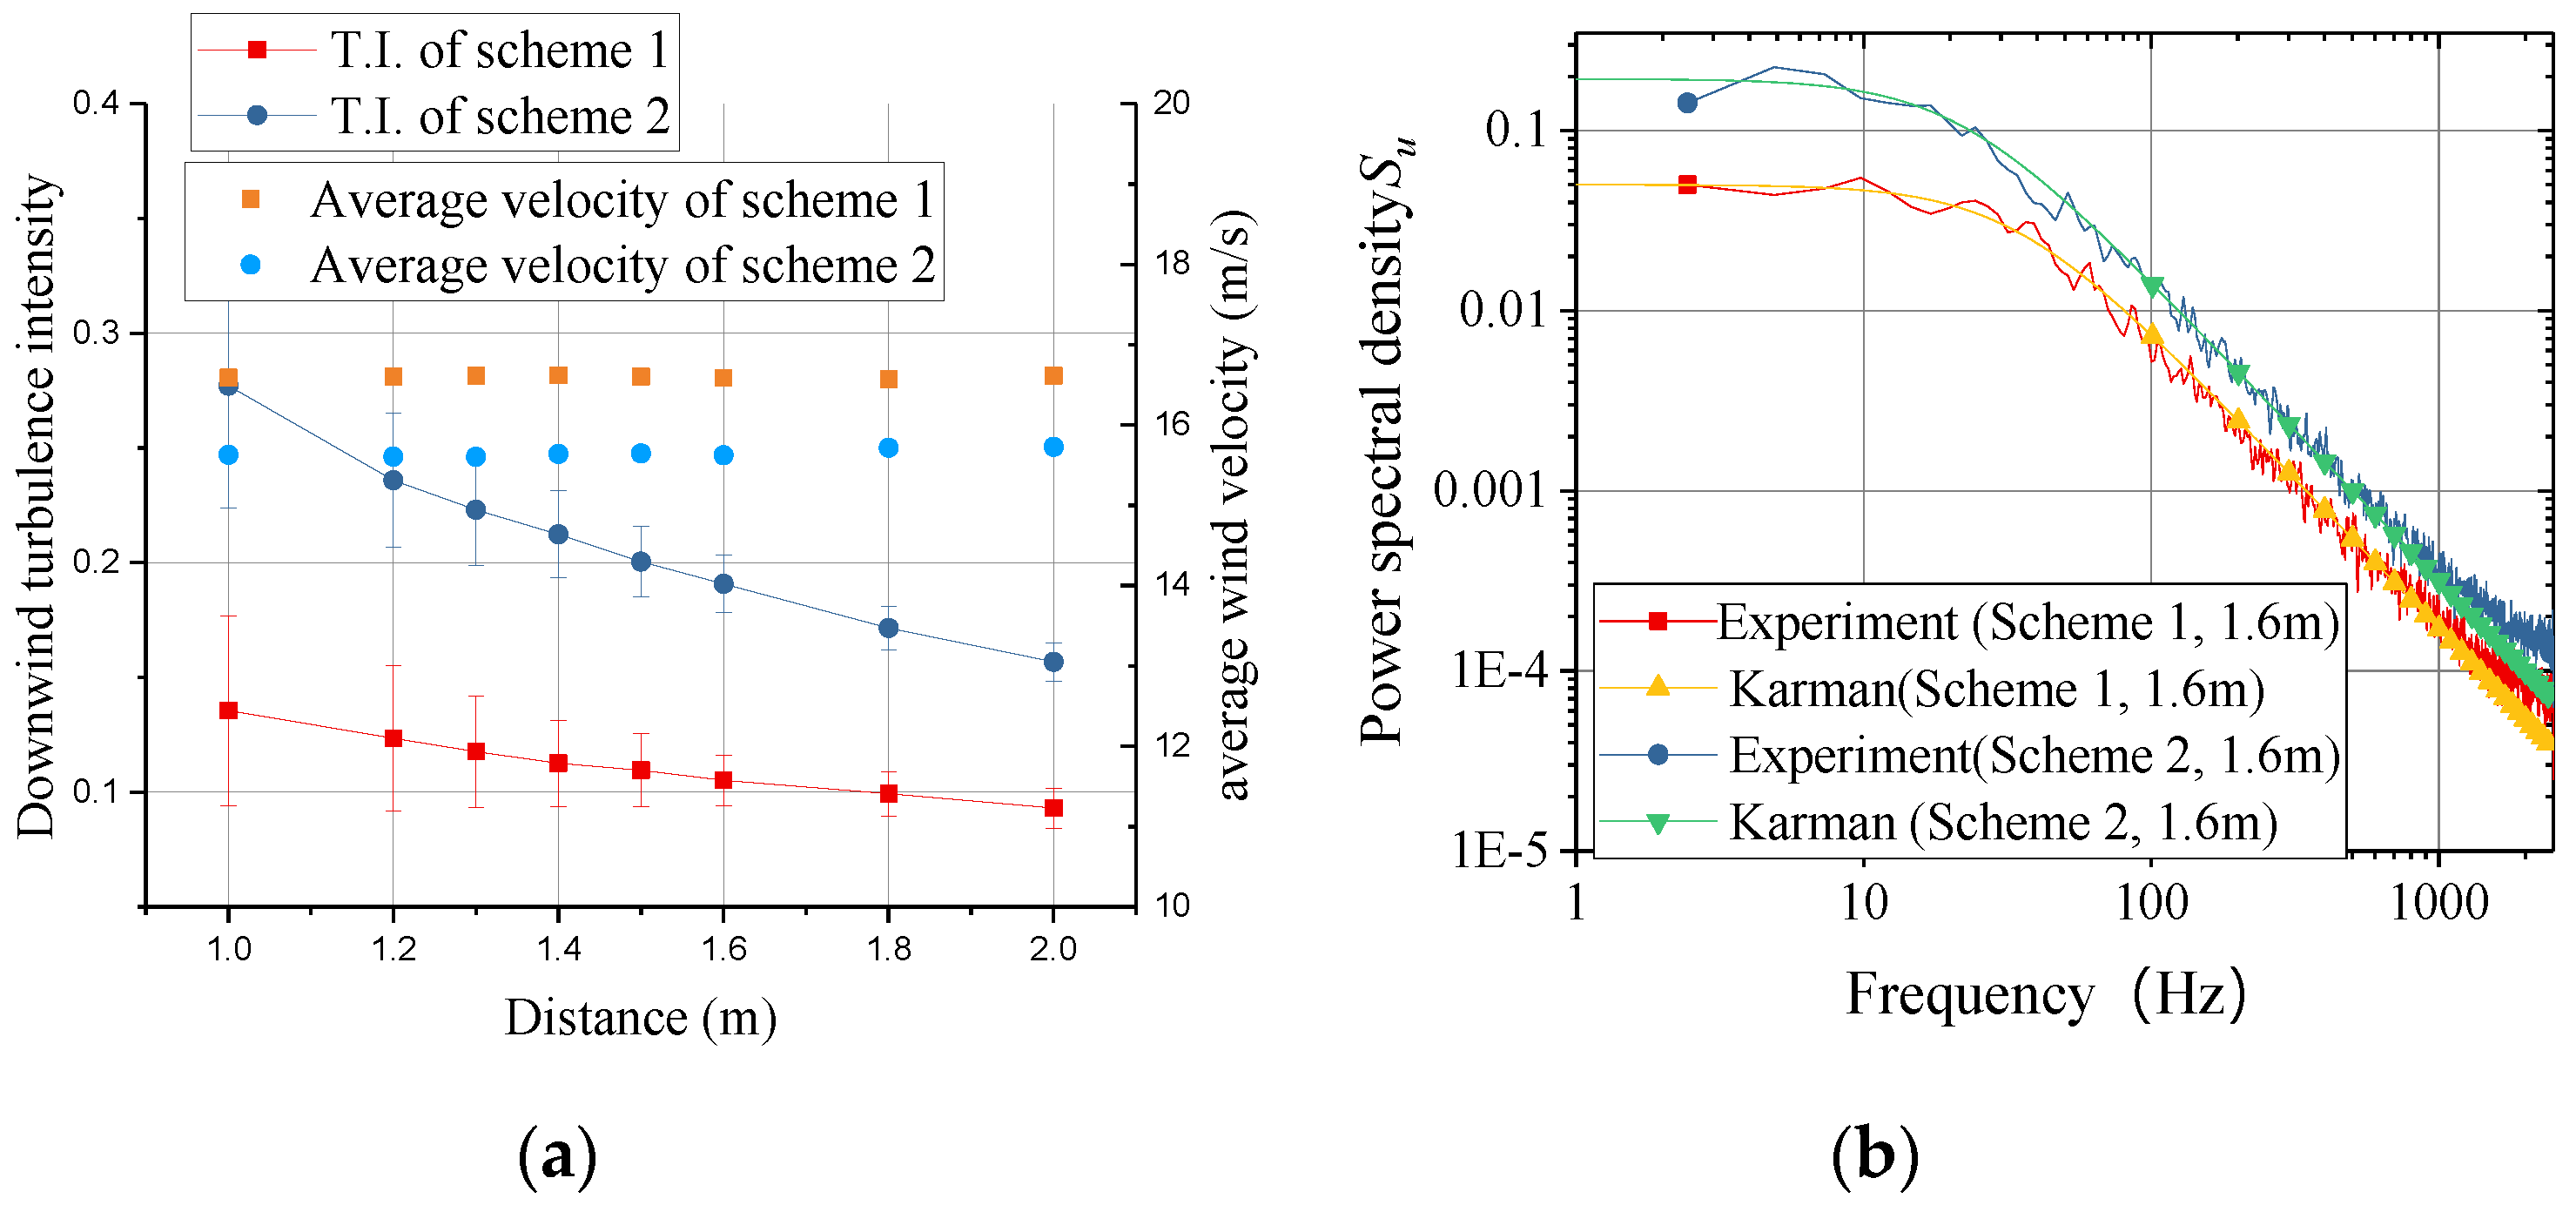
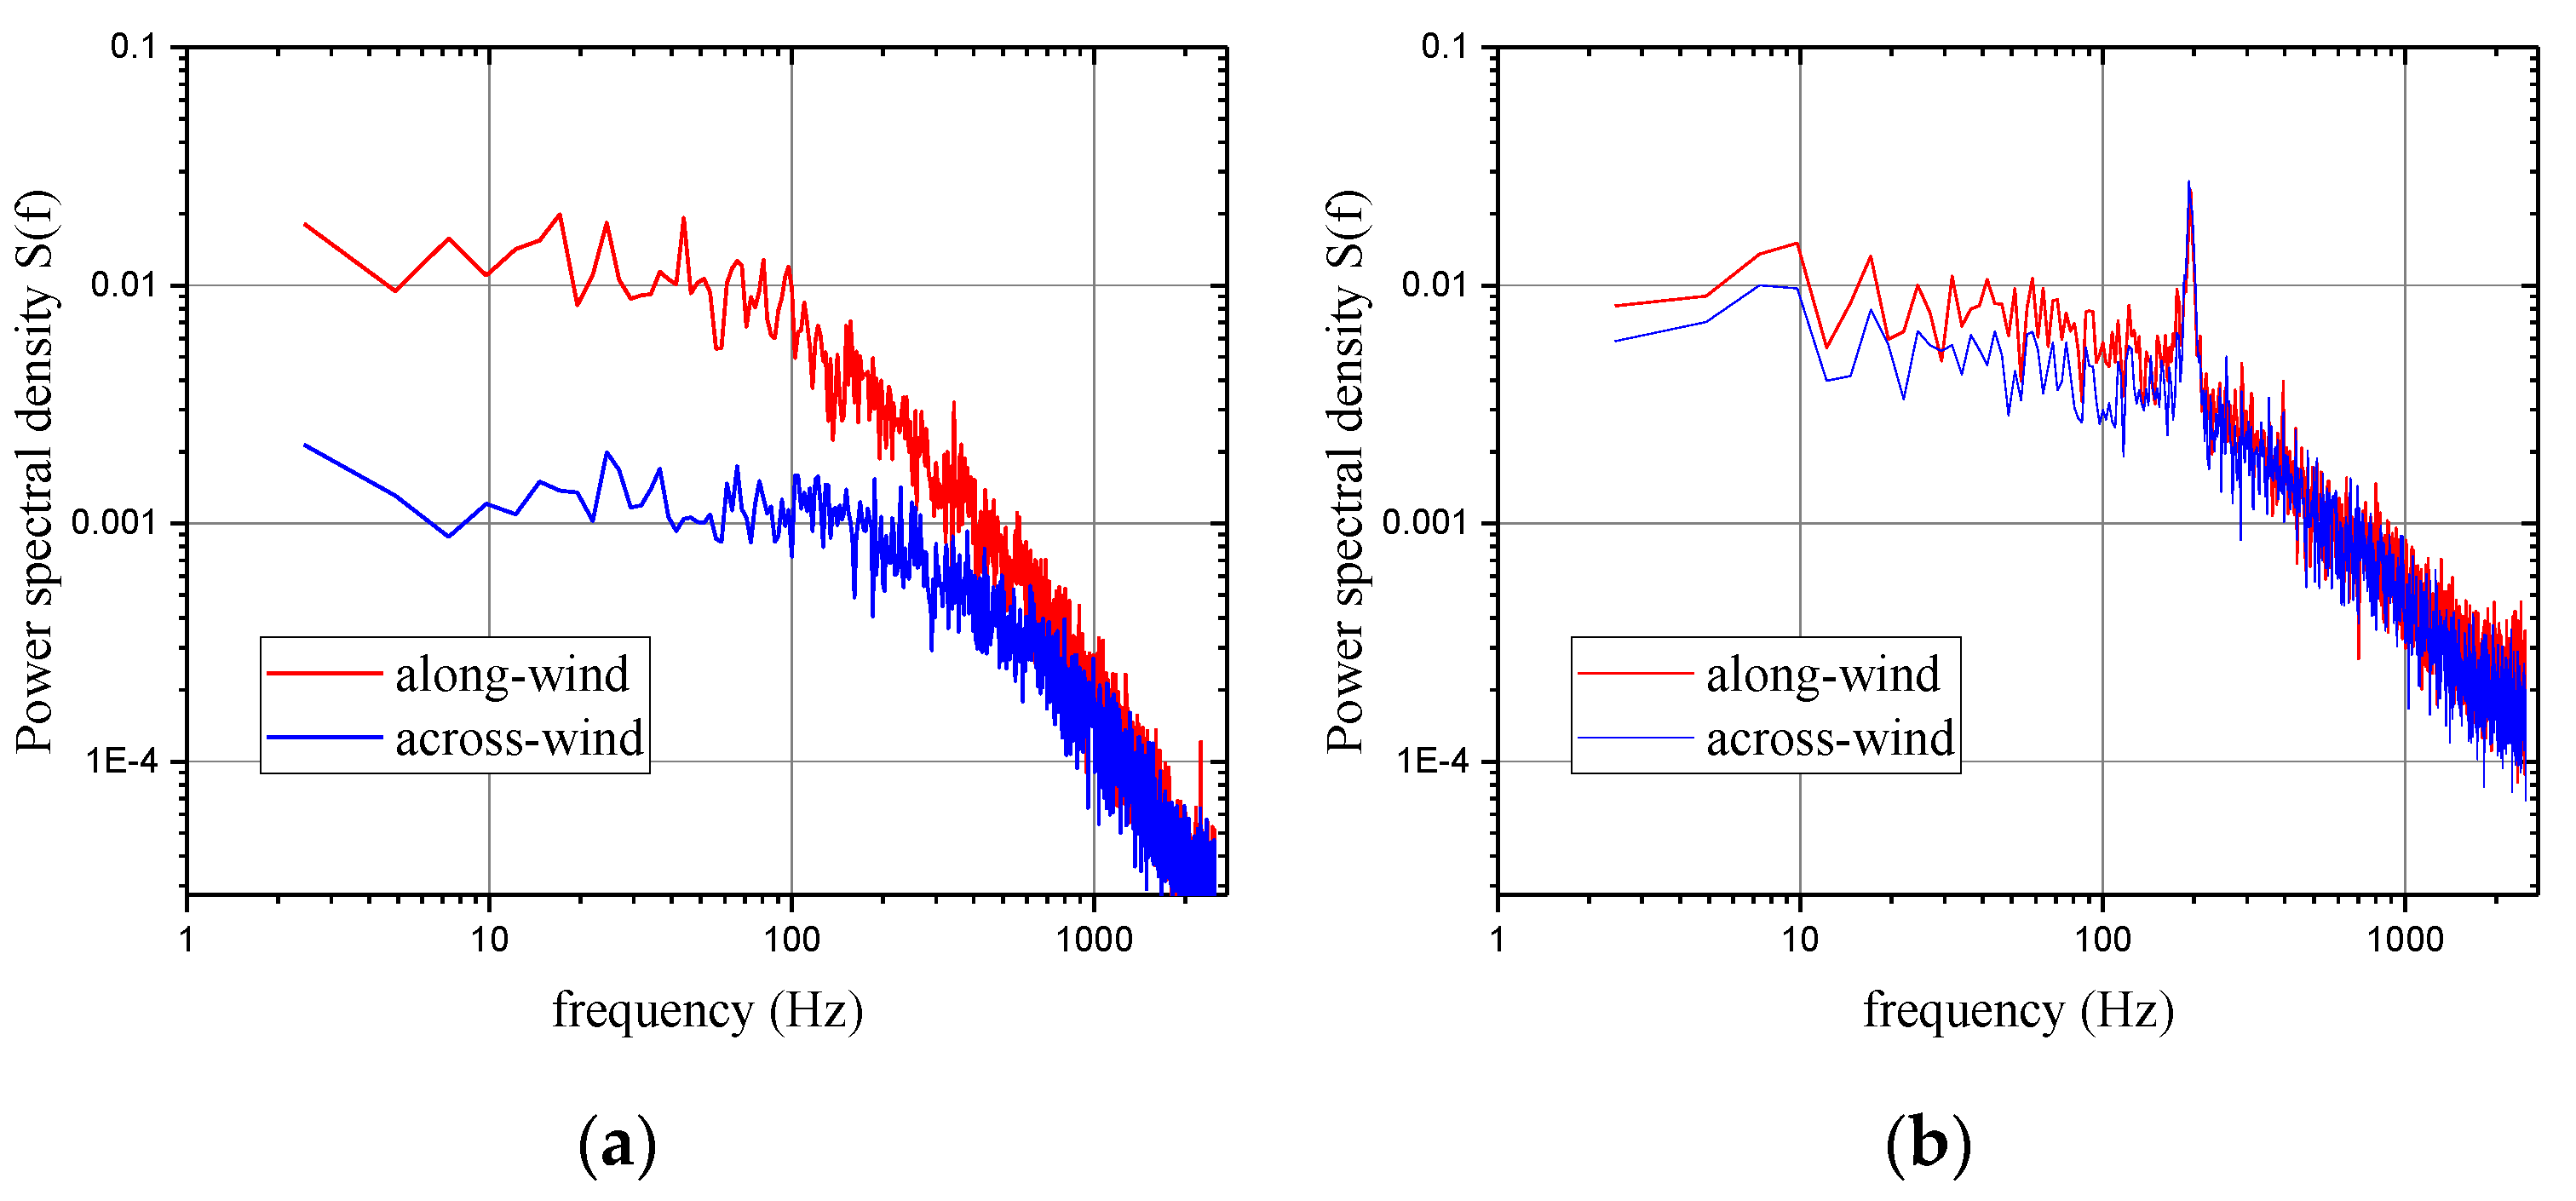
3.1. Experimental Results of Grille Turbulence Generator

The measurements were first conducted for the two grilles. Figure 7 illustrates the time series of the instantaneous velocity at the central measuring point of the 6th section. As shown in Figure 7, the incoming wind became highly disturbed, for this reason, a statistical analysis was done for the flow field. The decay of turbulence intensity from the grilles towards the airfoil test section was reported in Figure 8a. Within the scope of the test, the averaged turbulence intensity was recorded along 8 downstream sections (each measured with 15 points). Besides, the margin of error in Figure 8a was expressed as the standard deviation of each section data. According to Figure 8a, the average turbulence intensity of downstream in scheme one dropped from 13.5% at the position of 1.0 m behind the grille to 9.4% at the position of 2.0 m; the average turbulence intensity of the downstream in scheme two was higher than scheme 1, which decreased from 27.7% at the position of 1.0 m behind the grille to 15.9% at the position of 2.0 m. The standard deviations of turbulence intensity of the two schemes drops quickly towards the test section. The change in turbulence level indicates that there were very high turbulence fluctuations just behind the grille which yielded very unstable flow field. The flow became gradually stabilized owing to the mutual dissipation over a propagation distance. To ensure a homogeneous and isotropic turbulent field, so the distance 1.6 m (from the leading edge of the airfoil to the grille) was selected for placing the leading edge of the airfoil. The turbulence intensity measured at the 6th section of the two schemes was 10.5% and 19.0%, respectively. Figure 8b illustrates the power spectral density (PSD) of the wind speed at the two grille schemes measured at the central measuring point of the 6th section (1.6 m measured from grille to the hot-wire probes). Obviously, the larger the turbulence intensity was generated, the larger the amplitude of the power spectral density was observed. Moreover, the power spectra amplitude in the downstream direction was consistent with the corresponding Karman spectra, and it dropped down rapidly after the frequency over 30 Hz, which suggests that the grille distance was more proportional to the turbulent kinetic energy.

3.2. Experimental Results of the Baseline Airfoil

To verify the accuracy of the experiment, the experimental data from the wind tunnel of LM Wind Power were selected as a reference [28]. The aerodynamic data of the DTU-LN221 airfoil under uniform inflow were measured in the LM wind tunnel experiment at the approximate Reynolds number of 1.5 × 10⁶. The lift and drag data were selected as a cross-validation case. In consideration of the interference effect of wind tunnel wall, the maximum blockage ratio in this experiment was about 8.4%, so the experiment measured data of the airfoil were corrected by after the reference [29], and the experimental data analyzed below were all corrected. In order to perform a comparison, Figure 9 shows the comparison of experimental data of the DTU-LN221 airfoil under uniform inflow condition. To minimize the uncertainty, measurements were performed several times for comparison test at the approximate Reynolds number of 1.5 × 10⁶, YZU1, YZU2, YZU3 represents the results of the repeated experiments. As shown in Figure 9, the lift and drag coefficients were very similar before the stall angle, while there were some discrepancies in the stall state. Consider the cause of flow separation, the deviation of results of drag is quite considerable, but the stall angles tested in the two wind tunnels were nearly the same. The reason for this may be that although the airfoils were of the same type, they were individually manufactured, for example the roughness of the airfoil surface may affect the experimental results. Besides, there were some differences in drag measurements, LM adopted the model surface pressure distribution in a certain range of the angle of attack, while YZU used the wake probes at all angles. Similar phenomena were seen in different wind tunnel laboratories [30,31,32]. In the following, for reason of comparisons, the measured data are averaged.

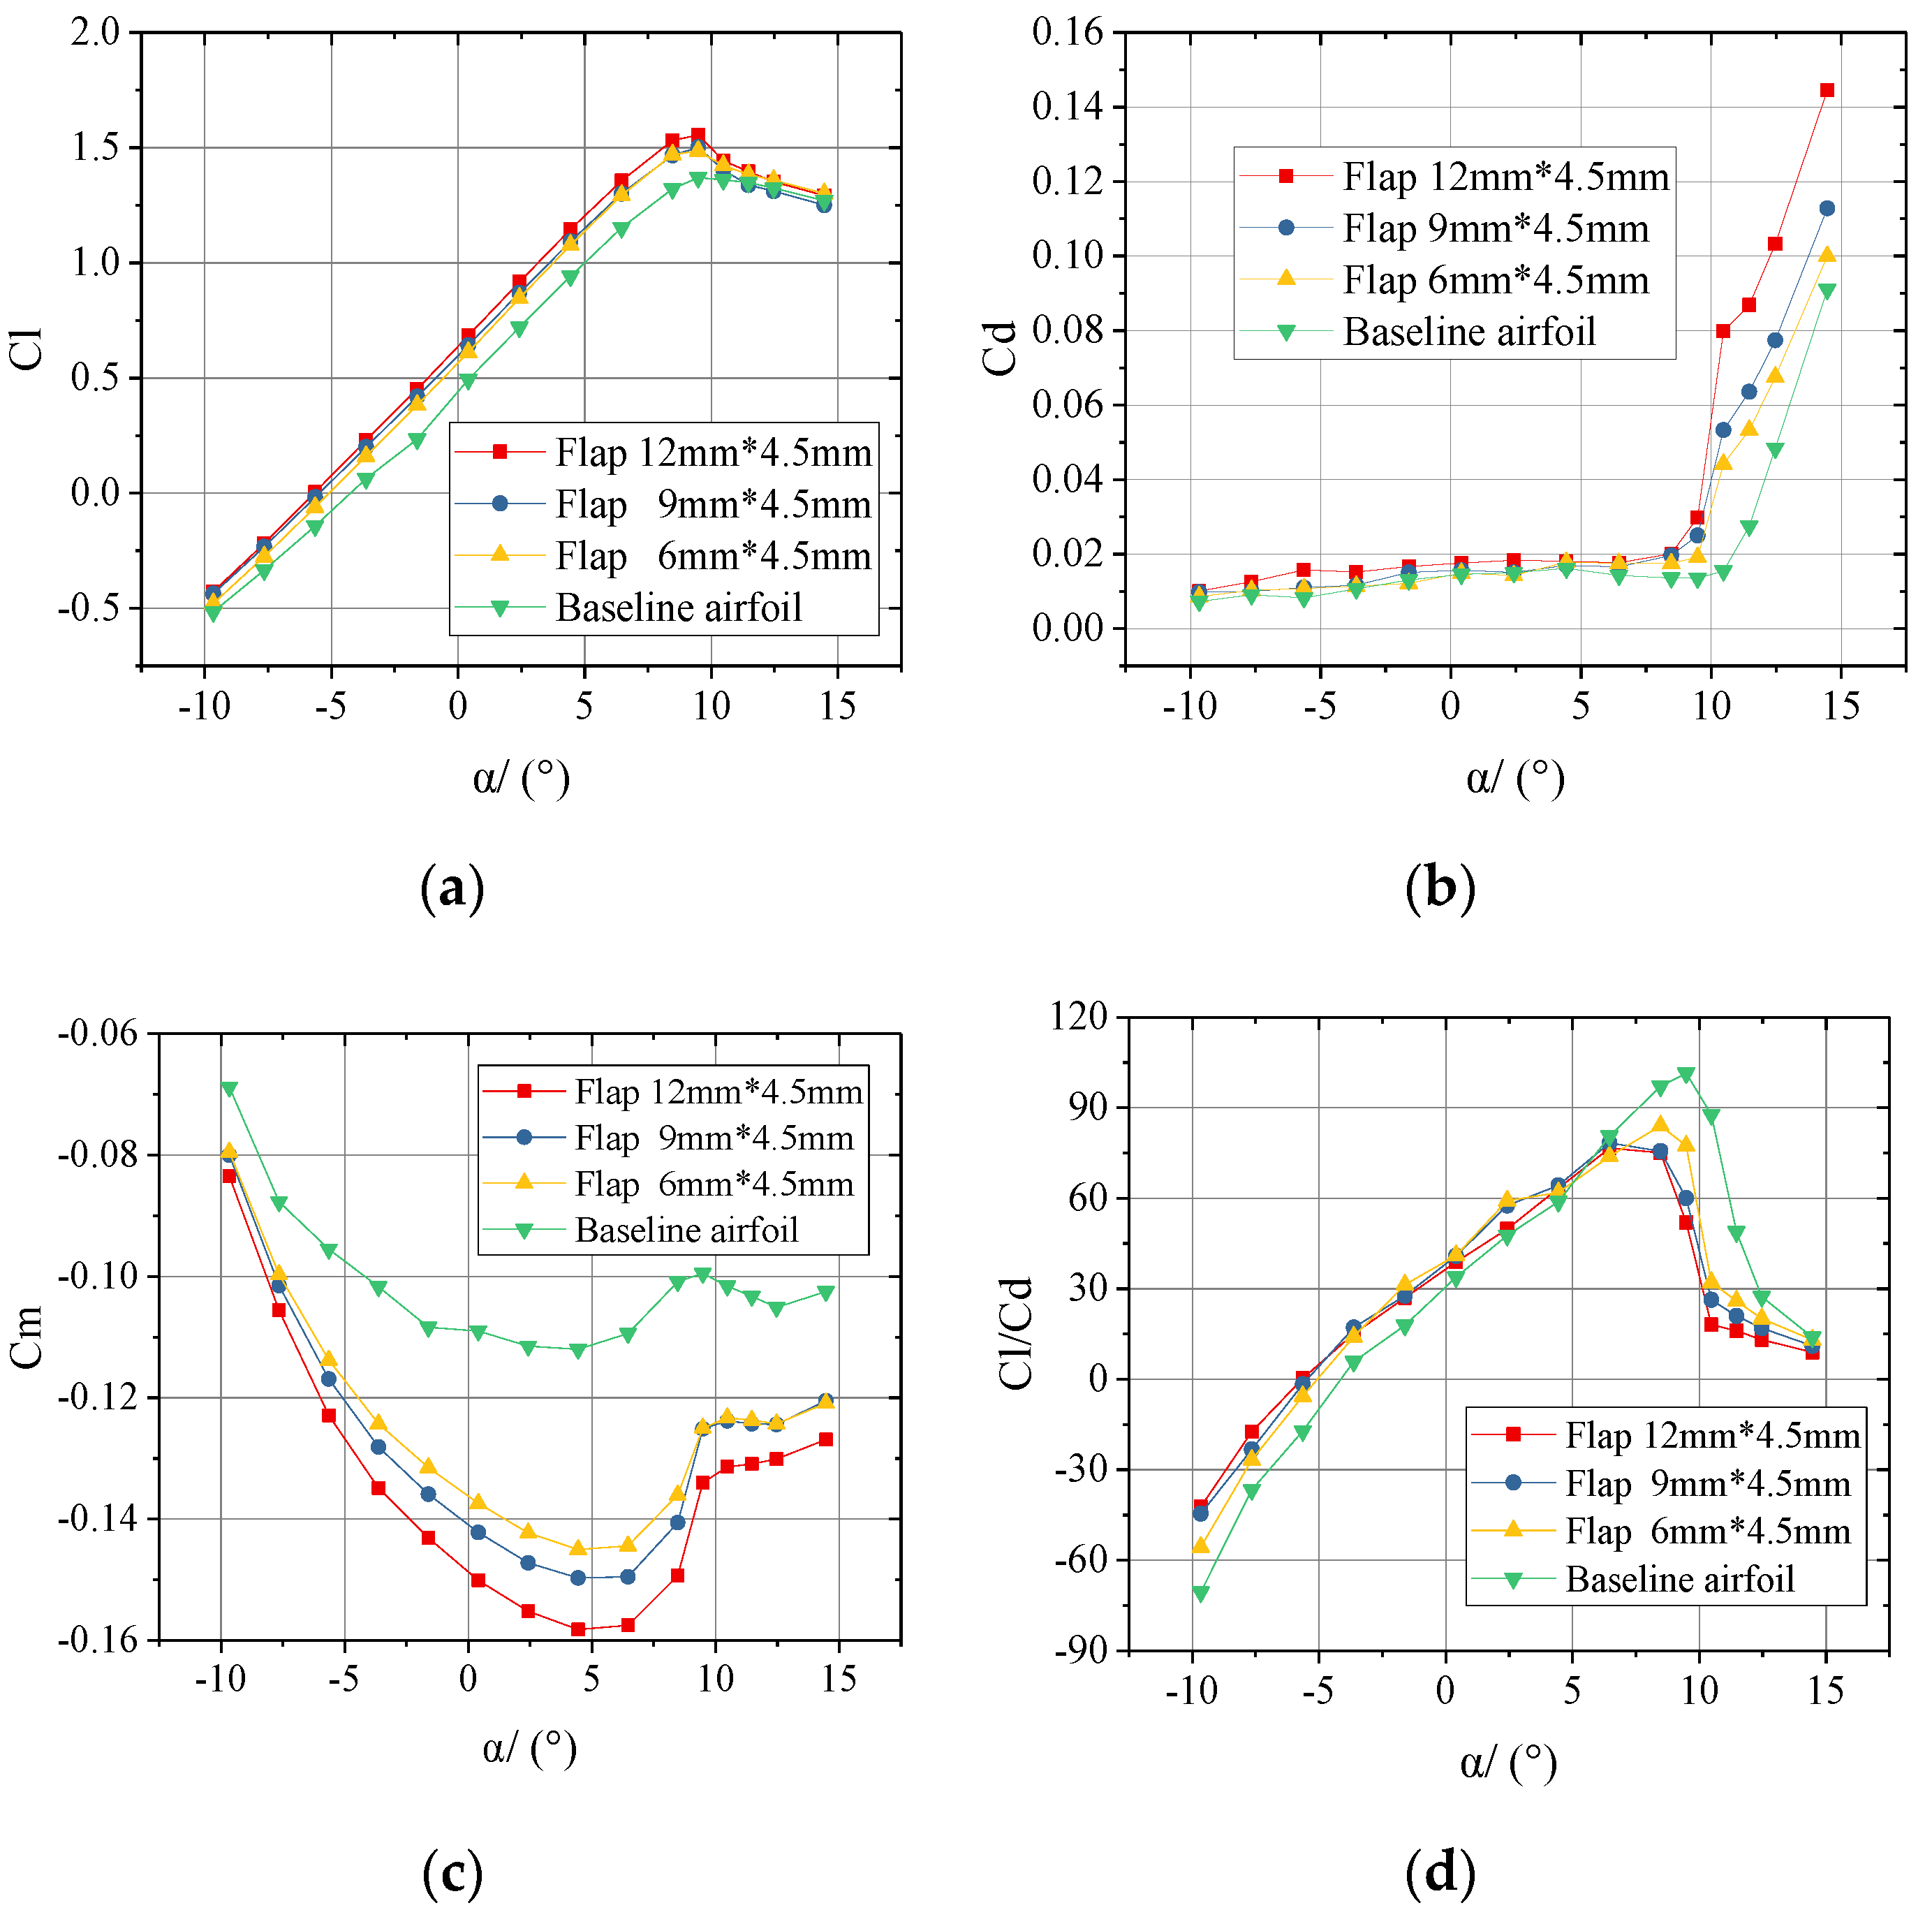
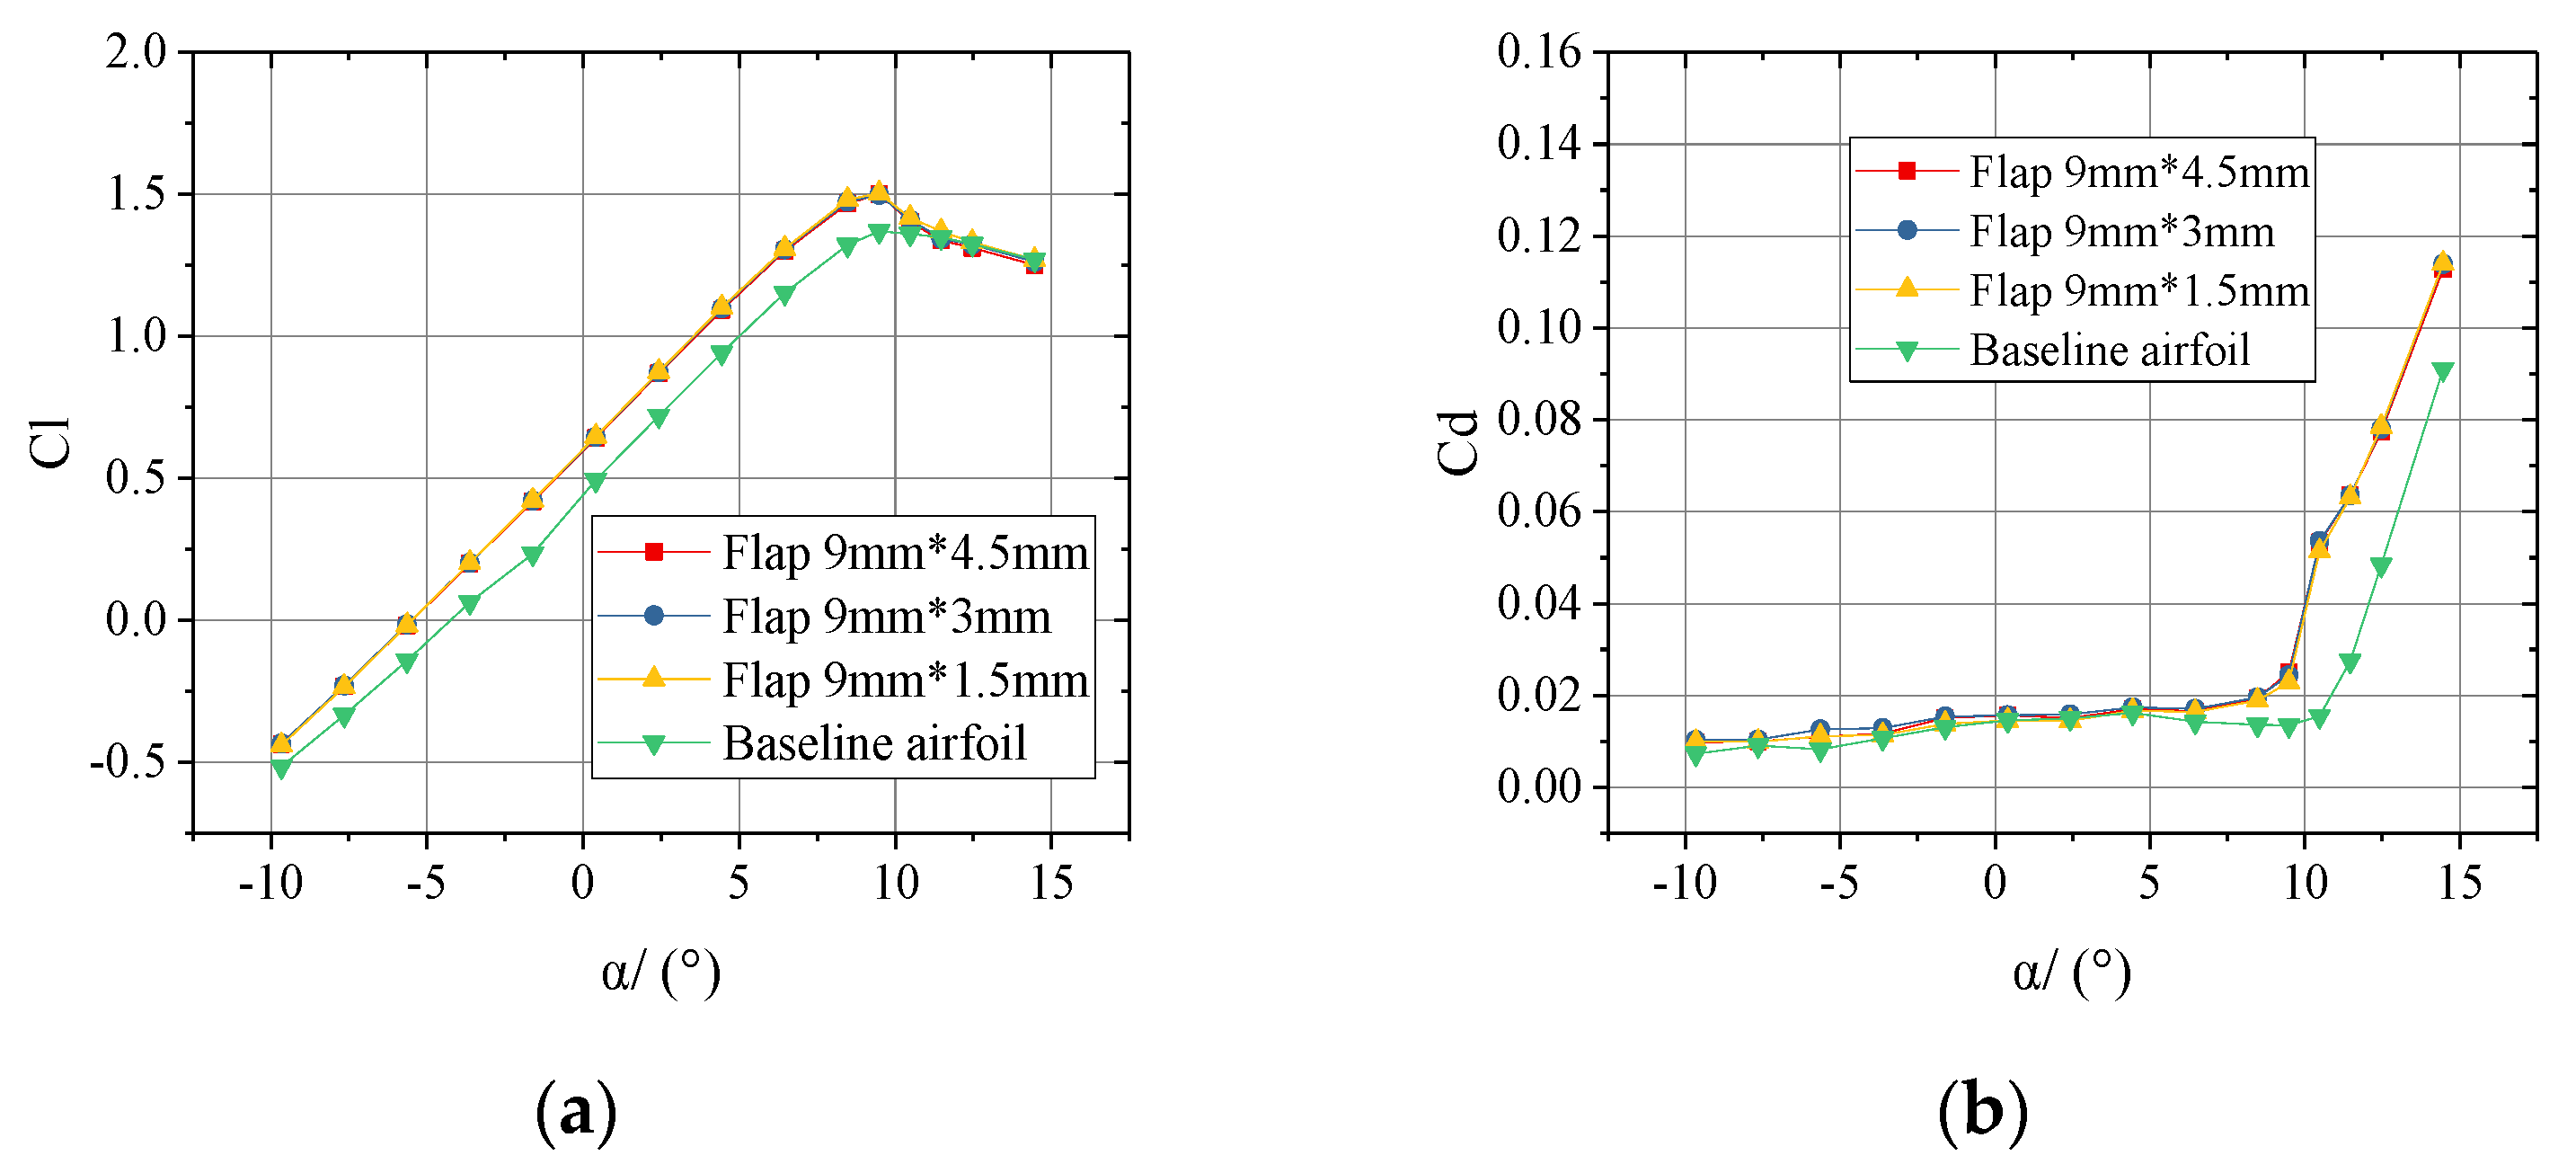
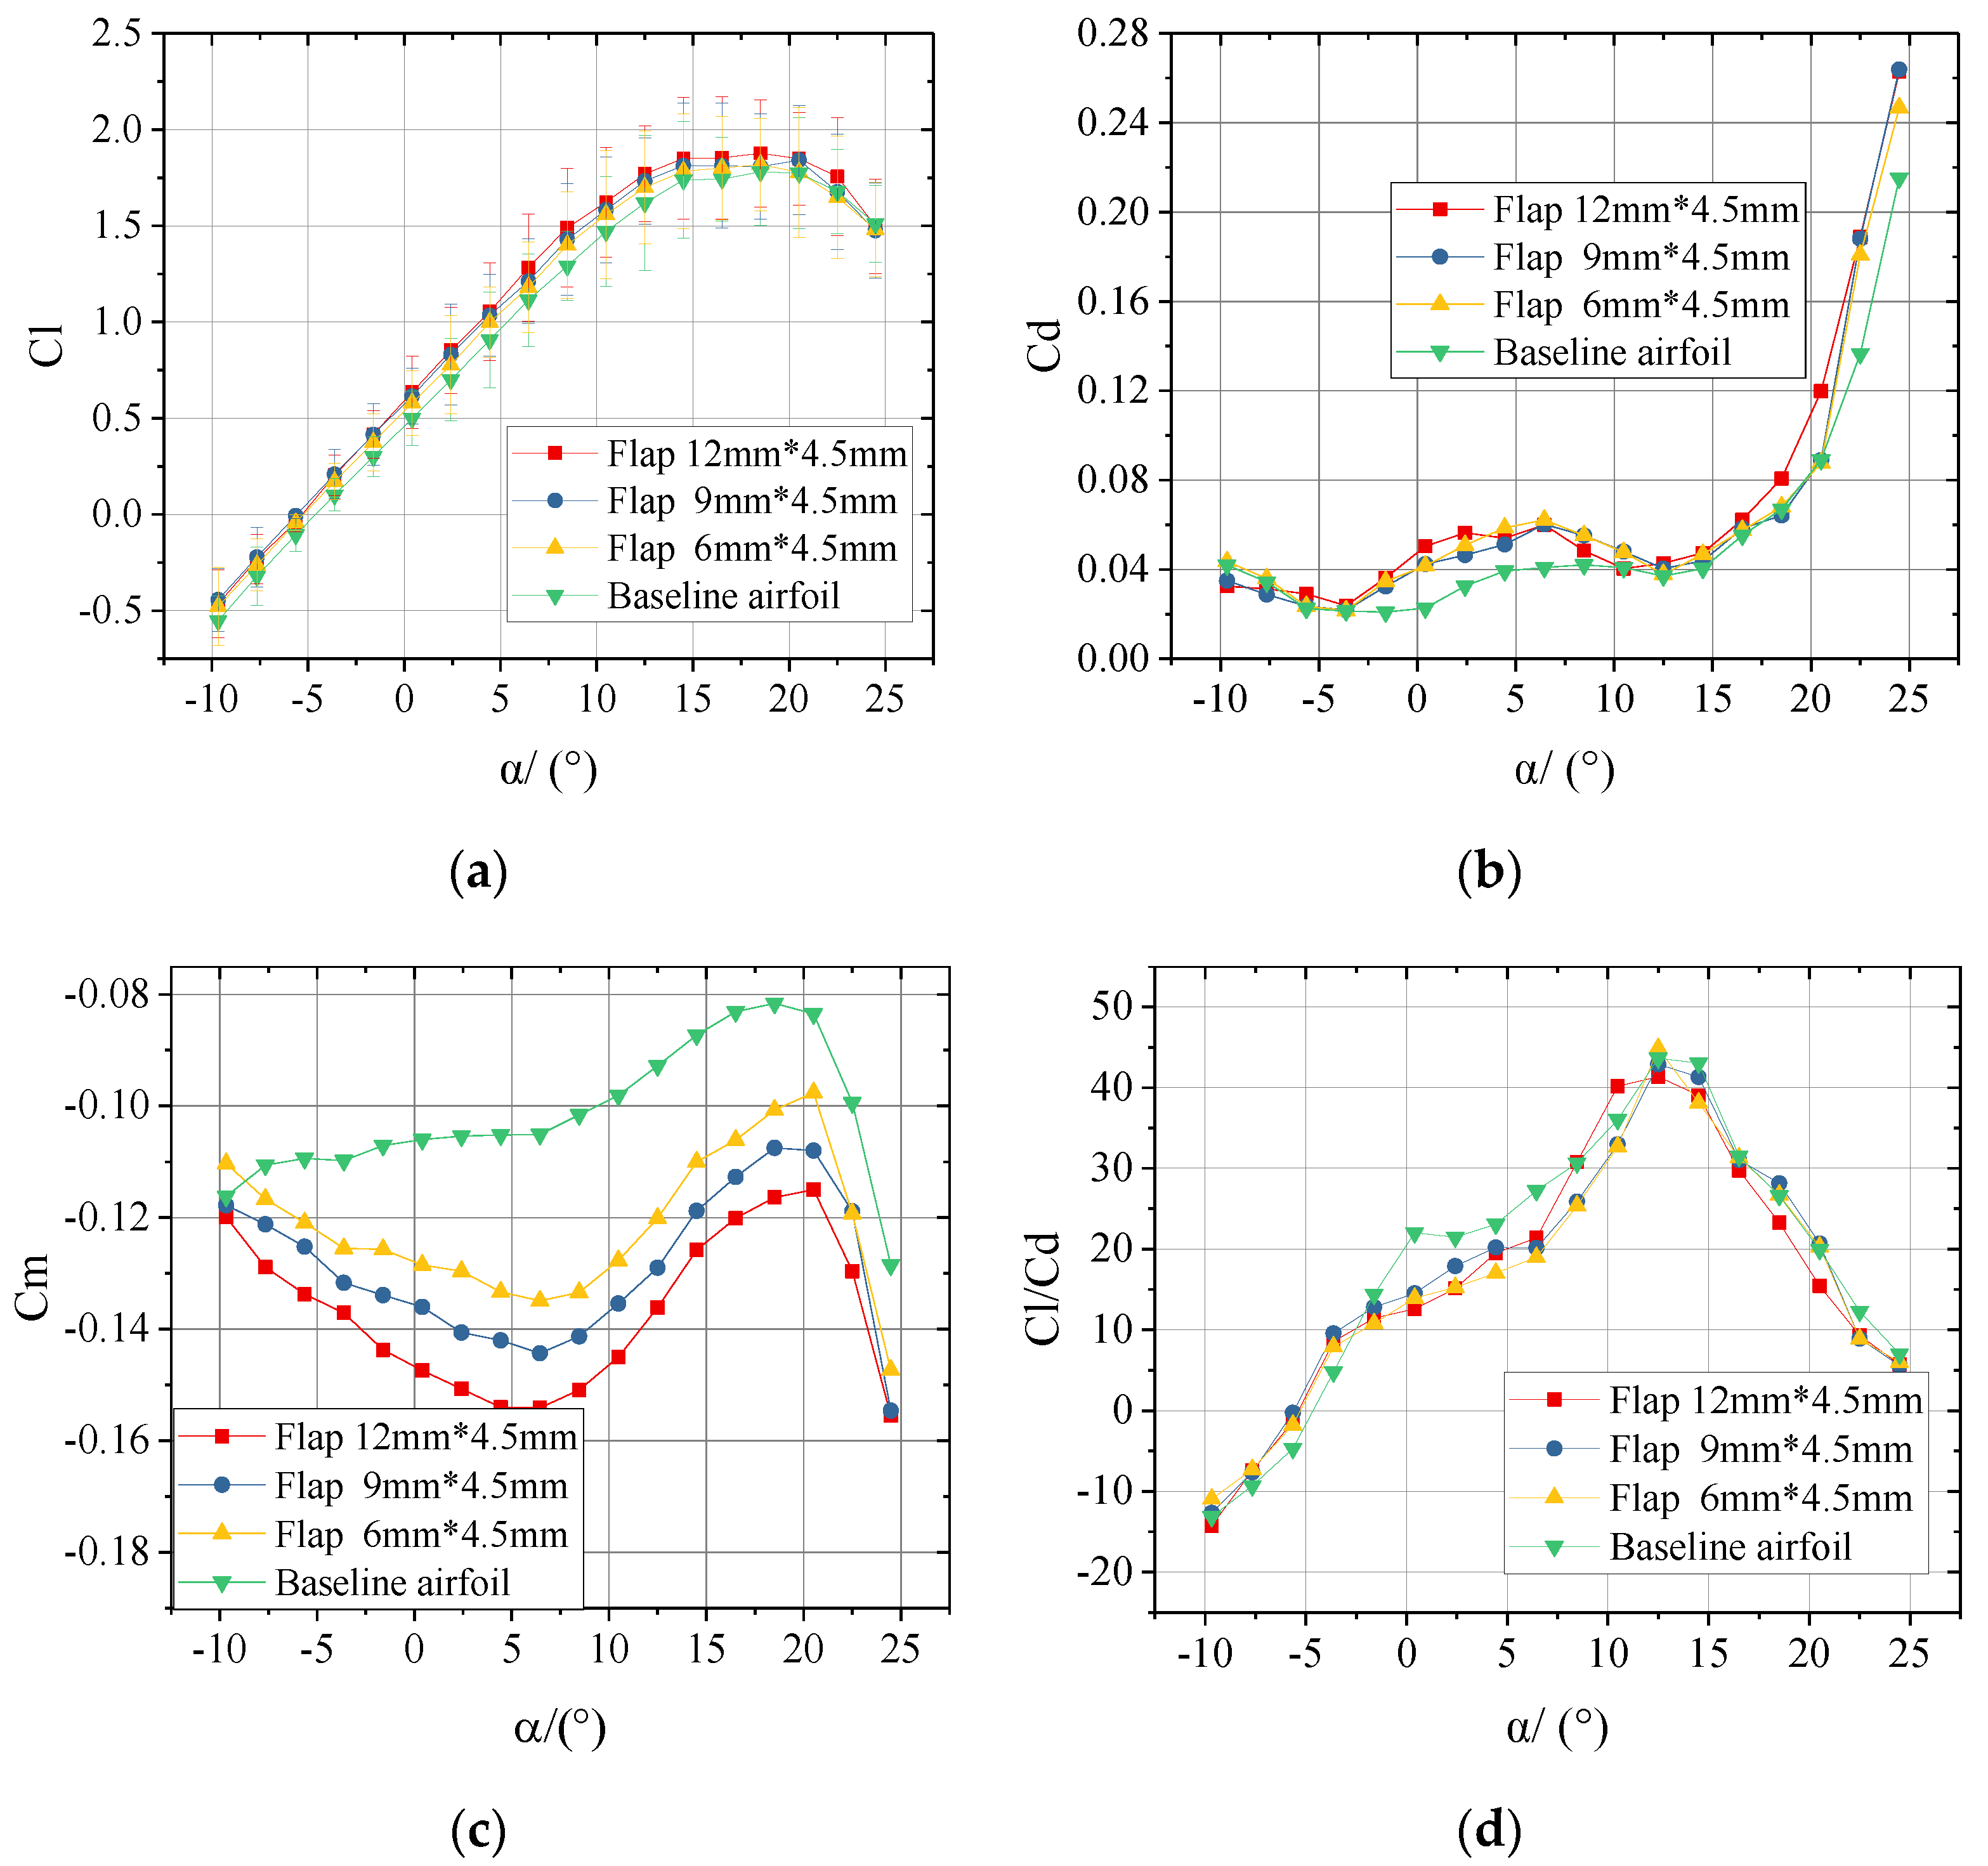
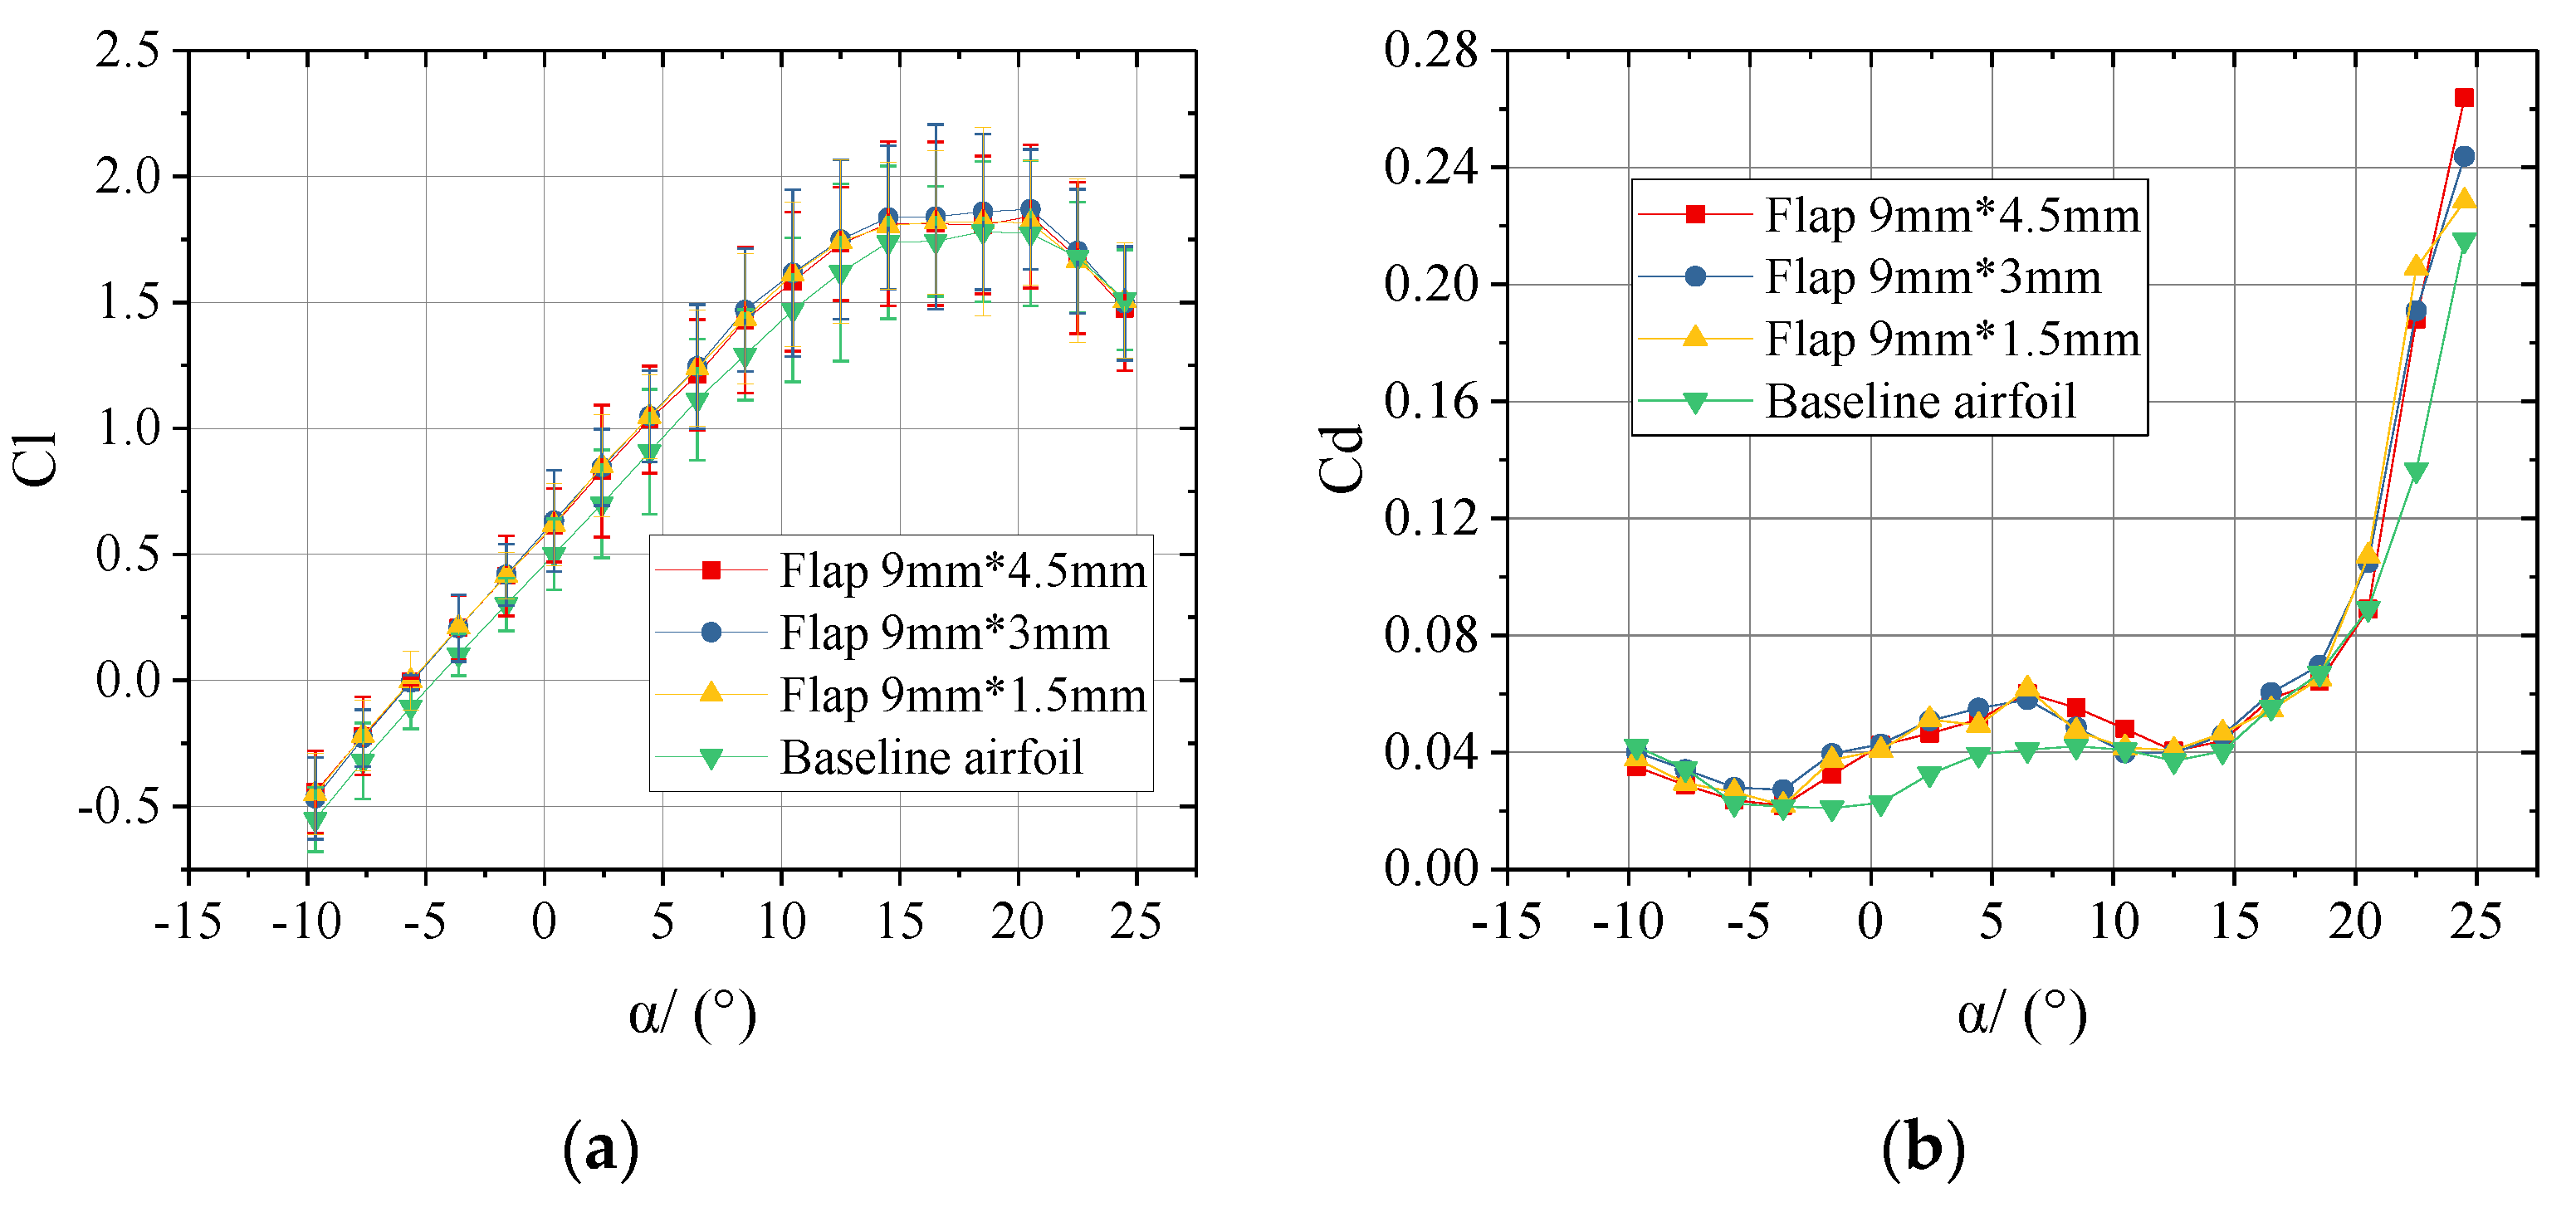
3.3. Experimental Results of the Gurney Flap under Uniform Inflow

This subsection starts to investigate the aerodynamic characteristics of the effect of Gurney flap in low turbulent inflow condition, the Reynolds number was decreased to 0.8 × 10⁶. Seen from the Figure 10, three lift and drag curves were compared with the original at the angle of attack ranged from −9.6° to 14.4°. As shown, the lift coefficients increased with the increase of the height of the Gurney flap before the stall angle, while it was also realized that the effect of the Gurney flap was limited at a high angle of attack. The lift coefficient slopes and the stall angles of the flapped airfoil remain essentially unchanged compared to the baseline airfoil, but the flapped airfoil caused a leftward shift compared to the baseline airfoil. In order to show the changes of aerodynamic characteristics clearly, the following lift and drag differences were defined:
Δ c l = | c l bs - c l gf | c l bs ×   100 %
Δ c d = | c d bs - c d gf | c d bs ×   100 %
Δ c l d = | c l d bs - c l d gf | c l d bs ×   100 %
where c l bs and c d bs are the lift and drag coefficients obtained from the baseline airfoil, respectively. c l gf and c d gf are the lift and drag coefficients obtained from the flapped airfoil. c l d bs and c l d bs are the lift-to-drag ratio obtained from the baseline airfoil and flapped airfoil.
When the flap height changes to 6 mm, 9 mm and 12 mm, the maximum lift coefficients were increased by 8.47%, 9.56% and 13.50% at 9.4 degrees, respectively. Looking into the drag coefficients shown in Figure 10b, within the range of −9.6~10.4°, the drag coefficients show regular change where the frictional drag dominates as expected. The drag coefficients rise rapidly in the stall state, at this time the change in drag coefficient was dominated by pressure drag. For example, at an angle of attack of 12.4°, with the flap heights of 6 mm, 9 mm, 12 mm the drag coefficients were increased by 39.67%, 59.92% and 113.43%, respectively. According to Figure 10c, the Gurney flap generated a prominent increase in the pitching-moment coefficient compared to the baseline airfoil, the value increased with the heights of the Gurney flaps and reached negative peak values at approximately 4.4°. Based on Figure 10d, the lift-to-drag ratios were compared. When the angle of attack was less than 8.4°, the lift-to-drag ratios were all larger than the baseline airfoil. However, the maximum lift-to-drag ratios of the Gurney flap at three heights were smaller than the baseline airfoil. When the flap heights were 6 mm, 9 mm and 12 mm, the corresponding maximum lift-to-drag ratios were decreased by 17.16%, 22.79% and 24.47%, respectively. In the range after the stall angle, the presence of the Gurney flap reduces the lift-to-drag ratios and the higher the flap height, the more the lift efficiency decreases. When the angle of attack was 12.4°, for example, the lift-to-drag ratios of the flap with heights of 6 mm, 9 mm and 12 mm were decreased by 26.55%, 38.11% and 52.20%, respectively. Meanwhile, we observed the same trend from the other thicknesses of the Gurney flaps (i.e., of 1.5 mm), When the flap height changes to 6 mm, 9 mm and 12 mm, the maximum lift coefficients were increased by 9.27%, 9.78% and 14.08% at 9.4 degrees.
The following study in this section will be focused on the effect of the thickness of the Gurney flap. Figure 11 illustrates the changes in the aerodynamic characteristics of the baseline airfoil and airfoil with a height of 9 mm of Gurney flaps under uniform flow. As seen from the figure, by changing the thickness of the Gurney flap, the lift-to-drag curves of the flapped airfoils with different thicknesses almost overlaps, it seems that the flap thickness does not have obvious effect in the aerodynamic performance. The results imply that the small increase of the flap thickness does not change the degree of downward turning of the mean flow and recirculation flow around the trailing edge of the airfoil.

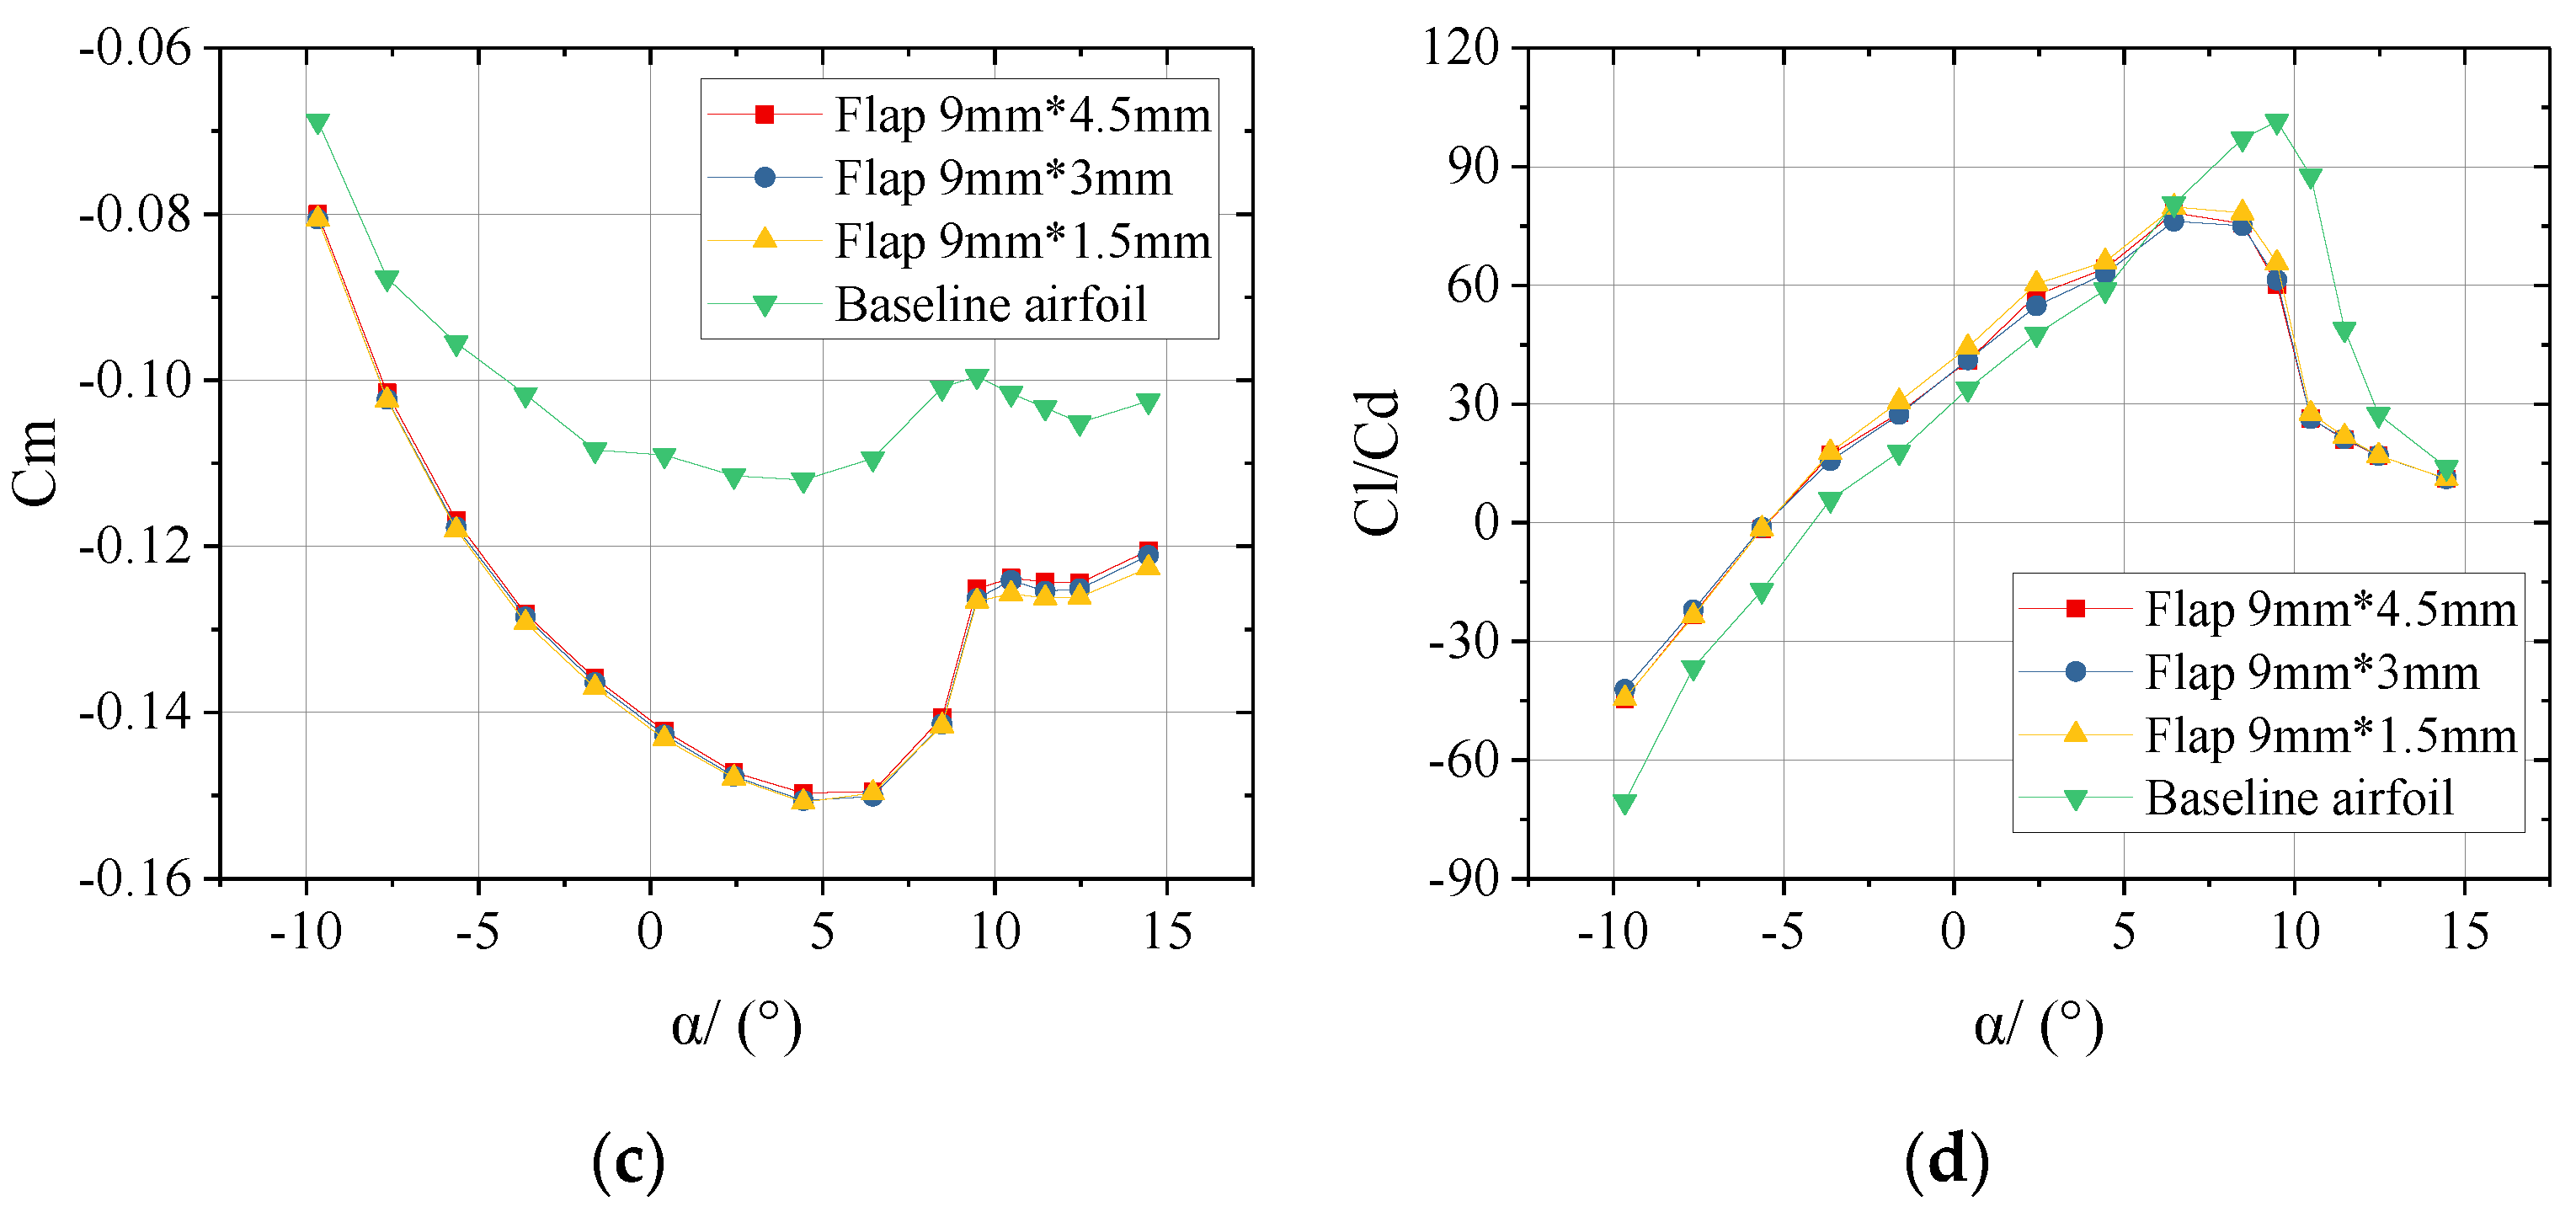
3.4. Experimental Results of Gurney Flap under 10.5% Turbulence Intensity

This subsection starts to investigate the aerodynamic characteristics of the Gurney flap under a turbulent inflow with an intensity of 10.5%. Figure 12 shows the changes in the aerodynamic characteristics of the baseline airfoil and the Gurney flaps with a thickness of 4.5 mm when the turbulence intensity of the incoming flow was 10.5%. The measured angle of attack ranged from −9.6° to 20.4°. As shown, under the present turbulence intensity of 10.5%, all cases induced a stall delay. The stall angle was nearly delayed from the original 9.4° to about 16.4° under turbulent flow. In Figure 12a, with the increase of turbulence intensity, the maximum lift coefficient of the baseline airfoil reaches 1.611 and increases by 17.59% as compared with uniform inflow condition. An interesting observation was that in such a turbulence environment, the lift coefficients were not significantly different from each other under the current three flapped configurations. For the flap heights of 6 mm, 9 mm and 12 mm, the maximum lift coefficients were increased by 15.21%, 17.19% and 17.26% at 18.4 degrees, respectively. The increase rate was found larger than that under the uniform turbulence condition. The margin of error in Figure 12a was expressed as the variance of the time-averaged lift coefficient. As can be seen from the Figure 12a, the pressure uncertainty increased with the increase of the angle of attack, and the lift coefficient fluctuations caused by the pressure fluctuations were the most obvious pronounced when the attack angle reaches the stall angle. According to Figure 12b, the increase in the lift of the flapped airfoil was at a cost of increasing drag. The drag coefficient of the flapped airfoils was also non-linearly raised in the stall state. For example, when the angle of attack was 20.4°, the drag coefficients were increased by 12.50%, 37.50% and 44.53%, respectively. As can be seen from Figure 12c, compared with the baseline airfoil, the Gurney flap also generated a prominent increase in the pitching-moment coefficient, the negative peak values delay to about 6.4°compared with the uniform inflow condition. As demonstrated in Figure 12d, the peak value of the lift-to-drag ratio becomes less as compared with the uniform flow condition in all cases. Unlike the low turbulence condition, the maximum lift-to-drag of Gurney flap with different heights slightly increased relative to the baseline airfoil. The maximum lift-to-drag raised 14.35%, 9.15% and 2.74% respectively when the flap heights were 6 mm, 9 mm, and 12 mm, respectively, with the maximum lift-to-drag ratio occurred at the smallest flap height. Besides, in contrast to the situations of 1.5 mm thickness of the Gurney flaps, the Gurney flaps also achieved a lift increase under 10.5% turbulence intensity. The maximum lift coefficient was increased by 14.77%, 14.83%, and 16.44% for height equals to 6 mm, 9 mm and 12 mm, respectively. The two thickness configurations both had maximum lift-to-drag efficiency at 6 mm height, for the three heights, respectively.
In addition, the effects of various flap thicknesses were investigated. Figure 13 indicates the change of the aerodynamic characteristics of the baseline airfoil and airfoil with a height of 4.5 mm of the Gurney flaps when the turbulence intensity was 10.5%. As Figure 13 shows, like low turbulence conditions, after changing the thickness of the Gurney flap under turbulence condition of 10.5%, the aerodynamic characteristics of flapped airfoil almost show no change. The main difference in the Figure 13d was concentrated in the large lift-to-drag ratio zone, obviously because the pressure fluctuations caused by the turbulence and the flow separation at the airfoil surface result in the deviation of the measurement.

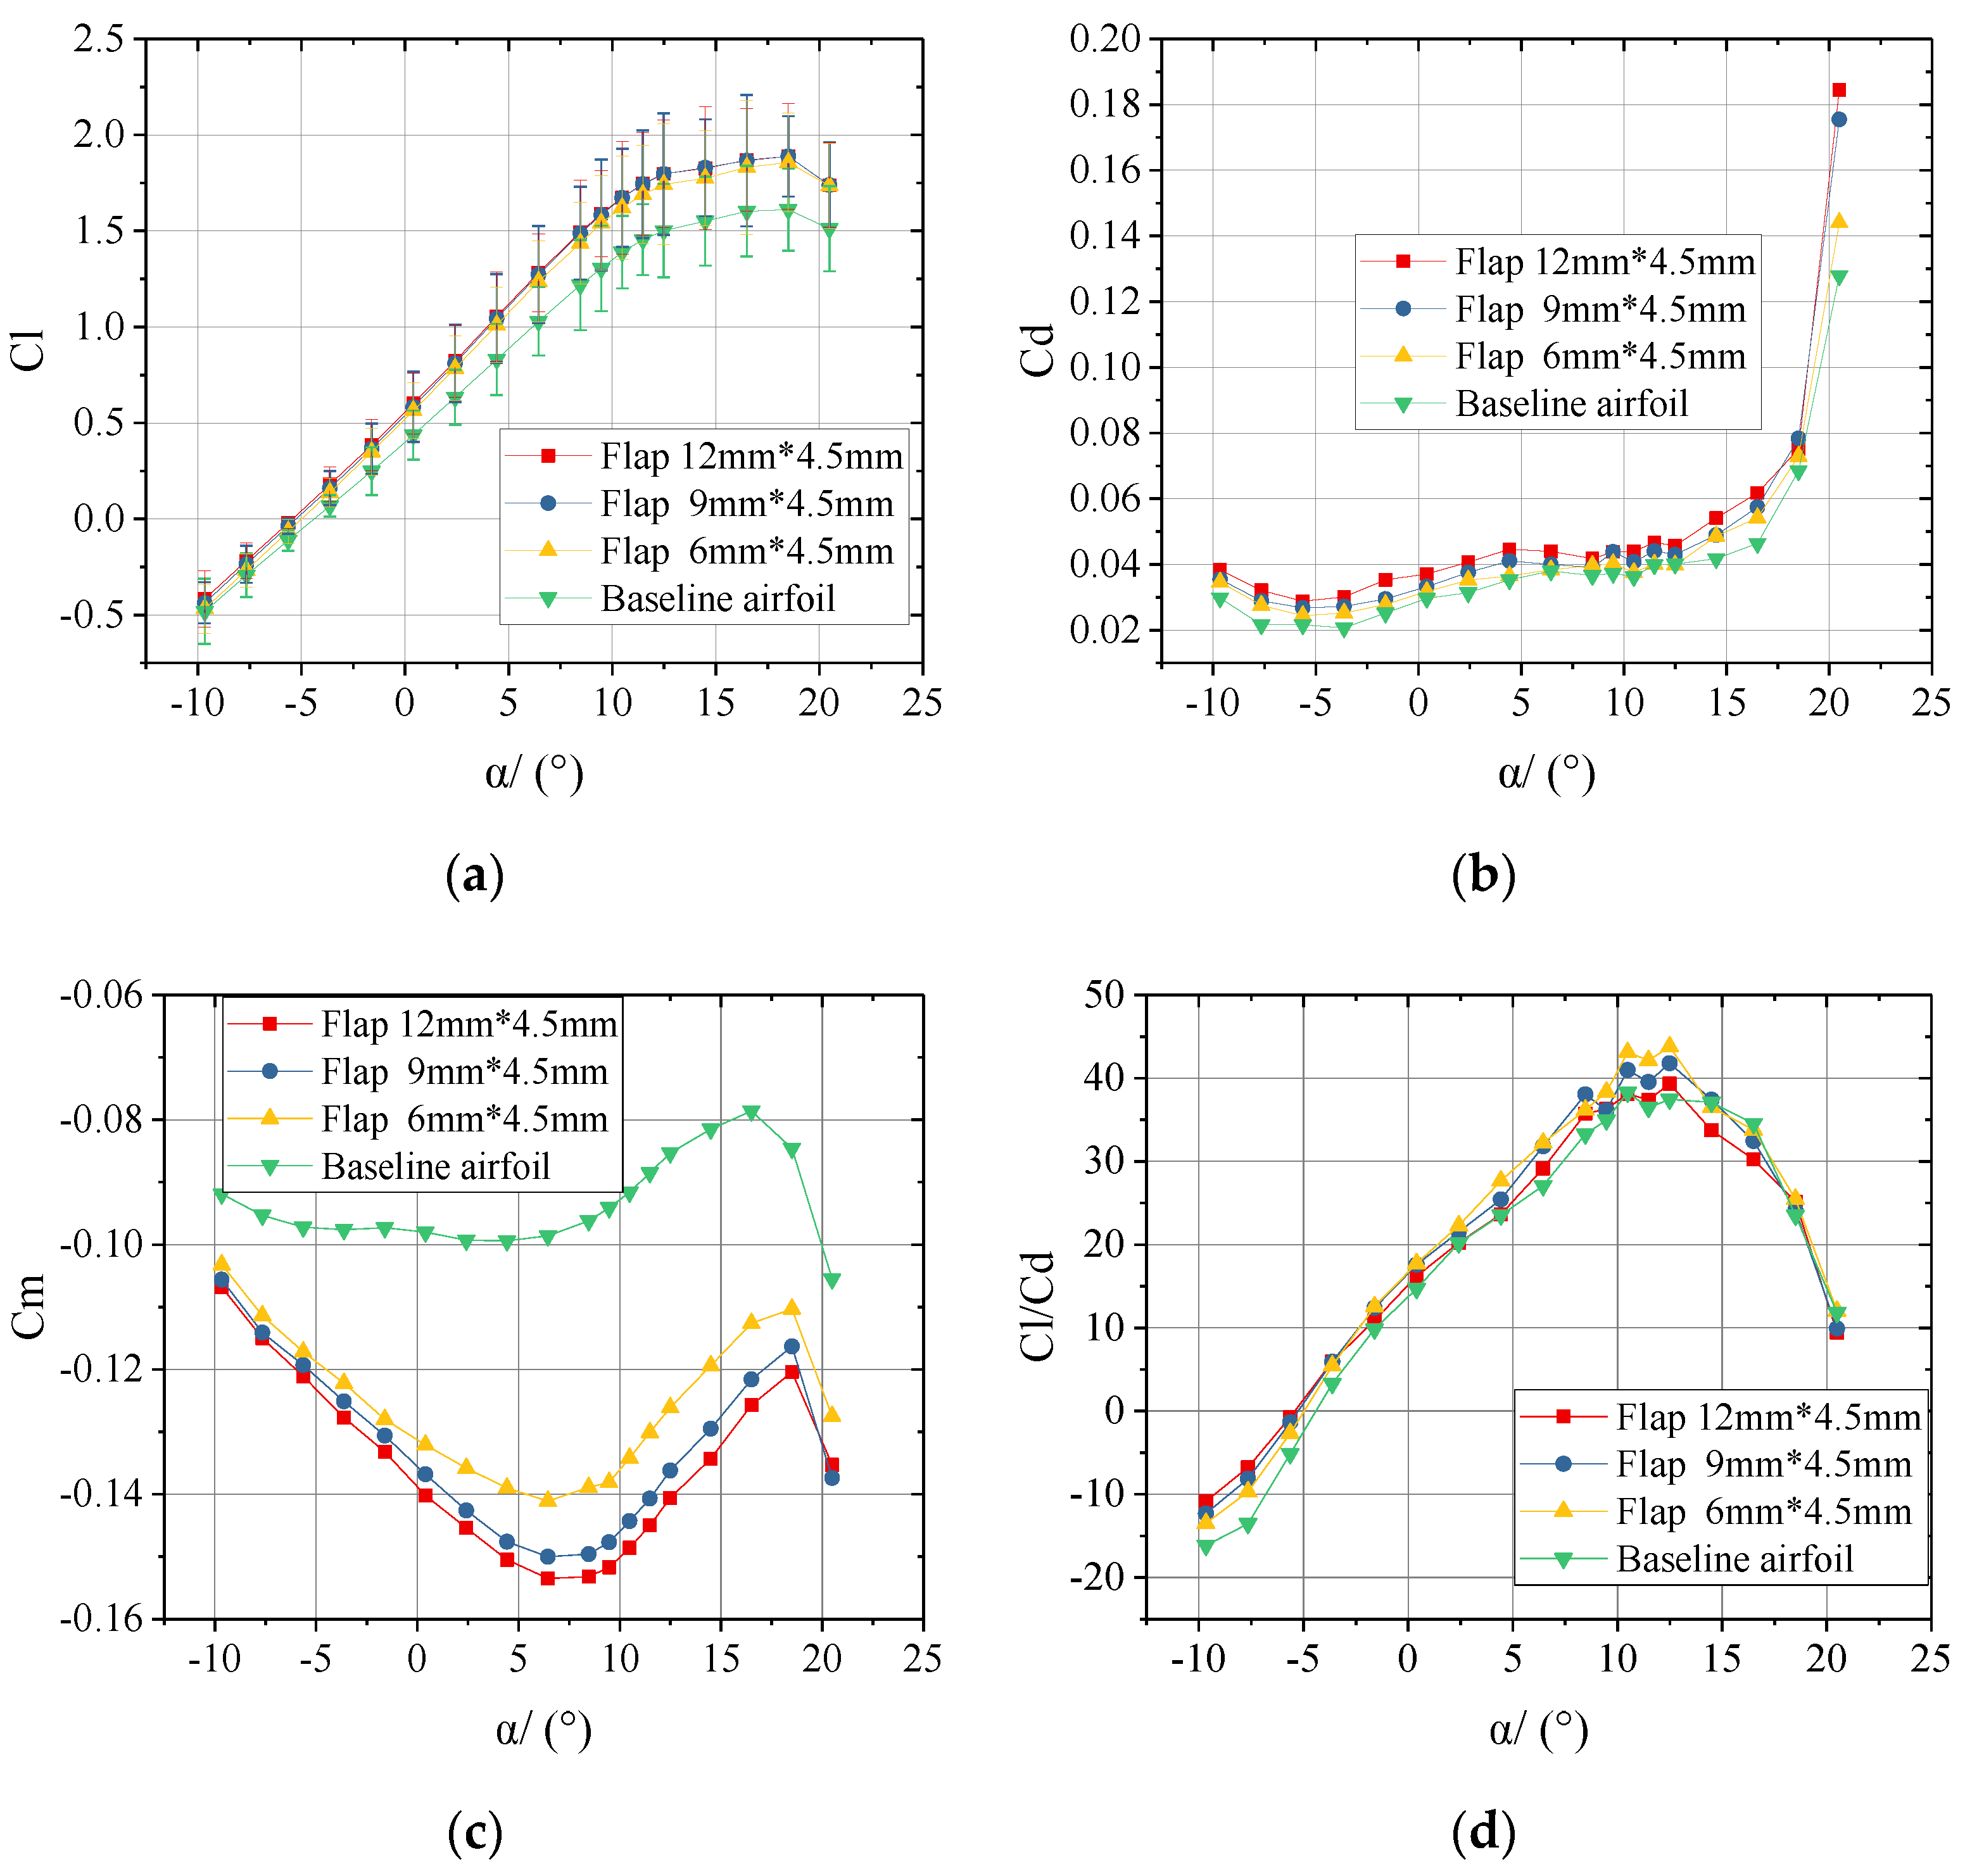
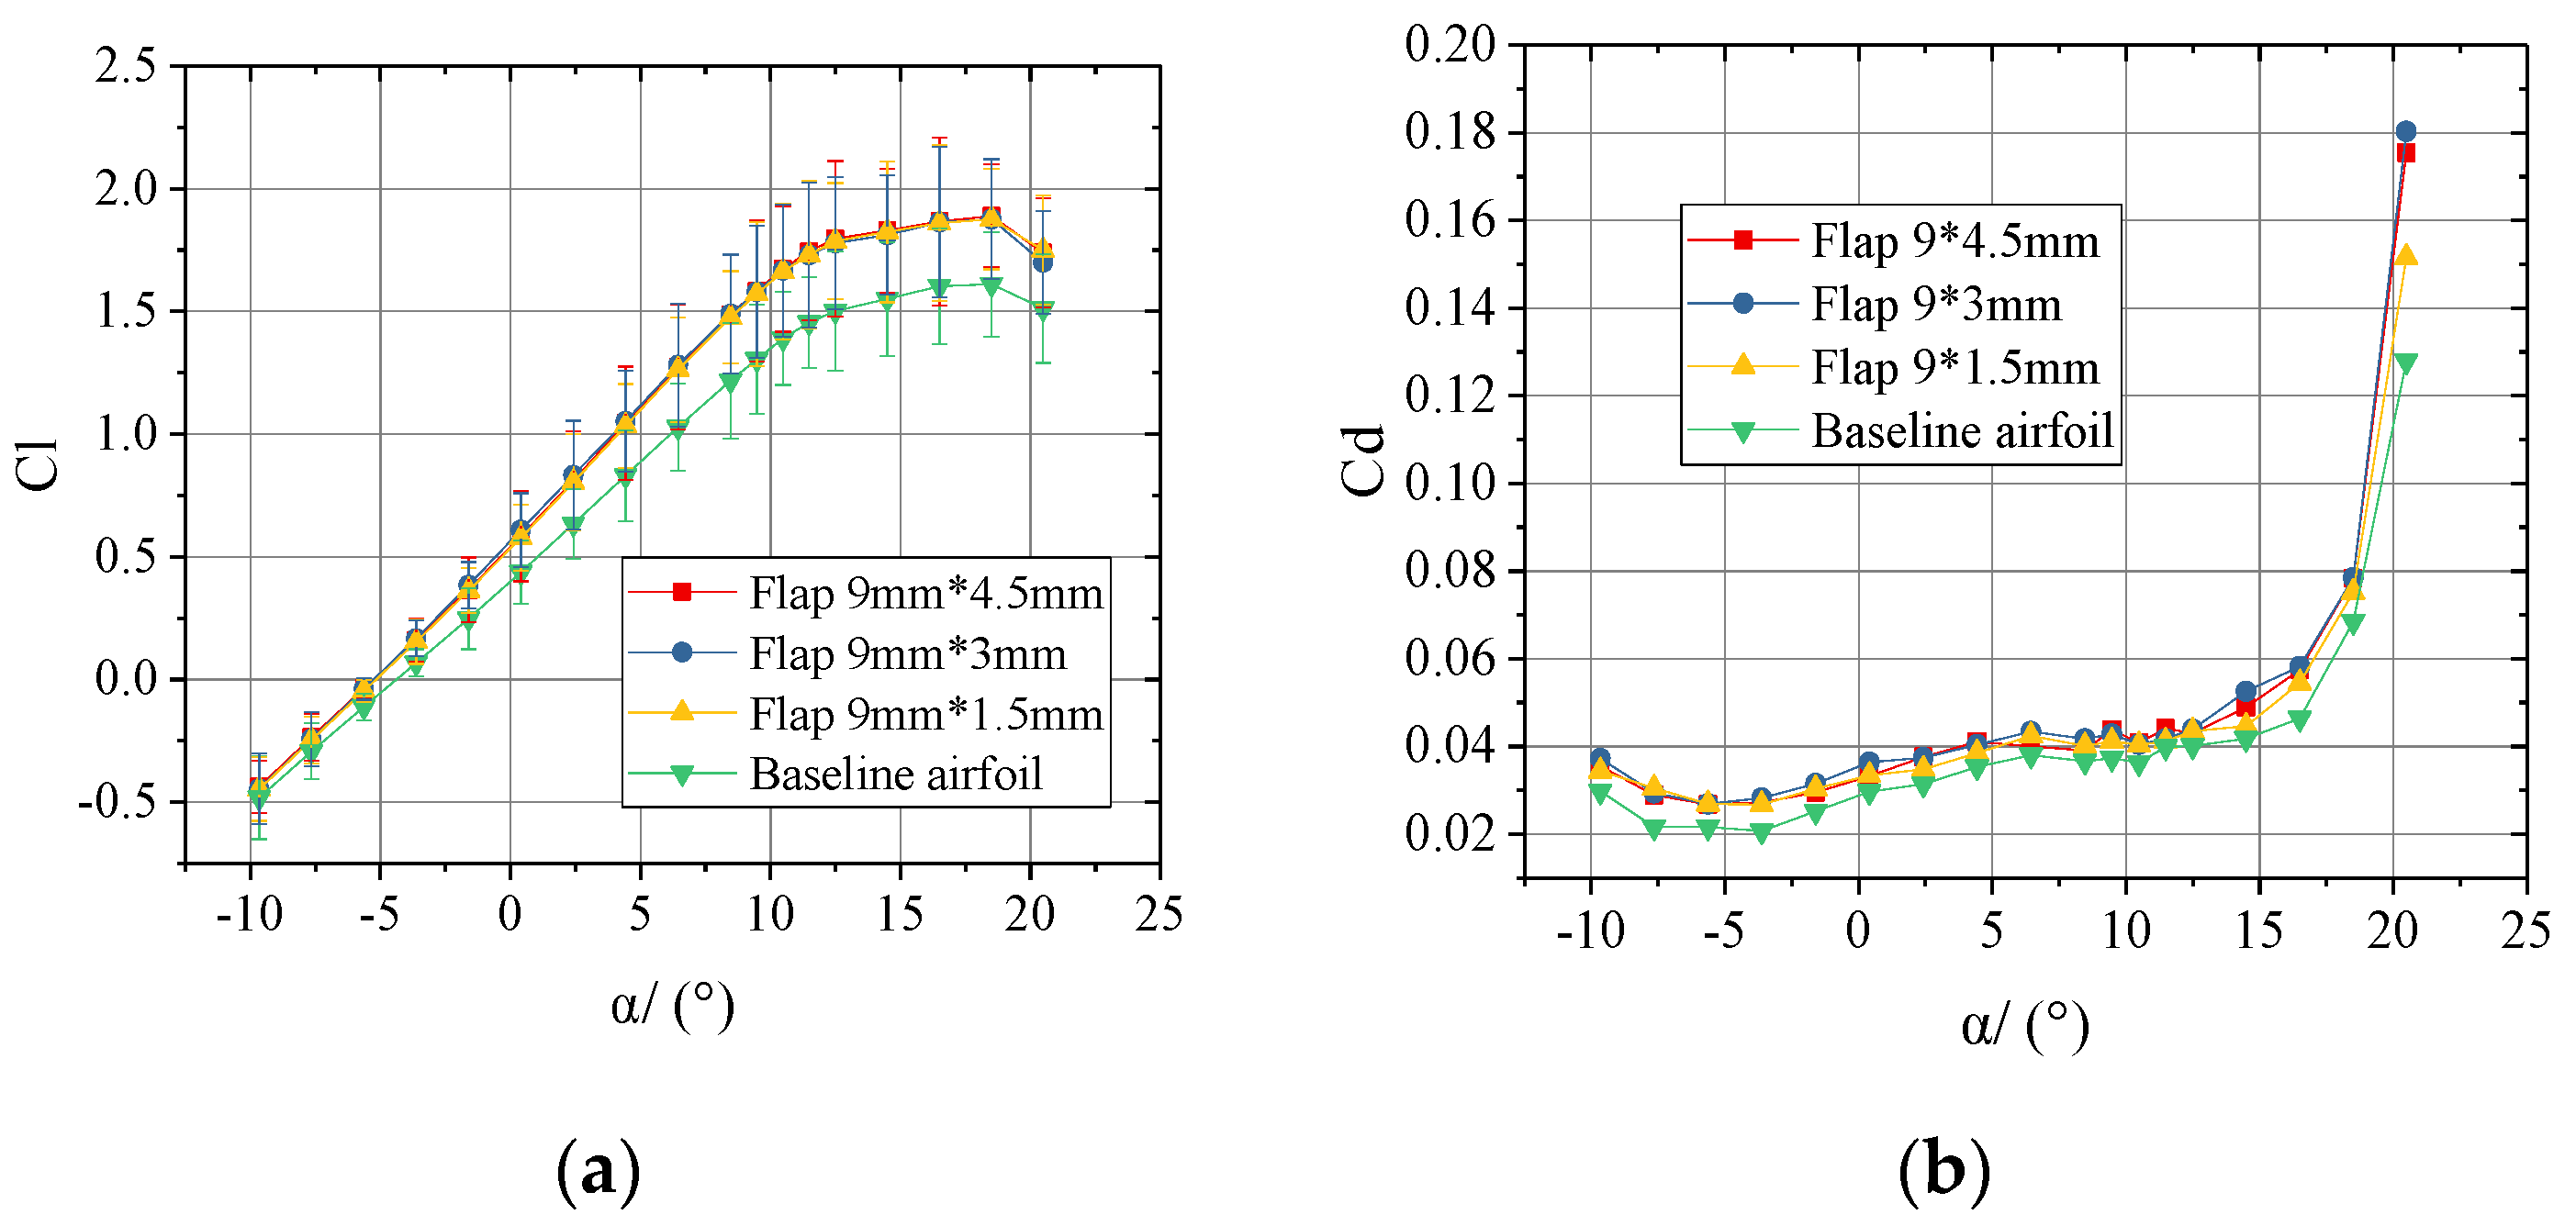
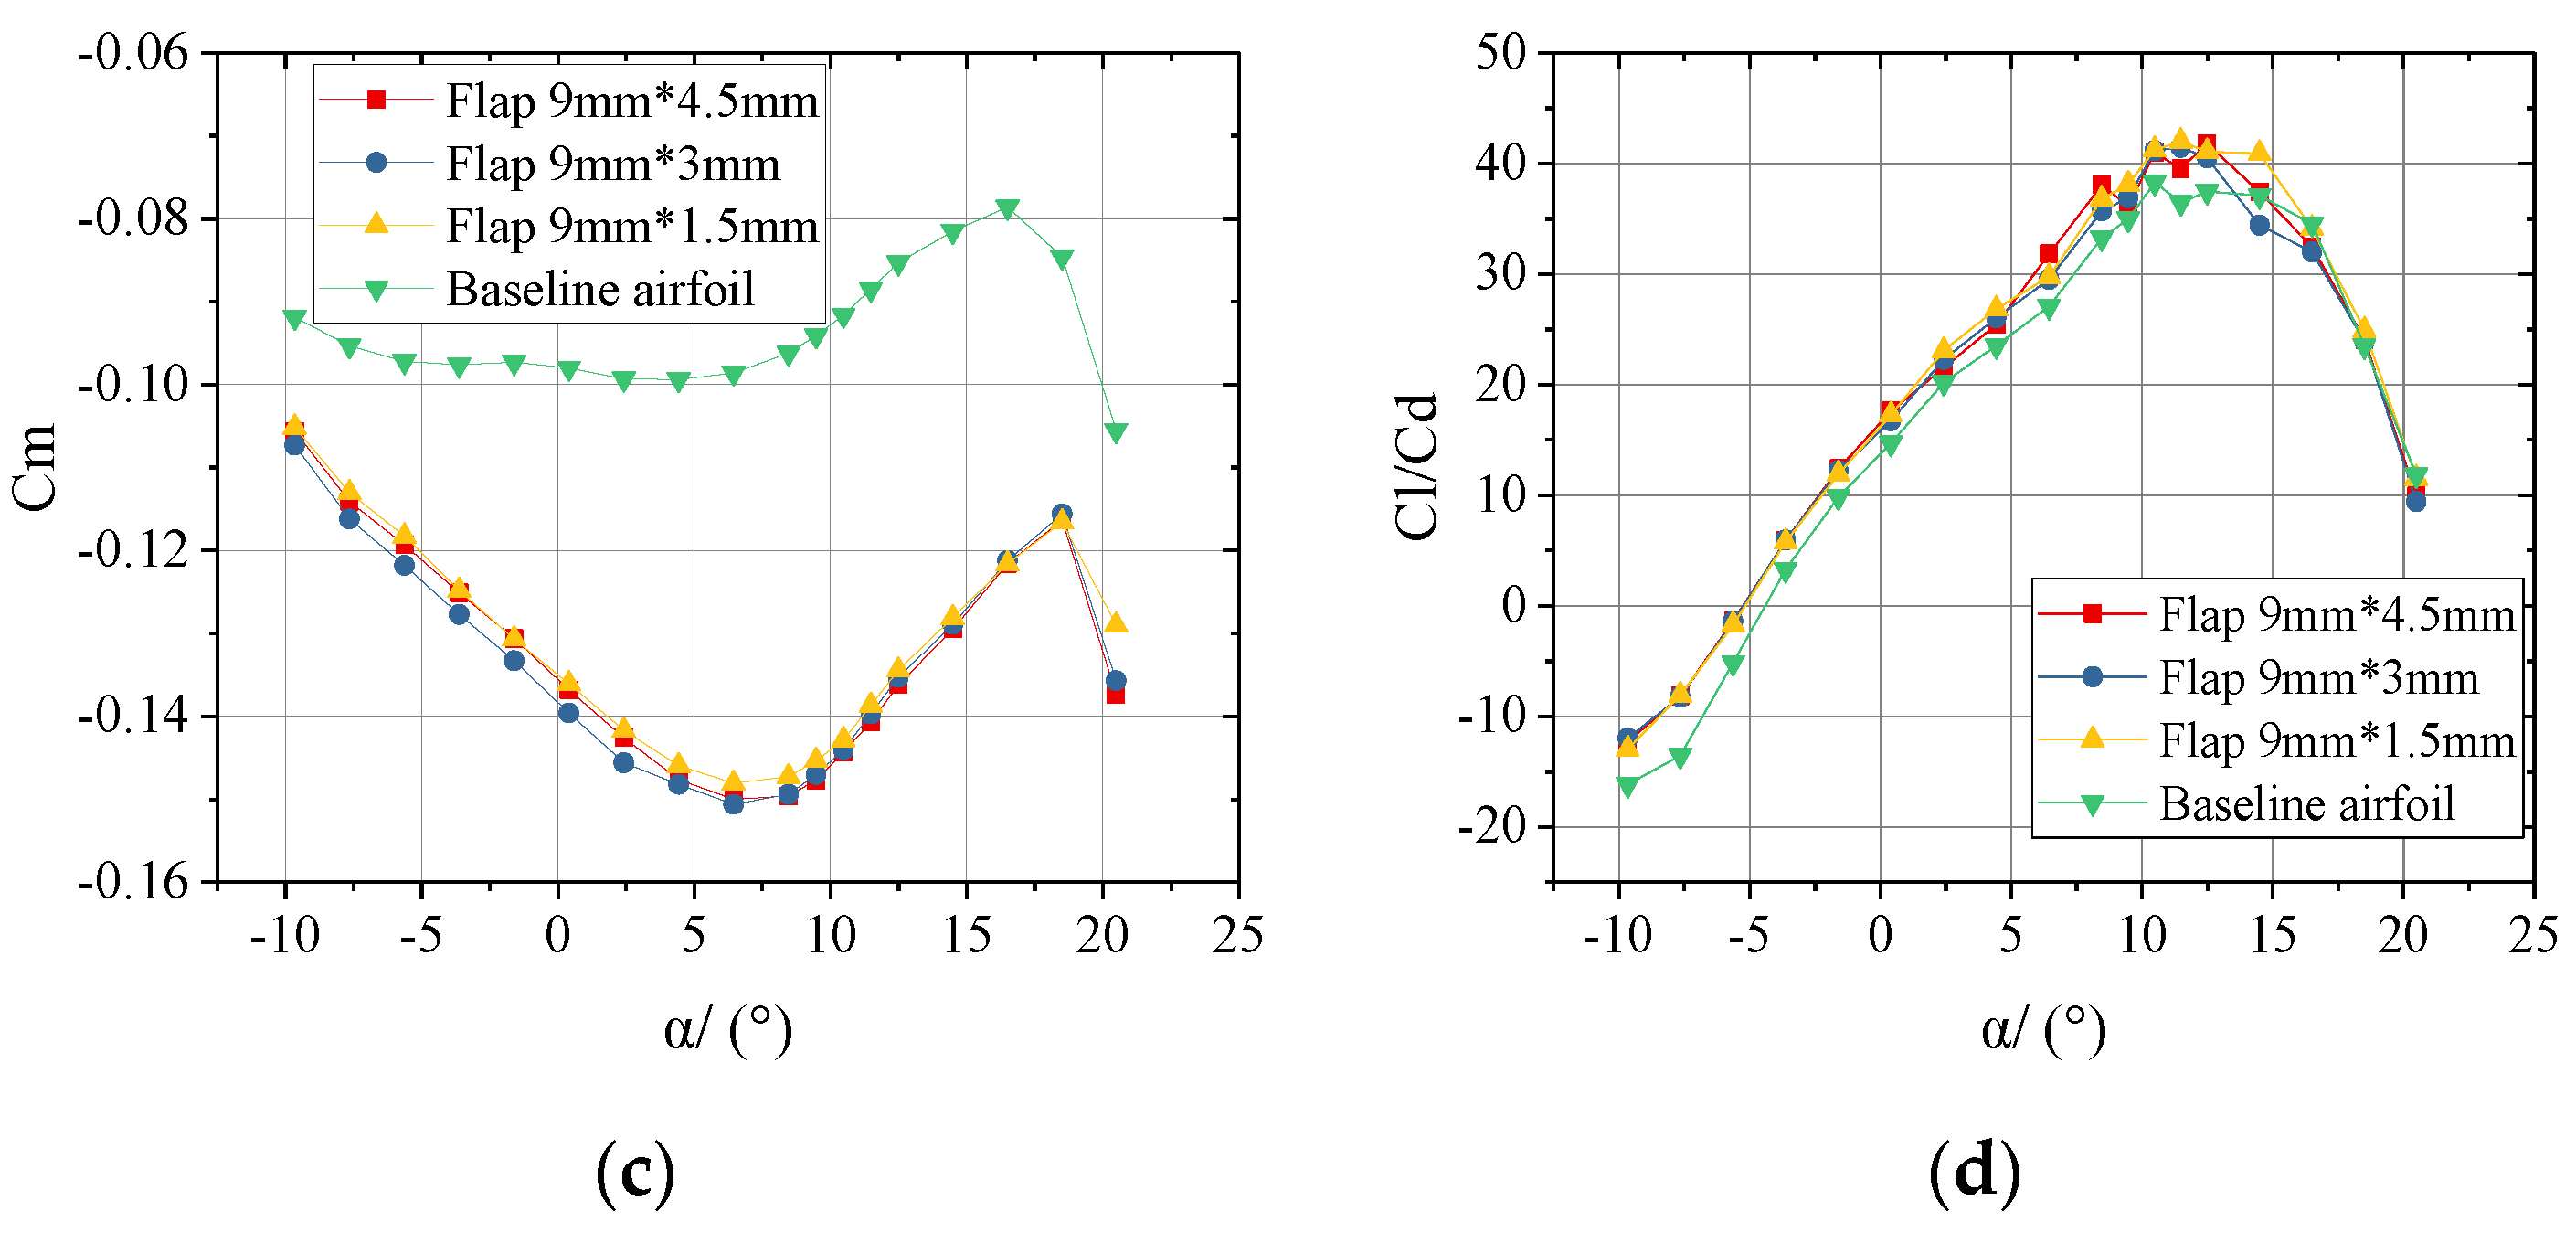
3.5. Experimental Results of Gurney Flap under the 19.0% Turbulence Intensity

To study the aerodynamic characteristics of the Gurney flap under high turbulence conditions, Figure 14 shows the changes of aerodynamic characteristics under the turbulence condition of 19.0%. The measured angle of attack ranged from −9.6° to 24.4°. As seen in Figure 14, the presence of turbulence enhanced the lift coefficient and drag coefficient for all cases. In Figure 14a, with the increase of turbulence intensity, the maximum lift coefficient continually increased, and the maximum lift coefficient of the baseline airfoil reaches 1.781 at 18.5 degree, with a 30.00% increase relative to that under low turbulence condition. The maximum lift coefficients increased by 2.13%, 3.37%, 5.39% at 18.5 degrees, respectively relative to the baseline airfoil, when the heights of the flaps were 6 mm, 9 mm, and 12 mm. Furthermore, since the pressure fluctuations were determined by the fluctuation’s energy of the turbulent flow, the fluctuations of lift coefficient were increased relative to that under the turbulence condition of 10.5%. According to Figure 14b, the drag coefficient of the baseline airfoil changes more obvious than those under the low turbulence condition. The drag coefficients were no longer gentle within the range before stall, and it also rises sharply in the stall state. Such a trend was more noticeable after adding the Gurney flap. For example, at the angle of attack was 22.4°, the drag coefficients increased by 32.11%, 37.22% and 37.96%, when the flap heights were 6 mm, 9 mm, and 12 mm respectively. As can be seen from Figure 14c, the Gurney flap also produced a significant increase in the pitching-moment coefficient and such situation still existed in turbulent flow condition. Based on Figure 14d, unlike that under the condition of 10.5%, the lift gain obtained with Gurney flap is, unfortunately, coupled to a larger increase in drag. Adding Gurney flap with different heights at most of the angles reduces the lift-to-drag relative to the baseline airfoil, and the Gurney flap doesn’t show obvious effect under the turbulence condition of 19.0%. At the same time the same situation occurred at other thicknesses of the Gurney flaps.
Figure 15 exhibits the changes in the aerodynamic characteristics of the baseline airfoil and airfoil with Gurney flaps of height 4.5mm under the turbulence condition of 19.0%. As can be seen from it, with the increase of turbulence intensity, obviously, there were more pressure fluctuations. The curves of flapped airfoils with different thickness no longer overlap totally, in the majority of angles, the difference from 2% to 5%, though it may sometimes reach 20%.

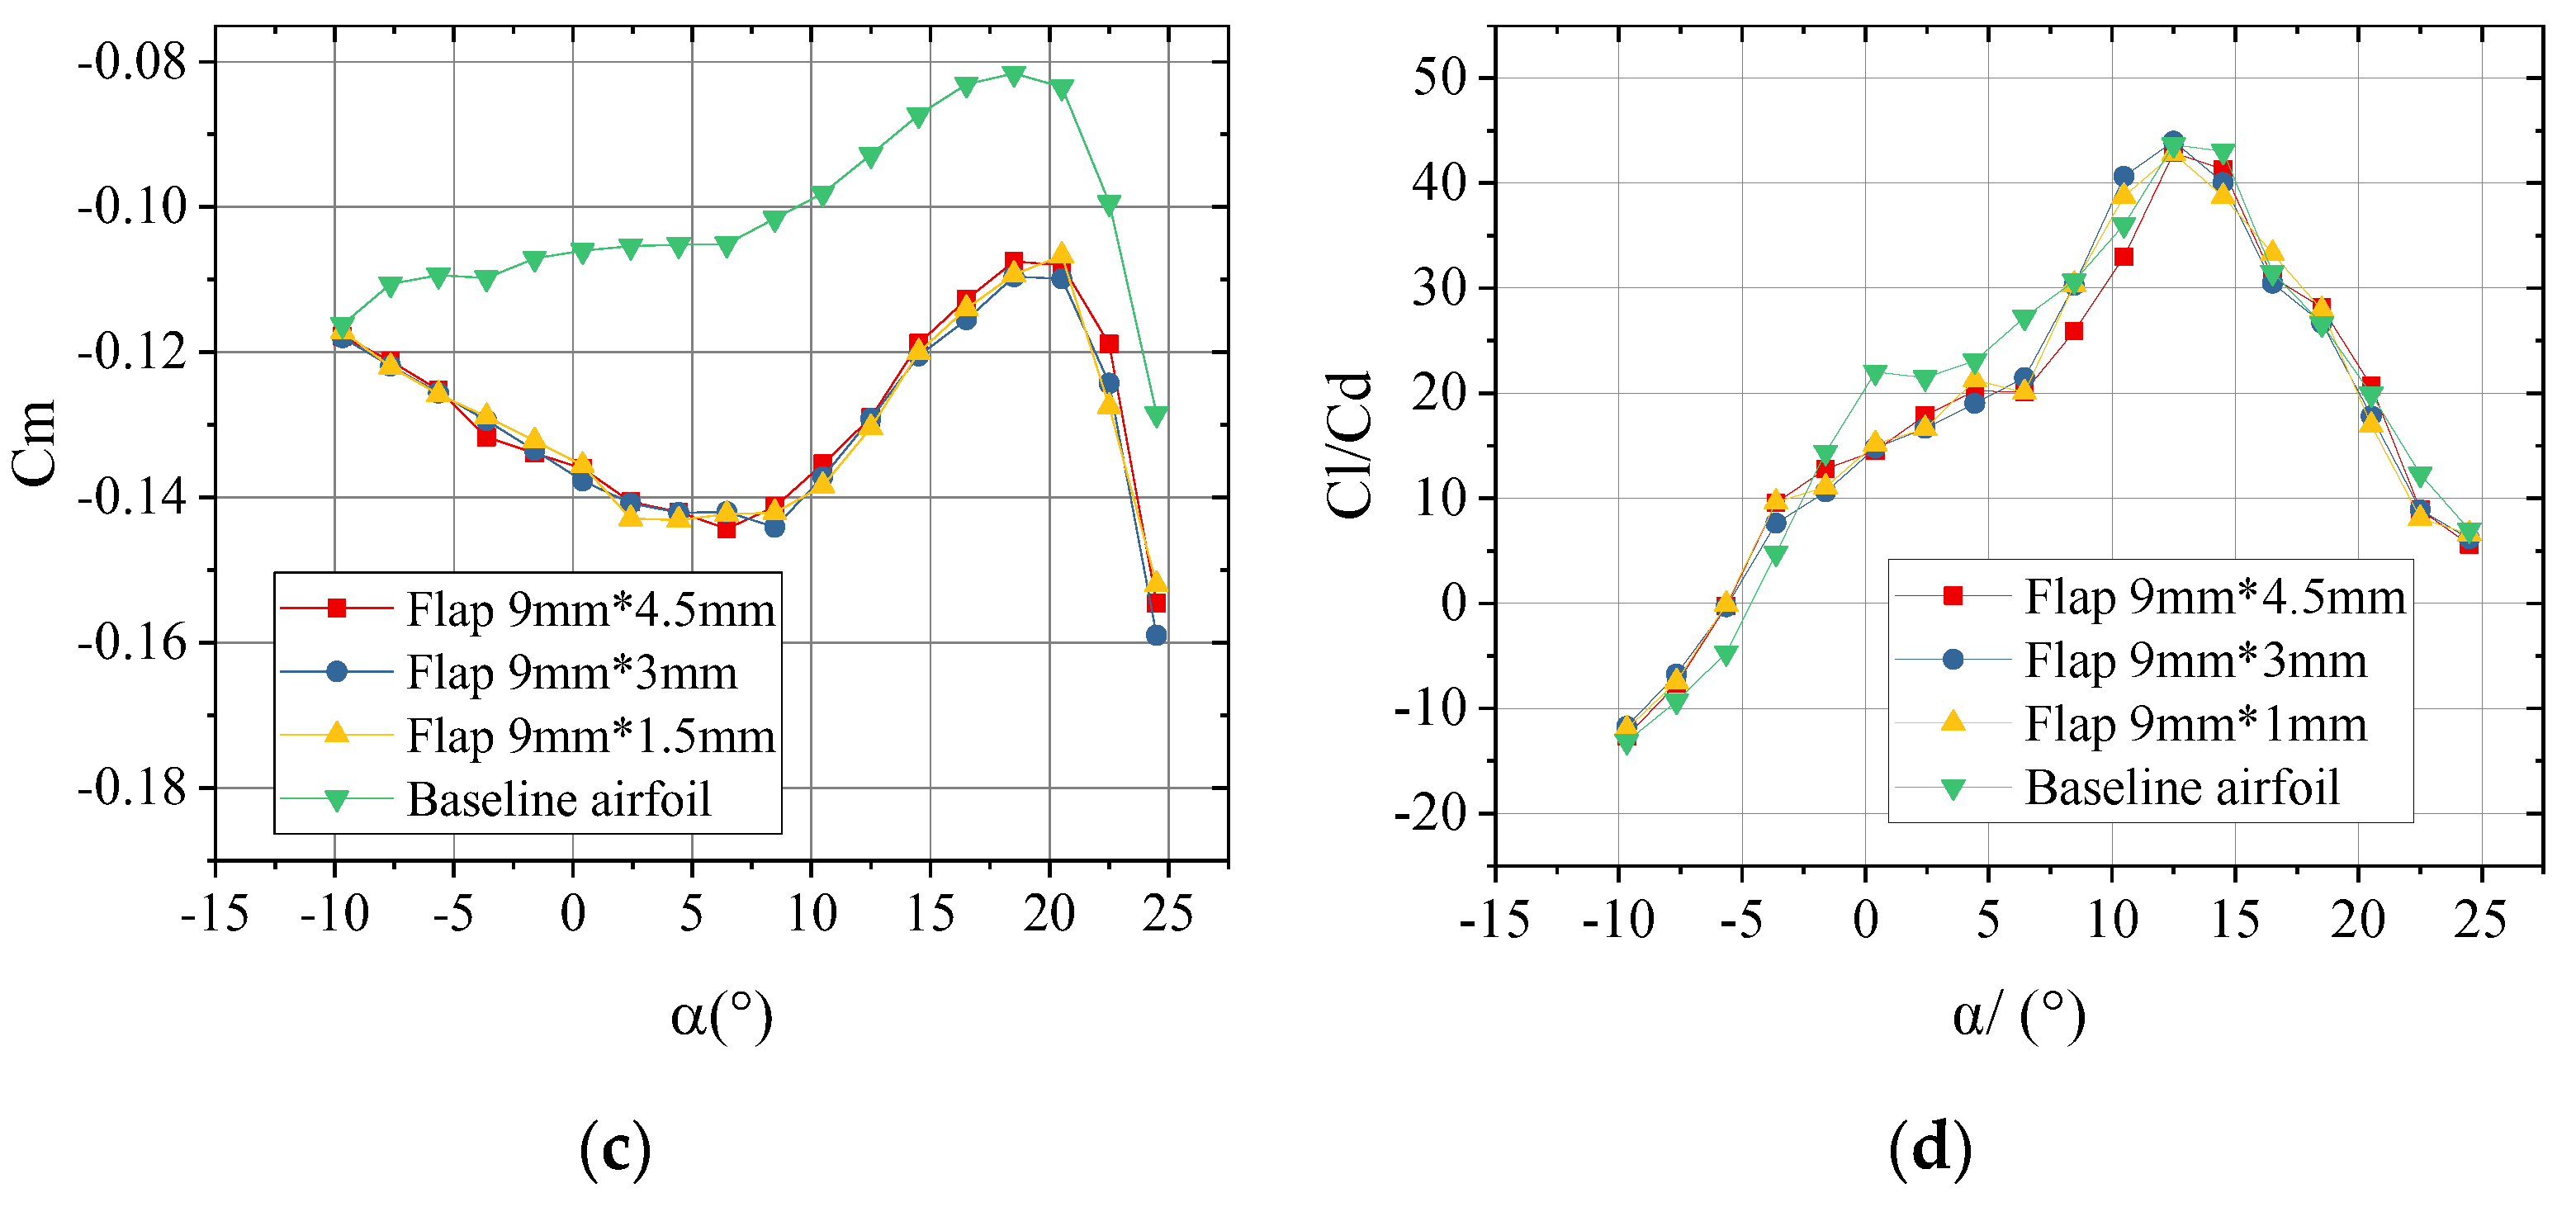
3.6. Surface Pressure Characteristics

To analyze the mechanism of turbulent inflow coupled with Gurney flap, Figure 16 illustrates the pressure coefficient distribution of the baseline airfoil and airfoil attached with the Gurney flap under different turbulent inflow when Reynolds number Re = 0.8 × 10⁶. The x-axis shows the chord-wise position x/c and the y-axis shows the pressure coefficients Cp. The pressure coefficients Cp on the airfoil surface were given
C p = p i - p 0 0.5 ρ U 0 2
where p i is the pressure at the pressure tap of i (i = 1:77), p 0 is the free stream static pressure at the airfoil tested by the Pitot tube, ρ is the air density and U 0 is the free stream velocity.
Figure 16 illustrates that the pressure coefficients of the baseline airfoil under different turbulence conditions with small angles were similar to each other. However, with the increase of angle of attack, the differences become more pronounced at the leading edge. In contrast to the Gurney flaps, Figure 16a shows that at the angle = −9.6°, the differences between the flapped airfoils were small. With the increase of the angle of attack, as the angle of −3.6°, compared with the baseline airfoils, the intersection of the airfoil with Gurney flap moves to the leading edge under different conditions. Besides, the pressure coefficients (with the angle = −3.6° and 2.4°), the pressure distribution indicate a larger the pressure difference in the range of 0.8 < x/c < 0.9. When the angle of attack was 2.4° and 8.4°, both the pressure coefficient absolute values of the baseline airfoil and the Gurney flap tendency to increase with the increase of turbulence intensity, and the flapped airfoil becomes more obvious than the baseline airfoil. At a large angle of attack, due to the condition of stalling (Figure 16e,f), there was significant flow separation both on the suction side of flapped airfoil and baseline airfoil under uniform inflow. The larger the turbulent inflow, the larger the peak value on the leading edge of the suction side, and also the larger pressure coefficient on the pressure side.
As seen from the above, the influence of turbulent inflow coupled with Gurney flap on the pressure coefficients of airfoil was complicated. Turbulent inflow changes the flow around the airfoil surface and restrains the flow separation, after attaching the Gurney flap, the pressure distribution on both suction and pressure sides changed more significantly. Especially in the turbulence condition, the trailing edge pressure distributions were farther apart for the flapped airfoil. In these situations, the increased peak values of pressure coefficients at the leading edge increased the integral area of the pressure coefficients, so the lift force was therefore increased.

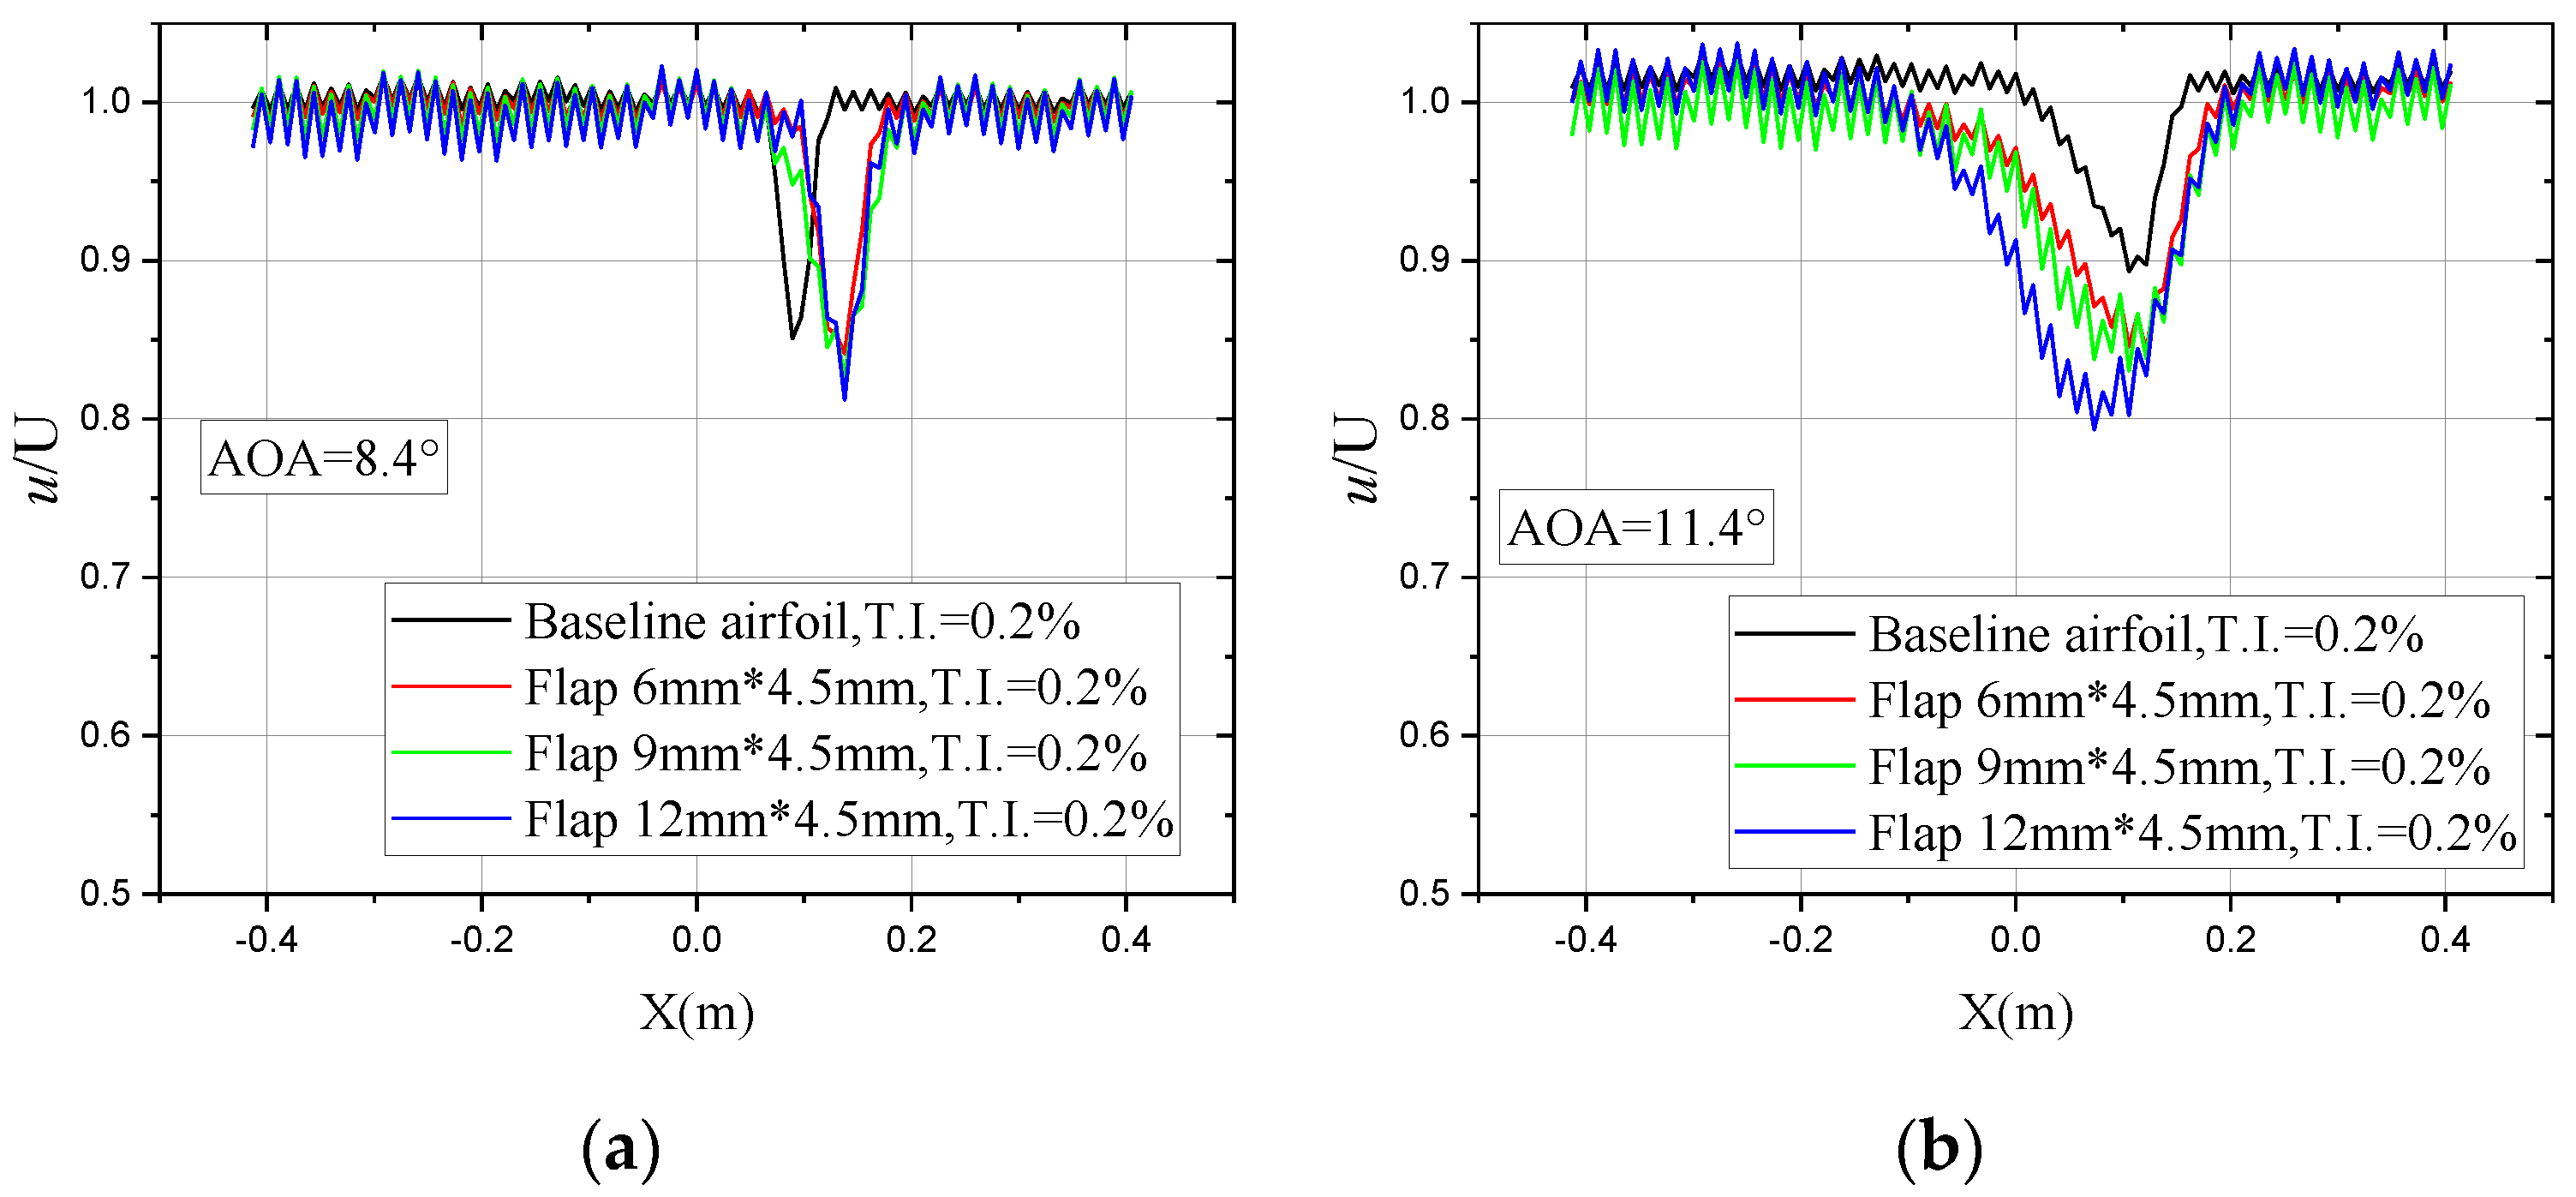
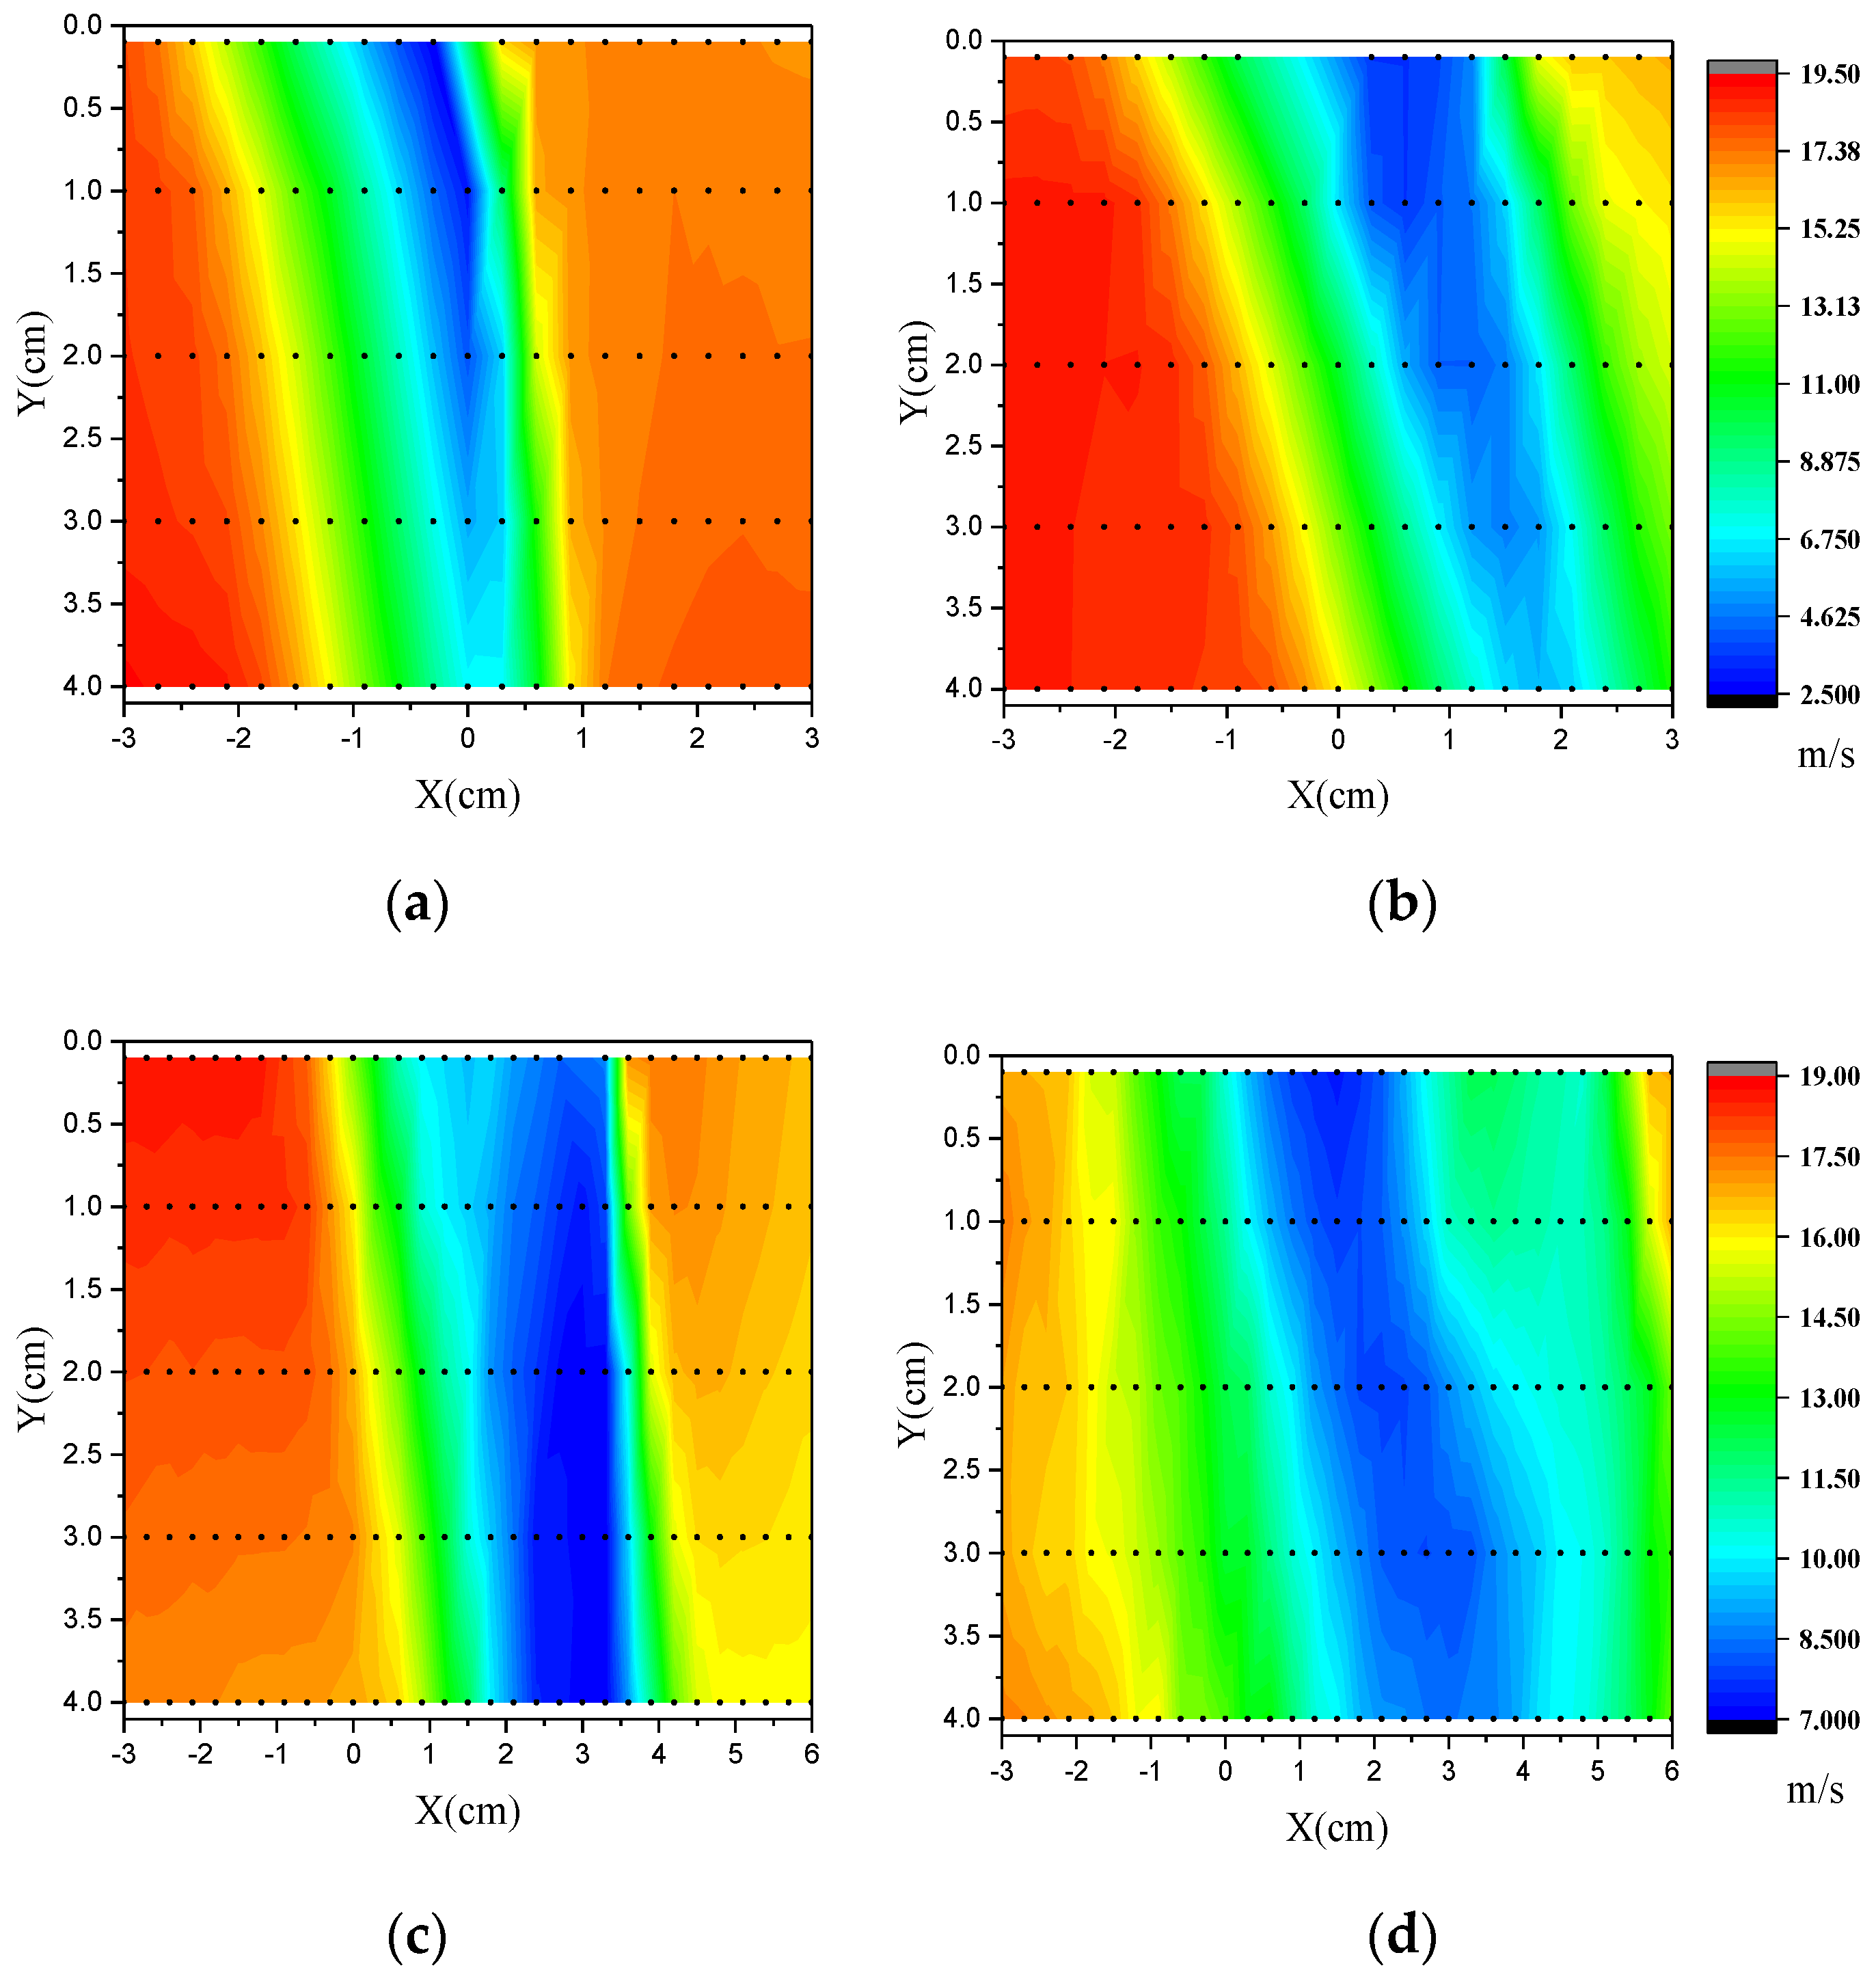
3.7. Wake Profile Characteristics

Figure 17 presents the distribution of wake velocity measured by the wake rake array under uniform inflow. As can be observed, when the angle of attack was 8.4°, which was before the stall angle of attack, the wake of airfoil with the Gurney flap was inclined to the pressure side of the airfoil. When the angle of attack was 11.4°, which was after the stall angle, the Gurney flap weaken the ability of the wake position deflection. Moreover, the wake velocity deficit was significantly increased, and the Gurney flap began to have side effects on the aerodynamic characteristics of the airfoil. The higher the Gurney flap is, the larger the wake velocity deficit is, so it indicates a higher mean drag.
By comparing the flows in the near trailing edge region of the airfoil with Gurney flap. The resultant velocity distribution of the baseline airfoil and the airfoil attached with Gurney flap (9 mm in height and 4.5 mm in thickness) at the angle of attack 8.4° (before the stall angle) and 11.4° (after the stall angle) under uniform inflow were depicted in Figure 18. The vertical direction Y denoted the forward distance from the hot-wire probe to the trailing edge, and the horizontal direction X denoted the lateral distance from the hot-wire probe to the trailing edge. As shown in Figure 18, the black solid spots were the actual measurement positions by using the electronically controlled traverser. As shown, the wake flows shift to the pressure side in both the two situations. When the angle of attack was 8.4°, the airfoil with Gurney flap had a larger velocity deficit than the baseline airfoil, which suggests an increased drag. When the angle of attack was 11.4°, the velocity deficit of the baseline airfoil was also less than the Gurney flap, but there was no obvious difference between the offset direction caused by the flapped airfoil and the baseline airfoil which were being similar to the far field results measured by the wake rake array.
Figure 19 presents the power density spectrum measured by the region 1 cm directly behind the trailing edge under uniform inflow. As can be observed, at the angle of attack 8.4°, both along-wind and across-wind display an obvious peak in the power density spectrum, meanwhile the across-wind energy increased in the flapped airfoil. It indicates there are counter rotating vortices generated by the Gurney flap, while the wake of baseline airfoil does not show the existence of vortex shedding [33]. Gurney flaps also have a wake structure similar to the Karman vortex street behind the cylinder at bigger Reynolds number (i.e., of 0.8 × 10⁶), the flow oscillations were caused by the separating of the shear layer on the pressure side and suction side of the trailing edge. The Karman vortex street both can be found in uniform flow and turbulent flow, so the increased lift produced by the Gurney flap seems can be explained in turbulent flow condition, either. Moreover, from the lift coefficients shown above, the size of structures was affected by turbulence level. Besides, as compared with the reference data under similar condition [33], with the increase of the Reynolds number, from Re = 1 × 10⁵ to 0.8 × 10⁶, the Strouhal number decreased from 0.151 (Re: 1 × 10⁵, 2% chord length) to 0.128 (Re: 2 × 10⁵, 2% chord length) and to 0.088 (Re: 0.8 × 10⁶, 1.5% chord length).

4. Conclusions

In summary, this paper presented a study of the aerodynamic performance of airfoils with/without the Gurney flap under different turbulence conditions by means of wind tunnel experiments. The experimental observations were as follows:
The Gurney flap deflects the wake position from the pressure side of the airfoil, increasing the vertical distance between the airfoil chord and the middle arc. The surface pressure characteristics revealed that the pressure difference of the trailing edge was larger for the flapped airfoil in the turbulence condition. Moreover, due to the special wake structure, the Gurney flap also indicates the vortex generated at the trailing edge, which results in a greater lift of the airfoil. The lift increment obtained from Gurney flap was influenced by the turbulence intensity, meanwhile a large increase in drag was observed as well. Under a medium range of turbulence intensity (i.e., of 10.5%), the maximum lift-to-drag ratios increased from 14.35% (flap 6 mm × 4.5 mm, a = 12.4°) to 14.47% (flap 6 mm × 1.5 mm, a = 12.4°), the 1.0% Gurney flap case has the best performance, that’s probably because the decrease of boundary layer thickness under turbulent conditions, so the height of 1.0% was optimal. However, under a much larger turbulence inflow (i.e., of 19.0%), all experimental data have shown that the impact was negligibly small. The drag increment was found to surpass the benefit of the increase in lift, resulting in a worse lift-to-drag ratio than the baseline airfoil.
It was of importance to note that there are two kinds of measurement uncertainties could affect the acquired results. One was stochastic uncertainties caused by the discrete pressure data which can be eliminated by multiple measurements. The other one was systematic uncertainties caused by measuring instruments which can be reduced by calibration of the instruments before the experiment.
Based on the observations from the present measurements, it was found that under very high turbulence level, e.g., with 19% of turbulence intensity, the Gurney flap has very small influence on the airfoil aerodynamic performance. The measurement results show the Gurney flap may be used in areas with slightly lower turbulence. Nevertheless, wind turbines in real life were running in the turbulent atmospheric boundary layer, as shown above, the effects of Gurney flap are highly dependent on turbulent inflow, it seems that the Gurney flap would be installed as a scalable form and preferred to have smaller size, such that it would get more potential benefits at all periods of rotation. In addition, it should be noted that the incoming flow is often a combination of rotational wake from the previous wind turbines. Research on the lift increment of Gurney flap was not isolated, it always interacted with such highly unsteady aerodynamic issues. Therefore, to analyze more precisely the effects of combining such turbulence levels with Gurney flap, further experiments should be carried out for the rotor blades in highly turbulent flows. This was in progress on a wind turbine blade composed of several DTU-LN221 wing sections.

Author Contributions

Conceptualization, J.Y.; conducted the data collection, J.Y. and Y.Y.; funding acquisition, H.Y.; supervision, N.L., H.Y. and W.Z.; formal analysis, J.Y., H.Y., W.Z.; writing—original draft preparation, J.Y.; writing—review and editing, H.Y., W.Z.; All authors have read and agreed to the published version of the manuscript.

Funding

This research was funded by Postgraduate Research & Practice Innovation Program of Jiangsu Province under grant number KYCX19_2104 and Youth Fund Project of Jiangsu Natural Science Foundation under grant number BK20170510.

Acknowledgments

The authors wish to express acknowledgement to the Postgraduate Research &Practice Innovation Program of Jiangsu Province under grant number KYCX19_2104 and Youth Fund Project of Jiangsu Natural Science Foundation under grant number BK20170510.

Conflicts of Interest

The authors declare no conflict of interest.

References

  1. Liebeck, R.H. Design of subsonic airfoils for high lift. J. Aircr. 1978, 15, 547–561. [Google Scholar] [CrossRef]
  2. Amini, Y.; Emdad, H.; Farid, M. Adjoint shape optimization of airfoils with attached Gurney flap. Aerosp. Sci. Technol. 2015, 41, 216–228. [Google Scholar] [CrossRef]
  3. Xu, H.R.; Yang, H.; Liu, C. Numerical value analysis on aerodynamic performance of DU series airfoil with thickened trailing edge. Trans. Chin. Soc. Agric. Eng. 2014, 30, 101–108. [Google Scholar]
  4. Yashodhar, V.; Humrutha, G.; Kaushik, M.; Khan, S.A. CFD Studies on Triangular Micro-Vortex Generators in Flow Control. In IOP Conference Series: Materials Science and Engineering; IOP Publishing: Bristol, UK, 2017; Volume 184, p. 012007. [Google Scholar]
  5. Lee, T.; Su, Y.Y. Unsteady airfoil with a harmonically deflected trailing-edge flap. J. Fluids Struct. 2011, 27, 1411–1424. [Google Scholar] [CrossRef]
  6. Seyednia, M.; Masdari, M.; Vakilipour, S. The influence of oscillating trailing-edge flap on the dynamic stall control of a pitching wind turbine airfoil. J. Braz. Soc. Mech. Sci. Eng. 2019, 41, 192. [Google Scholar] [CrossRef]
  7. Lu, W.S.; Tian, Y.; Liu, P.P. Aerodynamic optimization and mechanism design of flexible variable camber trailing-edge flap. Chin. J. Aeronaut. 2017, 30, 988–1003. [Google Scholar] [CrossRef]
  8. Zhang, W.G.; Bai, X.J.; Wang, Y.F.; Han, Y.; Hu, Y. Optimization of sizing parameters and multi-objective control of trailing edge flaps on a smart rotor. Renew. Energy 2018, 129, 75–91. [Google Scholar] [CrossRef]
  9. Zhang, H.; Zhao, Z.D.; Zhou, G.X.; Kang, S. Experimental investigation of the effect of Gurney flap on DU93-W-210 airfoil aerodynamics performance. Acta Energ. Solaris Sinica 2017, 38, 601–606. [Google Scholar]
  10. Amini, Y.; Liravi, M.; Izadpanah, E. The effects of Gurney flap on the aerodynamic performance of NACA 0012 airfoil in the rarefied gas flow. Comput. Fluids 2018, 170, 93–105. [Google Scholar] [CrossRef]
  11. Lee, T.; Su, Y.Y. Lift enhancement and flow structure of airfoil with joint trailing-edge flap and Gurney flap. Exp. Fluids 2011, 50, 1671–1684. [Google Scholar] [CrossRef]
  12. Chen, Z.J.; Stol, K.A.; Mace, B.R. Wind turbine blade optimization with individual pitch and trailing edge flap control. Renew. Energy 2016, 103, 750–765. [Google Scholar] [CrossRef]
  13. Medina, A.; Ol, M.V.; Mancini, P.; Jones, A. Revisiting Conventional Flaps at High Deflection Rate. AIAA J. 2017, 55, 1–10. [Google Scholar] [CrossRef]
  14. Elsayed, O.A.; Asrar, W.; Omar, A.A.; Kwon, K.; Jung, H.J. Experimental Investigation of Plain and Flapped-Wing Tip Vortex. J. Aircr. 2009, 46, 254–262. [Google Scholar] [CrossRef]
  15. Little, J.; Nishihara, M.; Adamovich, I.; Saminy, M. High-lift airfoil trailing edge separation control using a single dielectric barrier discharge plasma actuator. Exp. Fluids 2010, 48, 521–537. [Google Scholar] [CrossRef]
  16. Bergami, L.; Poulsen, N.K. A smart rotor configuration with linear quadratic control of adaptive trailing edge flaps for active load alleviation. Wind Energy 2015, 18, 625–641. [Google Scholar] [CrossRef] [Green Version]
  17. Edward, T.; Christoph, B. Upstream shear-layer stabilization via self-oscillating trailing edge flaplets. Exp. Fluids 2018, 59, 145. [Google Scholar]
  18. Straub, F.K.; Anand, V.R.; Lau, B.H.; Birchette, T.S. Wind Tunnel Test of the SMART Active Flap Rotor. J. Am. Helicopter Soc. 2018, 63, 012002. [Google Scholar] [CrossRef]
  19. Traub, L.W. Prediction of Gurney-Flap Lift Enhancement for Airfoils and Wings. AIAA J. 2014, 52, 2087–2090. [Google Scholar] [CrossRef]
  20. Lario, A.; Arina, R. Discontinuous Galerkin Method for the Study of Active Gurney Flaps. J. Aircr. 2017, 54, 1–11. [Google Scholar] [CrossRef]
  21. Li, C.F.; Xu, Y.; Zhao, X.L.; Xu, J.Z. Analysis on Dynamic Performance Trailing Edge Flap on Wind Turbine Airfoil. J. Eng. Thermophys. 2014, 35, 883–887. [Google Scholar]
  22. Zhu, W.J.; Behrens, T.; Shen, W.Z.; Sørensen, J.N. Hybrid Immersed Boundary Method for Airfoils with a Trailing-Edge Flap. AIAA J. 2013, 51, 30–41. [Google Scholar] [CrossRef]
  23. Ng, B.F.; Palacios, R.; Kerrigan, E.C.; Graham, J.M.R.; Hesse, H. Aerodynamic load control in horizontal axis wind turbines with combined aeroelastic tailoring and trailing edge flaps. Wind Energy 2016, 19, 243–263. [Google Scholar] [CrossRef]
  24. Colman, J.; Marañón Di Leo, J.; Delnero, J.S.; Martinez, M.; Boldes, U.; Bacchi, F. Lift and drag coefficients behaviour at low Reynolds number in an airfoil with Gurney flap submitted to a turbulent flow: Part 1. Lat. Am. Appl. Res. 2008, 38, 195–200. [Google Scholar]
  25. Di Leo, J.M.; Martínez, M.A.; Delnero, J.S.; Saínz, M.G. Experimental study of the effect of the wake generated by oscillating Gurney flap. Lat. Am. Appl. Res. 2019, 49, 289–296. [Google Scholar]
  26. Li, W.J.; Zhang, P.; Yang, S.F.; Fu, X.H.; Xiao, Y. An Experimental Method for Generating Shear-Free Turbulence Using Horizontal Oscillating Grids. Water 2020, 12, 591. [Google Scholar] [CrossRef] [Green Version]
  27. Cheng, J.T.; Zhu, W.J.; Fischer, A.; García, N.R.; Madsen, J.; Chen, J.; Shen, W.Z. Design and validation of the high performance and low noise CQU-DTU-LN1 airfoils. Wind Energy 2013, 17, 1817–1833. [Google Scholar] [CrossRef]
  28. ROHA. LSWT Campaign Report on DTU-C21; LM Internal Report: Jupitervej, Denmark, 2012. [Google Scholar]
  29. Allen, H.J.; Vlncenti, W.G. Wall Interference in a Two-Dimensional Flow Wind Tunnel, with Consideration of the effect of Compressibility. NACA Rep. 1944, 782, 155–184. [Google Scholar]
  30. Timmer, W.A.; van Rooij, R.P.J.O.M. Summary of the Delft University Wind Turbine Dedicated Airfoils. J. Sol. Energy Eng. 2003, 125, 11–21. [Google Scholar] [CrossRef]
  31. Llorente, E.; Gorostidi, A.; Jacobs, M.; Timmer, W.A.; Munduate, A.; Pires, A. Wind Tunnel Tests of Wind Turbine Airfoils at High Reynolds Numbers. J. Phys. Conf. 2014, 524, 012012. [Google Scholar] [CrossRef]
  32. Pires, O.; Munduate, X.; Ceyhan, O.; Jacobs, M.; Madsen, J.; Schepers, J.G. Analysis of the high Reynolds number 2D tests on a wind turbine airfoil performed at two different wind tunnels. J. Phys. Conf. Ser. 2016, 749, 012014. [Google Scholar] [CrossRef] [Green Version]
  33. Troolin, D.R. A Quantitative Study of the Lift-Enhancing Flow Field Generated by an Airfoil with a Gurney Flap. Ph.D. Dissertation, University of Minnesota, Minnesota, MN, USA, 2009. [Google Scholar]
Figure 1. Schematic diagram of measuring position.
Applsci 10 07258 g001
Figure 2. Experimental test device.
Applsci 10 07258 g002
Figure 3. Schematic diagram of experimental grille. (a) Front view; (b) side view.
Applsci 10 07258 g003
Figure 4. Grille turbulence generated device.
Applsci 10 07258 g004
Figure 5. Wake measurements.
Applsci 10 07258 g005
Figure 6. Flap geometry.
Applsci 10 07258 g006
Figure 7. The time series of the instantaneous streamwise velocity (the 6th section, central measuring point).
Applsci 10 07258 g007
Figure 8. Description of the flow field behind the grilles. (a) Turbulence intensity and average velocity (Re: 0.8 × 10⁶); (b) Comparison of the PSD (1.6 m behind the grille).
Applsci 10 07258 g008
Figure 9. Comparison of experimental data of the DTU-LN221 airfoil (uniform inflow, Re: 1.5 × 10⁶). (a) Lift coefficient comparison; (b) drag coefficient comparison.
Applsci 10 07258 g009
Figure 10. Variation of the aerodynamic characteristics with different heights of Gurney flaps (uniform flow, Re: 0.8 × 10⁶). (a) Lift coefficient comparison; (b) drag coefficient comparison; (c) pitching-moment coefficient comparison; (d) lift-to-drag ratio comparison.
Applsci 10 07258 g010
Figure 11. Variation of the aerodynamic characteristics with different thicknesses of Gurney flaps (uniform flow, Re: 0.8 × 10⁶). (a) Lift coefficient comparison; (b) drag coefficient comparison; (c) pitching-moment coefficient comparison; (d) lift-to-drag ratio comparison.
Applsci 10 07258 g011aApplsci 10 07258 g011b
Figure 12. Variation of the aerodynamic characteristics with different heights of Gurney flaps (T.I. of 10.5%, Re: 0.8 × 10⁶). (a) Lift coefficient comparison; (b) drag coefficient comparison; (c) pitching-moment coefficient comparison; (d) lift-to-drag ratio comparison.
Applsci 10 07258 g012
Figure 13. Variation of the aerodynamic characteristics with different thicknesses of Gurney flaps (T.I. of 10.5%, Re: 0.8 × 10⁶). (a) Lift coefficient comparison; (b) drag coefficient comparison; (c) pitching-moment coefficient comparison; (d) lift-to-drag ratio comparison.
Applsci 10 07258 g013aApplsci 10 07258 g013b
Figure 14. Variation of the aerodynamic characteristics with different heights of Gurney flaps (T.I. of 19%, Re: 0.8 × 10⁶). (a) Lift coefficient comparison; (b) drag coefficient comparison; (c) pitching-moment coefficient comparison; (d) lift-to-drag ratio comparison.
Applsci 10 07258 g014
Figure 15. Variation of the aerodynamic characteristics with different thicknesses of Gurney flaps (T.I. of 19%, Re: 0.8 × 10⁶). (a) Lift coefficient comparison; (b)drag coefficient comparison; (c) pitching-moment coefficient comparison; (d) lift-to-drag ratio comparison.
Applsci 10 07258 g015aApplsci 10 07258 g015b
Figure 16. The surface pressure coefficients under different angle of attack (Re: 0.8 × 10⁶). (a) α = −9.6°; (b) α = −3.6°; (c) α = 2.4°; (d) α = 8.4°; (e) α = 12.4°; (f) α = 18.4°.
Applsci 10 07258 g016
Figure 17. The wake velocity measured by the wake rake array (uniform inflow, Re: 0.8 × 10⁶). (a) α = 8.4°; (b) α = 11.4°.
Applsci 10 07258 g017
Figure 18. Velocity distribution of the region behind trailing edge (uniform inflow, Re: 0.8 × 10⁶). (a) α = 8.4°, baseline airfoil; (b) α = 8.4°, Gurney flap 9 mm × 4.5 mm; (c) α = 11.4°, baseline airfoil; (d) α = 11.4°, Gurney flap 9 mm × 4.5 mm.
Applsci 10 07258 g018
Figure 19. Comparison of the power density spectrum (uniform inflow, Re: 0.8 × 10⁶). (a) α = 8.4°, baseline airfoil; (b) α = 8.4°, Gurney flap 9 mm × 4.5 mm.
Applsci 10 07258 g019
Table 1. Dimensions of the experiment grilles.
a (cm)b (cm)c (cm)d (cm)e (cm)
Scheme 13343323
Scheme 2631.4629.83
Publisher’s Note: MDPI stays neutral with regard to jurisdictional claims in published maps and institutional affiliations.

