Article

Assessment of Appropriate Experimental Parameters for Studying the Kaiser Effect of Rock

1
State Key Laboratory for Geomechanics and Deep Underground Engineering, China University of Mining and Technology, Xuzhou 221116, China
2
State Key Laboratory of Coastal and Offshore Engineering, Dalian University of Technology, Dalian 116024, China
3
College of Mining Engineering and Geology, Xinjiang Institute of Engineering, Urumqi 830091, China
*
Authors to whom correspondence should be addressed.
Appl. Sci. 2020, 10(20), 7324; https://doi.org/10.3390/app10207324
Submission received: 18 September 2020 / Revised: 16 October 2020 / Accepted: 16 October 2020 / Published: 19 October 2020

Abstract

:
The Kaiser effect of rock has been extensively studied due to its wide application in in-situ stress measurement and rock damage quantification. The uniaxial cyclic loading and unloading (UCLU) test is commonly employed to examine the rock Kaiser effect. However, how the two critical parameters, including prescribed stress in the first loading cycle (σA) and loading strain rate (lsr), affect the appearance of the Kaiser effect lacks thorough understanding. We systematically performed UCLU tests on 75 sandstone specimens under 25 combinations of σA and lsr. σA spans from 0.5σc (σc is the uniaxial compressive strength) to 0.9σc, and lsr ranges from 10−5 s−1 to 10−3 s−1, respectively. The acoustic emission characteristics of all the rock specimens are continuously monitored over the entire tests. We find that the Kaiser effect is unanimously observed in the stable crack growth stage, corresponding to the stress levels of 0.5σc to 0.7σc because under a lower stress, the Kaiser effect is easily covered by the acoustic emissions generated by microcrack friction. The loading strain rate also heavily affects the occurrence of the Kaiser effect. When lsr does not exceed 10−4 s−1, the Felicity ratio (FR) rises quickly as lsr ascends, whereas FR increases less pronouncedly once lsr exceeds 10−4 s−1. Therefore, a relatively high loading strain rate, i.e., lsr higher than 10−4 s−1, is suggested to facilitate the appearance of the Kaiser effect.

1. Introduction

An accurate estimation of in-situ geo-stresses is critical for the reliable design and regular operation of underground rock-engineering projects. Various stress measurement approaches in rocks are present, most of which are nevertheless time-consuming and uneconomic, such as hydraulic fracturing and overcoring methods [1,2,3,4,5,6]. Moreover, these approaches may lack adequate accuracy [7,8,9]. Recently, a quick and convenient approach based on the Kaiser effect of rock has been considered as a promising alternative from the viewpoint of practice [10,11,12]. The Kaiser effect is widely documented in rocks and materials under the uniaxial cyclic loading and unloading (UCLU) test [13,14]. It refers to the phenomena that the acoustic emission (AE) activity of rock increases remarkably once the applied stress exceeds the largest previous stress. That is to say, the Kaiser effect denotes the memory of rock to the history of loading.
Extensive experimental studies have been carried out to examine the applicability of the Kaiser effect for history stress measurement [12,15,16,17]. A widely used experimental configuration to study the Kaiser effect is the UCLU test [18,19,20]. Li and Nordlund [21] carried out UCLU test for eight rock types and revealed the influence of delay time on the Kaiser effect. Lavrov [22] found that the Kaiser effect could be observed only when the follow-up cyclic loading rate was higher than the previous cyclic loading rate in the UCLU test of limestone under different loading rates. Zhang et al. [23] carried out a UCLU test on three rock types: limestone, sandstone, and halite, and analyzed influences of loading rate on Felicity effects of the three rock types.
In the UCLU test, uniaxial stress is applied and raised to a certain level (σA), followed by constant loading for a certain period. Then, the uniaxial stress is unloaded, and then increased again to examine the stress magnitude at which the Kaiser effect appears (σAE). The occurrence of the Kaiser effect is affected by several factors, including rock lithology, magnitude of the prescribed stress (σA) in the first loading cycle, duration of the constant loading, and loading strain rate (lsr). For instance, when σA is low, the AE produced by the friction of the microcracks cannot be eliminated, which complicates the identification of σAE [18,24,25]. On the other hand, if σA is very high, the Kaiser effect vanishes, and due to that, unstable cracking takes place within the rock and AE happens before the maximum history stress is reached [11,26,27]. It has been also reported that the loading strain rate strongly affects the crack evolution and propagation [18,19,28]. However, how these factors, particularly σA and lsr, influence the occurrence of the Kaiser effect are rarely reported.
In this paper, we carried out a series of UCLU tests on specimens of a typical sedimentary rock, red sandstone. Various prescribed stresses in the first loading cycle (σA) from 0.5σc to 0.9σc, and different loading strain rates (lsr) from 10−5 s−1 to 10−3 s−1 are employed, respectively. The occurrence of the Kaiser effect is examined based on the acoustic emission characteristics over the uniaxial cyclic loading-unloading.

2. Experiments

A red sandstone block with uniform texture is selected to make cylindrical specimens. The diameter and height of each specimen are 50 mm and 100 mm, respectively. The primary mineralogical components of the red sandstone are feldspar and quartz, and the average grain size is 77.4 μm (Figure 1). After being dried naturally in the room temperature, the average density of the specimen is 2.39 g/cm3. In total, 78 specimens are prepared for test, among which three specimens, numbered 1# to 3#, are used for the uniaxial compressive strength (UCS) test. The average UCS of the specimen (σc) is found to be 62.80 MPa. The other 75 specimens are for UCLU tests.
Figure 2 shows the experimental equipment for deforming the red sandstone subjected to the UCLU test. The MTS-816 test system, which consists of the loading system, test system, and control system, is employed. The DS5-A acoustic emission test analysis system is used to monitor the acoustic emission over testing. The apparatus is able to store the AE data in waveform with great stability and sensitivity. To guarantee the AE sensors and rock specimens are well contacted, the ceramic end of the acoustic emitting sensor is coated with Vaseline and tightly mounted to the rock specimen by the hot melt glue. Vaseline is uniformly coated between the rock specimen end and the loading platen of the MTS system to mitigate the end friction. The loading system and the AE monitoring system are synchronized from the start to the end of the test.
We conducted the UCLU tests by using various prescribed stress levels in the 1st loading cycle (σA) and loading strain rates (lsr). Figure 3 illustrates the loading path of the UCLU test. The test is performed in two steps. With the stress-controlled loading mode, σA is first increased at a loading speed of 1.0 MPa/s, and σA is prescribed from 0.5σc to 0.9σc at an increment of 0.1σc, respectively. The load is kept for 3 min so that the influence of AEs generated by friction and slippage between the microstructural surfaces inside the rock is eliminated [22,23,29,30,31]. Then the specimen is unloaded to 0.5 MPa at an unloading speed of 1.0 MPa/s. To guarantee full contact between the loading platen and the rock specimen end, the stress is not completely unloaded to zero. This prevents an unfavorable effect generated by the separation of the loading platen from the end face. To avoid that the test is stopped due to unexpected and quick rupture of the rock specimen under the loading mode of stress-control, the displacement-controlled loading mode is used in the 2nd loading stage, and the loading strain rates (lsr) are 10−5 s−1 to 10−3 s−1, which falls into the region of strain rate from low to medium [18,32,33]. The detailed experimental schemes of the UCLU refer to Table 1.

3. Results

Figure 4 illustrates the AE evolution of the UCS test of the red sandstone. The AE evolution is characterized by four stages, including quiet stage (OA), transition stage (AB), active stage (BC), and attenuation stage (CD), corresponding to the four stages of the stress-strain curve, namely, compaction stage, elastic stage, yield stage (stable crack growth and unstable cracking, respectively), and failure stage. In the quiet stage (I), the original microcracks and fissures within the rock specimen are closed upon the stress appliance. The friction between microcracks leads to low-energy, low-quantity AE events (abbreviated as AEs hereafter) with high variations. The stress acting on the rock specimen in the transition stage (II) is insufficiently high to develop new microcracks, whereas some closed microcracks slip, generating some low-energy AEs. In the active stage (III), yielding occurs, and the microcracks are continuously produced and developed with increasing volumetric strain and dilatancy. AE commences activation and the AE number grows. In the attenuation stage (IV), microcracks are interconnected, resulting in the formation of macroscopic ruptures. AE becomes extremely active and the number of AEs peaks. Over the rapid stress drop, the AE number gradually reduces.
Figure 5, Figure 6, Figure 7, Figure 8 and Figure 9 show the AE characteristics of the uniaxial cyclic loading-unloading test. Segment FG corresponds to the first-cycle loading strain rate with a few number of AEs. The AEs increase as the stress increases. Segment GH is the constant loading in the first loading cycle. Some closed microcracks undergo slippage, which continuously generates AEs. Segment HI is the unloading stage in the 1st cycle, in which existing microcracks cannot be further expanded and no new microcracks are generated. Segment IJ is the loading in the 2nd loading cycle. Few AEs are observed under the low initial stress, indicating that the 1st cycle of loading effectively inhibits the occurrence of the friction-type AE and promotes the discrimination of stress magnitude of the Kaiser effect in the following loading stage. σA strongly affects the AE in the 2nd loading cycle. When σA is low, remarkable AEs occur when the loading stress exceeds σA, i.e., σAE is higher than σA and the Kaiser effect is obvious. However, when σA is sufficiently large, significant AEs take place when the loading stress is smaller than σA, that is, the Kaiser effect vanishes and the Felicity effect appears.

4. Discussion

Substantial experiments have shown that the rock Kaiser effect can breakdown or disappear over the cyclic loading process [21,22,34]. The Felicity effect occurs when the Kaiser effect vanishes. The Felicity effect, which is also termed the counter-Kaiser effect, denotes that AEs start to appear noticeably when the applied stress is lower than its highest value of the stress history in the previous stage [21,34]. The Felicity effect is quantifiable by the Felicity ratio (FR), which usually represents the degree of rock damage. As the FR is decreased, the rock damage degree becomes higher. Given that the FR is larger than 1.0, the Kaiser effect is pronounced and the rock damage degree is low or even no damage. When FR < 1.0, the Kaiser effect disappears, which indicates remarkable damage due to unstable crack expansion. The Felicity ratio (FR) is measured by the stress magnitude of the Kaiser effect (σAE) and the highest stress in the previous loading stage (σm):
F R = σ AE σ m .
The FR values of the red sandstone under 25 combinations of σA and the loading strain rate are calculated using Equation (1). Table 2 and Figure 10 shows variations of FR under different σA and lsr. In the following, we examine the effects of σA and lsr on the appearance of both the Kaiser and the Felicity effects.

4.1. Dependence of the Kaiser Effect on the Prescribed Stress

Figure 10a demonstrates that when σA = 0.5σc, i.e., the prescribed stress is located in the region of the compaction stage to the elastic stage, AEs appear extensively if the stress is larger than σA, and the Kaiser effect is obvious. When FR > 1.0 in the re-loading stage, the Kaiser effect occurs, and the loading strain rate poses a minor impact on the Kaiser effect. Once σA arrives at 0.6σc, i.e., in the region of the elastic stage and the stable crack expansion stage, the appearance of the Kaiser effect is strongly related to the loading strain rate. When FR < 1.0 and lsr < 10−4 s−1, the Felicity effect appears in the re-loading stage and the Kaiser effect disappears. When FR > 1.0 and lsr ≥ 10−4 s−1, the Kaiser effect appears over the re-loading. When σA ≥ 0.7σc, i.e., ranging from the stable crack growth stage to the unstable cracking stage, for FR < 1.0, substantial AE events happen at the low loading stress level. That is to say, the Kaiser effect vanishes, accompanied with the occurrence of the Felicity effect. The loading strain rate has nearly no impact on the Kaiser effect. Therefore, the Kaiser effect and the Felicity effect are greatly influenced by the prescribed stress (σA). For the same type of rock, different σA under the same loading path result in different damage degrees of rock, and thus, different AE characteristics. Overall, the mechanical properties of the rock degrade as σA increases. As the internal damage degree gradually increases, more AEs are generated earlier. Consequently, as the Kaiser effect breaks down, the Felicity effect emerges.

4.2. Dependence of the Kaiser Effect on the Loading Strain Rate

Figure 10b shows that when the loading strain rate grows from 10−5 s−1 to 10−3 s−1, the FR increases from 1.06, 0.86, 0.56, 0.46, and 0.37, to 1.35, 1.19, 0.94, 0.81, and 0.70 under σA = 0.5σc, σA = 0.6σc, σA = 0.7σc, σA = 0.8σc, and σA = 0.9σc with the increased proportion of 27.36%, 38.37%, 67.86%, 76.09%, and 89.19%, respectively. Taking σA = 0.5σc for example, the FR increases from 1.06 to 1.21 with the increased proportion of 21.00% as the loading strain rate increases from 10−5 s−1 to 10−4 s−1. When the loading strain rate grows to 10−4 s−1, the FR increases to 1.35 with an increased proportion of 11.57%. That is to say, the FR increases as the loading strain rate increases. The Kaiser effect easily appears, and how the loading strain rate influences the Kaiser effect is greatly affected by σA. Moreover, the loading strain rate significantly affects FR when lsr < 10−4 s−1. The FR rapidly increases as the loading strain rate increases. When lsr ≥ 10−4 s−1, the loading strain rate has a minor influence on the FR.
The impact of loading strain rate on the rock AE features is mainly manifested by the change of AE rate (quantity of AEs generated per second). The higher the AE rate is, the faster the rock specimen is damaged. When the loading strain rate is low (lsr < 10−4 s−1), internal microcracks are generated and expanded for a longer time with a lower AE rate. When the loading strain rate is high (lsr ≥ 10−4 s−1), additional energy supplies and the internal microcracks of the rock are untimely to be closed, which lowers the resistance needed in the cracking process. This accelerates crack expansion and releases more energies with a higher AE rate. Figure 11 shows that the variation of the cumulative number of AEs versus monitoring time under different loading strain rates is generally similar. The cumulative number of AEs of the rock specimen exhibit nonlinear growth. In the first cyclic loading, new cracks are continuously formed inside the rock and original cracks are expanded and connected. The AEs tend to be active with a gradually increasing number. In the constant loading stage of the 1st cycle, some closed cracks experience slippage inside the rock, which would continuously generate a certain quantity of AEs. However, the active degree of AEs in this stage is related to σA. When σA is low (σA < 0.7σc), AEs in this stage are inactive with a small quantity. Consequently, the cumulative quantity of acoustic emissions does not increase. When σA is high (σA ≥ 0.7σc), the AE is relatively active with a relatively larger quantity. The cumulative quantity of AEs slowly increases. In the unloading stage of the 1st cycle and the initial loading stage of the 2nd cycle, few AEs occur. The quantity of AEs basically does not change or slowly increases. In the later loading stage of the 2nd cycle, the AE becomes active. The cumulative quantity of the AEs rapidly increases. Overall, when the loading strain rate is low (lsr < 10−4 s−1), the AE rate of the rock is low, and the cumulative quantity of the AEs slowly increases. The slope of the cumulative quantity of the AEs versus monitoring time is small and increases steadily. When the loading strain rate is high (lsr≥ 10−4 s−1), the AE rate is higher, and the AE number increases abruptly in a short time. The slope of the cumulative quantity of AEs-monitoring time relationship is large and increases rapidly.
The reasons for the effect of loading strain rate on the Kaiser effect can be explained as follows. First, as the loading strain rate ascends, growth of the existing microcracks and new cracks are accelerated, accompanied by gradually enlarged internal damage. More AEs are generated and a higher AE rate is induced. Additionally, a large quantity of AEs occurs earlier, which facilitates the appearance of the Kaiser effect. Second, the red sandstone is compactly structured. Under a low loading strain rate, the stress between the internal particles is continuously transferred and adjusted so that initial damage and microcracks within the rock could be sufficiently developed, which gives rise to a low strength of the rock specimen. With a high loading strain rate, it is found that the stress between the particles inside the rock specimen cannot be quickly transferred and adjusted in the yielding process. Thus, the rock strength is increased as the loading strain rate increases [35,36,37]. Consequently, both σAE and the FR increase, which promotes the possible appearance of the Kaiser effect.

5. Conclusions

We examined the AE evolution of 75 red sandstone specimens submitted to UCLU tests with different prescribed stress levels in the first loading cycle (σA) and loading strain rates (lsr). The stress level of the Kaiser effect (σAE) during the re-loading stage was assigned. Influences of σA and lsr on the rock Kaiser effect were revealed. The main conclusions are:
(1)
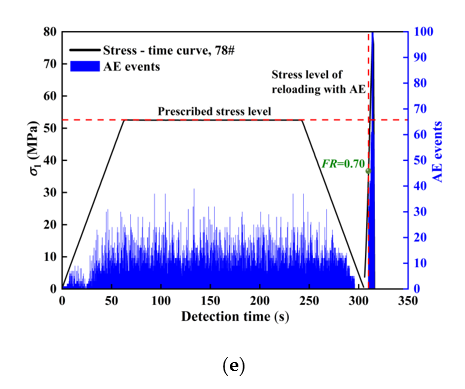
The Kaiser effect is greatly influenced by σA. Internal damage of the rock was gradually intensified as σA grows. Consequently, the Felicity ratio (FR) reduces and the Kaiser effect slowly vanishes, followed by appearance of the Felicity effect. The FR increases as the loading strain rate increases, and this, in turn, increases the possible appearance of the Kaiser effect.
(2)
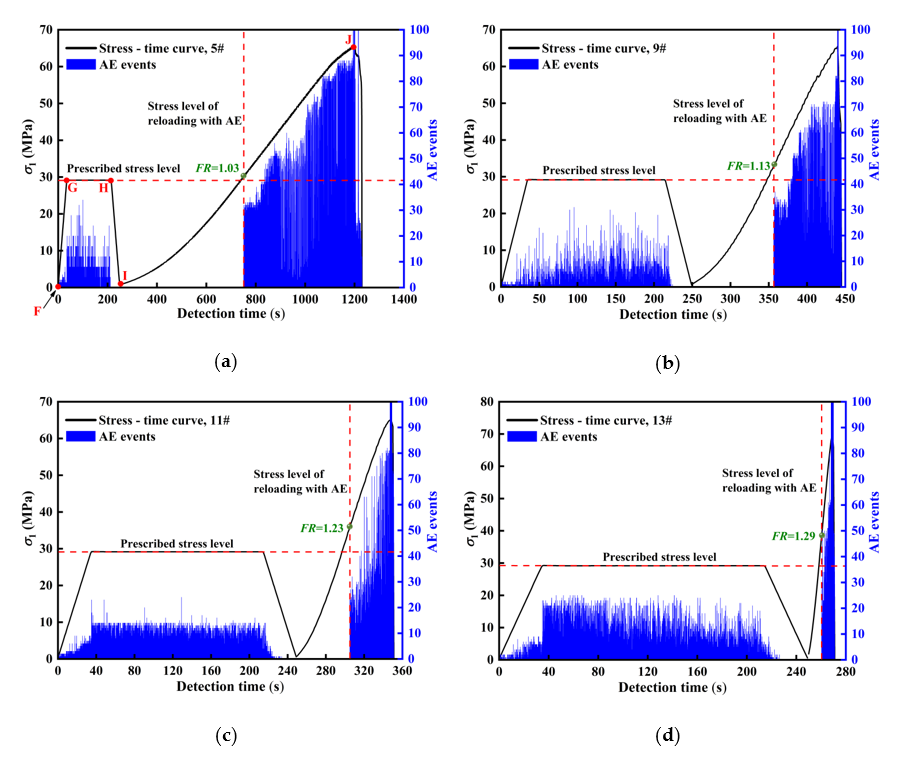
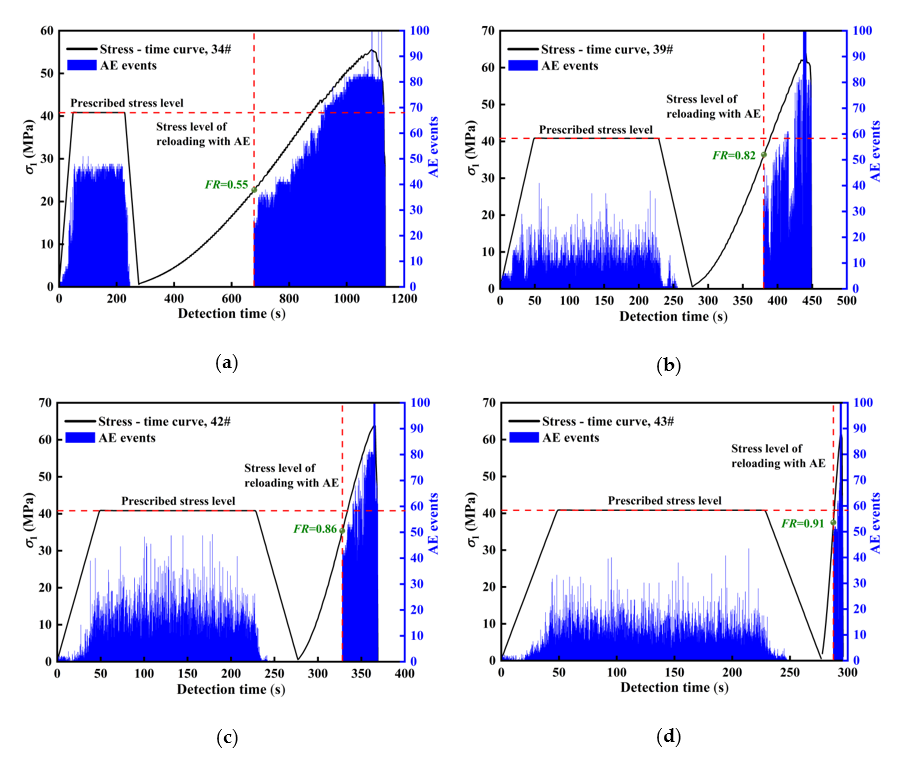
For the red sandstone specimen, the Kaiser effect is always observed when σA is between 0.5σc to 0.7σc, corresponding to the stable crack grow stage in the stress-strain relationship.
(3)
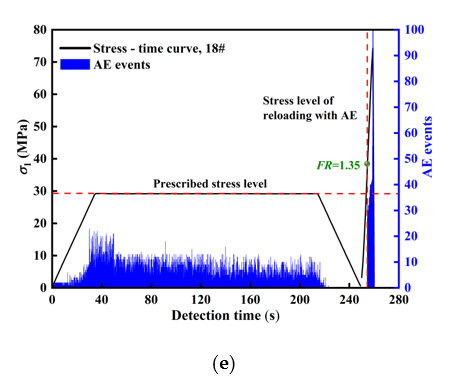
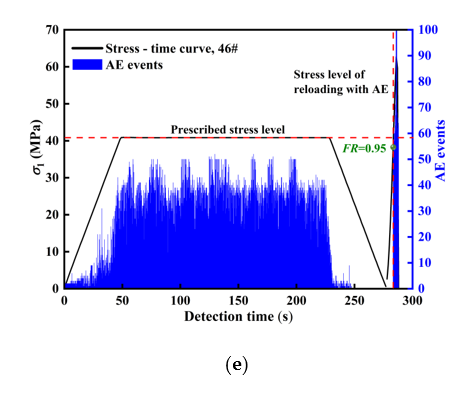
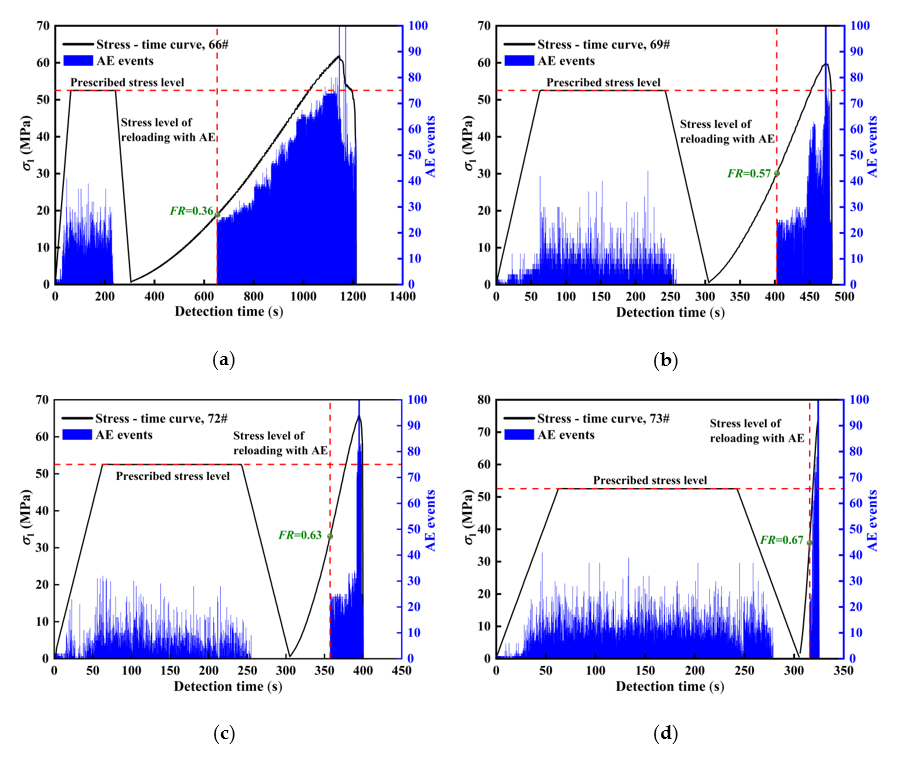
When σA ≤ 0.5σc, a large number of AEs appear in the rock specimen during the re-loading stage only after σA is exceeded, suggesting an apparent Kaiser effect. When σA = 0.6σc, the appearance of the Kaiser effect is closely related to the loading strain rate. For lsr < 10−4 s−1, the Felicity effect appears in the re-loading stage, whereas the Kaiser effect appears in the re-loading process if lsr ≥ 10−4 s−1. When σA ≥ 0.7σc, remarkable AEs are generated in the initial re-loading stage, indicating that the Kaiser effect vanishes and the Felicity effect occurs.
(4)
The FR ascends and the Kaiser effect appears readily as lsr is increased. The FR grows quickly when lsr increases, but is no larger than 10−4 s−1, whereas the increase rate of the FR becomes less remarkable after lsr exceeds 10−4 s−1. Therefore, a relative high loading strain higher than 10−4 s−1 possibly favors the determination of the stress level of the Kaiser effect.

Author Contributions

Conceptualization, Y.C. and Q.M.; methodology, Y.L.; data curation, H.P.; writing—original draft preparation, H.P and K.Z.; writing—review and editing, Y.C. All authors have read and agreed to the published version of the manuscript.

Funding

The research presented in this paper is funded by the National Natural Science Foundation of China (51974296, 51704280, 51974295, U1803118).

Conflicts of Interest

The authors declare no conflict of interest.

References

  1. Zhang, H.Q.; Miao, X.X.; Zhang, G.M.; Wu, Y.; Chen, Y.L. Non-destructive testing and pre-warning analysis on the quality of bolt support in deep roadways of mining districts. Int. J. Min. Sci. Tech. 2017, 27, 989–998. [Google Scholar] [CrossRef]
  2. Liu, D.; Li, J.; Zou, C.N.; Cui, H.Y.; Ni, Y.Y.; Liu, J.Q.; Wu, W.; Zhang, L.; Coyte, R.; Kondash, A.; et al. Recycling flowback water for hydraulic fracturing in Sichuan basin, China: Implications for gas production, water footprint, and water quality of regenerated flowback water. Fuel 2020, 272, 117621. [Google Scholar] [CrossRef]
  3. Wang, H.Y.; Sharma, M.M. A rapid injection flowback test (rift) to estimate in-situ stress and pore pressure. J. Petrol. Sci. Eng. 2020, 190, 107108. [Google Scholar] [CrossRef]
  4. He, Q.Y.; Li, Y.C.; Xu, J.H.; Zhang, C.G. Prediction of mechanical properties of igneous rocks under combined compression and shear loading through statistical analysis. Rock Mech. Rock Eng. 2020, 53, 841–859. [Google Scholar] [CrossRef]
  5. Li, P.; Ren, F.H.; Cai, M.F.; Guo, Q.F.; Miao, S.J. Present-day stress state and fault stability analysis in the capital area of china constrained by in situ stress measurements and focal mechanism solutions. J. Asian Earth Sci. 2019, 185, 104007. [Google Scholar] [CrossRef]
  6. Zhang, N.; Zeng, W.T.; Wang, Y.H.; Sun, Q. Beyond multiple-continuum modeling for the simulation of complex flow mechanisms in multiscale shale porous media. J. Comput. Appl. Math. 2020, 378, 112854. [Google Scholar] [CrossRef]
  7. Li, Y.; Fu, S.S.; Qiao, L.; Liu, Z.B.; Zhang, Y.H. Development of twin temperature compensation and high-level biaxial pressurization calibration techniques for csiro in-situ stress measurement in depth. Rock Mech. Rock Eng. 2019, 52, 1115–1131. [Google Scholar] [CrossRef]
  8. Yan, P.; He, Q.; Lu, W.B.; He, Y.L.; Zhou, W.; Chen, M. Coring damage extent of rock cores retrieved from high in-situ stress condition: A case study. KSCE J. Civ. Eng. 2017, 21, 2946–2957. [Google Scholar] [CrossRef]
  9. Figueiredo, B.; Cornet, F.H.; Lamas, L.; Muralha, J. Determination of the stress field in a mountainous granite rock mass. Int. J. Rock Mech. Min. 2014, 72, 37–48. [Google Scholar] [CrossRef]
  10. Liu, B.; Song, C.J.; Tian, N.; Zhong, H.; Cao, B. In-situ stress measurement and acoustic emission instrumentation for rock burst control in a deep tunnel. In Rock Stress and Earthquakes; Proceedings of the 5th International Symposium on In-Situ Rock Stress, Beijing, China, 25–27 August 2010; Xie, F., Ed.; Taylor & Fransis Group: London, UK, 2010; pp. 407–411. [Google Scholar]
  11. Srinivasan, V.; Gupta, T.; Ansari, T.A.; Singh, T.N. An experimental study on rock damage and its influence in rock stress memory in a metamorphic rock. Bull. Eng. Geol. Environ. 2020, 79, 4335–4348. [Google Scholar] [CrossRef]
  12. Chong, Z.H.; Li, X.H.; Hou, P.; Chen, X.Y.; Wu, Y.C. Moment tensor analysis of transversely isotropic shale based on the discrete element method. Int. J. Min. Sci. Tech. 2017, 27, 507–515. [Google Scholar] [CrossRef]
  13. Elizarov, S.; Barat, V.; Terentyev, D.; Kostenko, P.; Bardakov, V.; Alyakritsky, A.; Koltsov, V.; Trofimov, P. Acoustic emission monitoring of industrial facilities under static and cyclic loading. Appl. Sci. 2018, 8, 1228. [Google Scholar] [CrossRef] [Green Version]
  14. Esola, S.; Wisner, B.; Vanniamparambil, P.; Geriguis, J.; Kontsos, A. Part qualification methodology for composite aircraft components using acoustic emission monitoring. Appl. Sci. 2018, 8, 1490. [Google Scholar] [CrossRef] [Green Version]
  15. Liu, R.; Hao, F.; Engelder, T.; Shu, Z.G.; Yi, J.Z.; Xu, S.; Teng, C.Y. Stress memory extracted from shale in the vicinity of a fault zone: Implications for shale-gas retention. Mar. Petrol. Geol. 2019, 102, 340–349. [Google Scholar] [CrossRef]
  16. Tang, J.H.; Chen, X.D.; Dai, F.; Wei, M.D. Experimental investigation of fracture damage of notched granite beams under cyclic loading using dic and ae techniques. Fatigue Fract. Eng. M. 2020, 43, 1583–1589. [Google Scholar] [CrossRef]
  17. Zang, A.; Oye, V.; Jousset, P.; Deichmann, N.; Gritto, R.; McGarr, A.; Majer, E.; Bruhn, D. Analysis of induced seismicity in geothermal reservoirs—An overview. Geothermics 2014, 52, 6–21. [Google Scholar] [CrossRef] [Green Version]
  18. Meng, Q.B.; Chen, Y.L.; Zhang, M.W.; Han, L.J.; Pu, H.; Liu, J.F. On the kaiser effect of rock under cyclic loading and unloading conditions: Insights from acoustic emission monitoring. Energies 2019, 12, 3255. [Google Scholar] [CrossRef] [Green Version]
  19. Meng, Q.B.; Zhang, M.W.; Han, L.J.; Pu, H.; Chen, Y.L. Acoustic emission characteristics of red sandstone specimens under uniaxial cyclic loading and unloading compression. Rock Mech. Rock Eng. 2018, 51, 969–988. [Google Scholar] [CrossRef]
  20. Chen, Y.L.; Irfan, M. Experimental study of kaiser effect under cyclic compression and tension tests. Geomech. Eng. 2018, 14, 203–209. [Google Scholar]
  21. Li, C.; Nordlund, E. Experimental verification of the kaiser effect in rocks. Rock Mech. Rock Eng. 1993, 26, 333–351. [Google Scholar] [CrossRef]
  22. Lavrov, A. Kaiser effect observation in brittle rock cyclically loaded with different loading rates. Mech. Mater. 2001, 33, 669–677. [Google Scholar] [CrossRef]
  23. Zhang, Y.; Chen, Y.L.; Yu, R.G.; Hu, L.Q.; Irfan, M. Effect of loading rate on the felicity effect of three rock types. Rock Mech. Rock Eng. 2017, 50, 1673–1681. [Google Scholar] [CrossRef]
  24. Li, D.X.; Wang, E.Y.; Kong, X.G.; Jia, H.S.; Wang, D.M.; Muhammad, A. Damage precursor of construction rocks under uniaxial cyclic loading tests analyzed by acoustic emission. Constr. Build. Mater. 2019, 206, 169–178. [Google Scholar]
  25. Mayr, S.I.; Stanchits, S.; Langenbruch, C.; Dresen, G.; Shapiro, S.A. Acoustic emission induced by pore-pressure changes in sandstone samples. Geophysics 2011, 76, MA21–MA32. [Google Scholar] [CrossRef]
  26. Chen, Y.L.; Irfan, M.; Song, C.P. Verification of the kaiser effect in rocks under tensile stress: Experiment using the brazilian test. Int. J. Geomech. 2018, 18, 04018059. [Google Scholar] [CrossRef]
  27. Wu, J.H.; Chang, C.F. Studying on influences of anisotropy of rock mass on determining the pre-stress using kaiser effect. In Proceedings of the International Offshore and Polar Engineering Conference 17th International Offshore and Polar Engineering Conference (ISOPE 2007), Lisbon, Portugal, 1–6 July 2007; p. 1607. [Google Scholar]
  28. Chen, C.F.; Xu, T.; Heap, M.J.; Baud, P. Influence of unloading and loading stress cycles on the creep behavior of darley dale sandstone. Int. J. Rock Mech. Min. 2018, 112, 55–63. [Google Scholar] [CrossRef]
  29. Yoshikawa, S.; Mogi, K. A new method for estimation of the crustal stress from cored rock samples: Laboratory study in the case of uniaxial compression. Tectonophysics 1981, 74, 323–339. [Google Scholar] [CrossRef]
  30. Kurita, K.; Fujii, N. Stress memory of crystalline rocks in acoustic emission. Geophys. Res. Lett. 1979, 6, 9–12. [Google Scholar] [CrossRef]
  31. Chen, Y.L.; Wu, H.S.; Pu, H.; Zhang, K.; Ju, F.; Wu, Y.; Liu, J.F. Investigations of damage characteristics in rock material subjected to the joint effect of cyclic loading and impact. Energies 2020, 13, 2154. [Google Scholar] [CrossRef]
  32. Cai, M.; Kaiser, P.K.; Suorineni, F.; Su, K. A study on the dynamic behavior of the meuse/haute-marne argillite. Phys. Chem. Earth 2007, 32, 907–916. [Google Scholar] [CrossRef]
  33. Zhang, Q.B.; Zhao, J. A review of dynamic experimental techniques and mechanical behaviour of rock materials. Rock Mech. Rock Eng. 2014, 47, 1411–1478. [Google Scholar] [CrossRef] [Green Version]
  34. Rao, M.V.M.S.; Ramana, Y.V. A study of progressive failure of rock under cyclic loading by ultrasonic and ae monitoring techniques. Rock Mech. Rock Eng. 1992, 25, 237–251. [Google Scholar] [CrossRef]
  35. Meng, Q.B.; Zhang, M.W.; Han, L.J.; Pu, H.; Li, H. Effects of size and strain rate on the mechanical behaviors of rock specimens under uniaxial compression. Arab. J. Geosci. 2016, 9, 1–14. [Google Scholar] [CrossRef]
  36. Peng, S.; Podnieks, E.R. Relaxation and the behavior of failed rock. Int. J. Rock Mech. Min. Sci. Geomech. Abstr. 1972, 9, 699–700. [Google Scholar] [CrossRef]
  37. Blanton, T.L. Effect of strain rates from 10−2 to 10 sec-1 in triaxial compression tests on three rocks. Int. J. Rock Mech. Min. Sci. Geomech. Abstr. 1981, 18, 47–62. [Google Scholar] [CrossRef]
Figure 1. Mineralogical features of the red sandstone: (a) X-ray Diffraction (XRD) patterns; (b) Microscopic image; (c) Grain size distribution.
Applsci 10 07324 g001aApplsci 10 07324 g001b
Figure 2. Experimental configuration of the uniaxial cyclic loading and unloading (UCLU) test of the red sandstone.
Applsci 10 07324 g002
Figure 3. Loading path of the UCLU test.
Applsci 10 07324 g003
Figure 4. Acoustic emission (AE) characteristics of the uniaxial compression test of red sandstone.
Applsci 10 07324 g004
Figure 5. AE curves of the UCLU tests when σA = 0.5σc: (a) lsr = 10−5 s−1; (b) lsr = 5 × 10⁻⁵ s−1; (c) lsr = 10−4 s−1; (d) lsr = 5 × 10⁻⁴ s−1; (e) lsr = 10−3 s−1.
Applsci 10 07324 g005aApplsci 10 07324 g005b
Figure 6. AE curves of the UCLU tests when σA = 0.6σc: (a) lsr = 10−5 s−1; (b) lsr = 5 × 10⁻⁵ s−1; (c) lsr = 10−4 s−1; (d) lsr = 5×10⁻⁴ s−1; (e) lsr = 10−3 s−1.
Applsci 10 07324 g006aApplsci 10 07324 g006b
Figure 7. AE curves of the UCLU tests when σA = 0.7σc: (a) lsr = 10−5 s−1; (b) lsr = 5 × 10⁻⁵ s−1; (c) lsr = 10−4 s−1; (d) lsr = 5 × 10⁻⁴ s−1; (e) lsr = 10−3 s−1.
Applsci 10 07324 g007aApplsci 10 07324 g007b
Figure 8. AE curves of the UCLU tests when σA = 0.8σc: (a) lsr = 10−5 s−1; (b) lsr = 5 × 10⁻⁵ s−1; (c) lsr = 10−4 s−1; (d) lsr = 5 × 10⁻⁴ s−1; (e) lsr = 10−3 s−1.
Applsci 10 07324 g008aApplsci 10 07324 g008b
Figure 9. AE curves of the UCLU tests when σA = 0.9σc: (a) lsr = 10−5 s−1; (b) lsr = 5 × 10⁻⁵ s−1; (c) lsr = 10−4 s−1; (d) lsr = 5 × 10⁻⁴ s−1; (e) lsr = 10−3 s−1.
Applsci 10 07324 g009aApplsci 10 07324 g009b
Figure 10. Felicity rate variations under various prescribed stresses and loading strain rates, respectively: (a) Felicity rate variations under different prescribed stress levels (relative to σc); (b) Felicity rate variations under different loading strain rates.
Applsci 10 07324 g010
Figure 11. Cumulative number of acoustic emissions-monitoring time curves of red sandstones under different loading strain rates: (a) σA = 0.5σc; (b) σA = 0.6σc; (c) σA = 0.7σc; (d) σA = 0.8σc; (e) σA = 0.9σc.
Applsci 10 07324 g011aApplsci 10 07324 g011b
Table 1. Experimental schemes of the UCLU test.
Serial Number of
Rock Specimens
Loading Strain Rate (lsr, s−1)
1 × 10−55 × 10−51 × 10−45 × 10−41 × 10−3
σA (MPa)0.5σc4#, 5#, 6#7#, 8#, 9#10#, 11#, 12#13#, 14#, 15#16#, 17#, 18#
0.6σc19#, 20#, 21#22#, 23#, 24#25#, 26# 27#28#, 29#, 30#31#, 32#, 33#
0.7σc34#, 35#, 36#37#, 38#, 39#40#, 41#, 42#43#, 44#, 45#46#, 47#, 48#
0.8σc49#, 50#, 51#52#, 53#, 54#55#, 56#, 57#58#, 59#, 60#61#, 62#, 63#
0.9σc64#, 65#, 66#67#, 68#, 69#70#, 71#, 72#73#, 74#, 75#76#, 77#, 78#
Table 2. Felicity ratios under different stress levels and loading strain rates.
Felicity Ratio
(FR)
Loading Strain Rate (lsr, s−1)
1 × 10−55 × 10−51 × 10−45 × 10−41 × 10−3
σA (MPa)0.5σc1.08, 1.03, 1.071.14, 1.11, 1.131.21, 1.23, 1.191.29, 1.27, 1.251.32, 1.38, 1.35
0.6σc0.86, 0.88, 0.850.95, 0.90, 0.921.05, 1.00, 0.991.10, 1.15, 1.141.19, 1.18, 1.21
0.7σc0.55, 0.61, 0.530.83, 0.84, 0.820.87, 0.86, 0.860.91, 0.88, 0.910.95, 0.94, 0.93
0.8σc0.45, 0.46, 0.460.71, 0.69, 0.670.73, 0.74, 0.730.78, 0.77, 0.800.82, 0.80, 0.81
0.9σc0.37, 0.39, 0.360.60, 0.59, 0.570.64, 0.63, 0.630.67, 0.66, 0.670.70, 0.69, 0.70
Publisher’s Note: MDPI stays neutral with regard to jurisdictional claims in published maps and institutional affiliations.

