Article

Experimental Devices to Investigate the Long-Term Stability of Phase Change Materials under Application Conditions

1
Bavarian Center for Applied Energy Research (ZAE Bayern), Walther-Meißner-Str. 6, 85748 Garching, Germany
2
Thermal Storage and Solar Fuels Unit, CIEMAT-PSA, Av. Complutense 40, 28040 Madrid, Spain
3
GREiA Research Group, Universitat de Lleida, Pere de Cabrera s/n, 25001 Lleida, Spain
4
Department of Civil Engineering, Technical University of Denmark (DTU), Brovej, Building 118, 2800 Kongens Lyngby, Denmark
5
Faculty of Engineering of Bilbao, University of the Basque Country (UPV/EHU), Rafael Moreno Pitxitxi 2, 48012 Bilbao, Spain
6
Institute of Mechanical Engineering and Energy Technology IME, Lucerne University of Applied Sciences and Arts (HSLU), Technikumstrasse 21, 6048 Horw, Switzerland
7
Lab of Applied Multiphase Thermal Engineering (LAMTE), Dalhousie University, 5269 Morris St., Halifax, NS B3H 4R2, Canada
8
Fraunhofer Institute for Solar Energy Systems ISE, Heidenhofstr. 2, 79110 Freiburg, Germany
9
Chair of Engineering Thermodynamics and Transport Processes (LTTT), Center of Energy Technology (ZET), University of Bayreuth, Universitätsstraße 30, 95447 Bayreuth, Germany
10
Laboratoire de Génie Civil et géo-Environnement (LGCgE), ULR 4515, Univercity Artois, F-62400 Béthune, France
11
CEA/LITEN/DTNM/SA3D/LMCM, CEA Grenoble, Université Grenoble Alpes, 38000 Grenoble, France
*
Author to whom correspondence should be addressed.
Appl. Sci. 2020, 10(22), 7968; https://doi.org/10.3390/app10227968
Submission received: 1 September 2020 / Revised: 16 October 2020 / Accepted: 29 October 2020 / Published: 10 November 2020
(This article belongs to the Special Issue Advanced Phase Change Materials for Thermal Storage)

Abstract

:
An important prerequisite to select a reliable phase change material (PCM) for thermal energy storage applications is to test it under application conditions. In the case of solid–liquid PCM, a large amount of thermal energy can be stored and released in a small temperature range around the solid–liquid phase transition. Therefore, to test the long-term stability of solid–liquid PCM, they are subjected to melting and solidification processes taking into account the conditions of the intended application. In this work, 18 experimental devices to investigate the long-term stability of PCM are presented. The experiments can be divided into thermal cycling stability tests, tests on PCM with stable supercooling, and tests on the stability of phase change slurries (PCS). In addition to these experiments, appropriate methods to investigate a possible degradation of the PCM are introduced. Considering the diversity of the investigated devices and the wide range of experimental parameters, further work toward a standardization of PCM stability testing is recommended.

1. Introduction

Phase change materials (PCM) can store large amounts of thermal energy in a small temperature range around their phase change temperature. Therefore, latent heat storage systems based on PCM can provide high thermal energy storage densities [1,2,3,4]. An important prerequisite to select a reliable phase change material (PCM) for thermal energy storage applications is to investigate its stability under application conditions. Since appropriate testing devices are not commercially available, lots of different self-built devices exist in various research institutions. Many of these institutions are currently participating in IEA ES Annex 33/SHC Task 58 “Material and Component Development for Compact Thermal Energy Storage”, which is a joint working group of the “Energy Storage” (ES) and the “Solar Heating and Cooling” (SHC) Technology Collaboration Programmes (TCP) of the International Energy Agency (IEA) [5]. The main goal of this working group is to support an application-oriented development of innovative and compact thermal energy storage materials including PCM and thermochemical materials (TCM). Therefore, the participants have proposed sharing their experience regarding PCM stability testing. In total, 18 mostly self-built devices from 10 institutions are presented in this survey. The experiments performed can be divided in three types: type A: thermal cycling stability tests; type B: tests on PCM with stable supercooling, and type C: tests on the stability of phase change slurries (PCS).
In the case of solid–liquid PCM, heat is stored and released under repeated melting and solidification processes, which are also referred as thermal cycles. To assess the suitability of a PCM for a thermal storage application, testing the variation of its thermal properties under repeated thermal cycling (type A tests) taking application conditions into account is crucial [6,7,8]. Relevant experimental conditions are the temperature interval, heating and cooling rates, contact to atmosphere, contact to container, heat exchanger material, etc.
To study thermal cycling stability, the PCM under investigation is typically subjected to a temperature–time profile, as shown in Figure 1.
Two temperature levels, one above (Thigh) and one below (Tlow) the melting temperature (Tm), are applied alternately for a defined number of cycles. Certain periods of time are necessary to obtain a complete phase change from solid to liquid and vice versa. In between these two temperature levels, transition steps are carried out, either using temperature ramps with controlled temperature gradients, allowing natural cooling, or by heating and cooling as fast as possible. The curves plotted in Figure 1 are idealized. In reality (e.g., as shown in Figure 20), both the temperature–time profile of the heat transfer medium (solid black line) and the temperature response of the PCM under investigation (dashed red line) will not change suddenly between isothermal segments and transition segments. In addition, in many experiments, supercooling of the PCM will occur at least to a small extent.
Among the thermal properties to be checked after (or during) thermal cycling, the enthalpy–temperature curves upon melting and solidification are particularly relevant. In this context, a material can be regarded as stable after a certain number of thermal cycles if melting temperature and melting enthalpy variations remain within specific tolerance values. For example, according to the “RAL Quality Association PCM” [9] testing regulations, a decrease of the melting enthalpy by less than 10% and a melting temperature variation of ±1 K can be tolerated after a certain number of cycles. PCM are classified in cycling categories according to the number of cycles performed without damage: from A category (10,000 cycles) to F category (50 cycles). However, the testing regulations of the “RAL Quality Association PCM” neither indicate details on the appropriate design of stability testing devices nor give recommendations on suitable experimental techniques to study the stability of relevant properties after thermal cycling (except calorimetric techniques to measure enthalpy–temperature curves). In addition, apart from defining different cycling categories, nothing is said about the long-term stability of PCM under application conditions. So far, other testing regulations dedicated to the thermal cycling stability of PCM have not been proposed.
A concept for medium and long-term thermal energy storage is to utilize the ability of certain PCM to be stored as a liquid in the supercooled state. As investigated by Englmair et al. [10] and Desgrosseilliers [11], the application of sodium acetate trihydrate (SAT) in closed containers permits the use of its sensible heat capacity after melting while preserving its heat of fusion at room temperature in a state of stable supercooling. The result is a thermal energy storage capacity that can be used on demand by the controlled initialization of crystallization. This storage concept has been demonstrated for a solar heating system [12,13] and showed potential for compact thermal energy storage systems in buildings [14]. Recently, Duquesne et al. reported Xylitol [15] and Puupponen et al. reported micro-structured polyol-polystyrene composites [16] as further promising materials with stable supercooling properties. To investigate the stability of PCM with stable supercooling (type B tests), dedicated test procedures are required. In addition to temperature–time profiles of regular thermal cycling tests, both the degree and duration of supercooling are parameters of interest.
Phase change slurries (PCS) are fluids composed of PCM and a carrier fluid [1]. A PCS is stable if the emulsified or encapsulated PCM droplets do not degrade during operation, e.g., due to an agglomeration of droplets or a PCM leakage in the case of capsules. Among others, the stability of PCS depends on the investigated sample and particle size and the applied flow rate. Stability testing of PCS is carried out with self-built experimental devices (type C tests) that provide application-oriented charging and discharging conditions.
While existing studies reported on stability tests of a certain PCM tested with a certain device for a given number of thermal cycles (as e.g., in the review articles of Ferrer et al. [6] and Rathod and Banerjee [17]), this work focuses on the experimental devices and testing procedures that are being used to perform PCM stability tests under application conditions.
The aims of this work are as follows: first, to give an overview of the variety of experimental devices that are being used to investigate the long-term stability of PCM; second, to compare the specifications and test conditions of these devices, and to identify differences or similarities of the applied methods; third, to increase awareness that PCM stability studies need to take application conditions into account in order to investigate possible degradation phenomena in a realistic manner; and fourth, to initiate a discussion of whether there is a need to define or develop standardized stability test devices and procedures.
Following the comparison of investigated validation test devices of types A to C (Section 2), appropriate experimental methods to detect a possible degradation of the PCM are introduced (Section 3).

2. Comparison of Experimental Devices

2.1. Summary of Technical Specifications

This article is based on a survey comparing the experimental conditions and procedures of 18 testing devices from 10 different institutions. The device names used are formed according to the abbreviations of the respective institute designations. The technical specifications and the experimental conditions of these devices are summarized in Table 1. Devices are divided into thermal cycling stability tests (type A), tests on PCM utilizing stable supercooling (type B), and tests on the stability of PCS and encapsulated PCM (type C). The experimental devices for thermal cycling stability tests (type A) are typically used to test common PCM such as salt hydrates, paraffins, and other organic materials (e.g., fatty acids and esters). Further information about the investigated materials and their measured stability as well as further specifications of the devices can be found in the quoted references.

2.2. Descriptions of Testing Devices

In this section, the experimental setups, operating principles, and testing procedures of the self-built stability testing devices are presented. Devices are grouped and listed in the same order as in Table 1.

2.2.1. Type A—Thermal Cycling Stability Tests

CIEMAT I

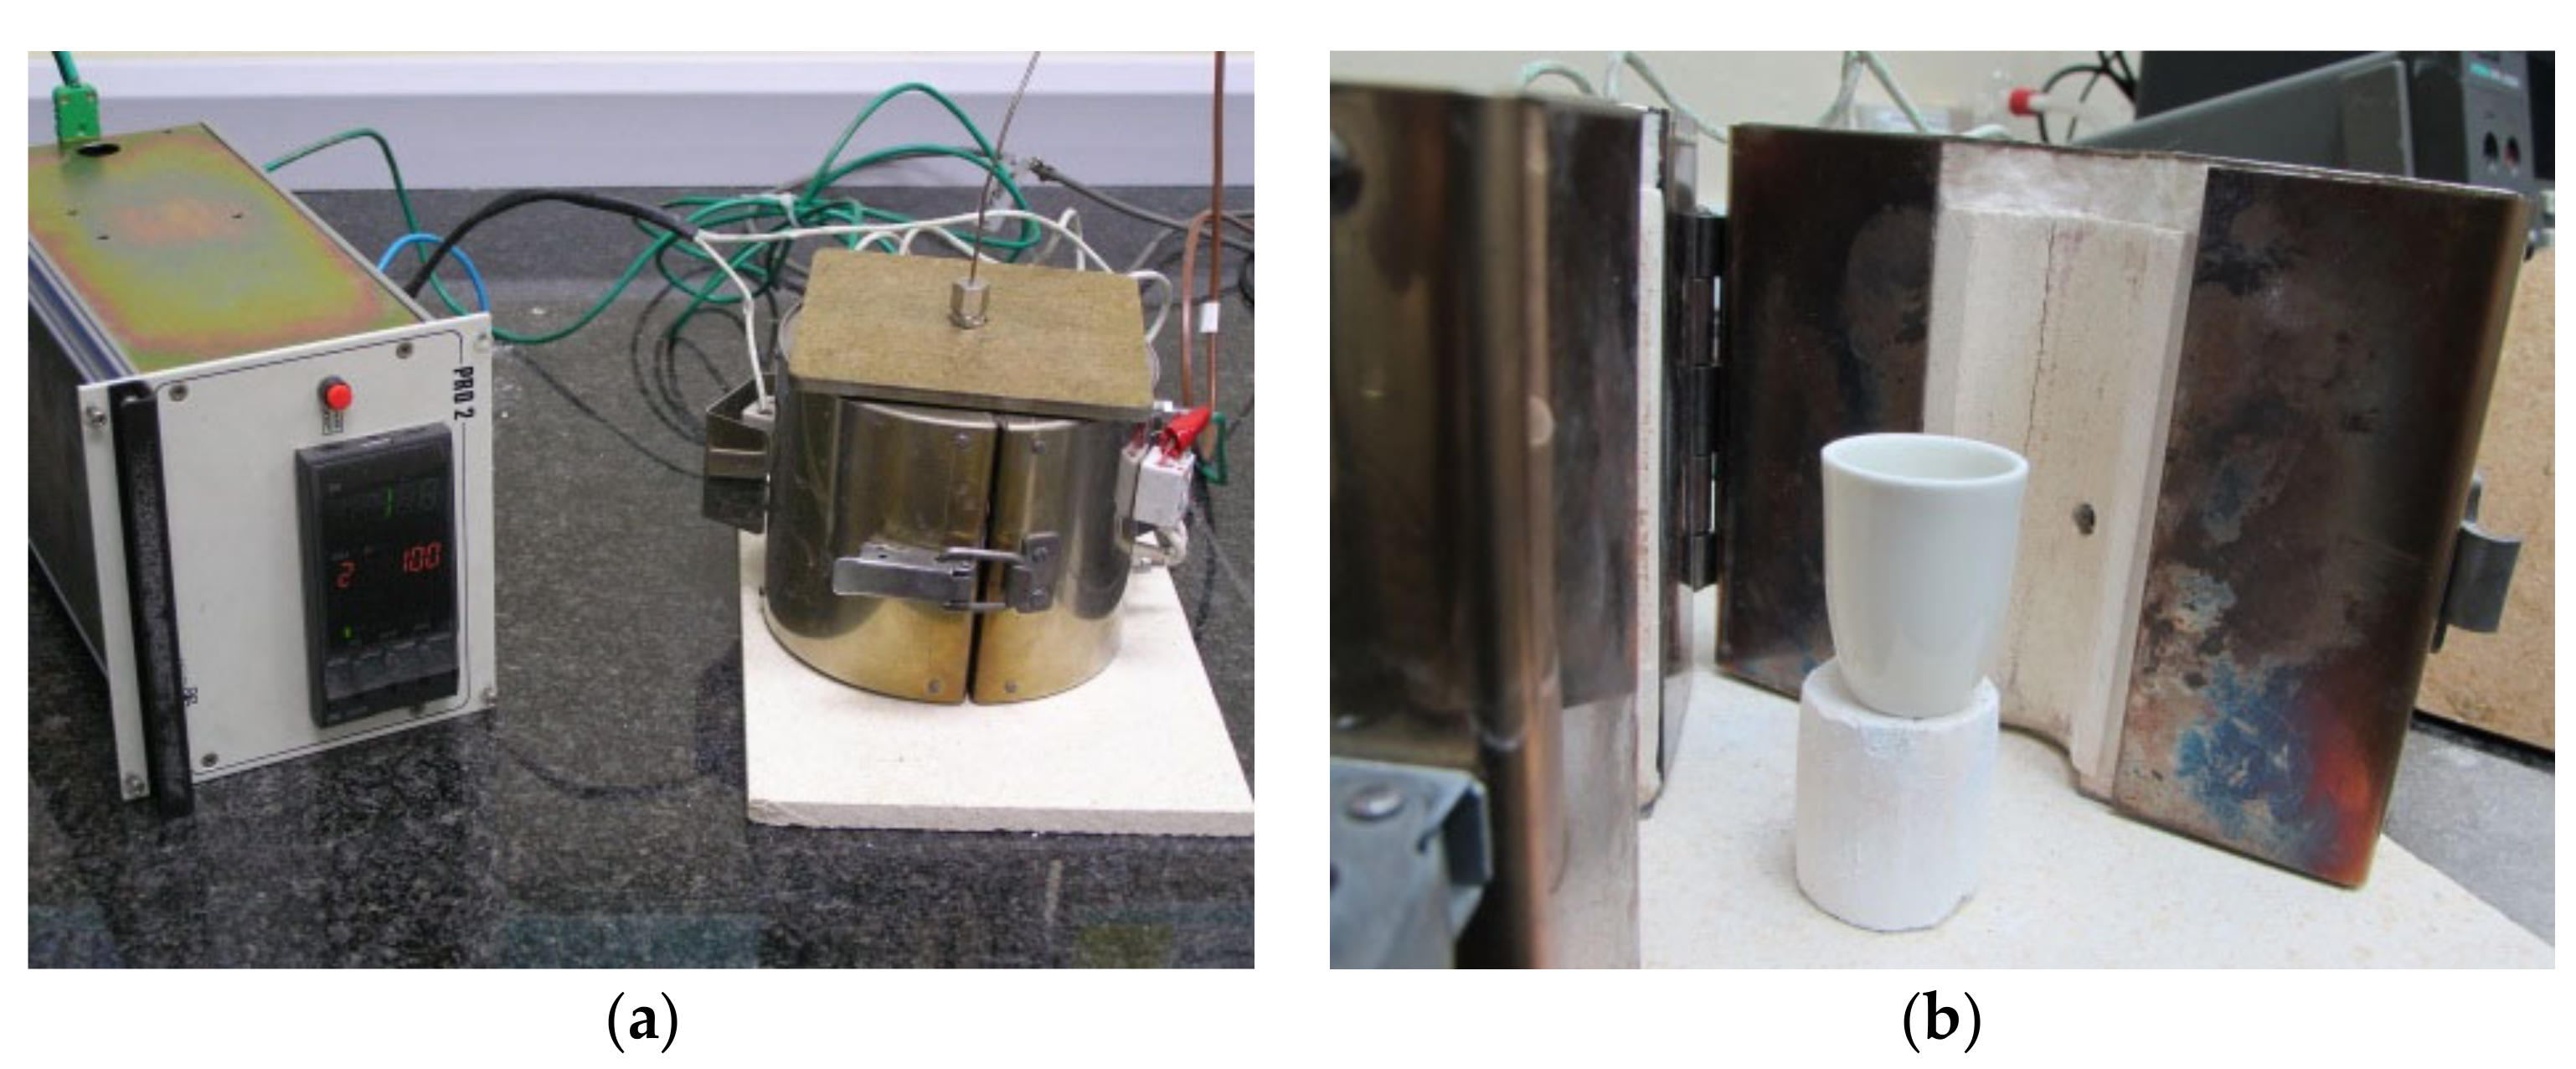
The experimental device “CIEMAT I” is an oven that allows performing thermal tests under controlled heating and cooling rates with stand-by periods at constant temperatures up to 350 °C. Pictures of this device are shown in Figure 2. Thermal cycles can be performed between two temperature levels with transitions via linear ramps with rates from 1 to 20 K∙min−1. These ramps can be combined with stand-by periods up to a maximum test time of 24 h.
The temperature inside the oven is accurately controlled thanks to a fan located on one side, which provides forced ventilation (Figure 2b). Various samples with different sizes can be tested simultaneously under static ambient air. During the experiments, the temperature of both sample(s) and oven are monitored with calibrated T-type thermocouples.

CIEMAT II

The “CIEMAT II” device consists of a vertical oven with a cylindrical ceramic cavity as shown in Figure 3. This oven can perform thermal cycles up to 500 °C at controlled heating rates (between 1 and 20 K∙min−1) with stand-by periods at constant temperature. To cool down the sample, the heating system automatically switches off so that only natural cooling can be achieved. This device also allows performing thermal tests at constant temperature for indefinite periods of time. Moreover, it can be installed inside an extraction hood so that PCM thermal degradation tests under air can be carried out either at constant heating rate or constant temperature.
As shown in Figure 3b, only one sample can be tested at a time remaining under atmospheric air. During the experiments, the sample temperature is monitored with calibrated T-type or J-type thermocouples. Typically, one thermal cycle per day is carried out.

CIEMAT III

“CIEMAT III” is a thermal cycling device shown in Figure 4. It consists of a vessel enclosed inside a furnace that allows performing cycles under controlled heating (between 1 and 20 K∙min−1) up to 500 °C and natural cooling (Figure 4a) with stand-by periods in between. This device also allows performing thermal tests at constant temperature for indefinite periods of time. The testing vessel is a metallic cavity closed by two flanges where only one sample can be introduced. In the upper covering flange, a J-type thermocouple is installed to record the sample temperature during the experiments, and the lower flange has two connecting pipes for gas inlet and outlet, respectively (Figure 4b). Each gas pipe is connected to a valve that allows gas entrance and exit and keeps the pressure in the device at a user-defined pressure range. The gas facility is prepared for using Ar or N2, but other gases such as air might also be used.

EHU

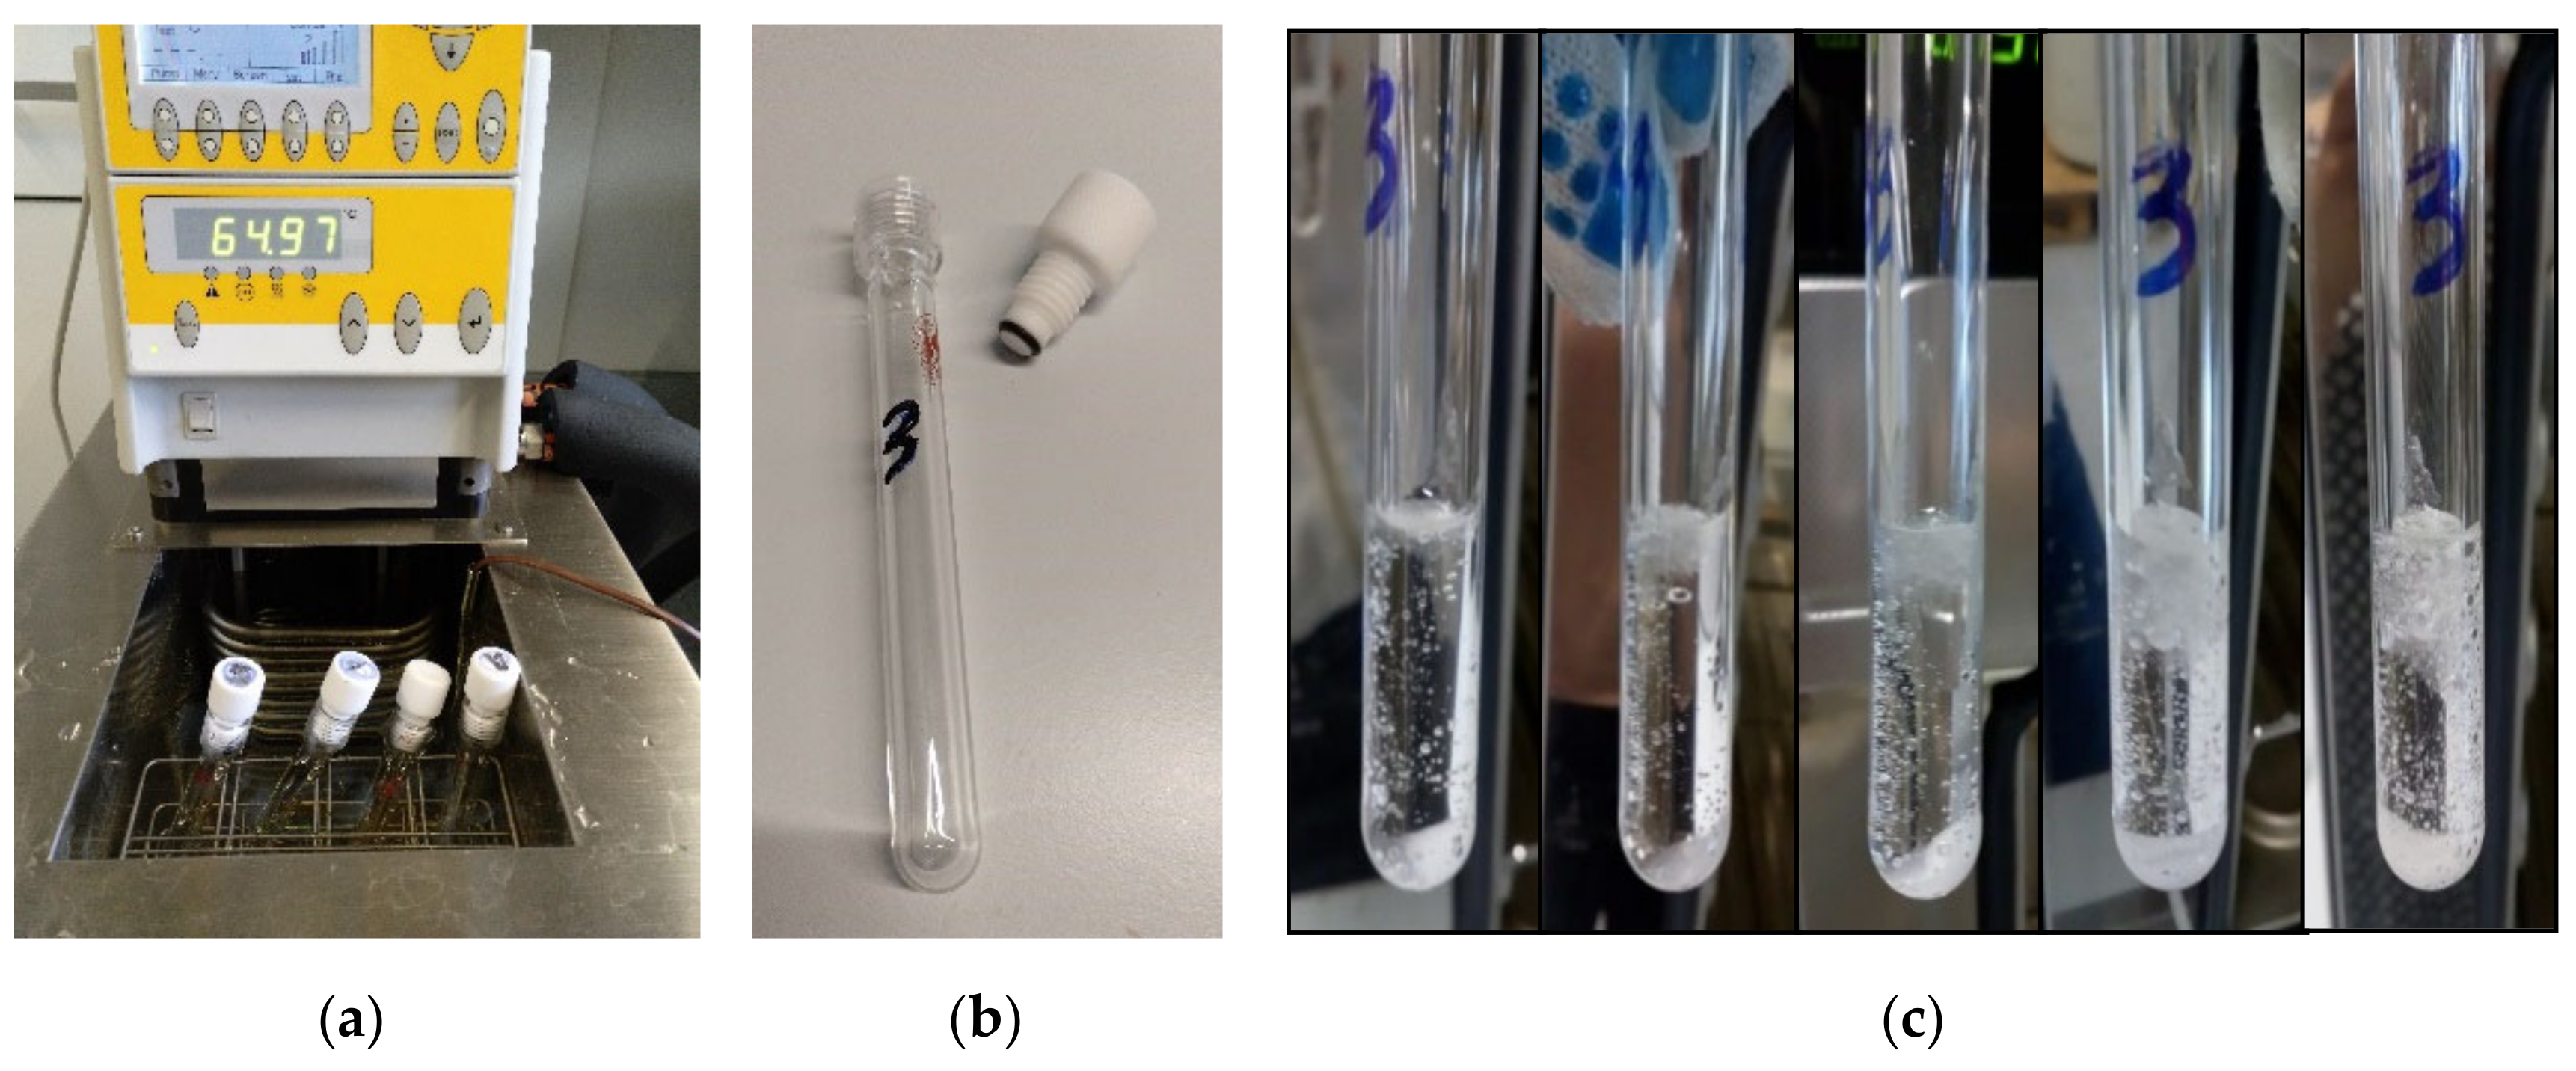
The testing device “EHU” is comprised of a thermostatic bath and airtight tubes. The samples are inserted inside the tubes, and these are immersed into the thermostatic bath, which uses silicone oil as a heat transfer fluid. The tubes are made of glass and include a nylon screwed cap with an O-ring sealing that ensures tightness. They can handle pressures up to 10 bar. The usual sample size is approximately 5 g, although tubes with variable dimensions can be employed (Figure 5).
The arrangement and configuration are flexible and adapted to the investigated PCM and the kind of degradation expected. The temperature program usually comprises consecutive heating and cooling cycles if physical phase separation is expected. When the material under study might undergo thermal decomposition, then the program normally consists of submitting different samples to a constant temperature. The samples are extracted after different periods of time and analyzed. Several complementary techniques are used. Variations on the thermal behavior (storage capacity, melting temperatures, and others) are evaluated by differential scanning calorimetry (DSC). Visual control is kept by periodic imaging. Additional information is obtained by X-Ray diffraction, Fourier transform infrared spectroscopy (FT-IR), and liquid chromatography.
During the experiment, the temperature of the thermostatic bath is measured. The temperature inside of the samples can be also recorded by introducing a thermocouple inside a “sacrificed” sample. Normally, the PCM is in contact with air. However, other gases (e.g., N2 or Ar) can be introduced by the use of a controlled atmosphere chamber (a globe box).

HSLU

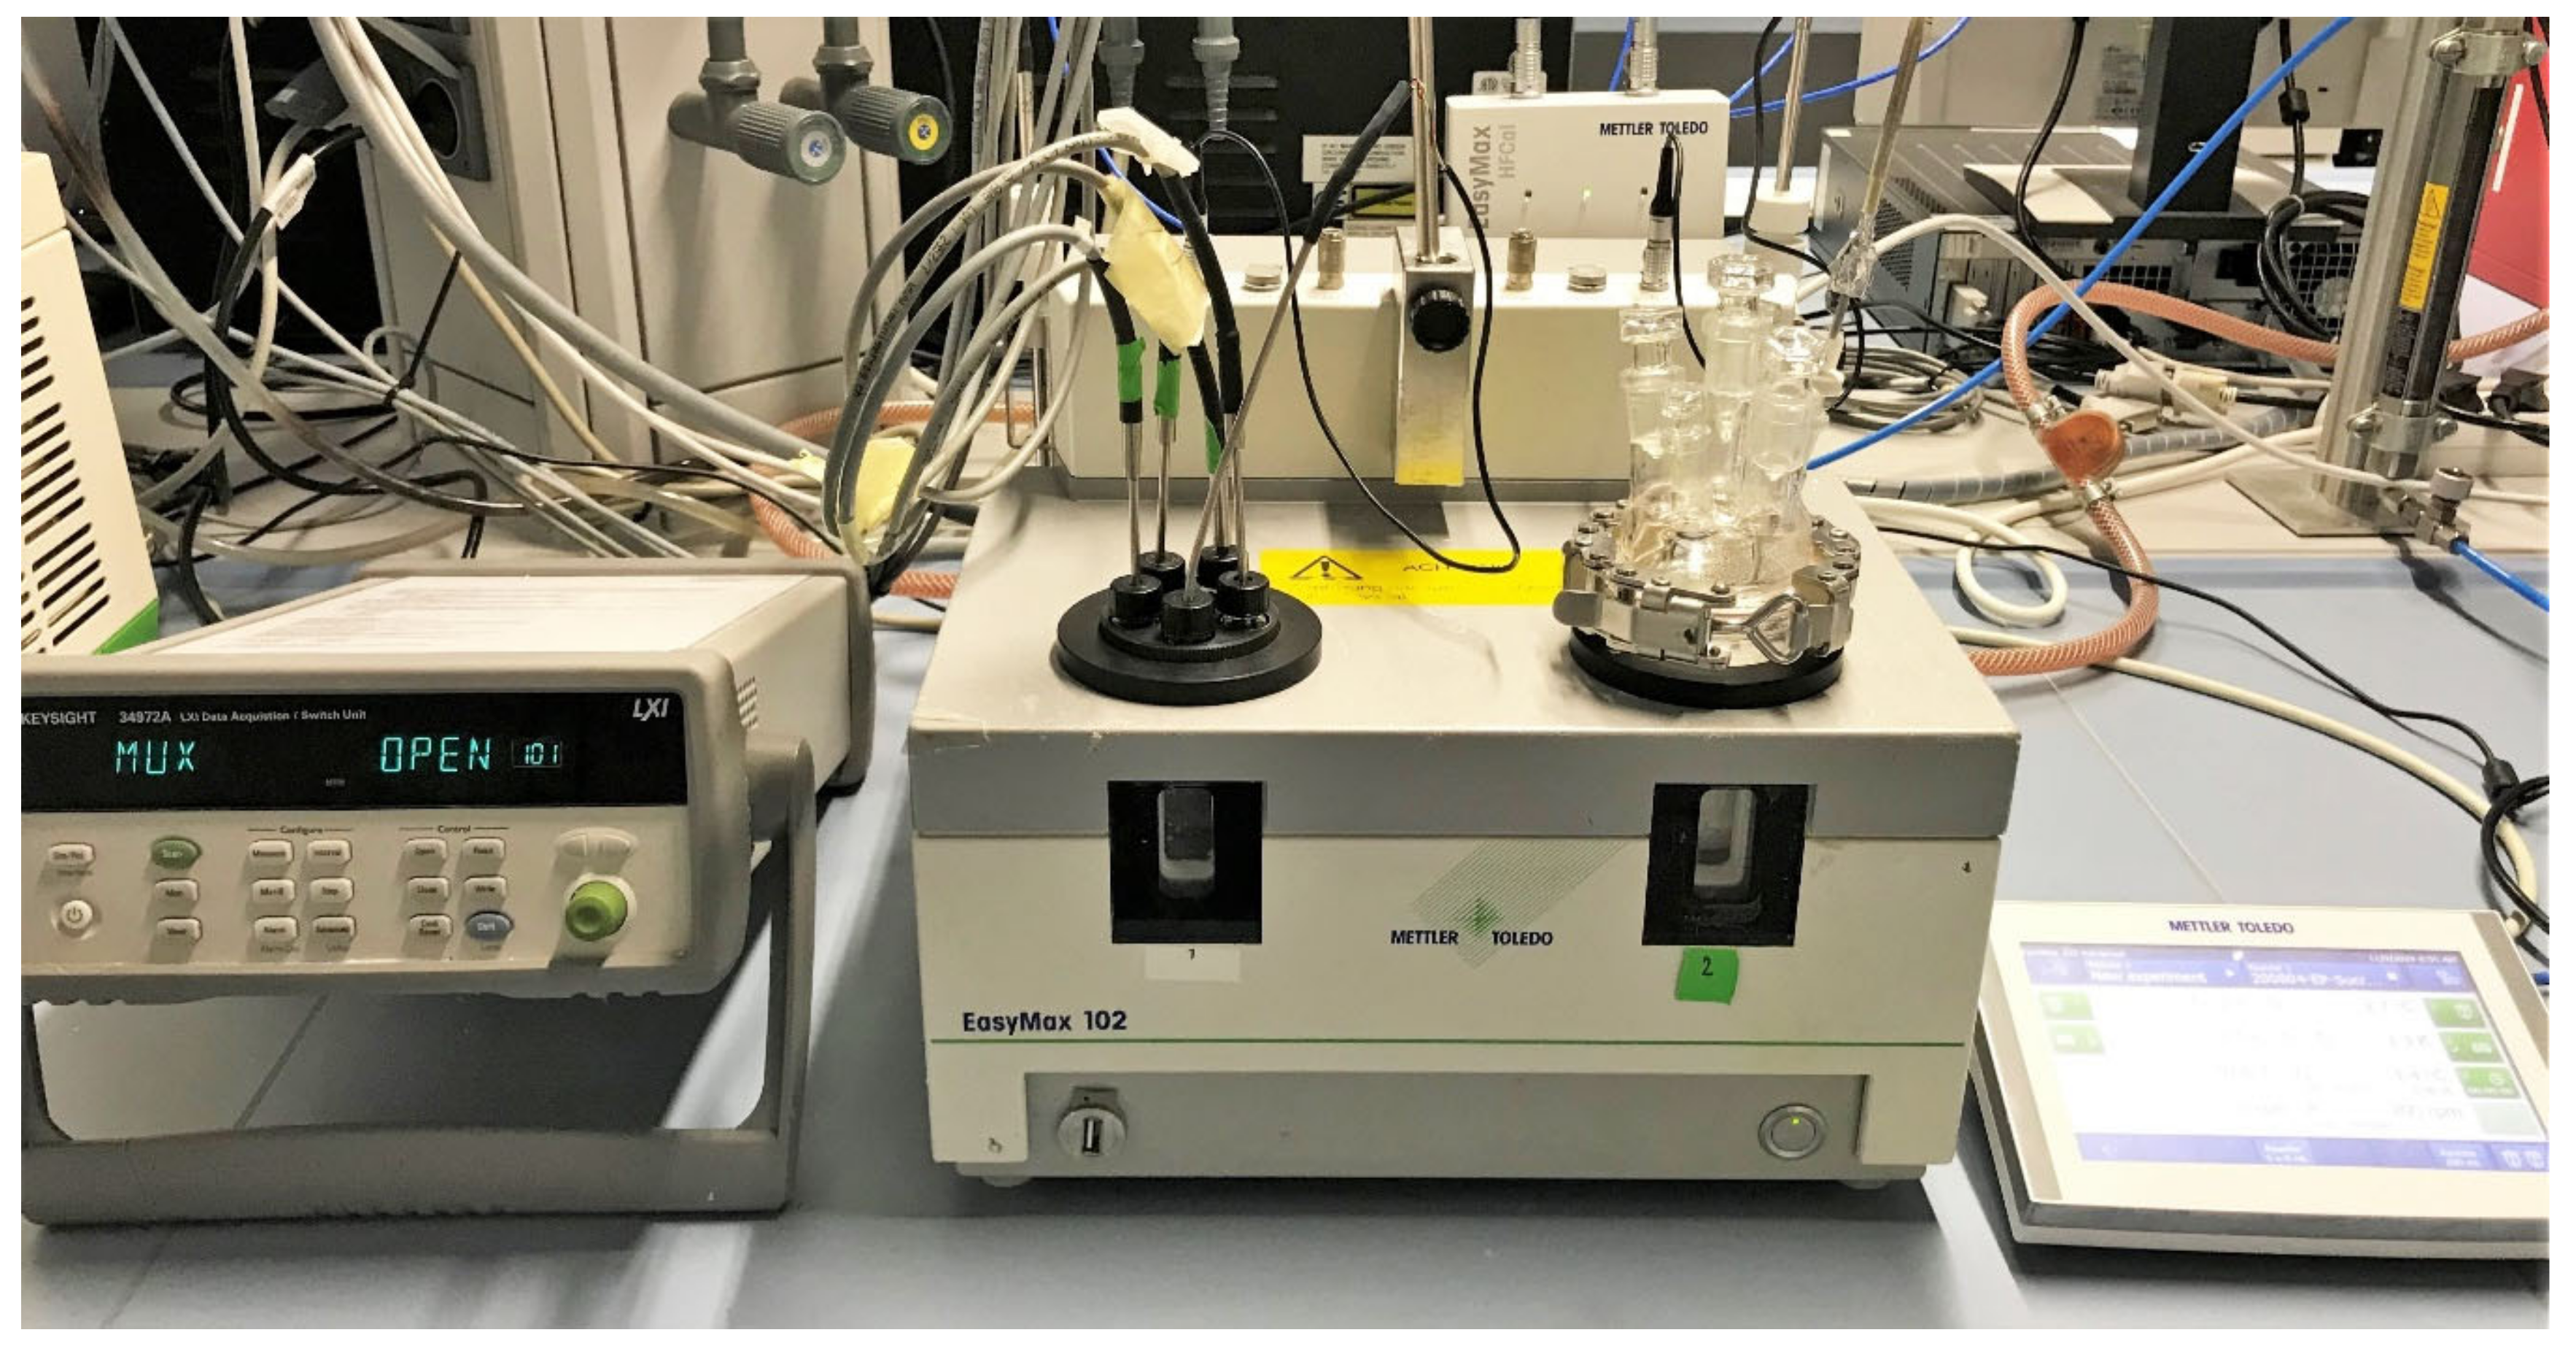
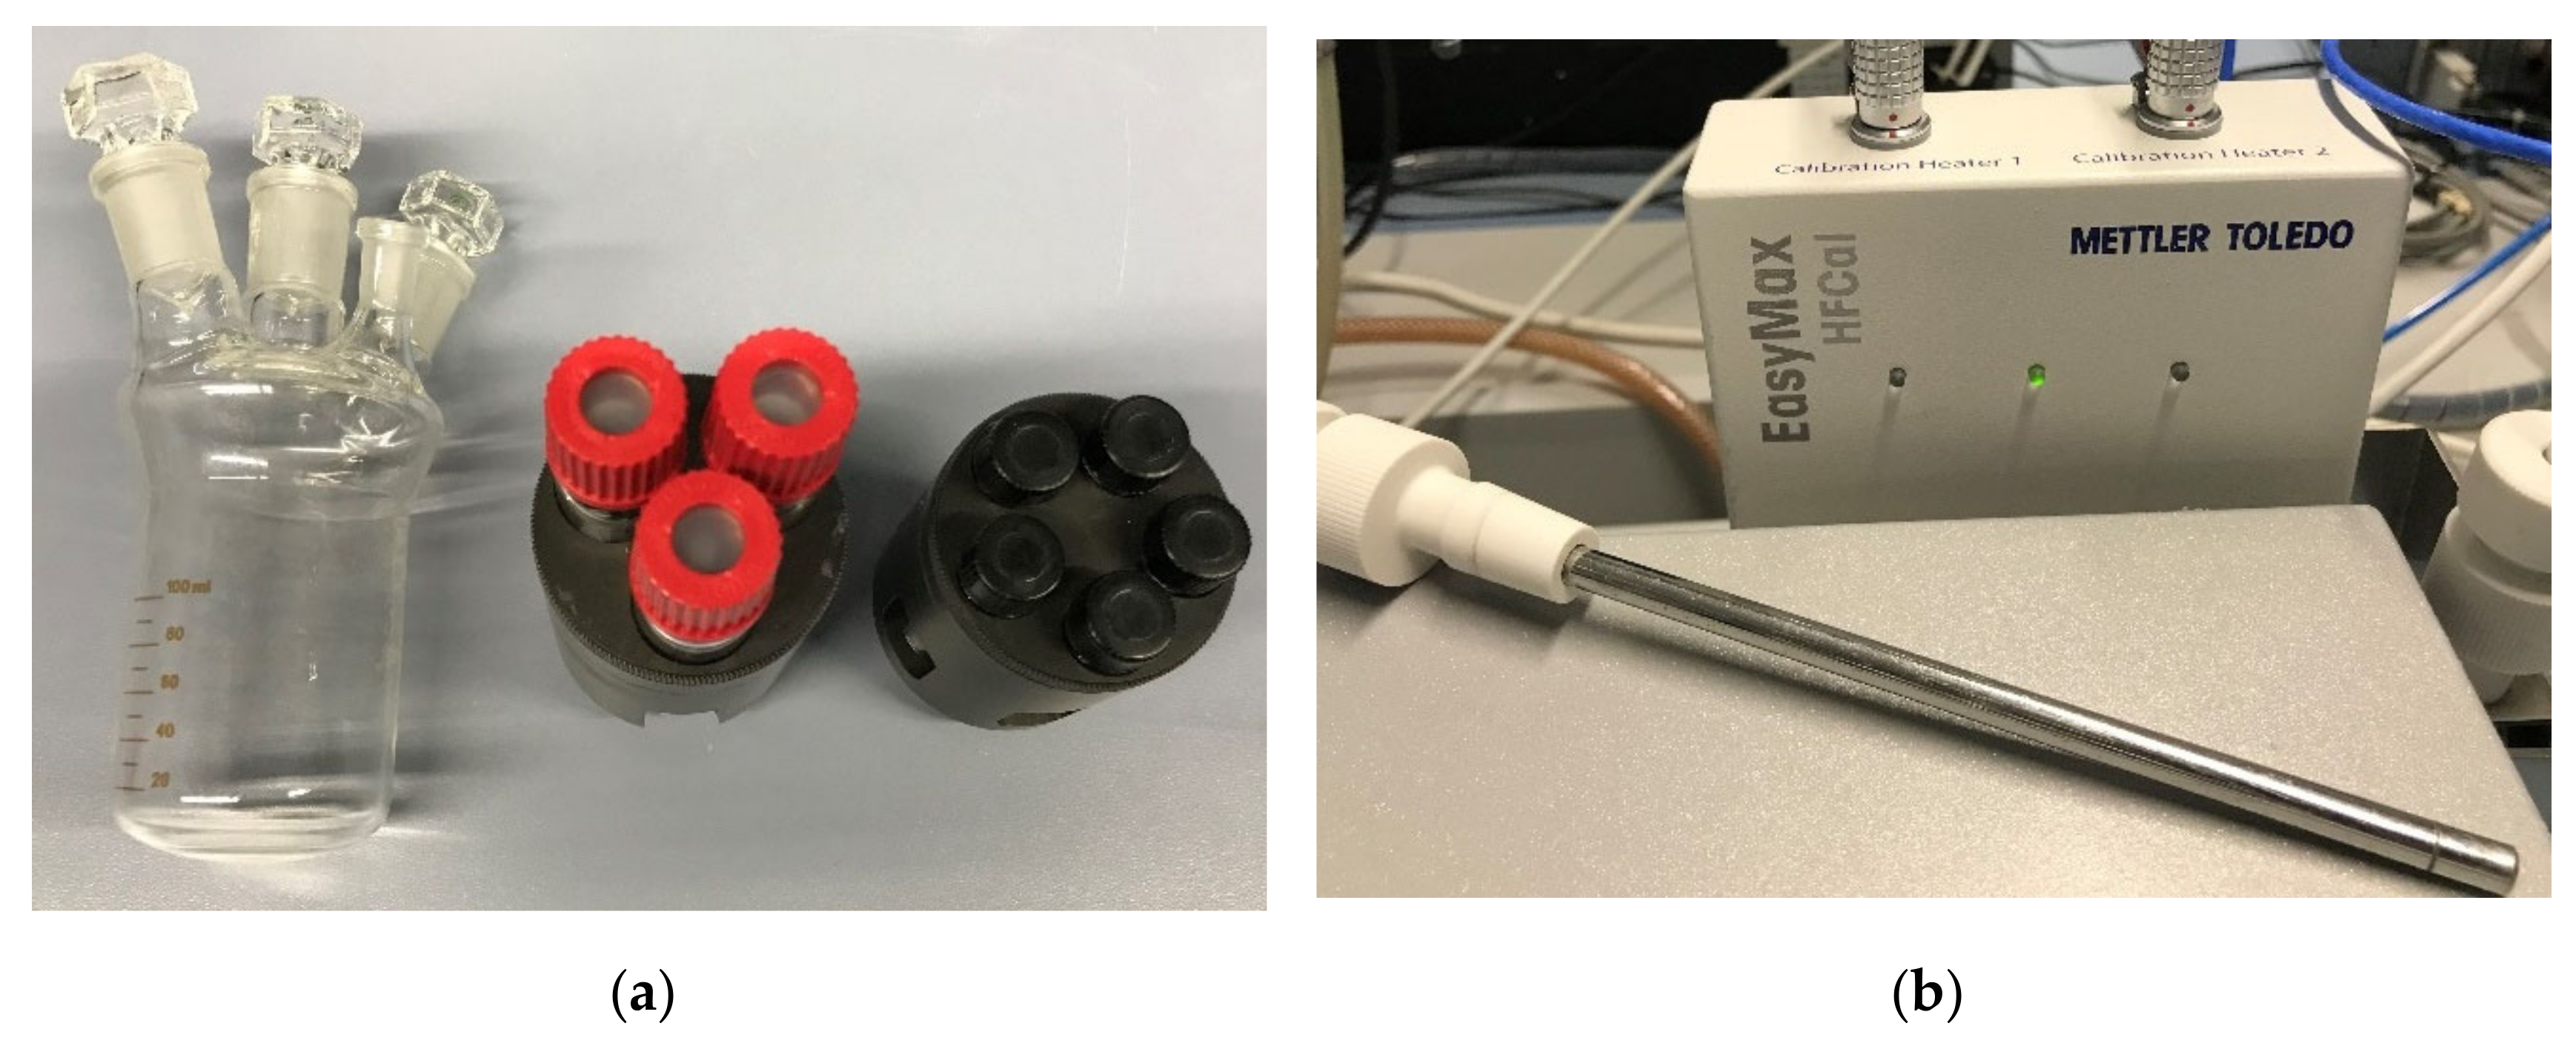
The setup used at Lucerne University of Applied Sciences and Arts (HSLU) is based on the commercial device Easymax 102 (METTLER TOLEDO AG., CH), which is used as a cycling device and synthesis station (Figure 6). The Easymax is operated between −30 and 180 °C. Two heating chambers with various adapters allow the measurement with one to five vessels (1 × 100 mL, 3 × 25 mL, 5 × 8 mL) per chamber (Figure 7a). Magnetic or mechanical stirring can be applied. Easymax 102 contains one temperature sensor per chamber. Therefore, an external logging device to record the temperature of the other vessels is used.
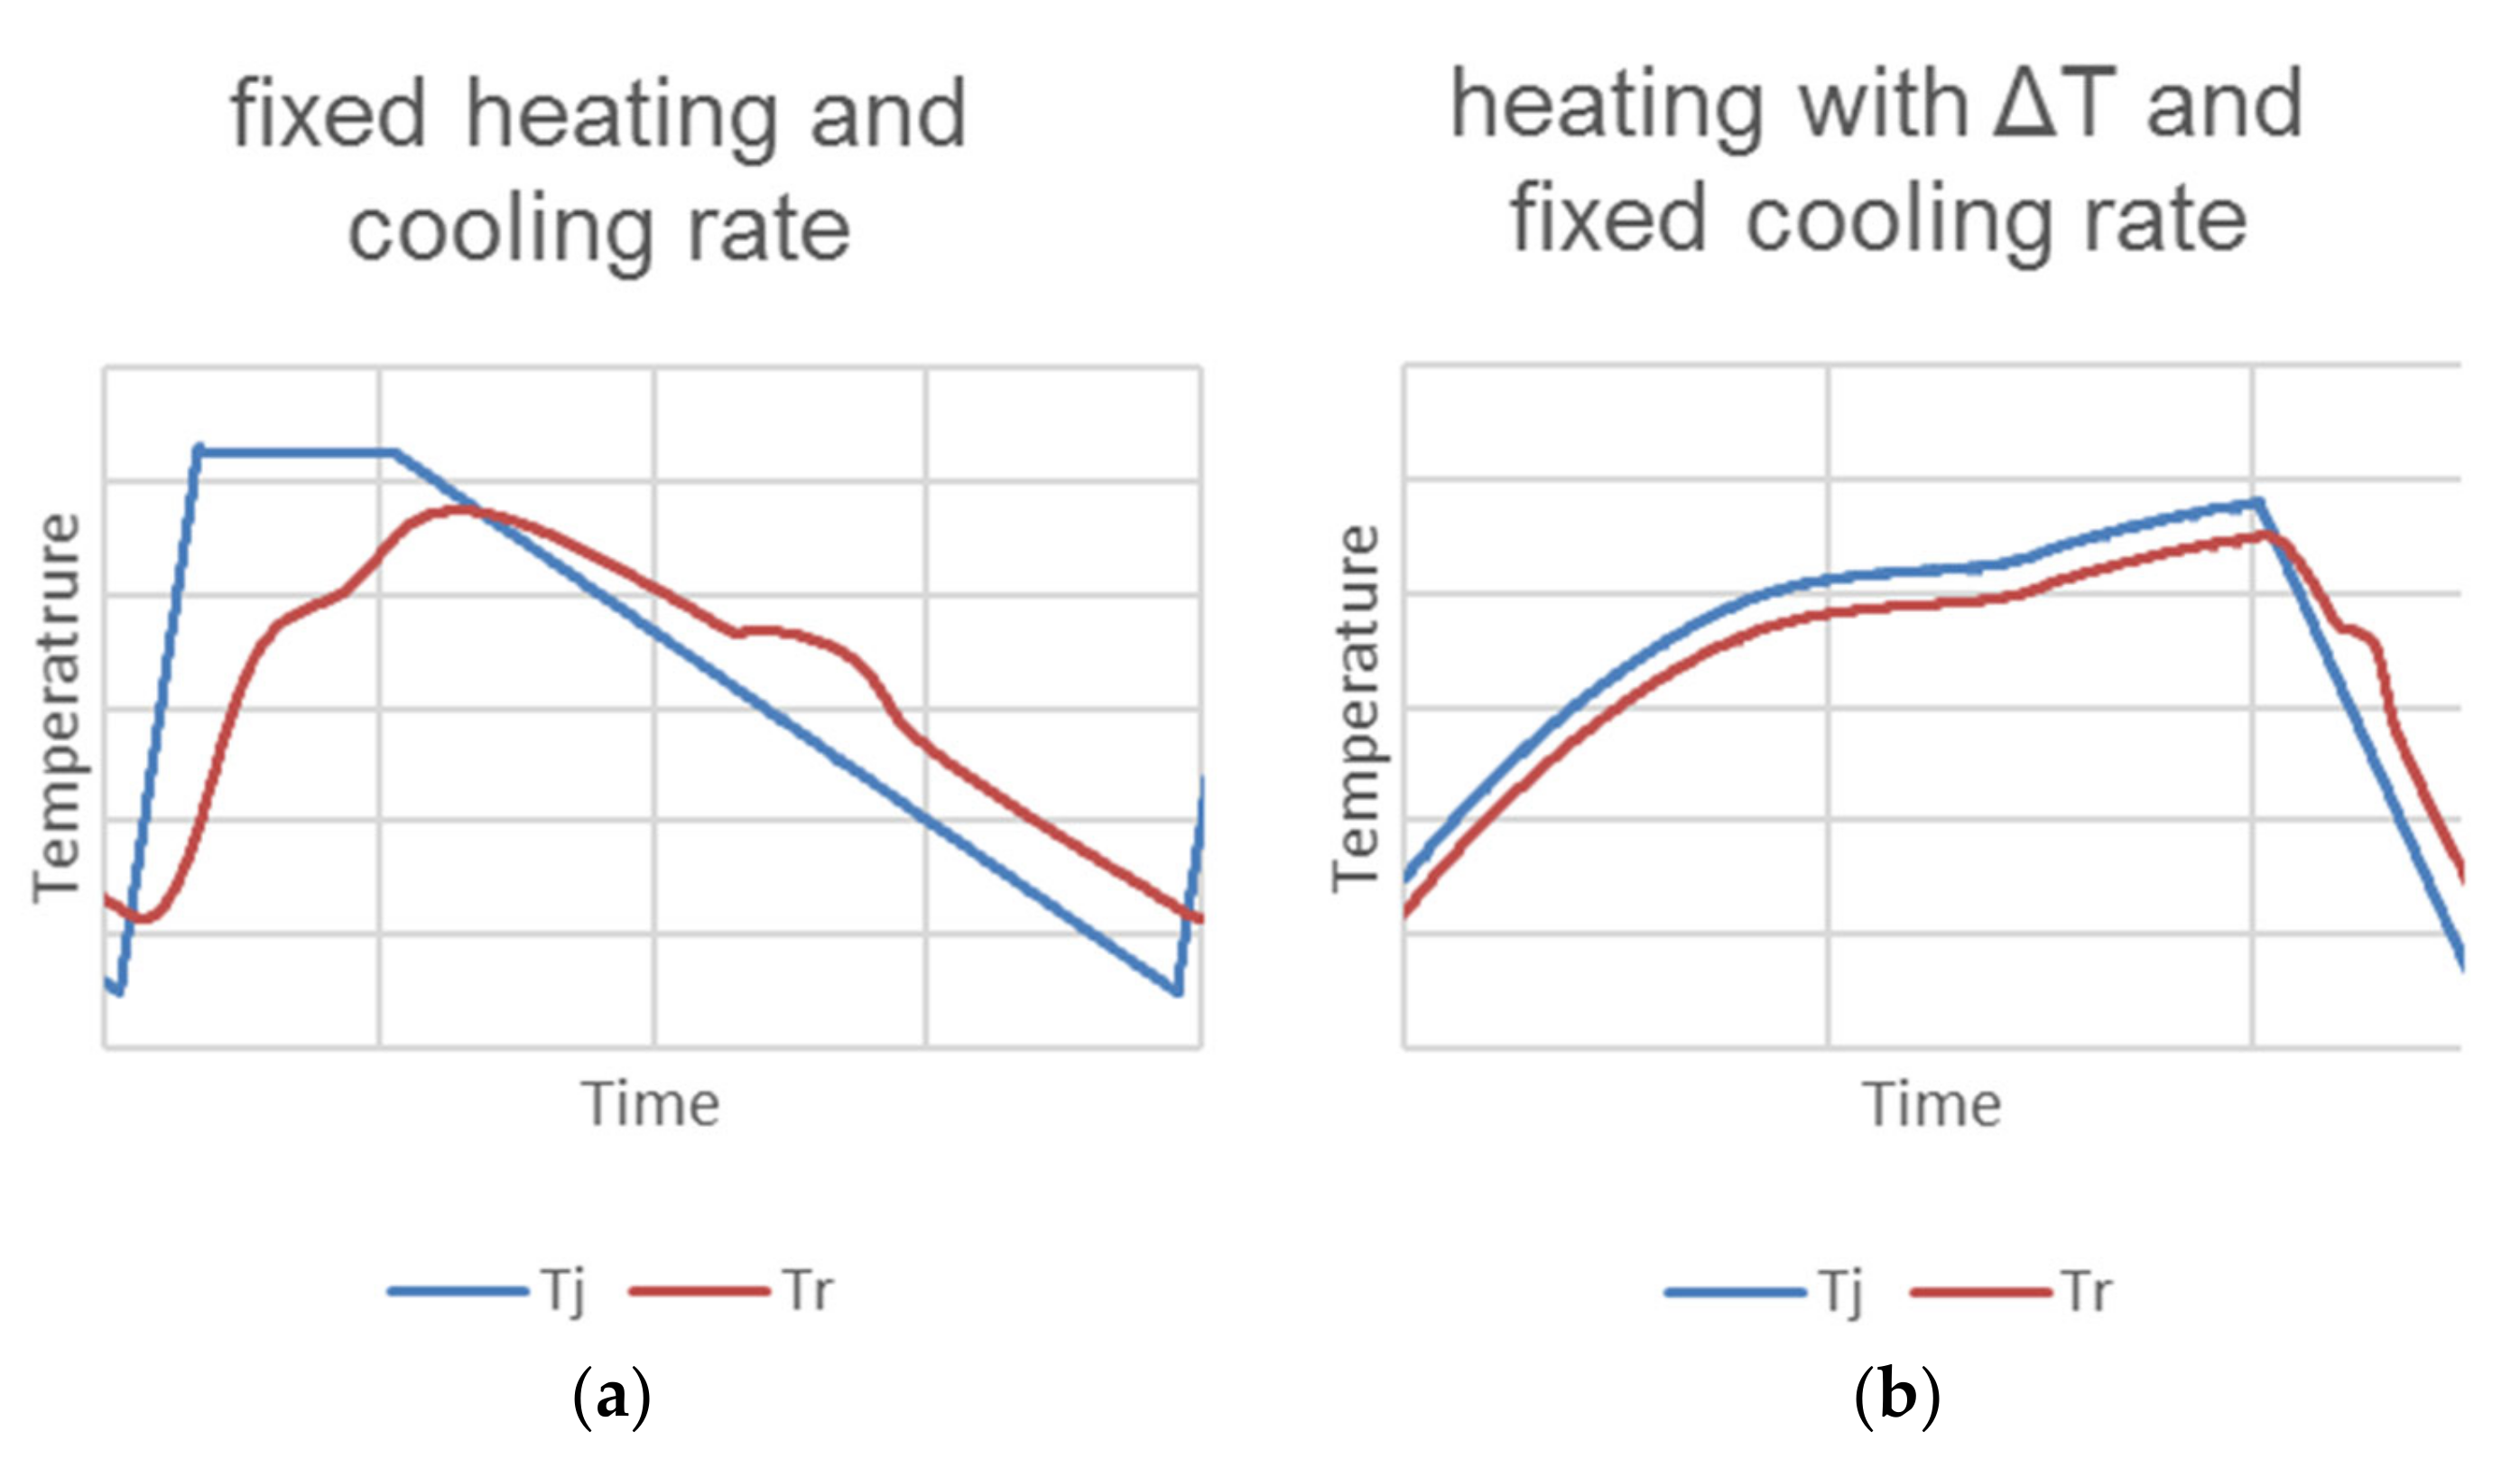
Different heating and cooling rates can be applied, either using a fixed rate or by controlled heating so that a temperature difference between the sample temperature (Tr) and the temperature of the jacket (Tj) is not exceeded. If more than one vessel per chamber is measured, only heating by rate is possible (Figure 8).
During the experiments, the jacket temperature Tj and the reaction temperature Tr are measured. With the addition of a reaction calorimetry unit (Figure 7b), the phase change enthalpy, heat transfer coefficient, and specific heat can be determined as well. Typically, ten thermal cycles per day are carried out.

ISE Capsules

The test facility “ISE capsules” consists of an open bath in which the encapsulated PCM samples are immersed. Circulating tap water is applied as a heat transfer fluid. The flow rate can be adjusted manually by means of a pump with a downstream restriction. The bath temperature is controlled by a thermostat that supplies heat to the test circuit by a heat exchanger. Temperature sensors at the flow and return line of the bath and a volume flow sensor allow the thermal balancing of the heat stored in the PCM macro-capsules. The schematic of the setup is shown in Figure 9.
The typical temperature profile is comprised of temperature steps (1 K∙min−1 heating and cooling rate), which are repeated cyclically. The set temperatures depend on the PCM under investigation and are usually set 5 K below and above the melting temperature of the PCM. Typically, ten thermal cycles per day are carried out.

ISE Peltier

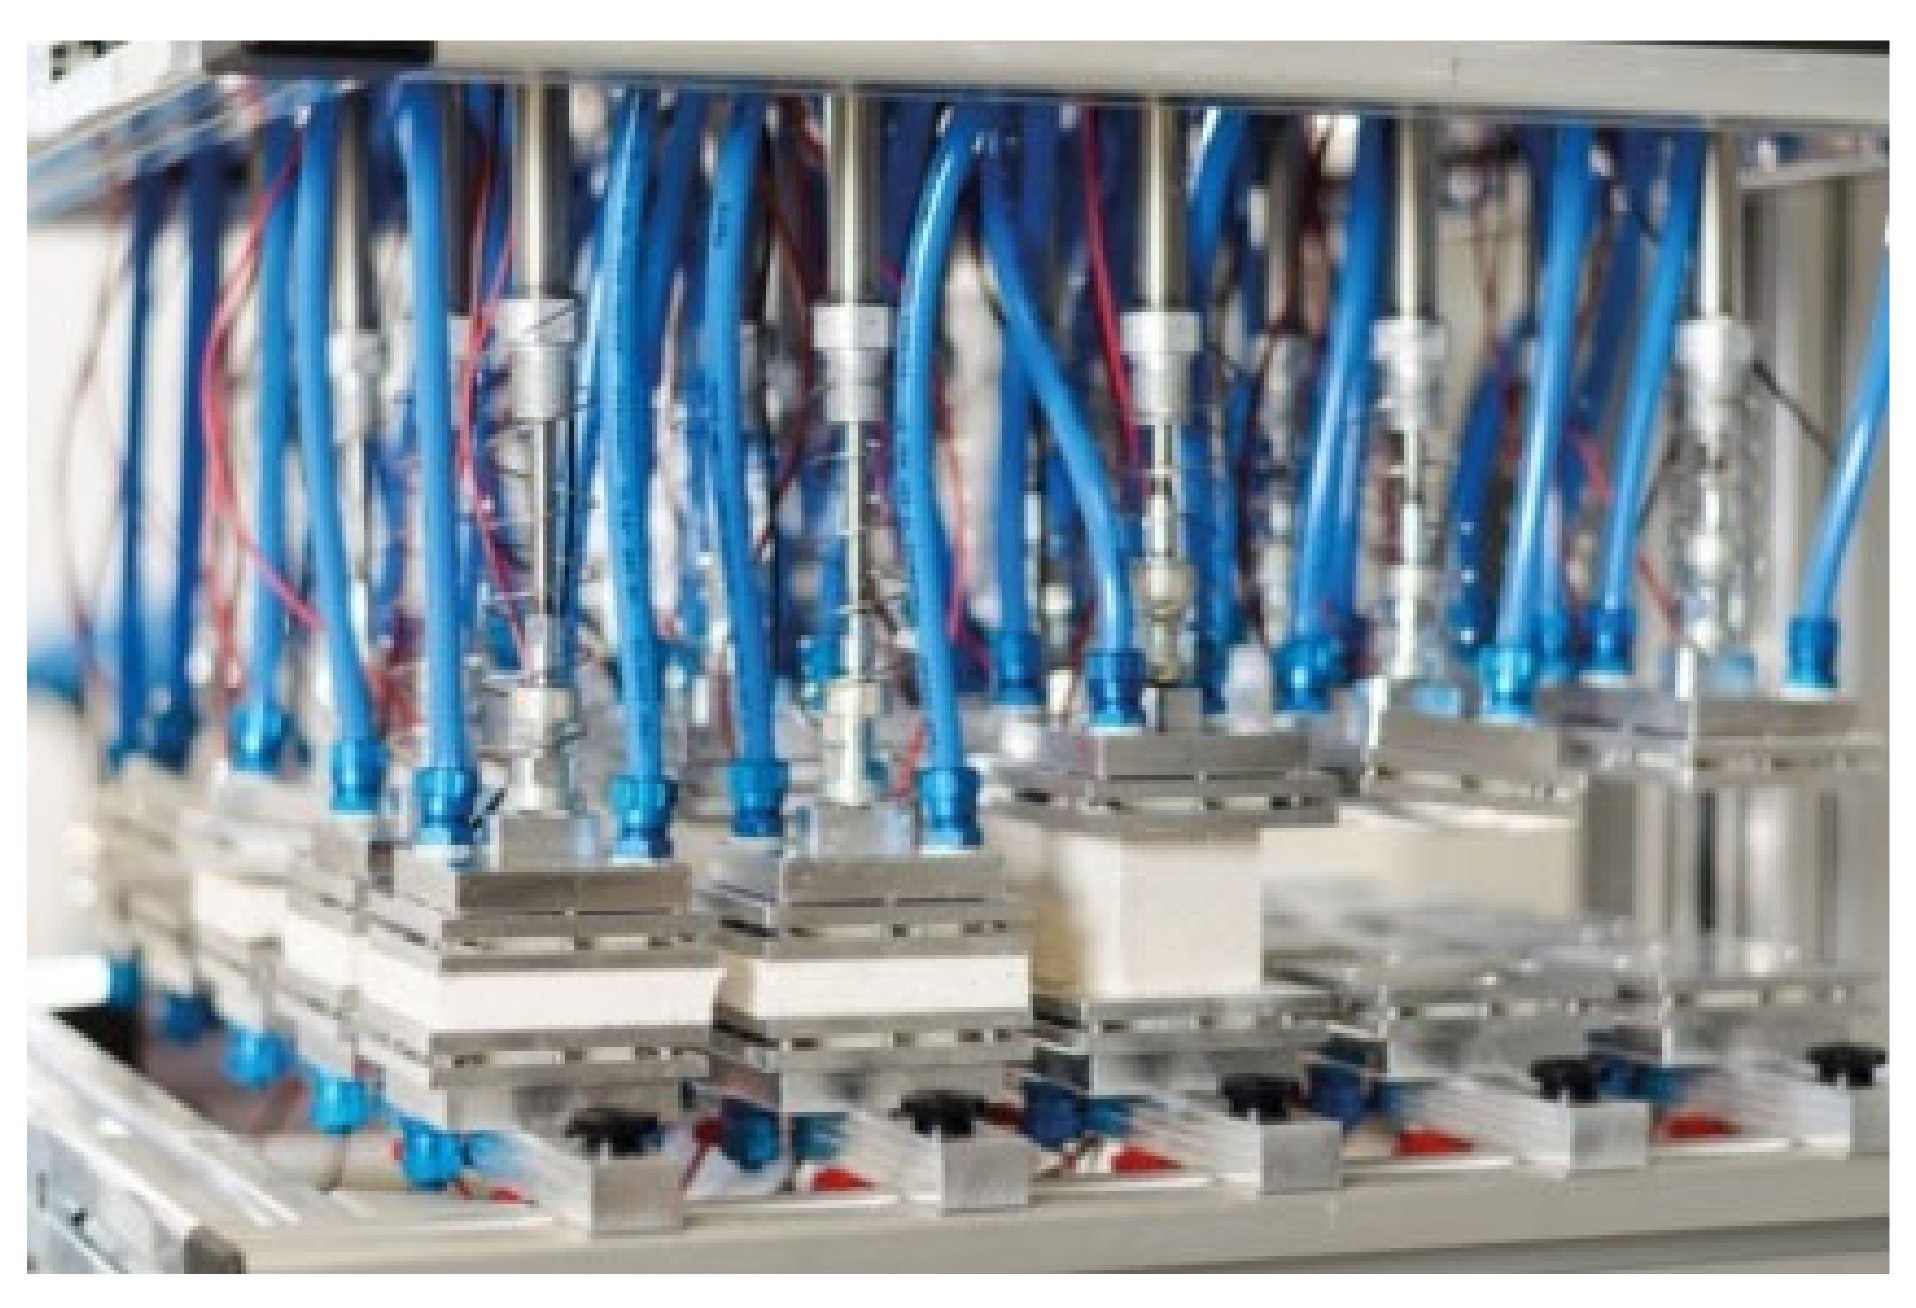
This is a flexible Peltier test rig for cycling in the temperature range −30 to 200 °C. Up to 16 Peltier modules with a maximum heating and cooling power of 30 W each and a surface of 65 × 65 mm can be flexibly combined in the x and z directions. Each Peltier module has two Peltier elements: one on the bottom and one on top. The upper Peltier elements are single point fixed to compensate for non-parallel surfaces. The contact pressure of the upper Peltier element can be controlled by pressurized air. A picture of the Peltier test rig is shown in Figure 10.
Up to eight individual temperature controllers are used to control the temperature of samples. Peltier elements can be individually attached to each controller. Temperature profiles are composed of basic segments. Basic segments are the sudden temperature change, ramp, or isotherms. Heating and cooling rates can be defined individually. Sample crucibles are designed as needed. In line stability check is not foreseen. External stability check via DSC, optical inspection, or others is necessary.
Measured data are the temperatures of the PCM (middle or surface) and the temperature of the Peltier surface. Up to 24 thermal cycles per day are carried out.

LAMTE

The cycling device “LAMTE” is used to simultaneously cycle up to eight samples within a similar range of phase transition temperatures. The temperature is adjusted using two cartridge heaters embedded in an aluminum block as heat sources and four thermoelectric coolers for cooling of the system. Typically, a heating rate of approximately 13 K∙min−1 and a cooling rate of approximately 7 K∙min−1 are applied. Pictures of the device are given in Figure 11.
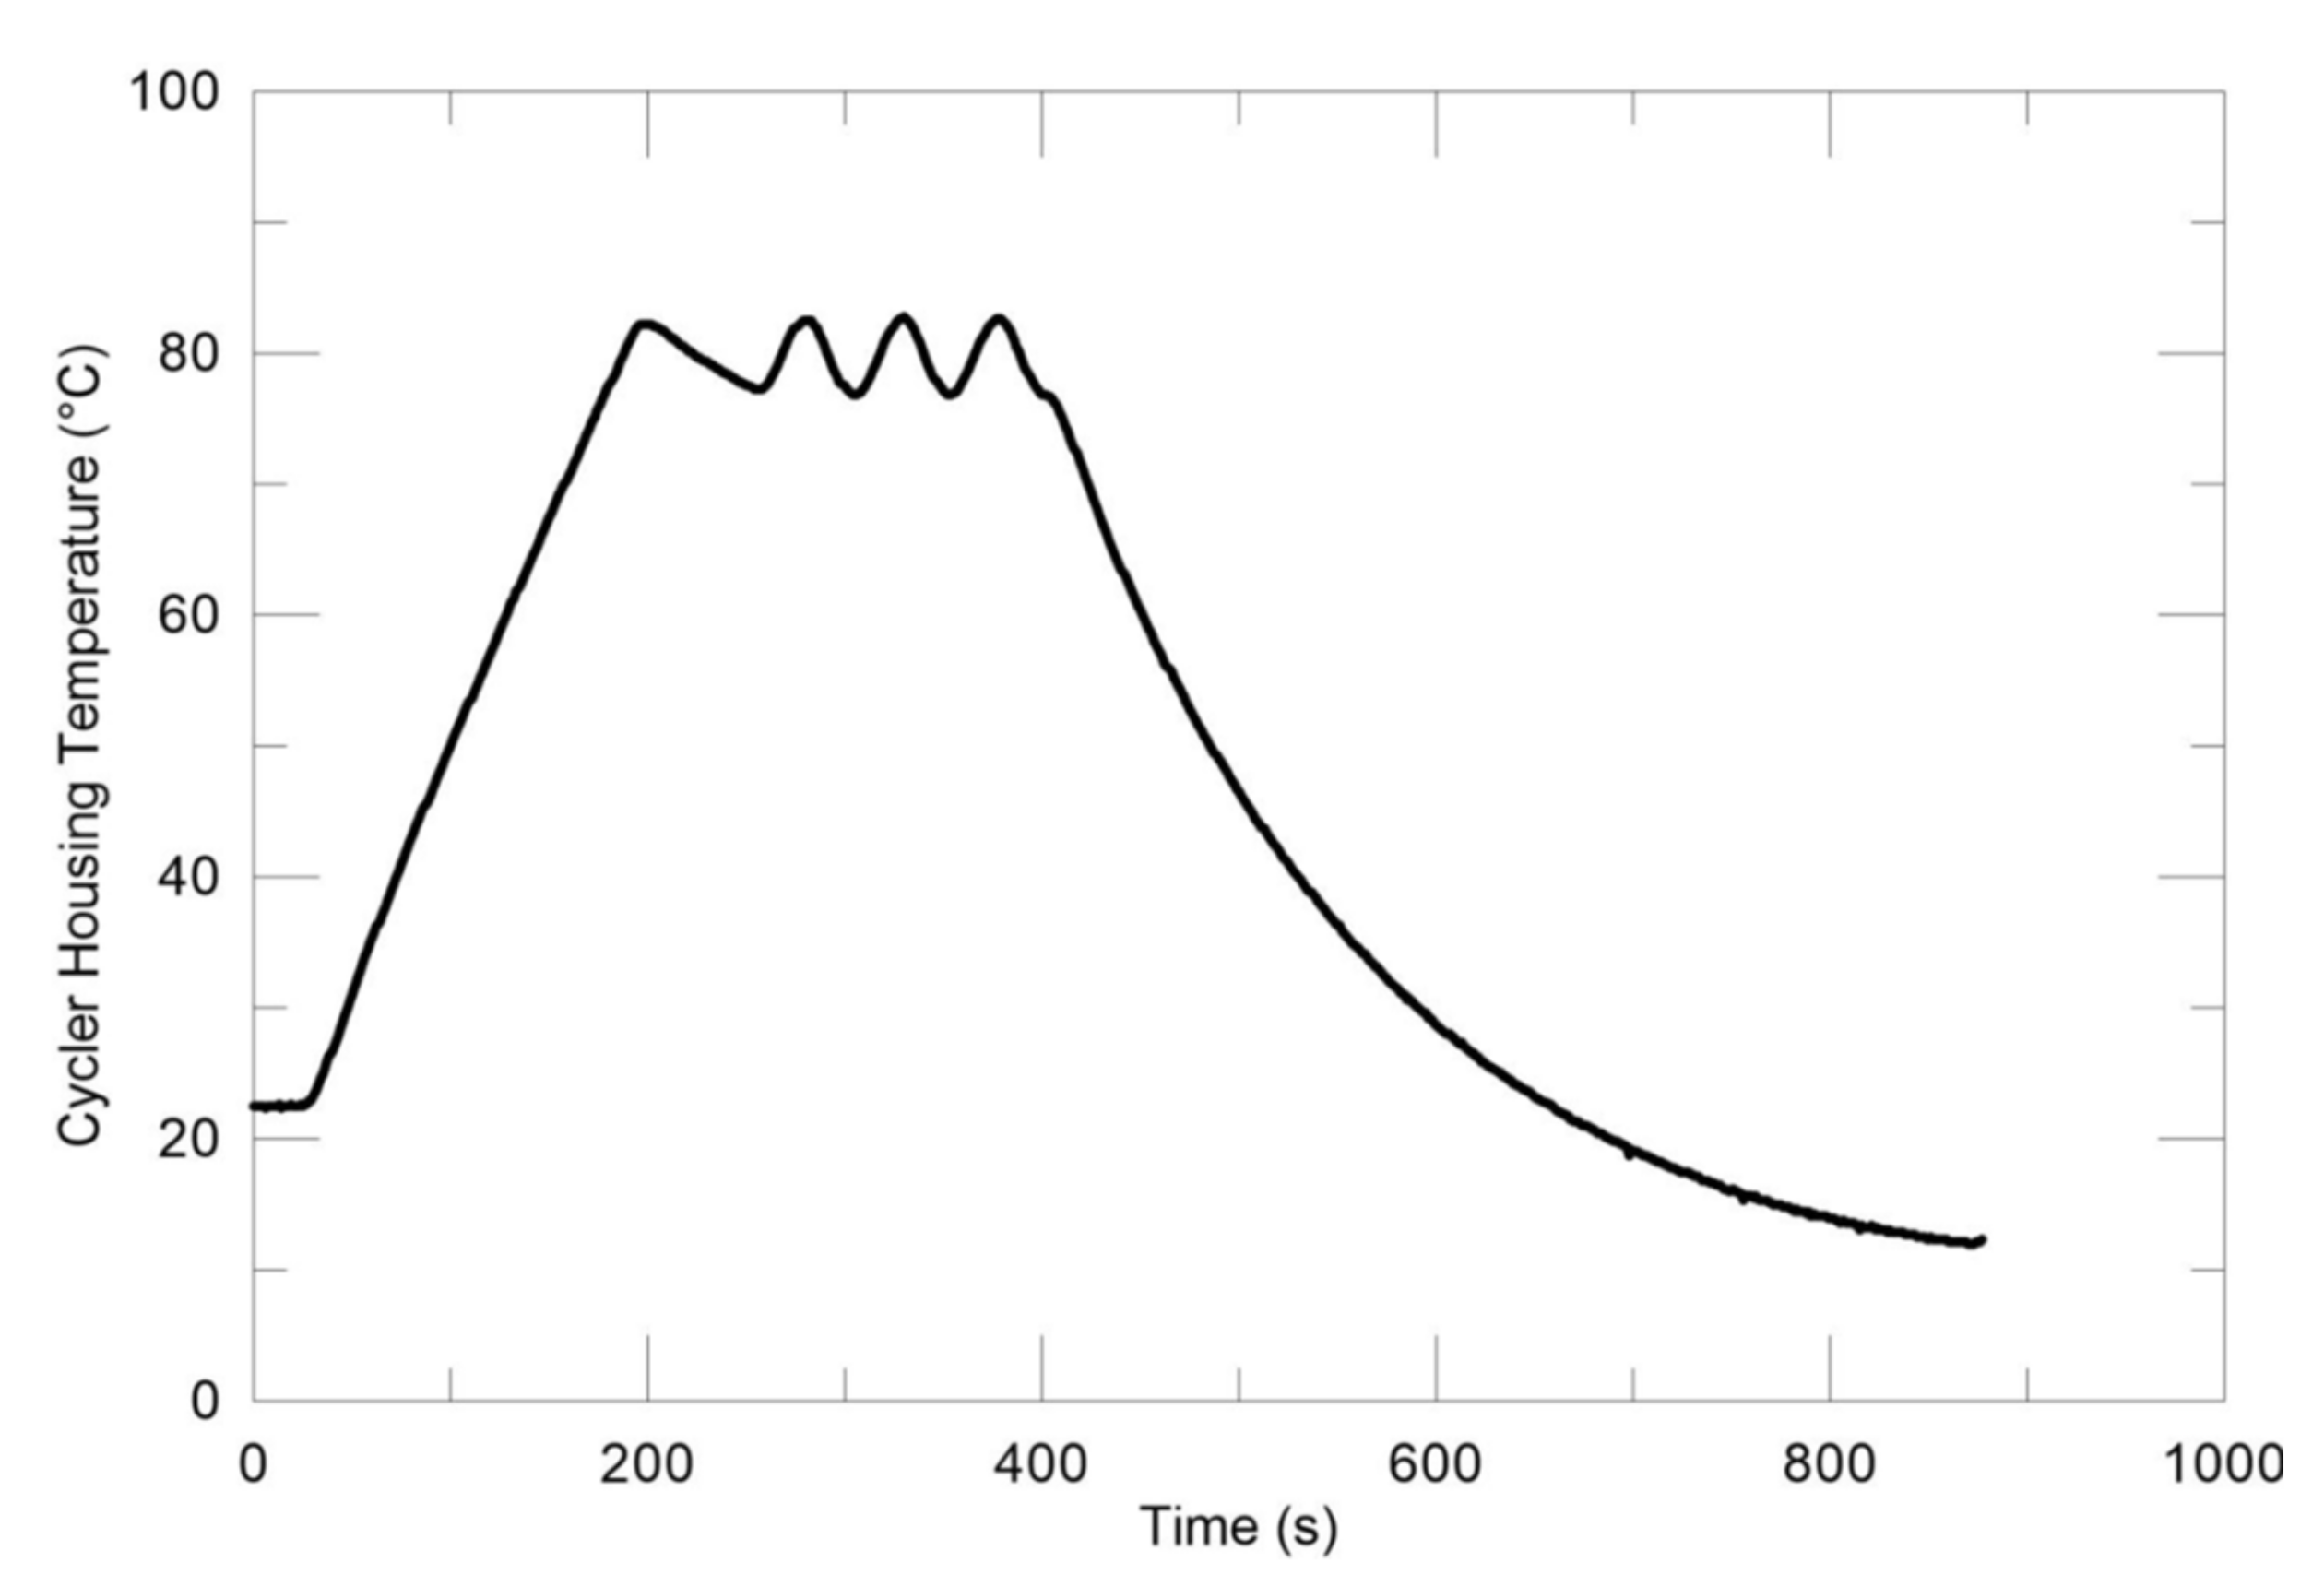
The maximum sample volume is 7.4 mL. Typically, only half the volume is used to allow for any expansion. The PCM is inserted in a dram vial made of borosilicate glass with a 15–425 threaded PTFE/silicone liner cap; the vial is inserted in the aluminum block where thermal grease is applied between the aluminum and the PCM vial to reduce thermal resistance to conduction. During the experiments, the temperature–time curve of the aluminum block is measured using a negative coefficient (NTC) thermistor. A typical temperature-time profile is shown in Figure 12. A numerical study of the system was done to determine the temperature, and phase, history of a PCM inside the dram vial during both the melting and solidification phase of the cycle, therefore ensuring complete melting and solidification of the PCM during each cycle [23]. Up to 140 thermal cycles per day are carried out.

LGCgE

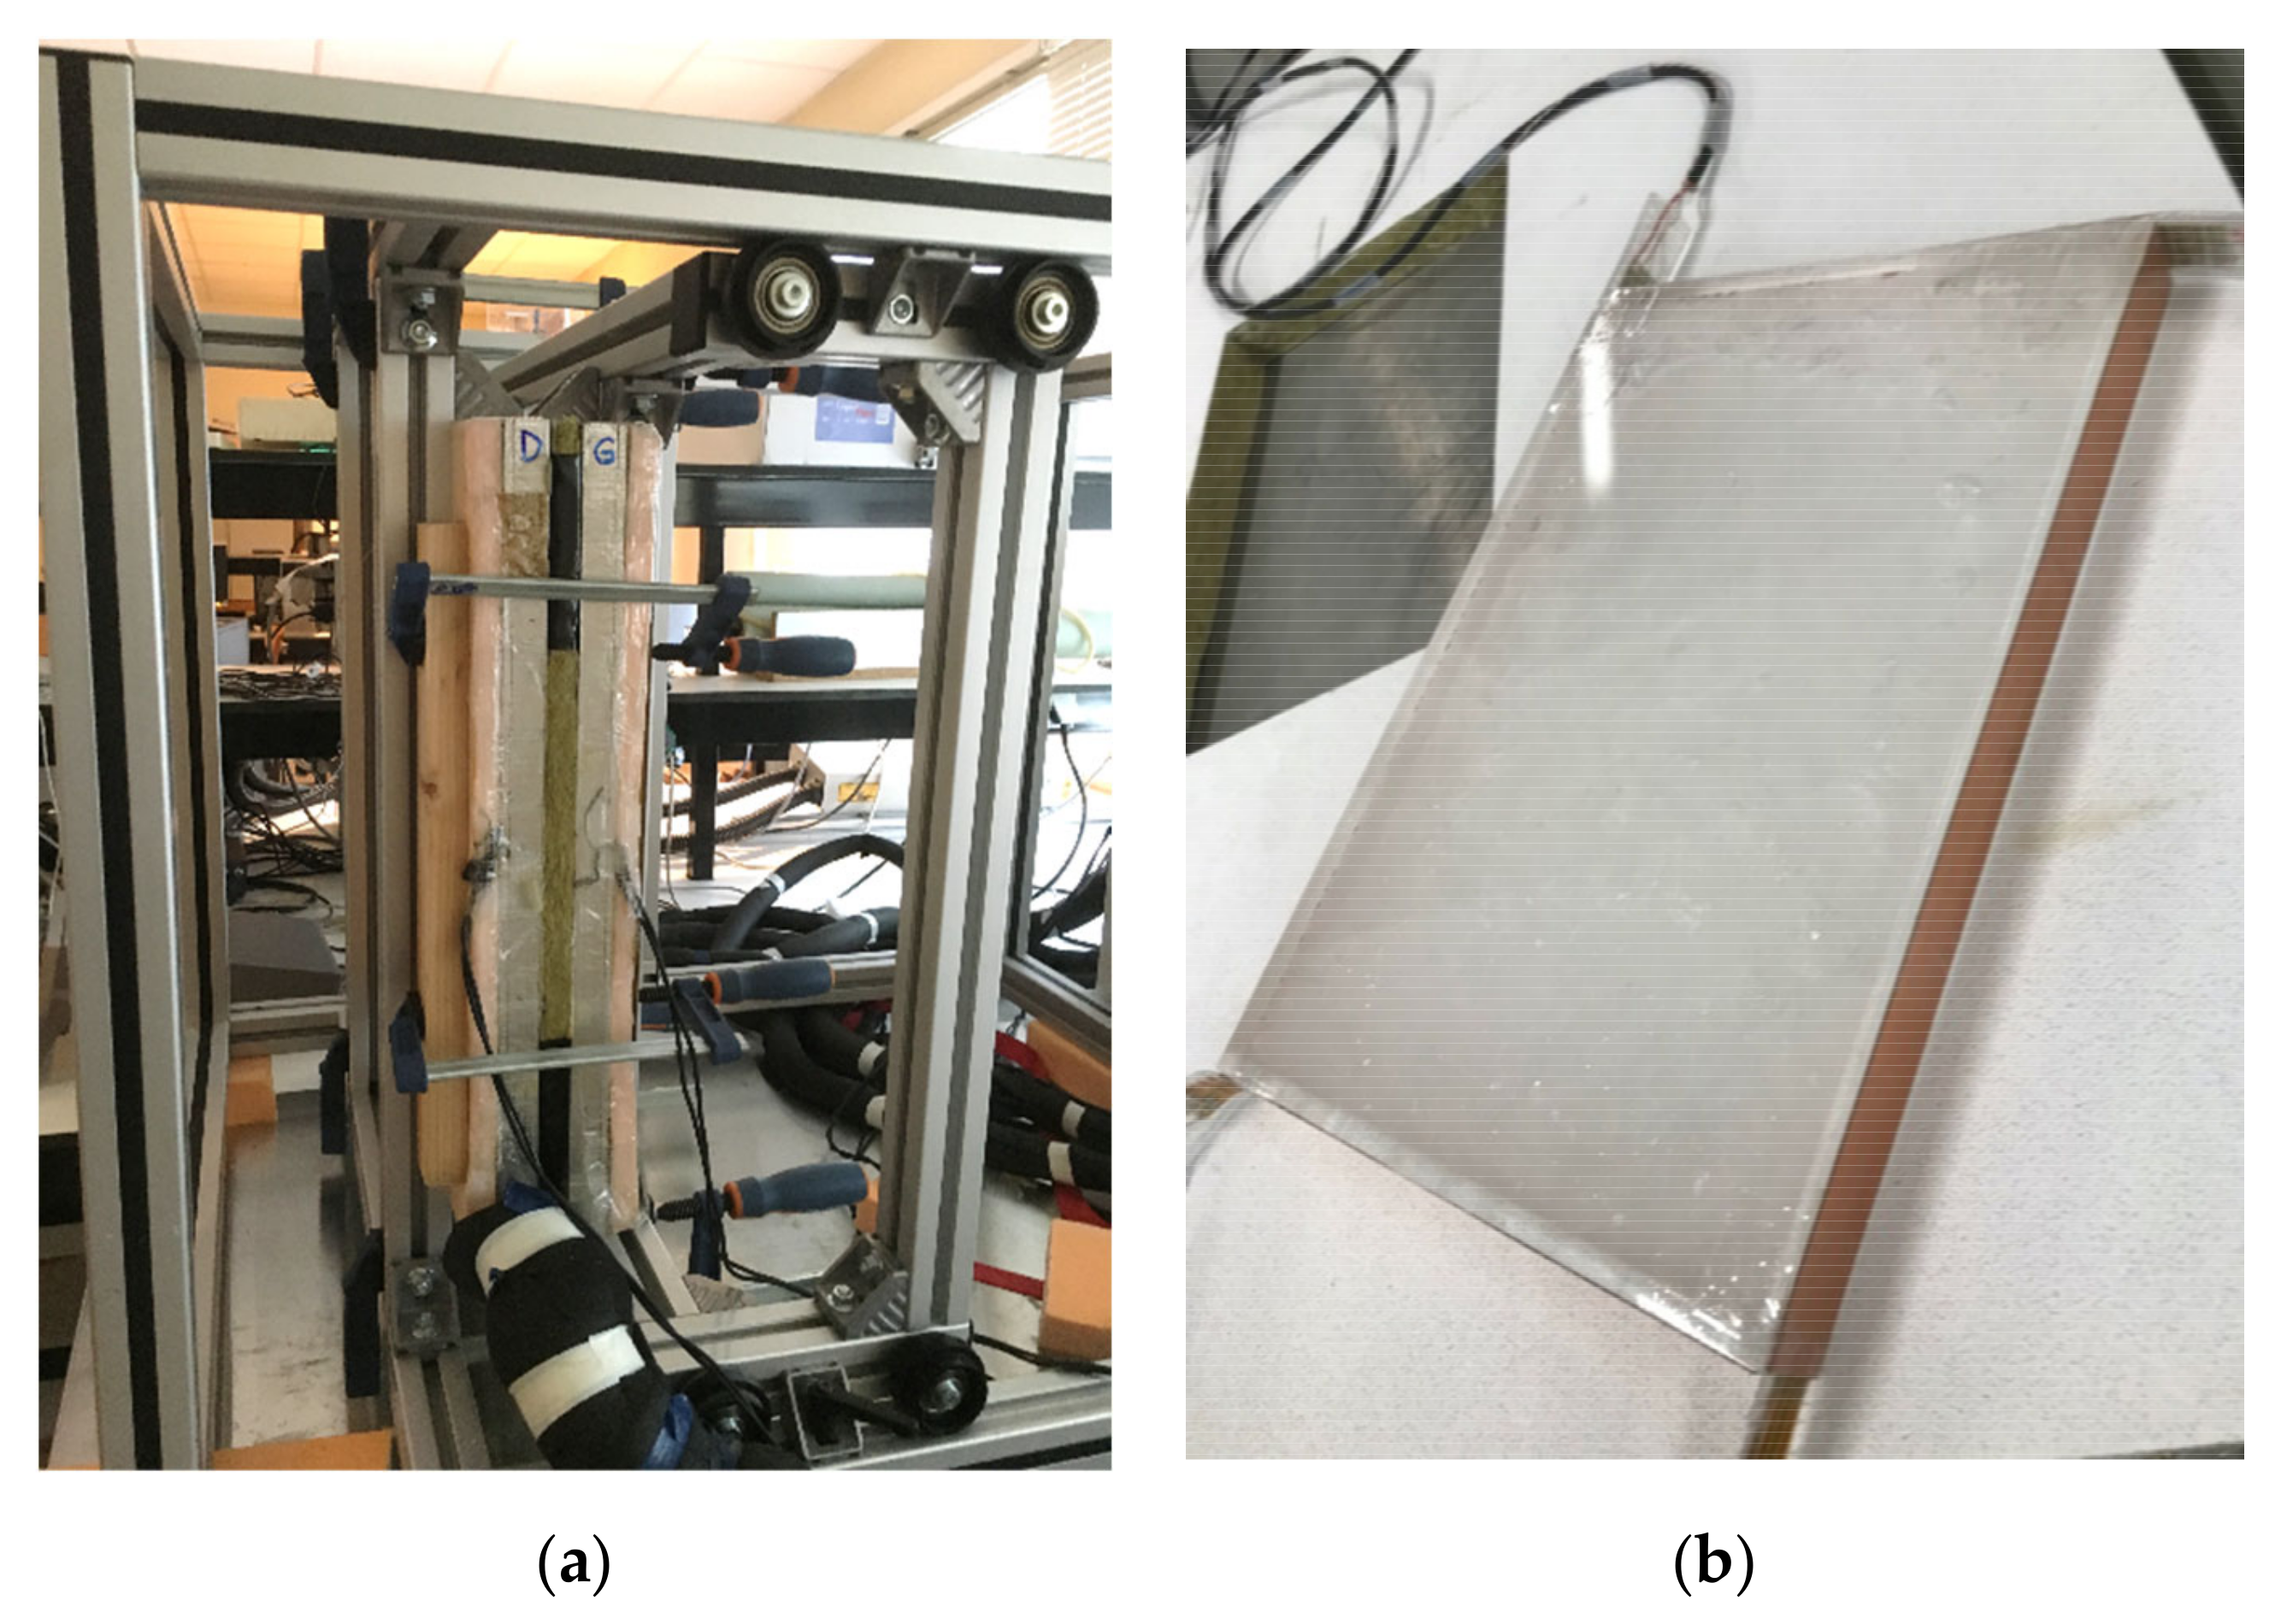
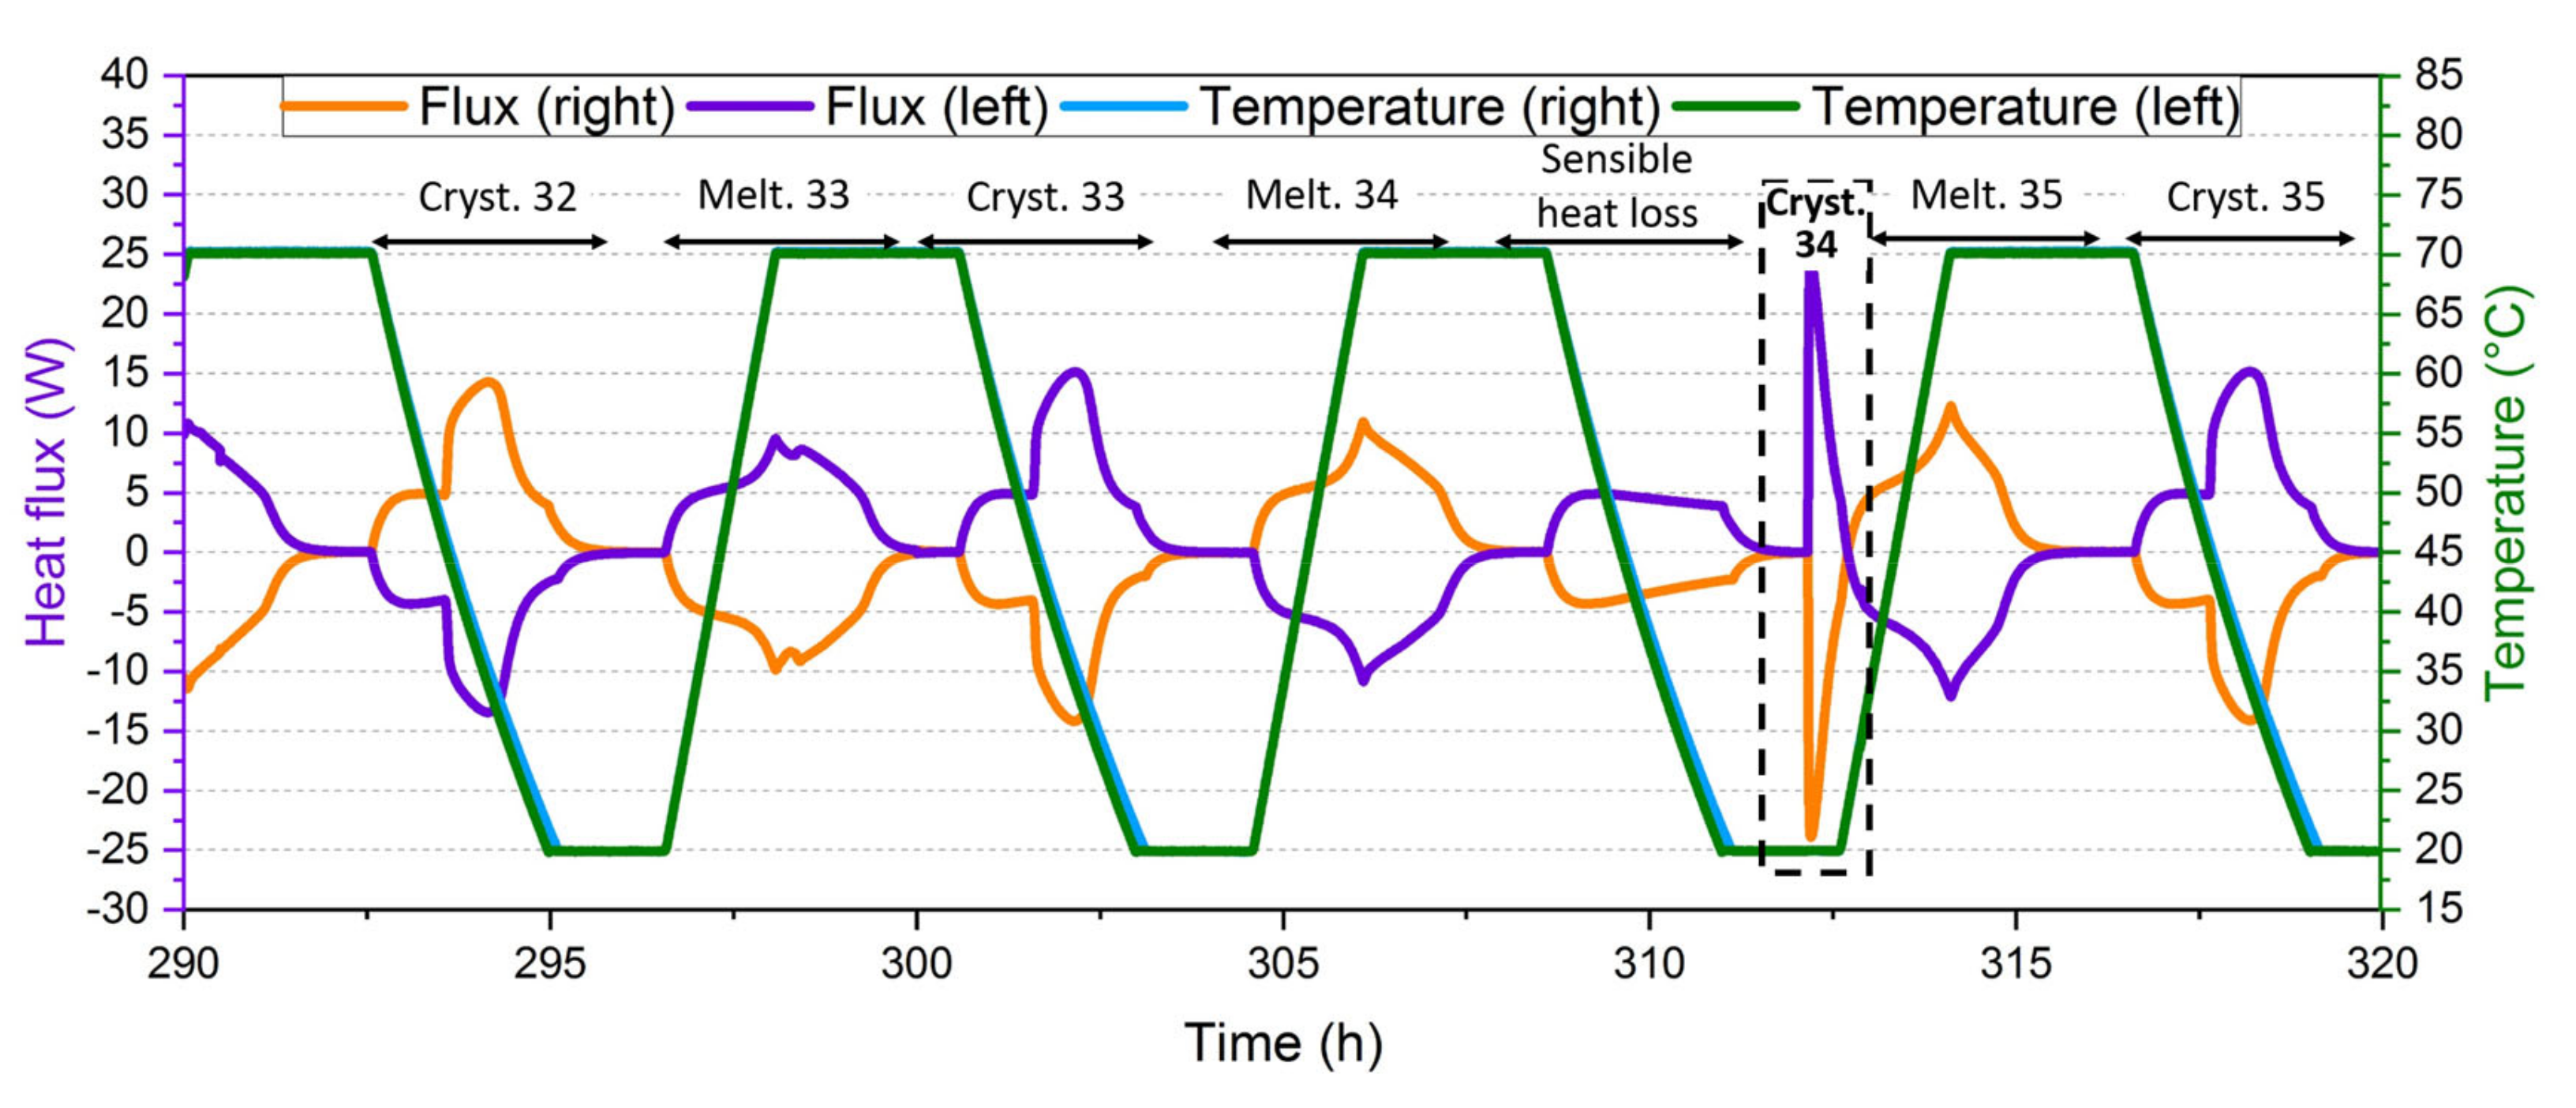
The Fluxmetric bench (Figure 13a) is a thermal cycling device used to impose temperature ramps on both larger sides of a parallelepipedal poly(methyl methacrylate) (PMMA) sample containing PCM (Figure 13b). Temperature ramps are applied thanks to the exchanger plates, each of which is connected to a refrigerated/heating circulator controlled by a computer. Typically, a heating rate of approximately 0.05 K∙min−1 and a cooling rate of approximately 0.3 K∙min−1 are applied. Two to three thermal cycles per day are carried out. The four smaller faces of the sample are insulated so as to minimize lateral heat losses (Figure 13b). In its current configuration, the container is filled with 270 mL of PCM. This configuration allows limiting convective flow when the PCM is in a liquid state. A heat flux meter incorporating a T-type thermocouple is placed on each side of the PMMA sample in order to calculate the energy balance at each heat cycle and to identify the melting and solidification temperatures. Between each temperature ramp, an isothermal step is imposed to return to an equilibrium (isothermal state and heat flux = 0) (Figure 14). For each fusion, the latent heat is estimated by subtracting the sensible energy stored (stored by PMMA and PCM) from the total stored energy measured by heat flux meters.
For example, multiple heating and cooling ramps have been imposed on SAT to study its aging by following the variation in the amount of latent heat involved in each melting transition [26]. At each cooling ramp, the temperature of the stochastic solidification (or degree of supercooling) can be identified. For each cooling ramp, by observing the peak of heat flux at the moment of crystallization, the degree of supercooling can be estimated (Figure 14). In Figure 14, part of a thermal cycling experiment on SAT is shown beginning with the crystallization of cycle 32 (“Crist. 32”) up to cycle 35. Cycle 34 consist of melting (Melt. 34), cooling down without crystallization (“Sensible heat loss”) followed by the crystallization of the supercooled liquid (“Crist. 34”).

LTTT

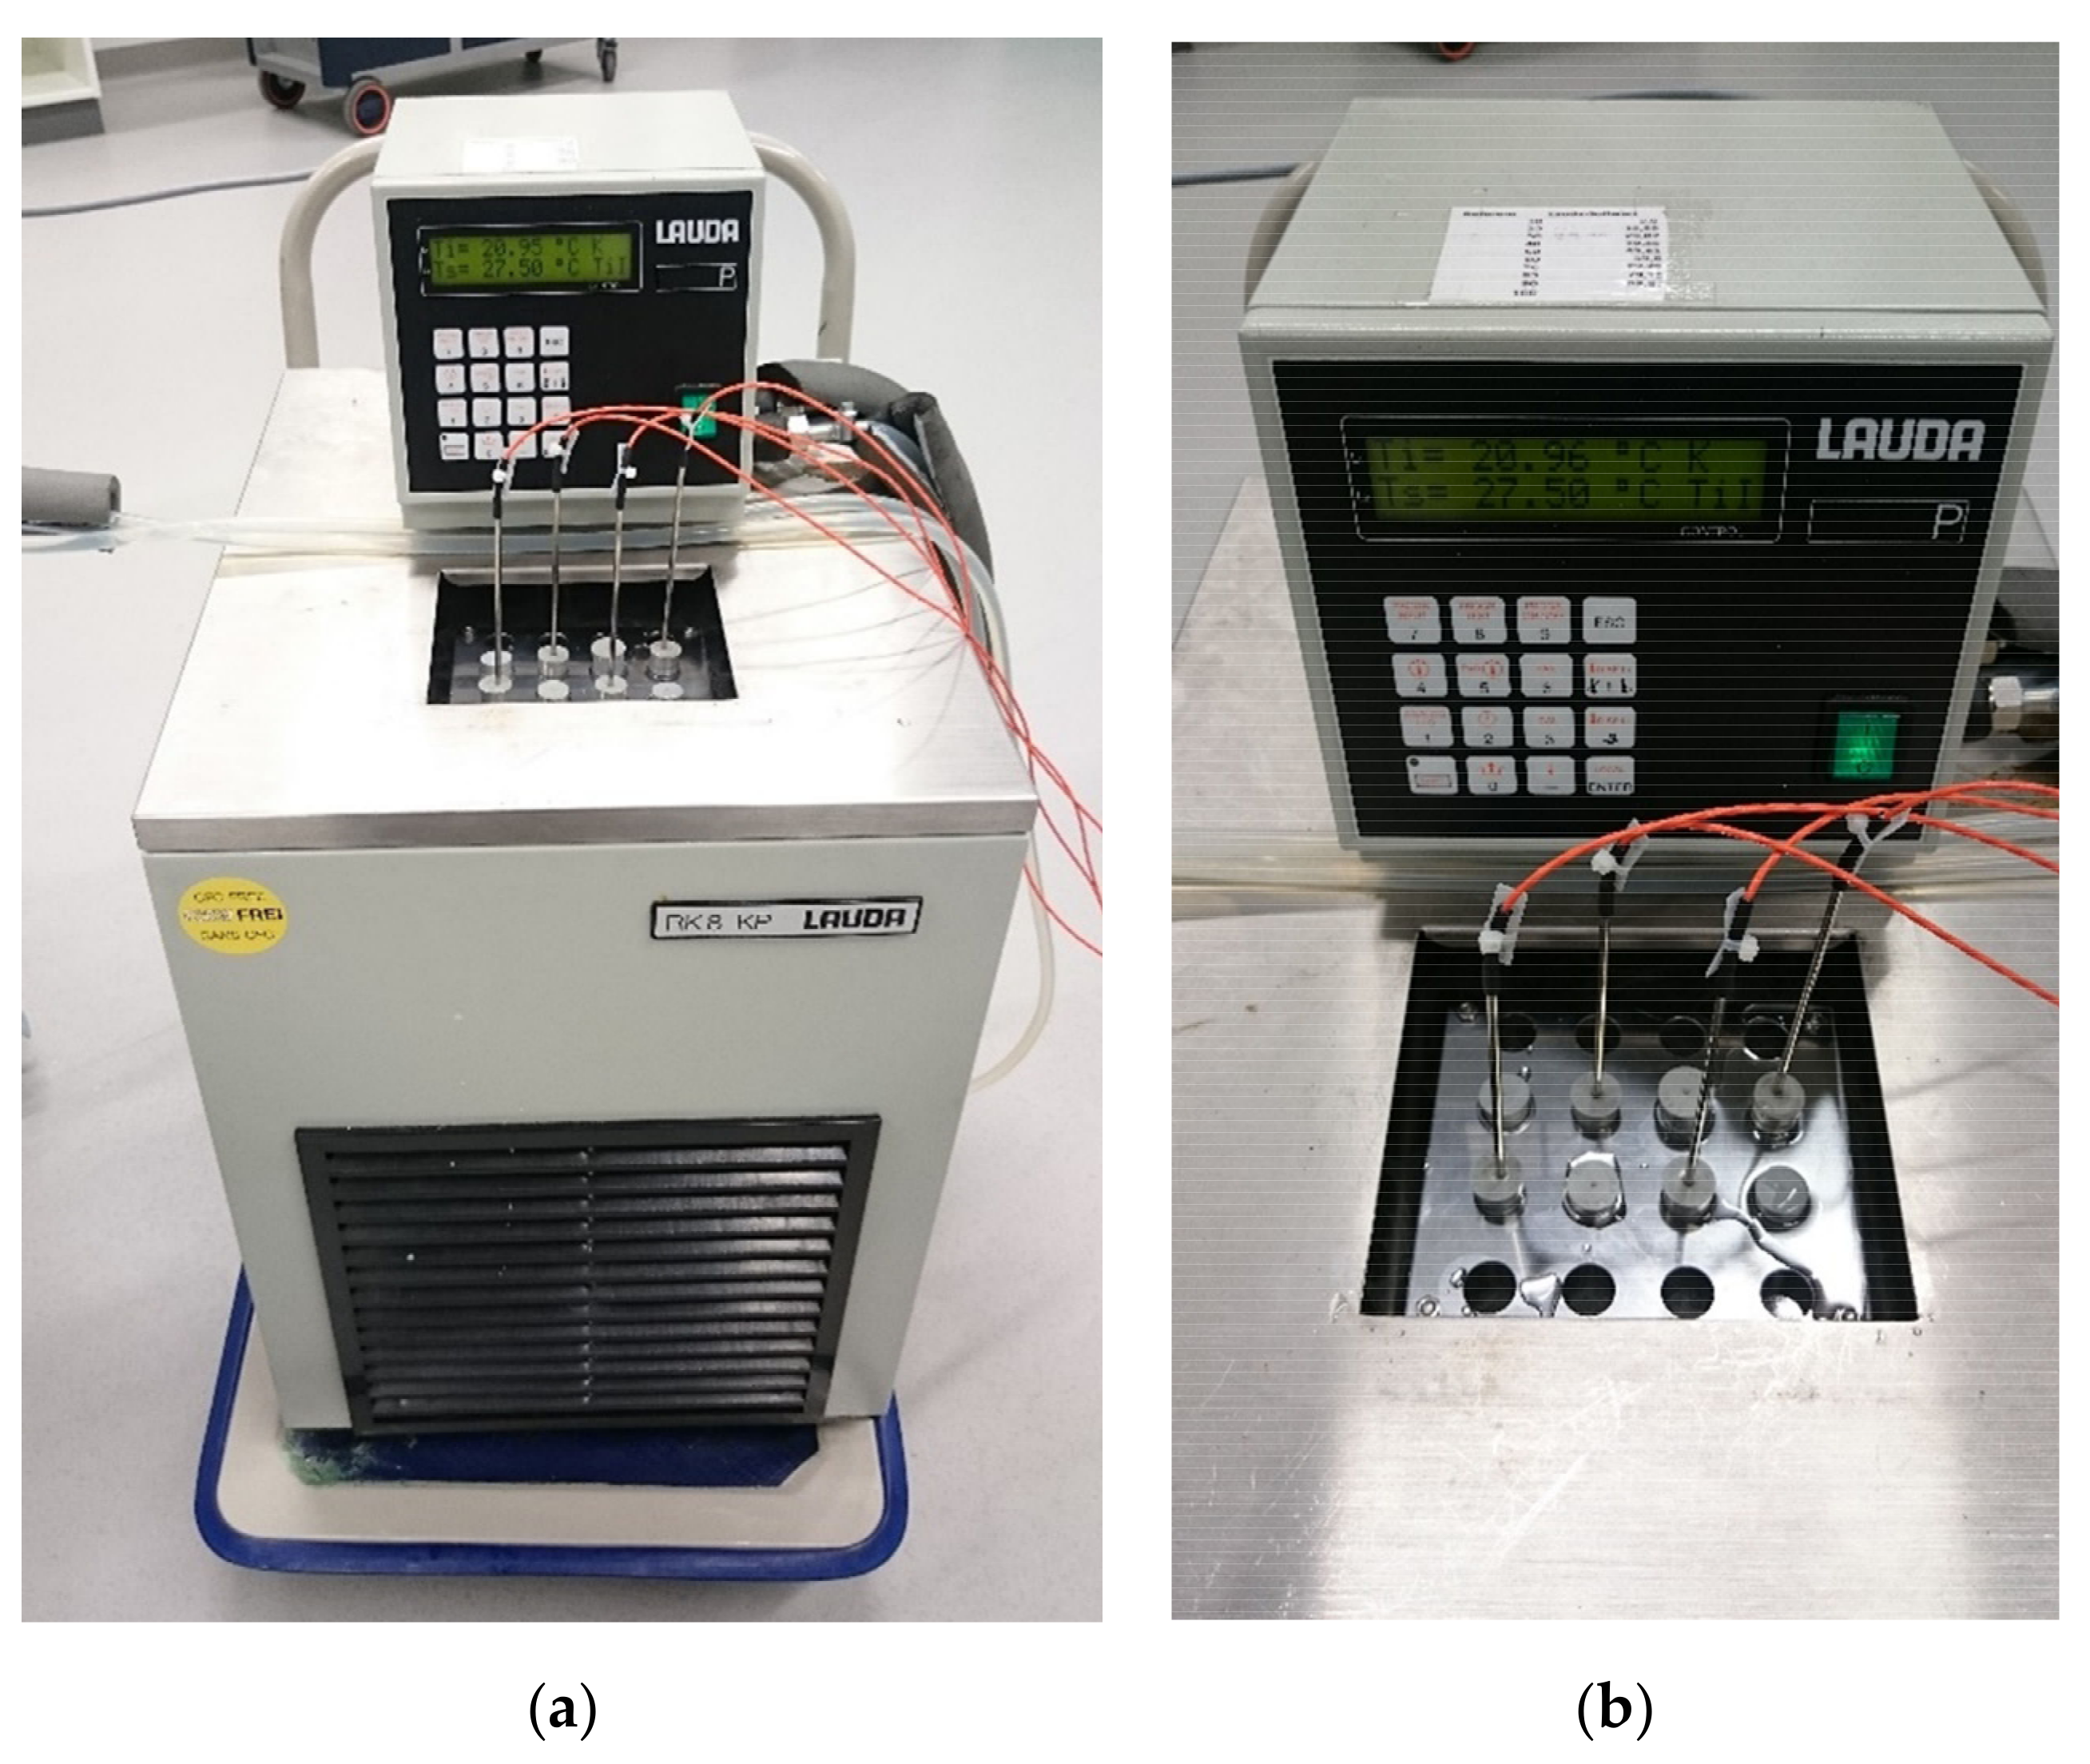
The thermal cycling device “LTTT” is comprised of a thermostatic bath (water or thermal oil) with a 4-channel PT100 data logger (expandable). Pictures of the device are shown in Figure 15.
As temperature profile, one temperature level above and one the below phase-change temperature with a rapid change between the temperature levels or with defined heating/cooling rates are applied. Up to 16 samples can be cycled simultaneously in test tubes (made of glass, metal, or plastic), which are sealed with a rubber plug and immersed in the thermostatic bath. During the experiments, temperature–time curves of the samples are measured. After a certain number of cycles, DSC measurements are performed, and the temperature curves of the samples are analyzed.

UDL-GREiA I (This Equipment Is Shared with the University of Barcelona, DIOPMA Research Group)

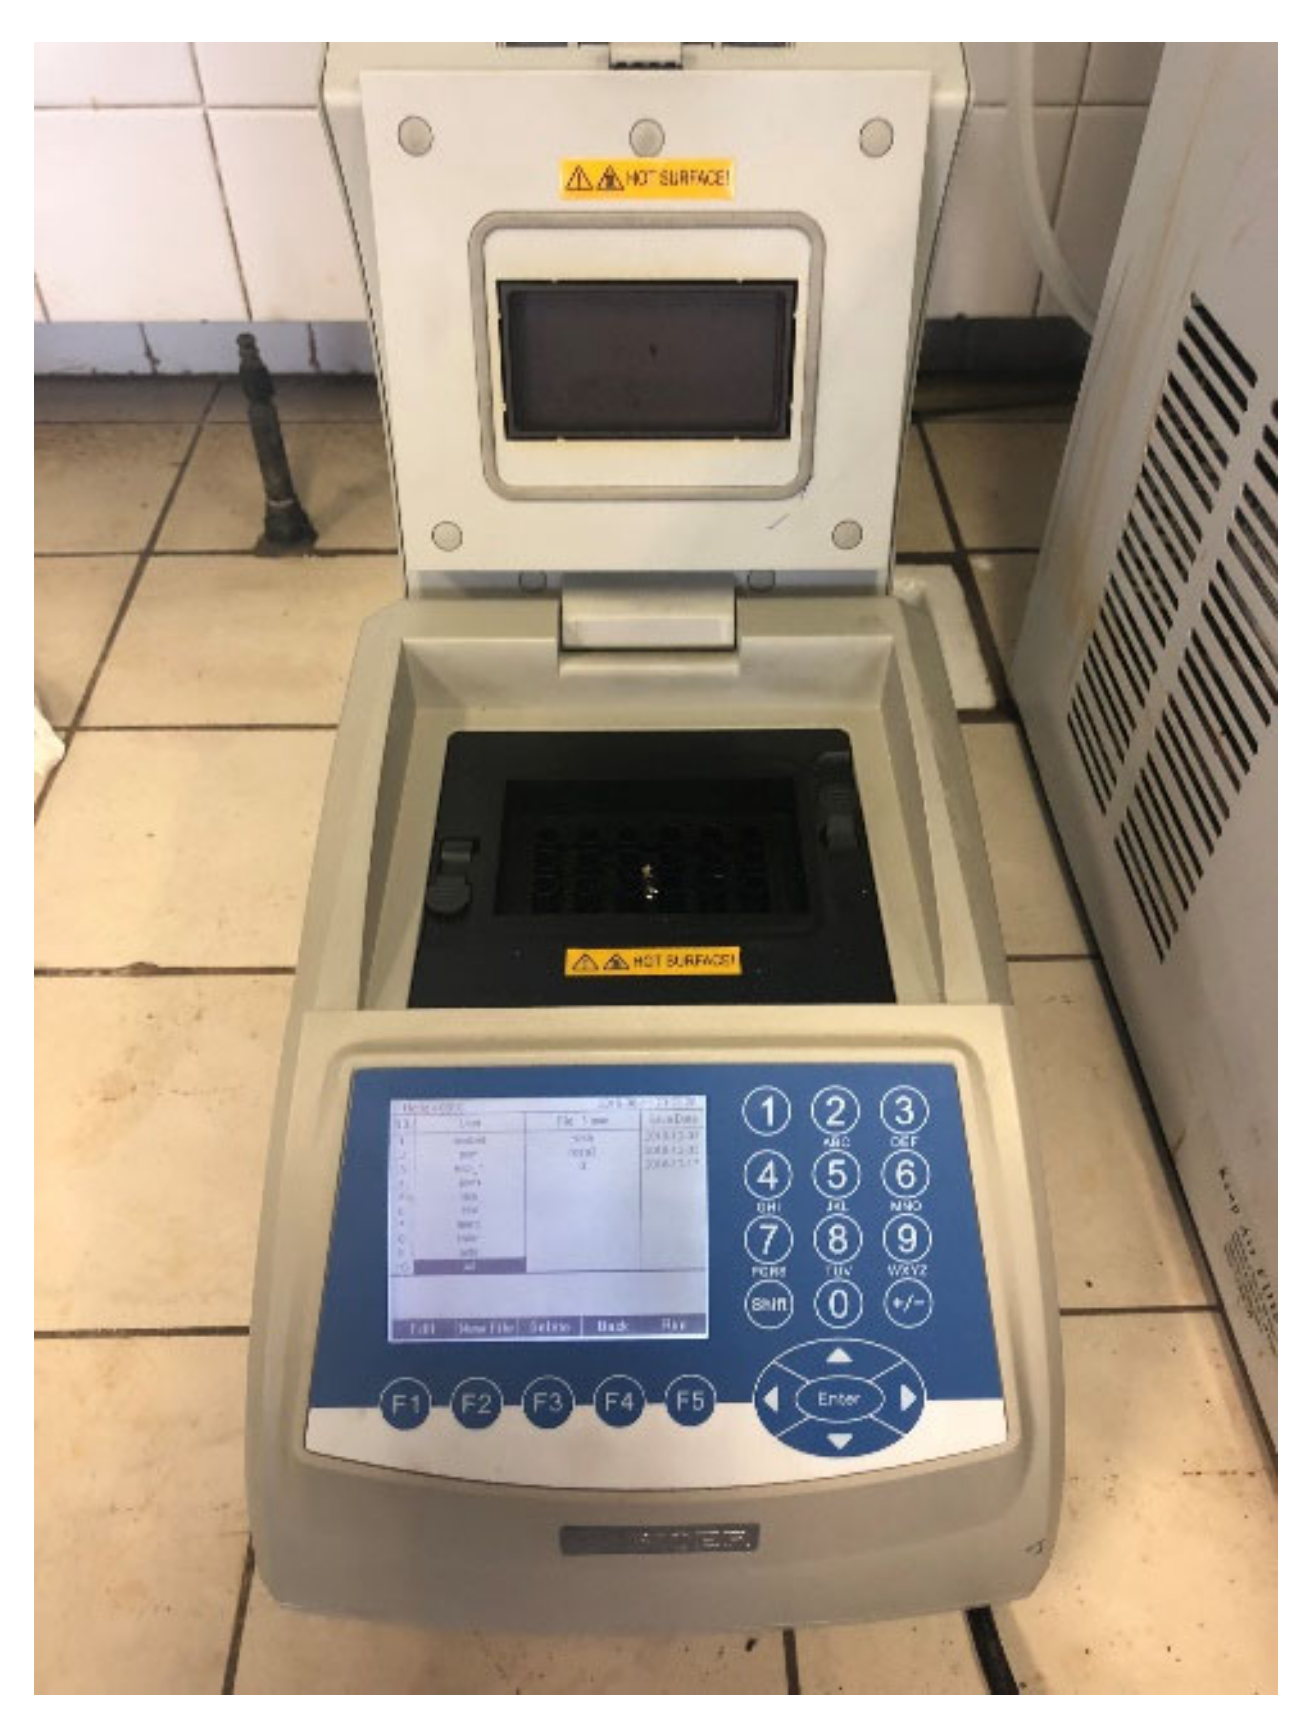
The GeneQ BIOER TC-18/H(b) thermal cycler allows performing thermal cycles from room temperature up to 100 °C to investigate the stability of PCM samples over time. Typically, 50 K∙min−1 is applied as the heating and cooling rate. Up to 100 thermal cycles per day are carried out. The thermal cycler allows placing 18 samples at the same time in 0.5 mL Eppendorf tubes. The Eppendorf tube must not be filled completely, as only the lower part will be subjected to heating and cooling cycles. It is recommended to fill 2/3 of the Eppendorf tube. Depending on the aim of the study, different temperature profiles can be applied. A picture of the stability testing device “GREiA I” is shown in Figure 16.

UDL-GREiA II

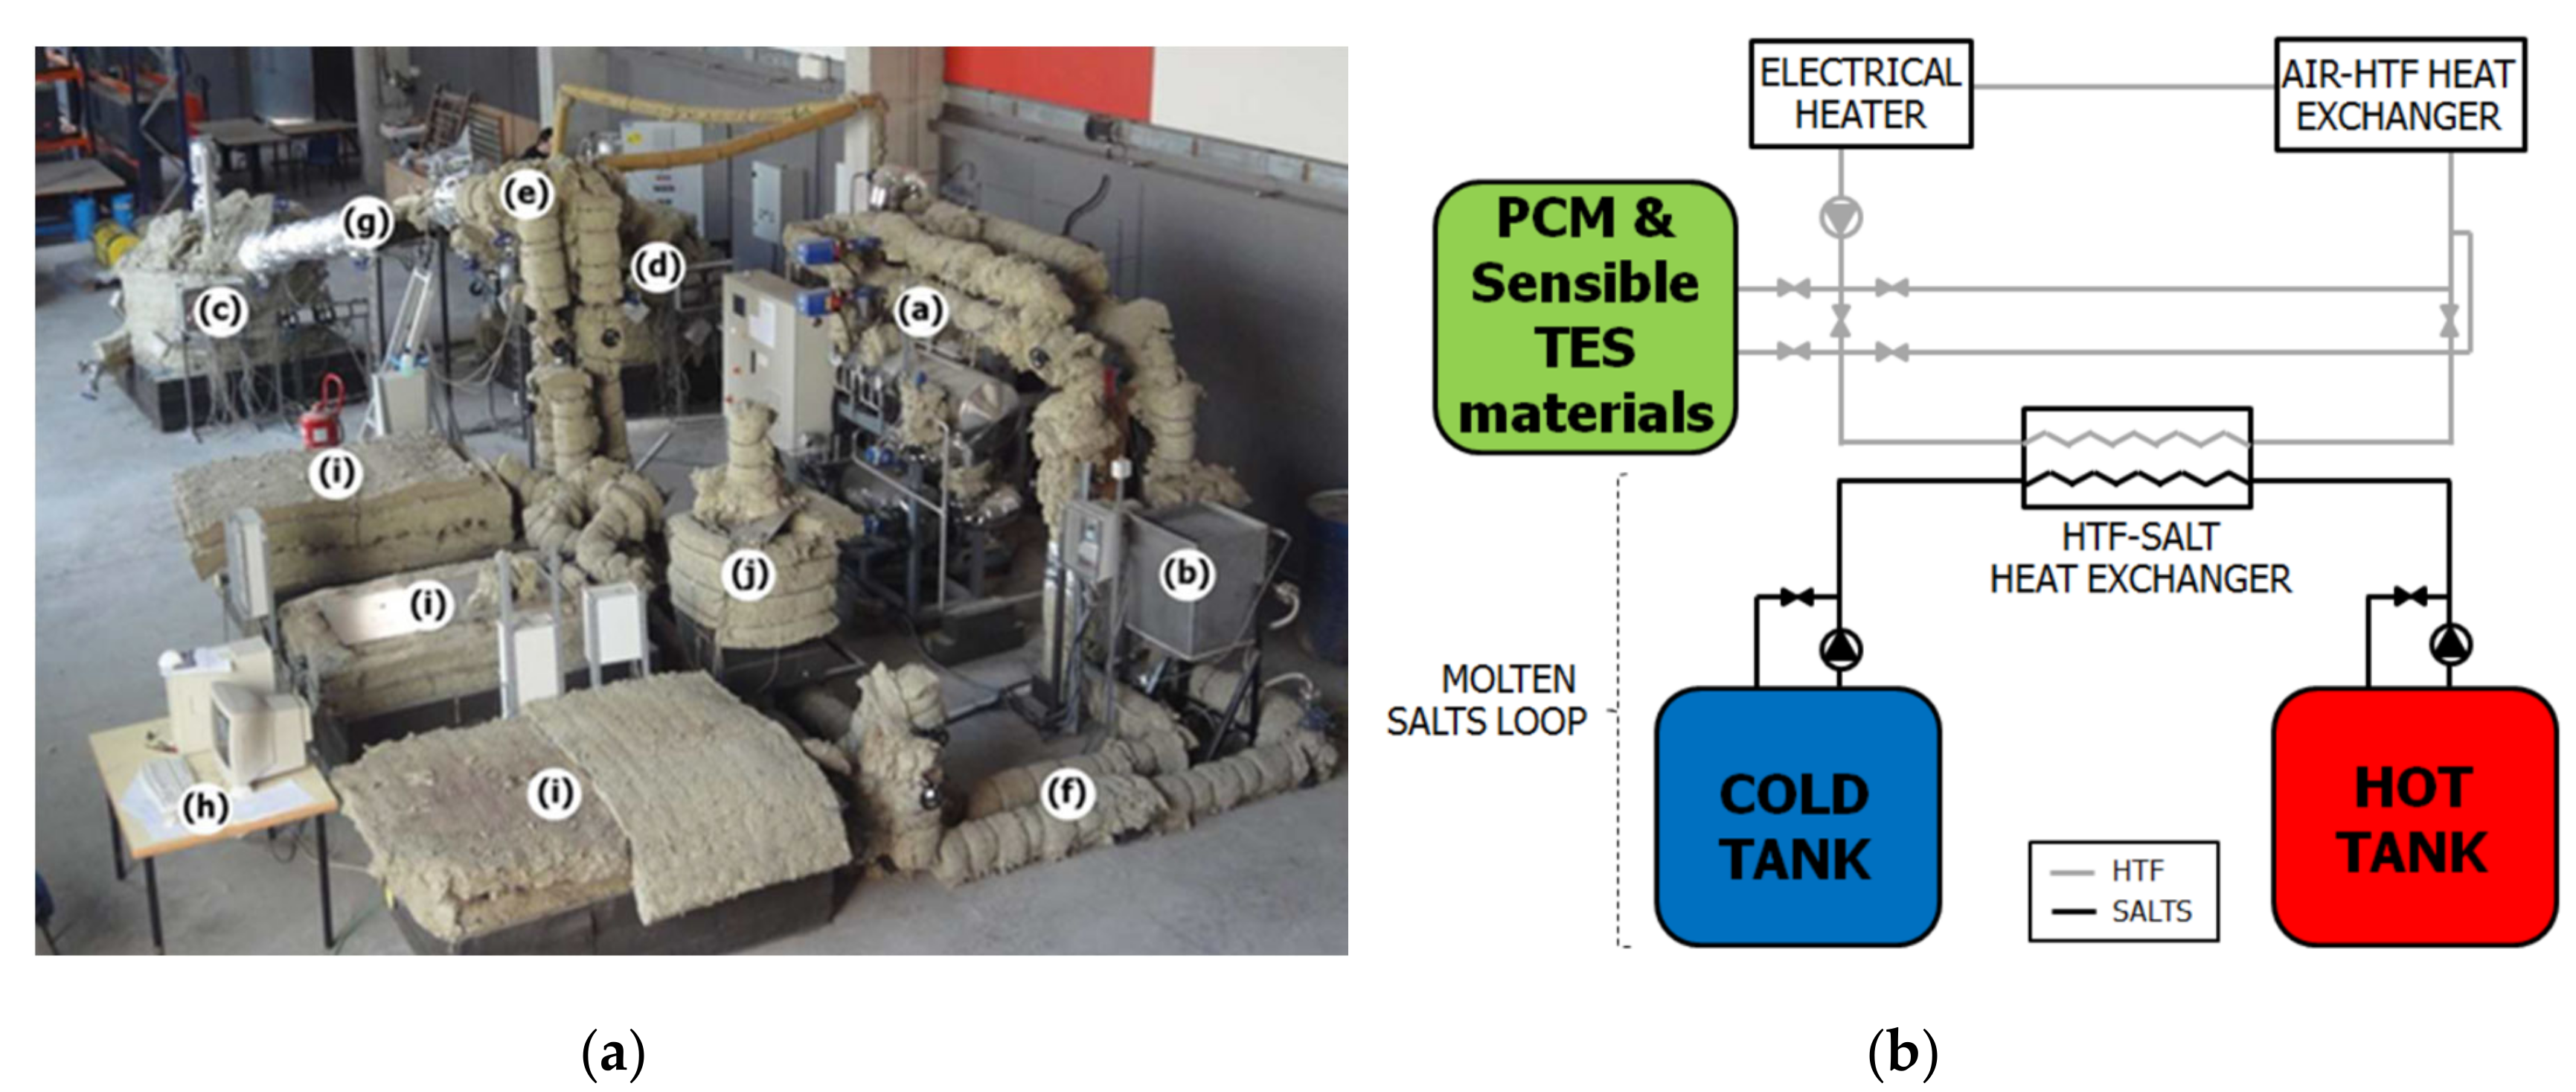
The pilot plant at the University of Lleida was built to accurately test different thermal energy storage (TES) systems working with latent or sensible heat storage materials. This facility is composed of a 24 kWe electrical boiler to heat up the heat transfer fluid (HTF) (acting as energy source during the charging process), different storage tanks containing PCM, and a 20 kWe air heat exchanger to cool down the HTF (acting as energy consumption). Typically, one thermal cycle per day is carried out. A picture and schematic of the pilot plant test facility are shown in Figure 17.
A data acquisition system consisting of temperature, pressure, and flow rate sensors as well as different data loggers and a personal computer were integrated in the facility to measure the HTF flows, HTF pressures, and HTF and PCM temperatures in the boiler and storage tank, respectively. Depending on the aim of the study, different temperature profiles are applied. In this regard, during experimental tests that are carried out to assess the performance of components such as PCM tanks under different charging and discharging conditions, thermal cycling testing of the PCM can also be realized as far as the required number of thermal cycles and the temperature profile are known. Then, the degradation of PCM after different cycles can be evaluated at a pilot-plant scale, or small samples of the PCM can be extracted and analyzed in the lab using established techniques, such as DSC, FT-IR spectroscopy, or thermogravimetric analysis (TGA).

UDL-GREiA III

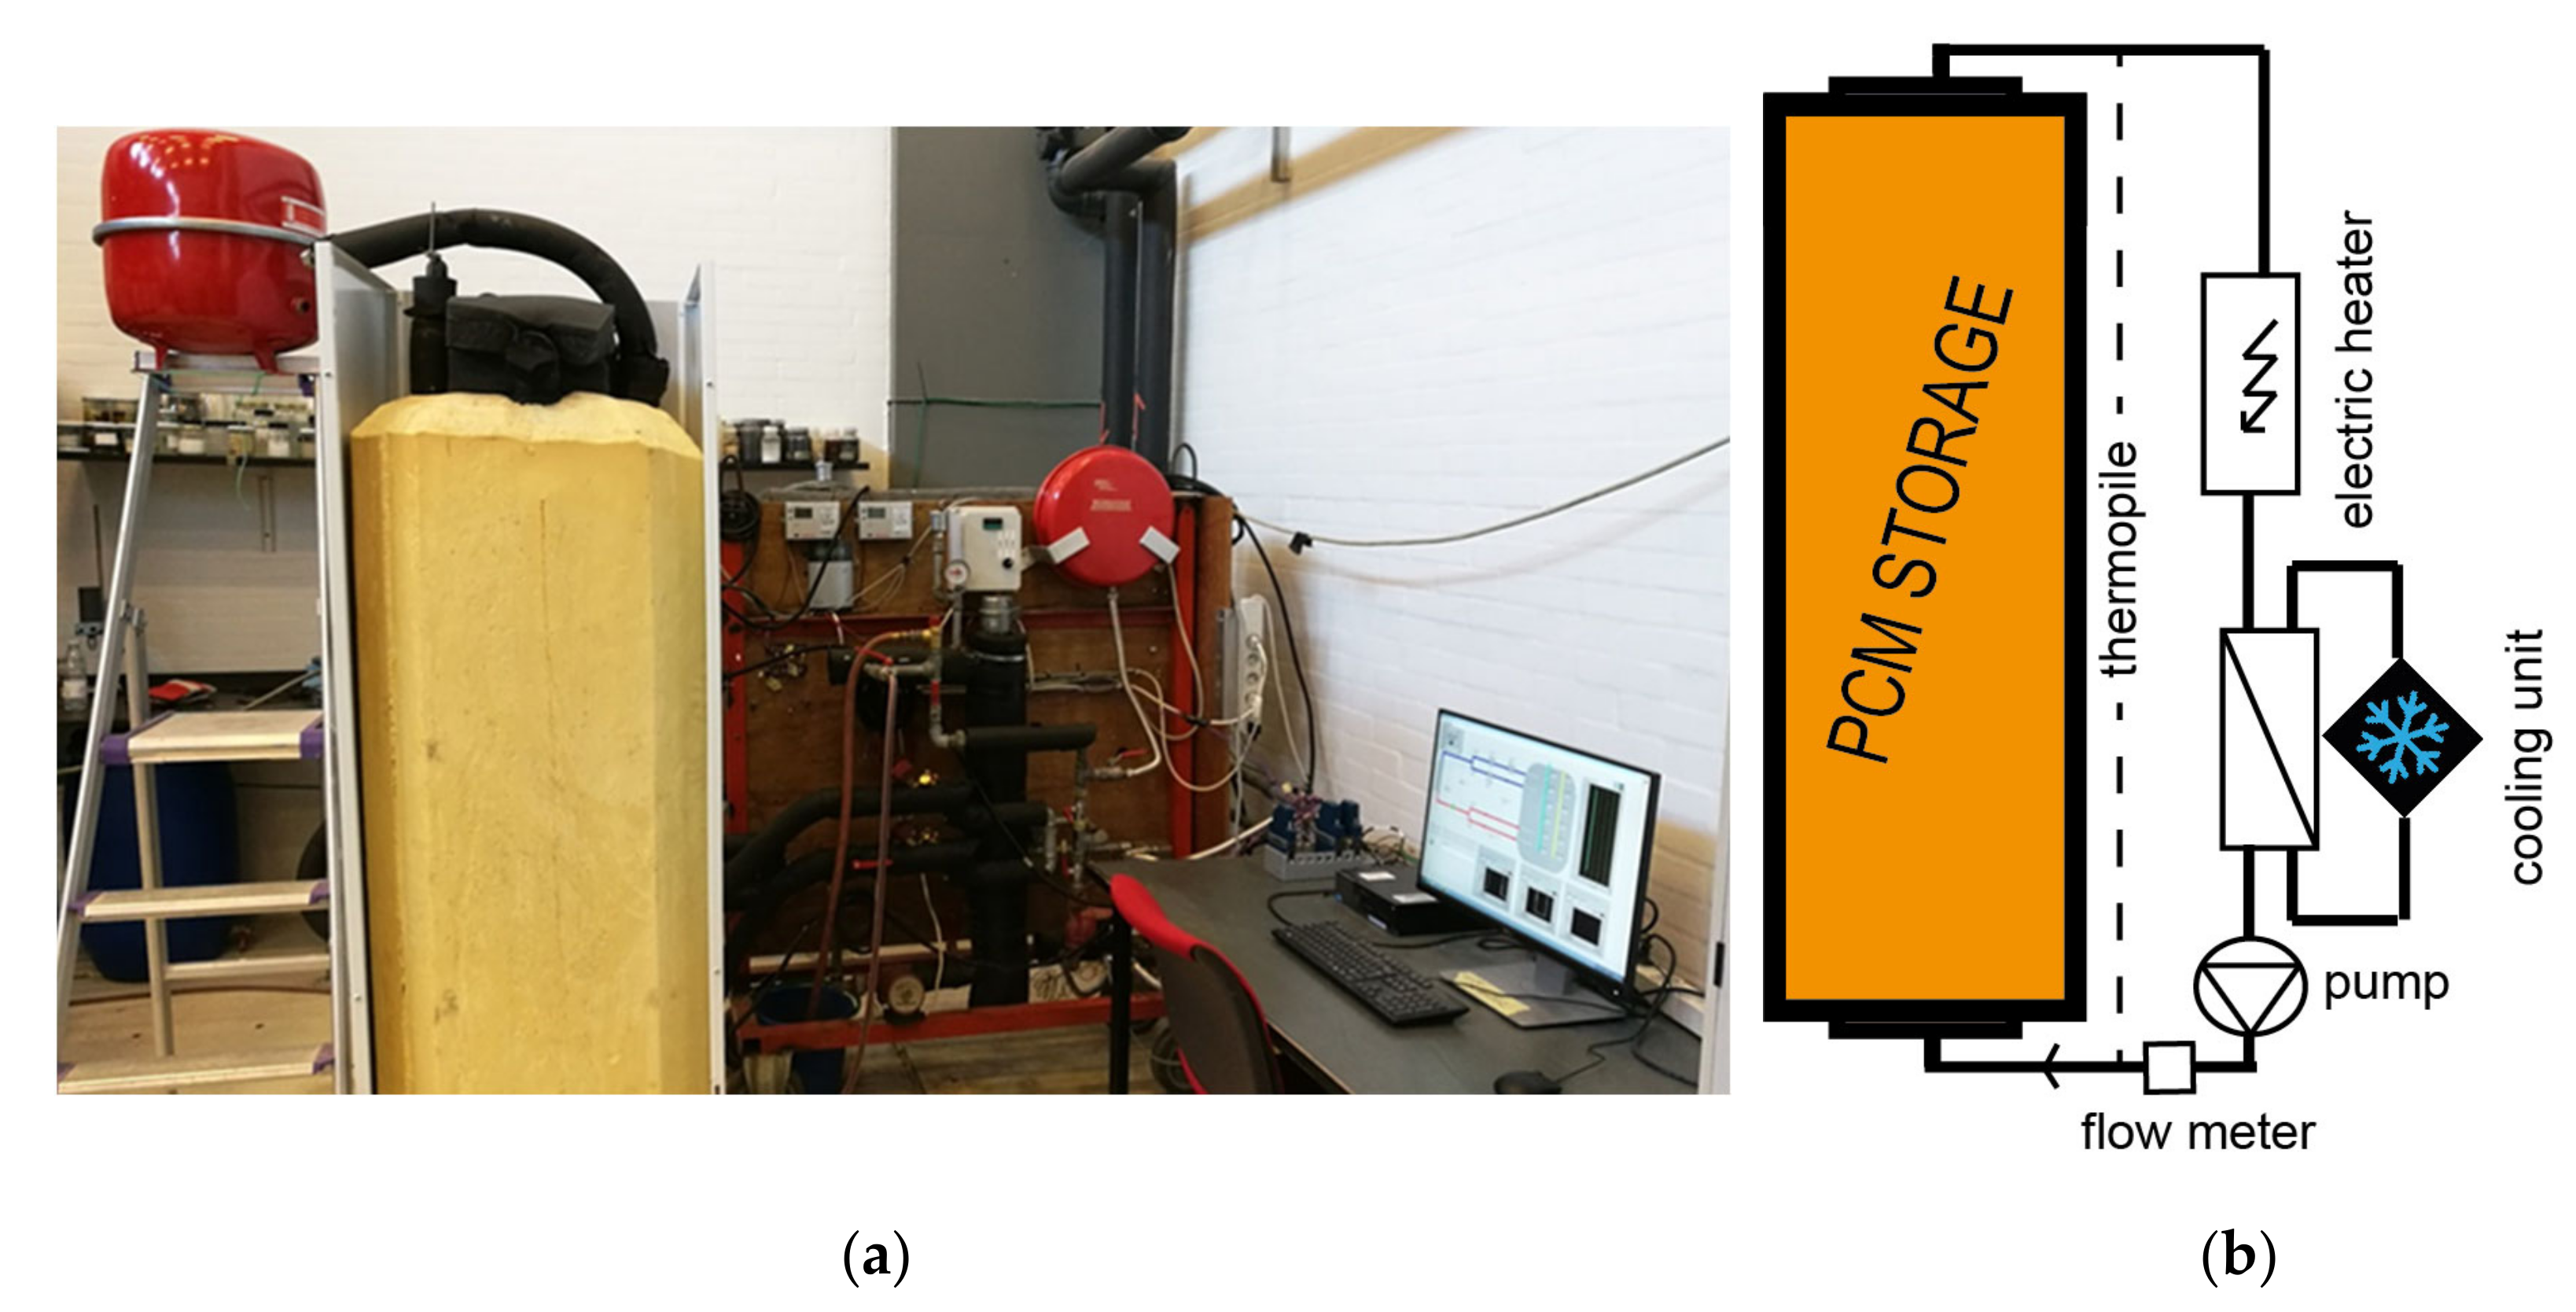
This experimental setup of the GREiA lab at the University of Lleida was built to test the behavior of different types of heat exchangers and thermal energy storage tanks. Both charging and discharging of the thermal energy storage modules can be performed by means of two separate circuits: one cooling circuit connected to a variable capacity condensing unit, and one heating circuit connected to a thermal bath. There is the possibility of connecting the heating bath to a water storage tank to increase the thermal inertia and to provide a more stable water temperature to the heat exchangers. A picture and schematic of the test facility are shown in Figure 18.
During the experiments, PCM and HTF temperatures, PCM pressure, and HTF flow rate are measured. Depending on the aim of the study, different temperature profiles can be applied. Due to the relatively small size of this setup, dedicated thermal cycling tests of PCM can be performed to study the degradation of the PCM after different numbers of melting–solidification cycles at lab scale. Typically, two thermal cycles per day are carried out.

ZAE

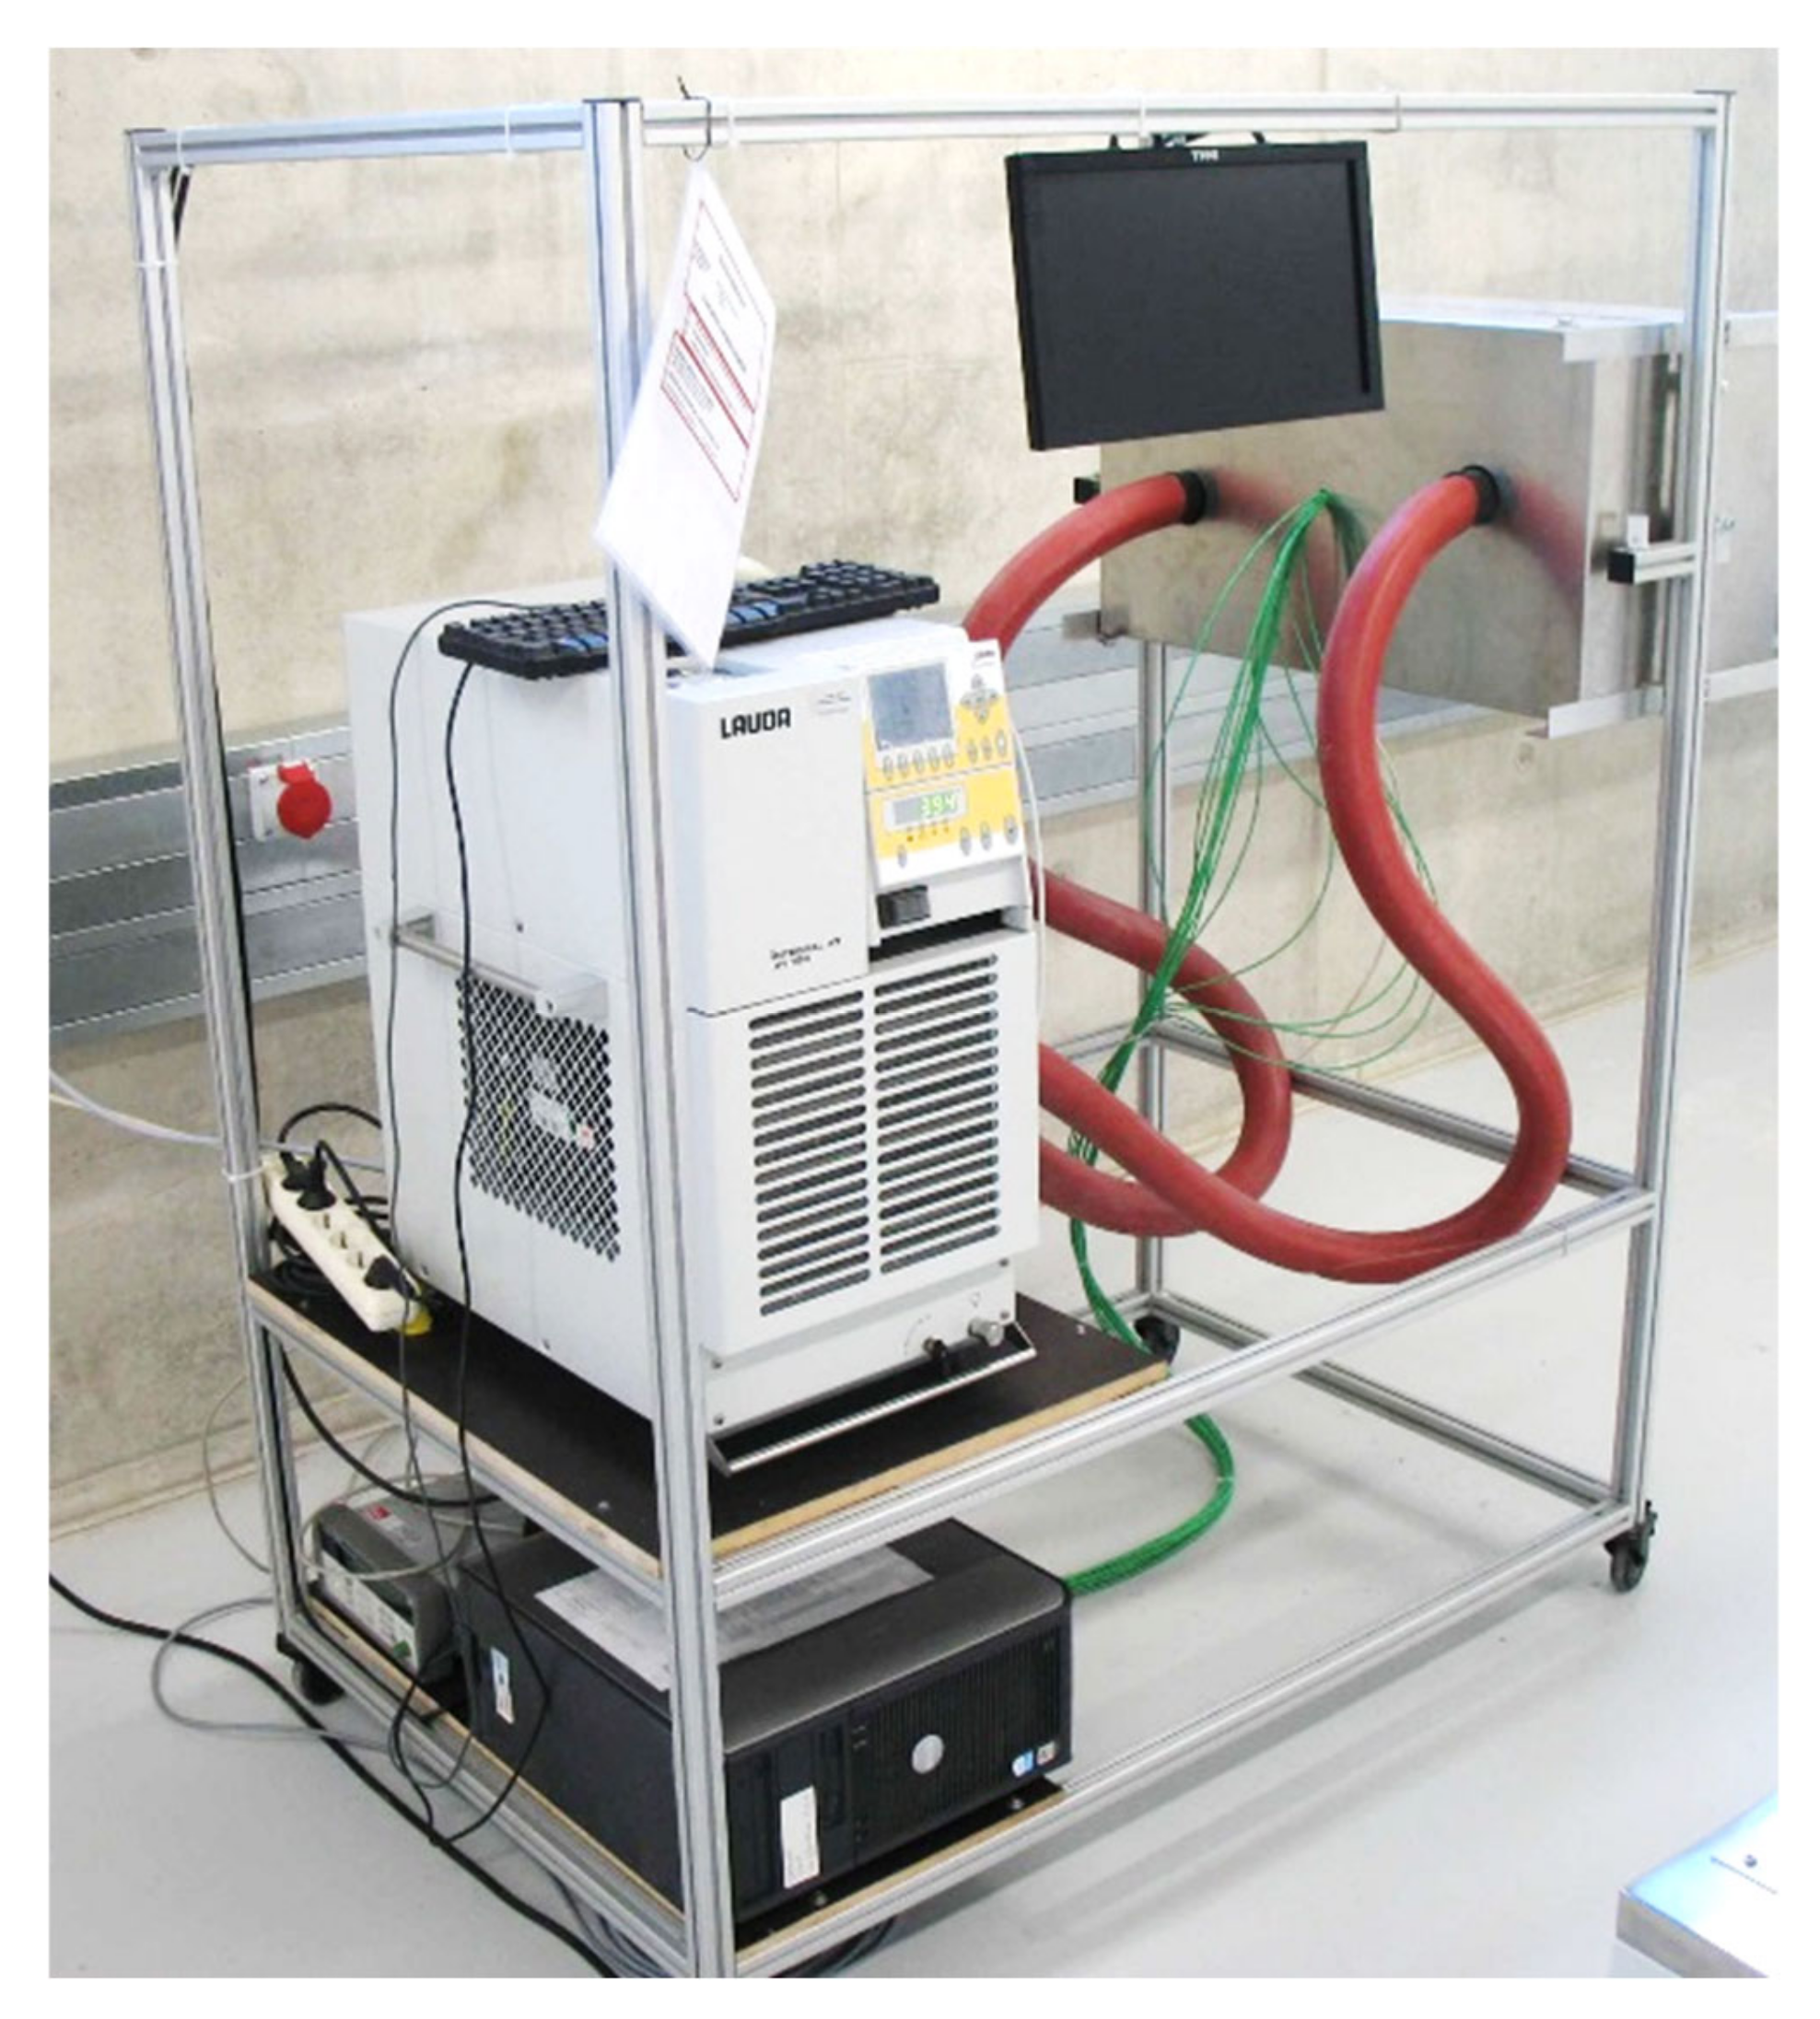
The thermal cycling test rig at ZAE Bayern can be applied to thermally cycle PCM under successive melting and crystallization processes and to visually detect the variation in appearance of the material, e.g., a phase separation. The test rig includes three sample containers to simultaneously investigate three PCM with similar melting temperatures [7]. A picture of the installation is given in Figure 19.
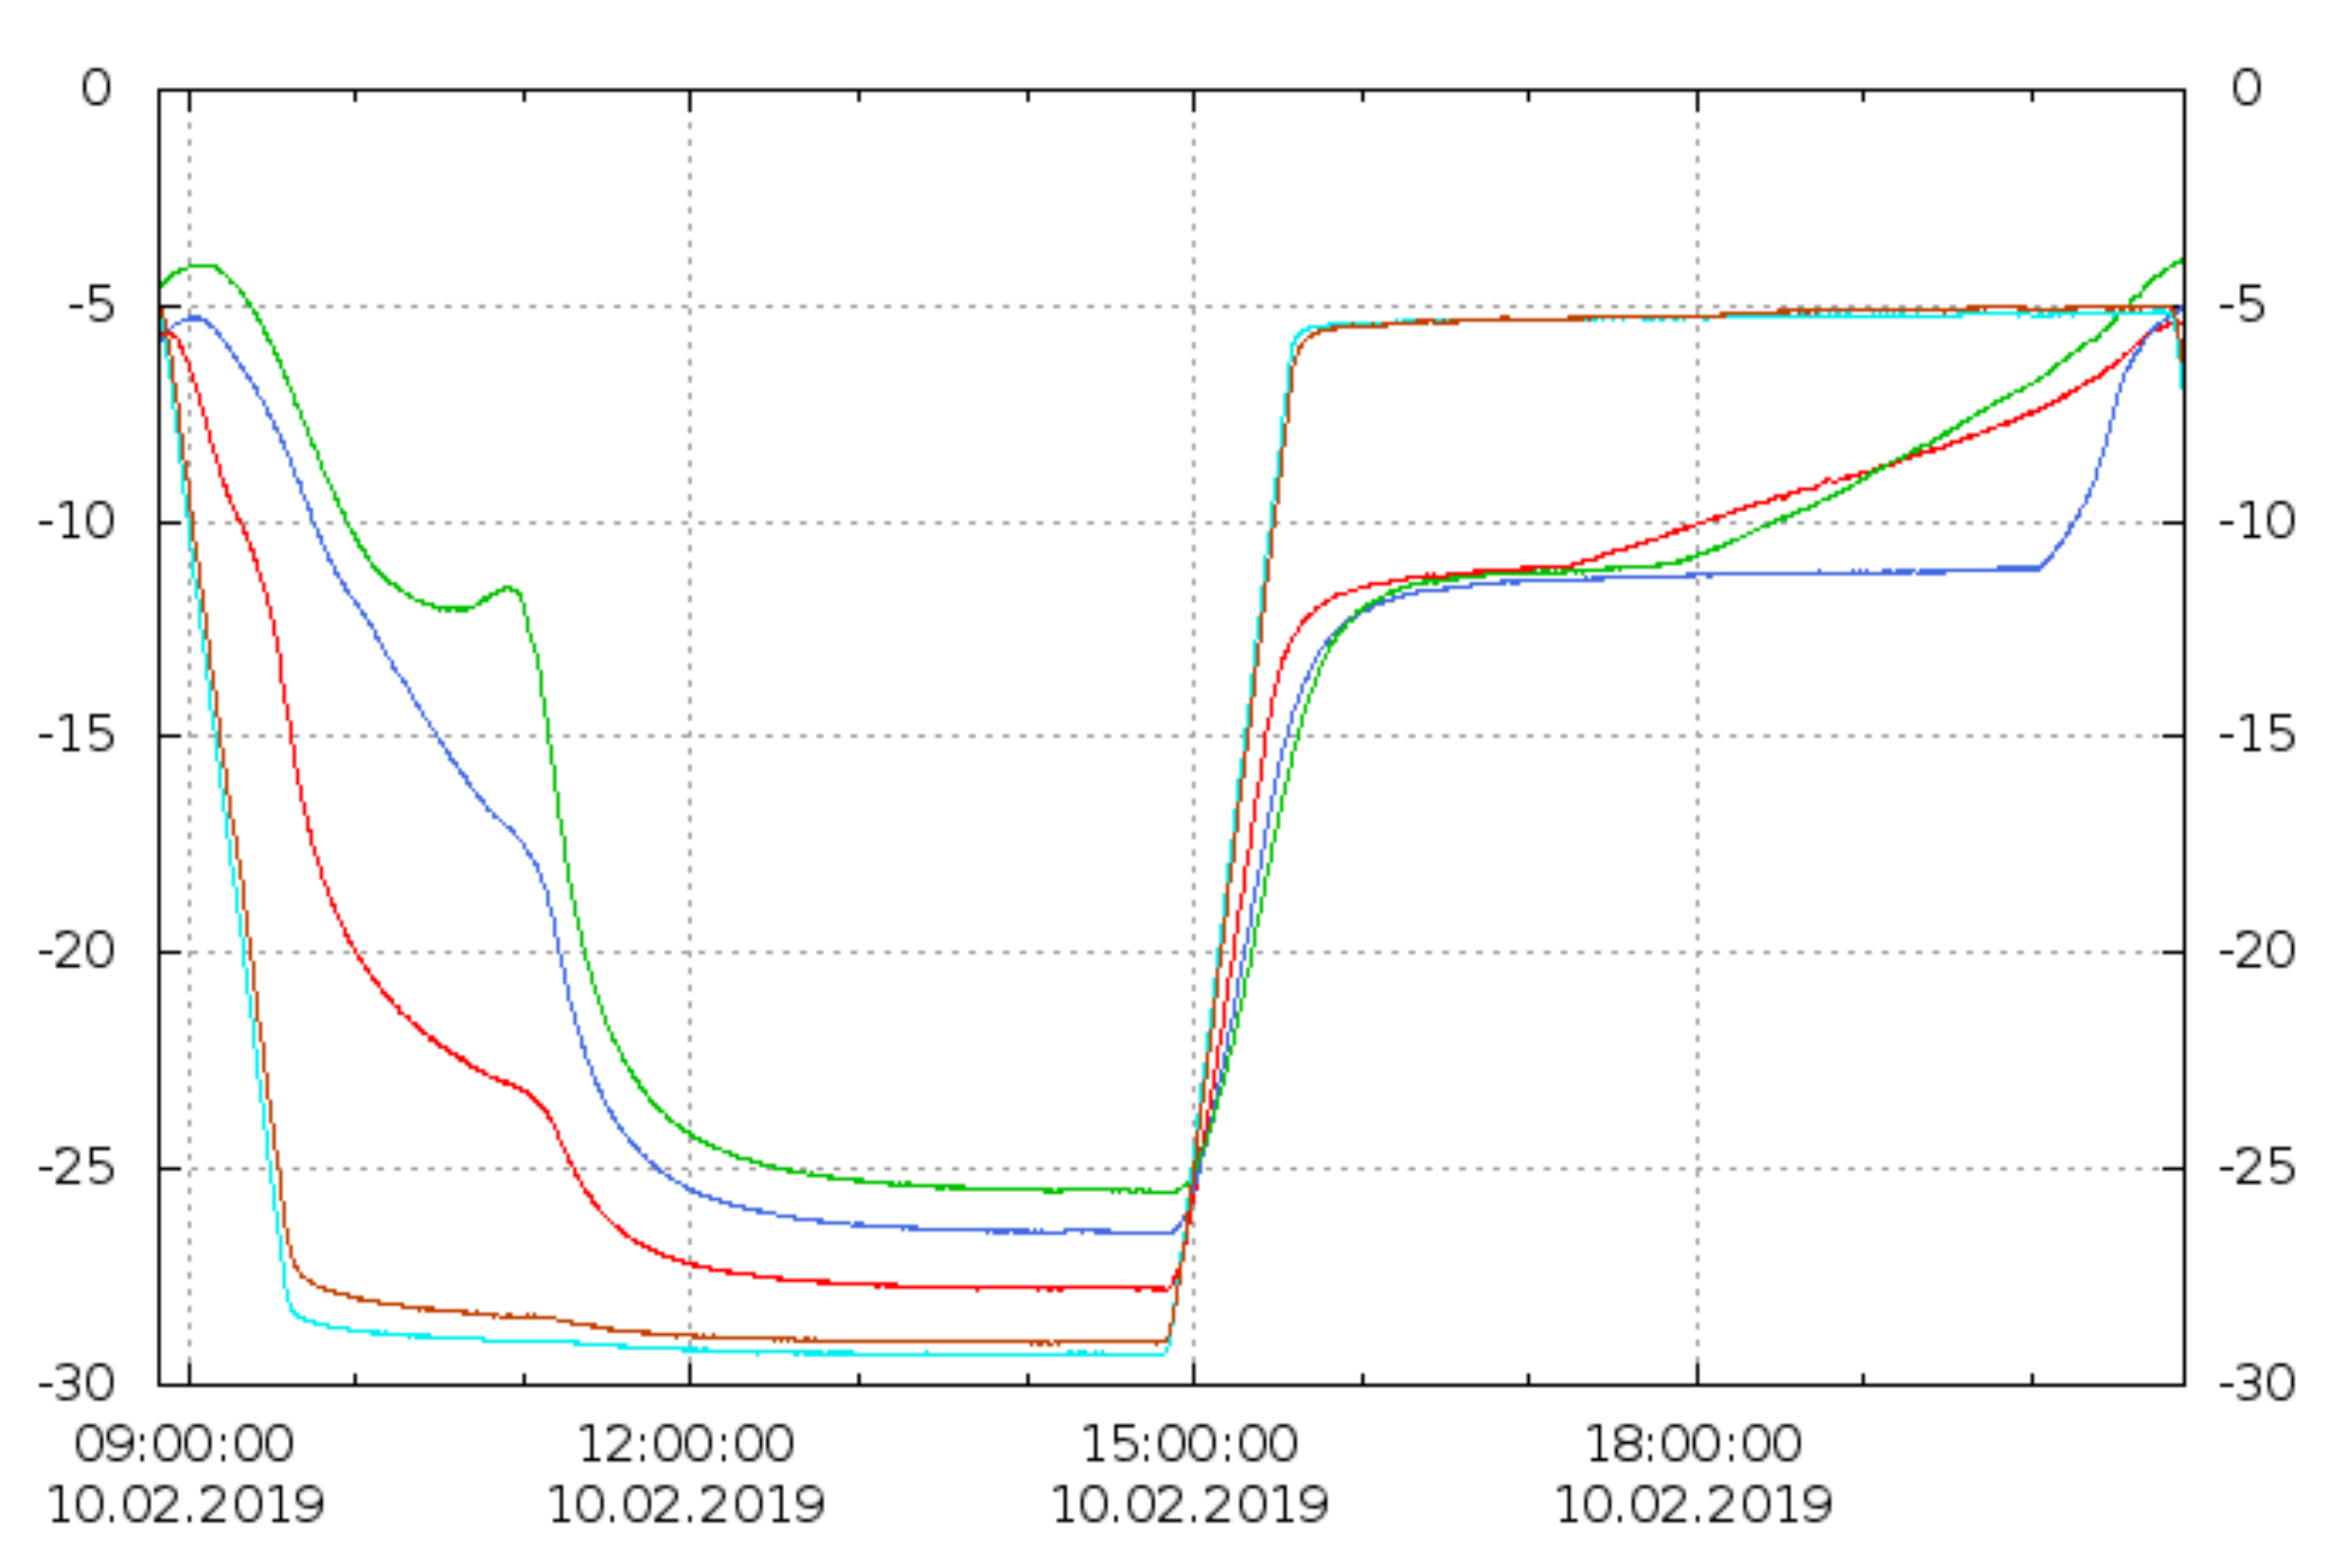
To thermally cycle PCM, two different temperature levels for melting/freezing and transitions via linear ramps are applied (typically 1 K∙min−1 heating and cooling rate). During the experiments, temperature–time curves of three temperature sensors within each of the three samples and three temperature sensors in the heat exchanger close to the sample containers are recorded. Figure 20 depicts the temperature–time data of one full thermal cycle.
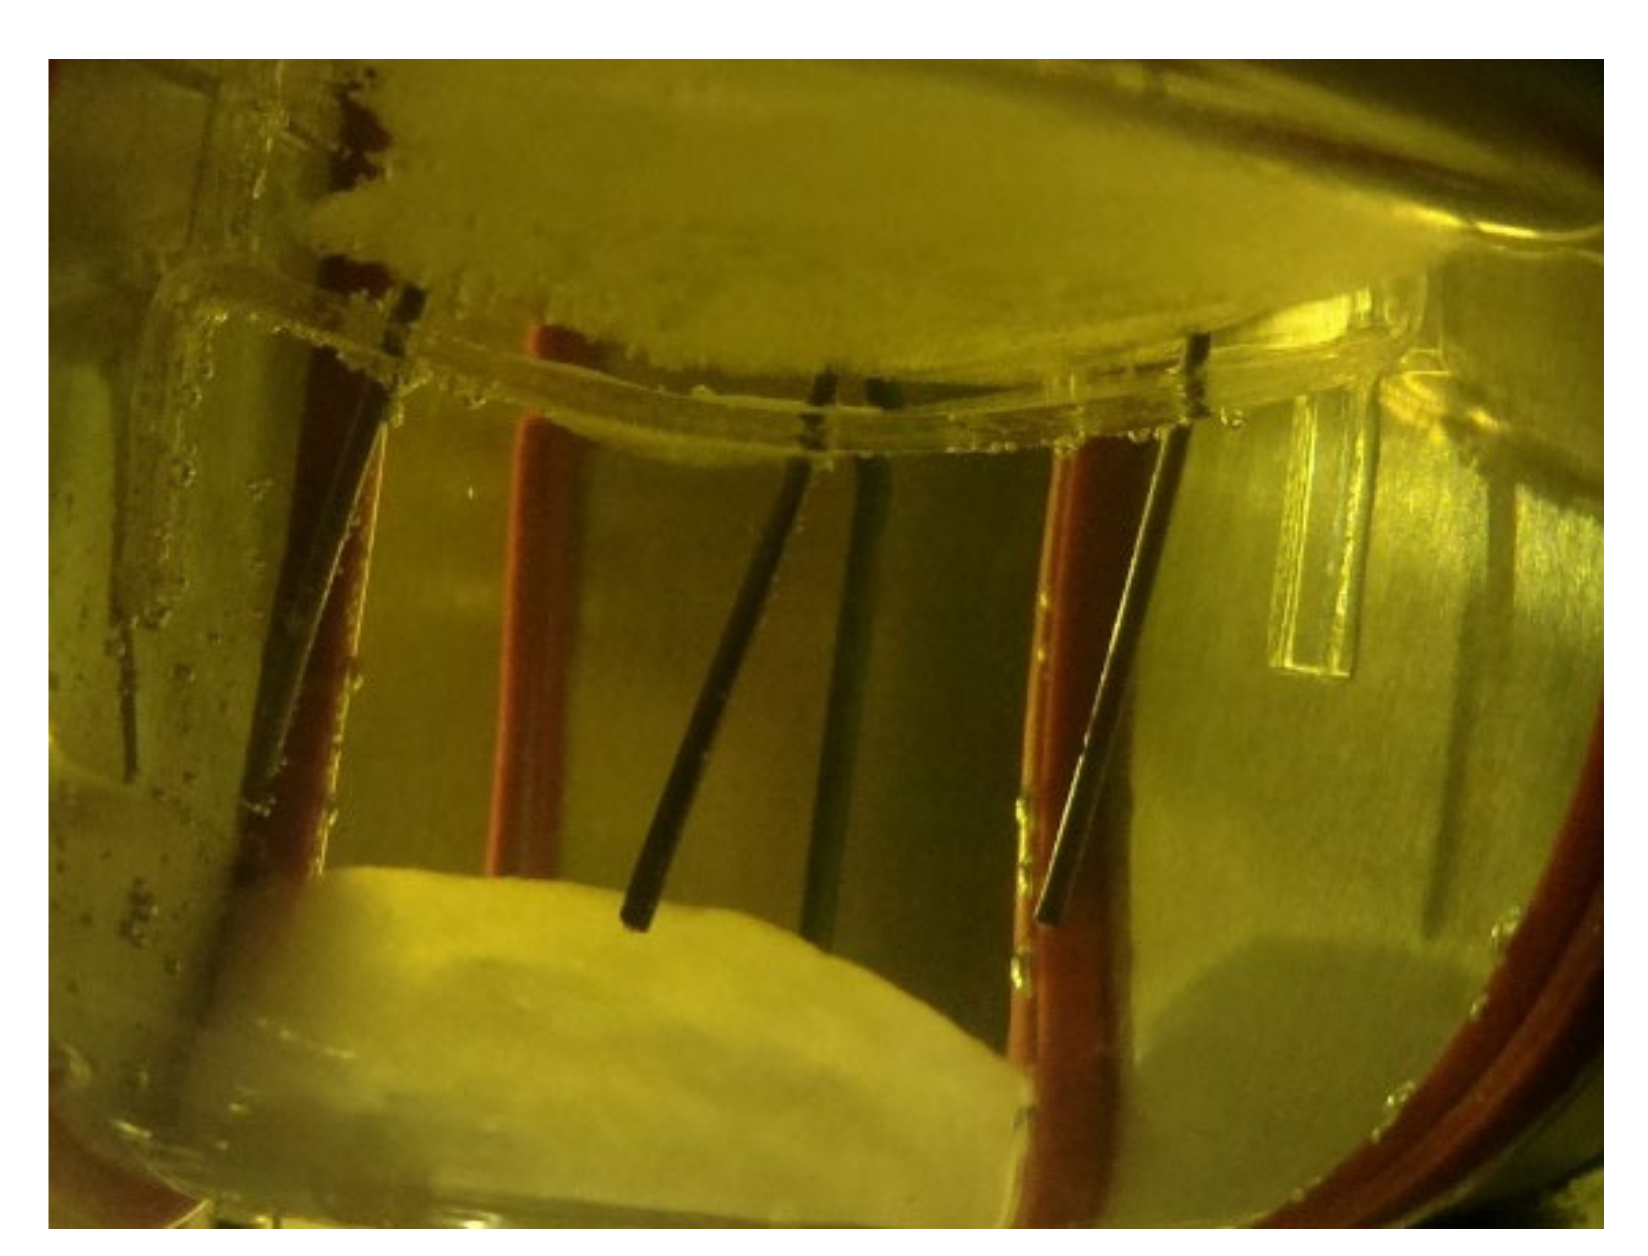
Usually, two thermal cycles per day are carried out. In the assessment of the cycling stability, special attention is paid to the visual detection of a possible phase separation. Figure 21 shows a thermally cycled sample at a temperature above the original melting point.
The visual observation indicates that at least three different phases are present: a liquid and two solid phases, one at the bottom and one at the top of the sample container. If no phase separation is observed, after a certain number of cycles, a small liquid amount of sample material is taken and measured via DSC to check for potential variations of the melting enthalpy and temperature. Performing thermal cycling stability tests under application-relevant conditions and observing potential phase separation visually has shown to provide a reliable assessment of the long-term thermal cycling stability of PCM, e.g., of PCM based on salt-water mixtures.

Summary of Type A Tests

Summarizing the experimental devices to investigate the thermal cycling stability of PCM, a large variety in terms of applied test conditions can be observed. Investigated sample sizes range from 0.5 mL to 154 l. Heating and cooling rates vary from 0.05 to ≈50 K∙min−1 and, as a consequence, the typical number of thermal cycles that are carried out per day varies from 1 up to 140. Different sample container materials are being used: metals, glass, ceramic, and plastics. The atmosphere the PCM sample is in contact with is in most cases air. Two devices allow the use of inert gases (N2, Ar) instead of air; one device is capable of applying vacuum. In principle, a device that is used for thermal cycling tests can also be used to apply a constant temperature to the sample under investigation. For example, this applies to the devices CIEMAT I, CIEMAT II, and CIEMAT III. Overall, the observed variety in terms of applied experimental test conditions can be a consequence of strongly differing applications for which the stability tests have been performed and/or an indication for a lack of standardization regarding PCM thermal cycling stability testing.

2.2.2. Type B—Tests on Supercooled PCM

In the case of PCM with stable supercooling, the investigation of long-term stability consists mainly in determining the reliability of the state of supercooling over a certain period of time under various experimental conditions (size of the sample container or storage tank, maximum charging temperature, minimum discharging temperature, etc.). The desired stability of a supercooled PCM storage unit is achieved if no spontaneous crystallization occurs during the discharge phase of the storage unit or during the holding time of the long-term storage phase. Since PCM storage systems based on stably supercooling PCM are usually operated as long-term storage systems, the number of thermal cycles to be investigated is comparatively low.

DTU Full-Scale

“DTU full-scale” is a full-scale heat storage prototype testing installation [40,41,42]. The stability of the supercooled PCM in contact with the container material is investigated. The setup is shown in Figure 22.
A typical temperature profile applied to study the supercooling of SAT consists in the following steps (Figure 23): charging from approximately 20 to 90 °C, cooling down to ambient temperature (approximately 20 °C), initialization of crystallization, and discharge to ambient temperature (approximately 20 °C).
During the experiments, the following data are measured: temperatures (inlet, outlet) and volume flow rate of the heat transfer fluid, ambient temperature, and heat storage surface temperature.

DTU Heat Loss Method

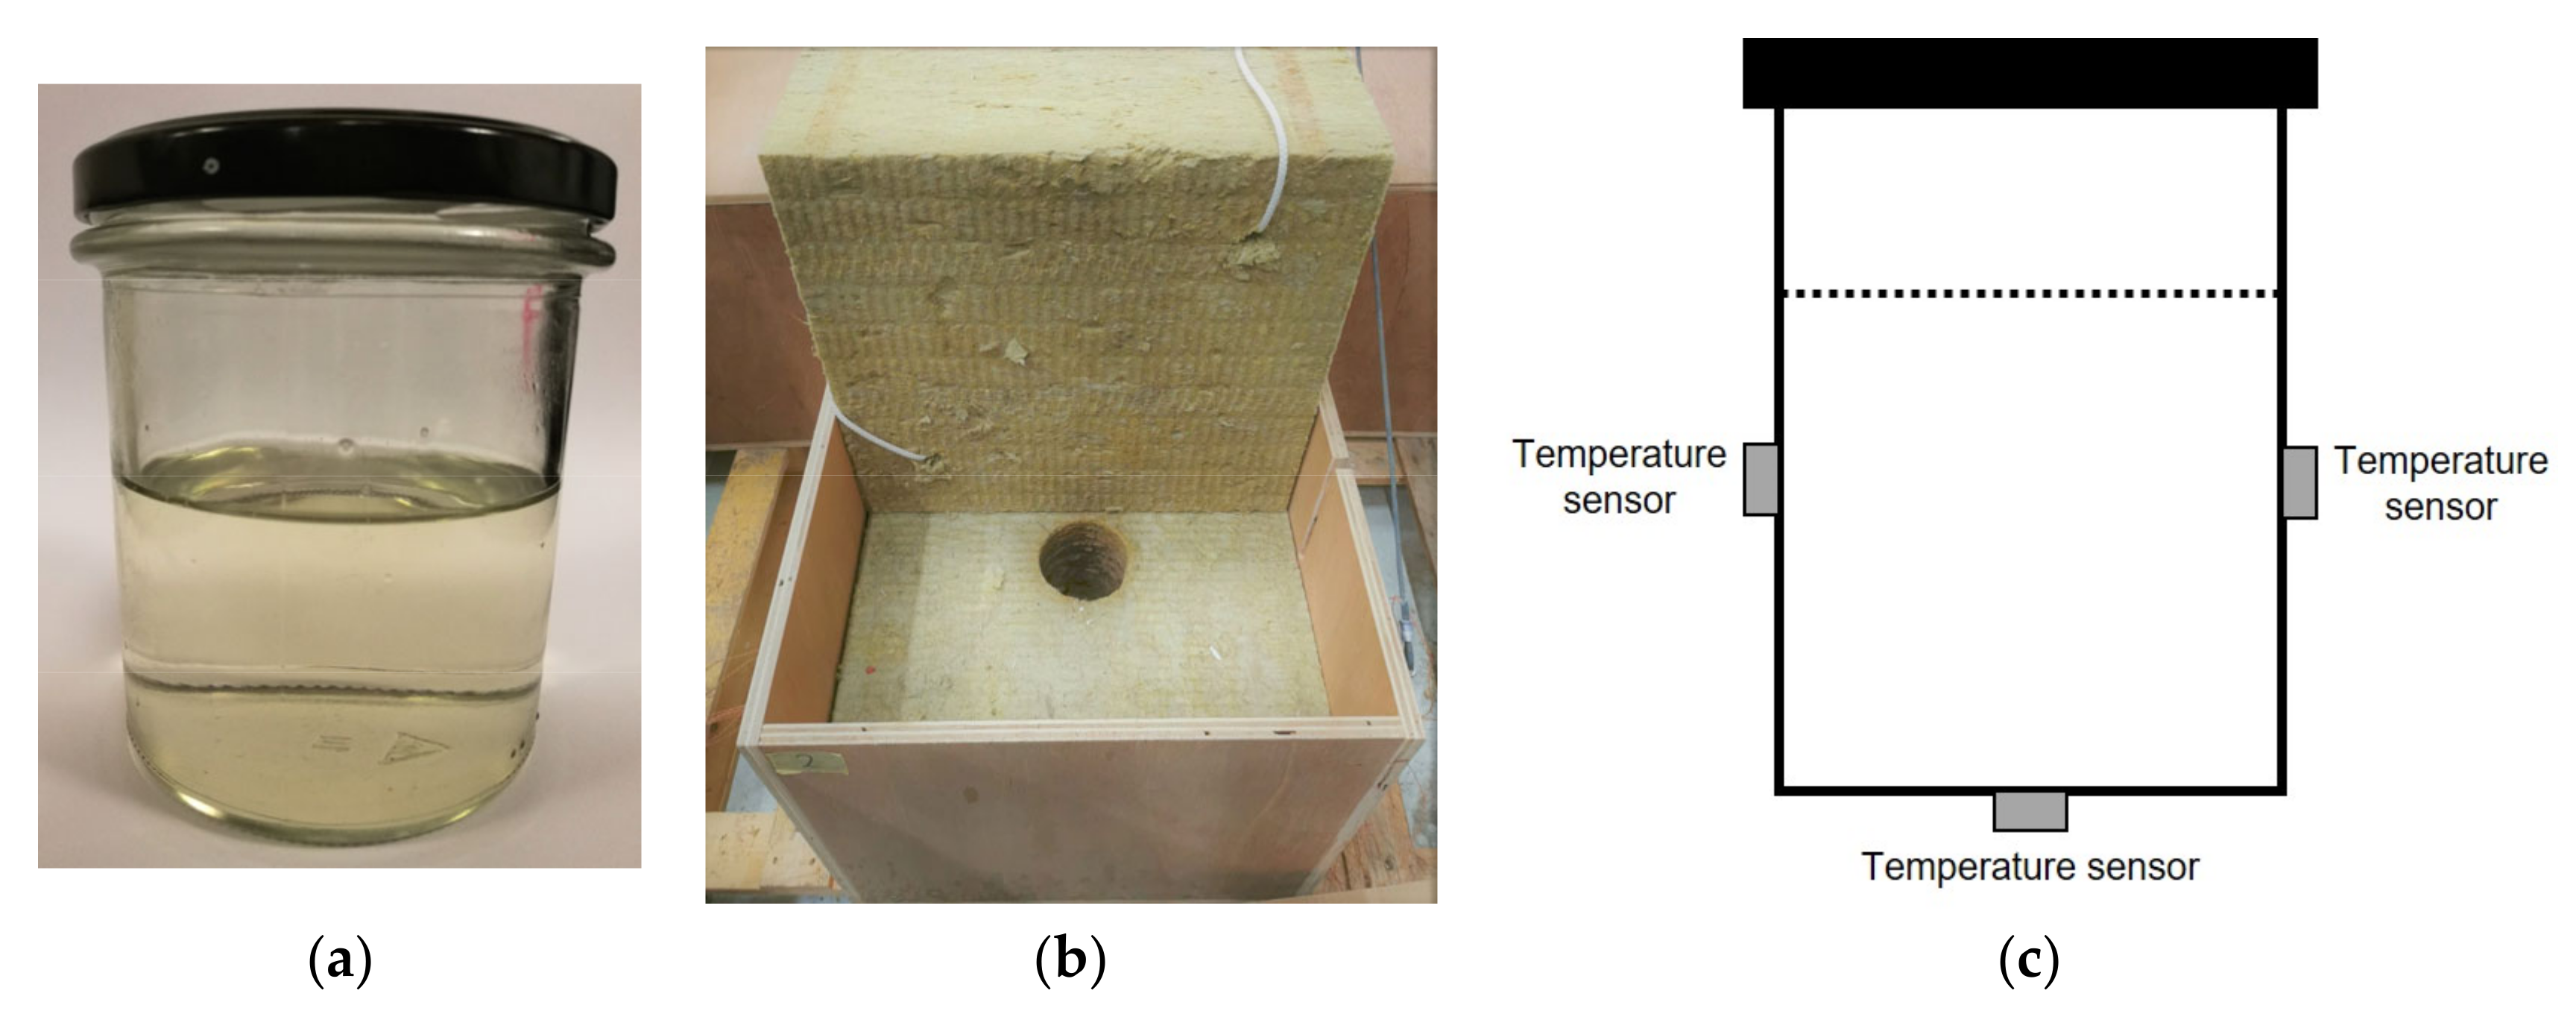
With “DTU heat loss method”, determination of the heat content of (supercooled) PCM at a large sample size (approximately 200 g) is performed [43]. Pictures of the testing device are shown in Figure 24.
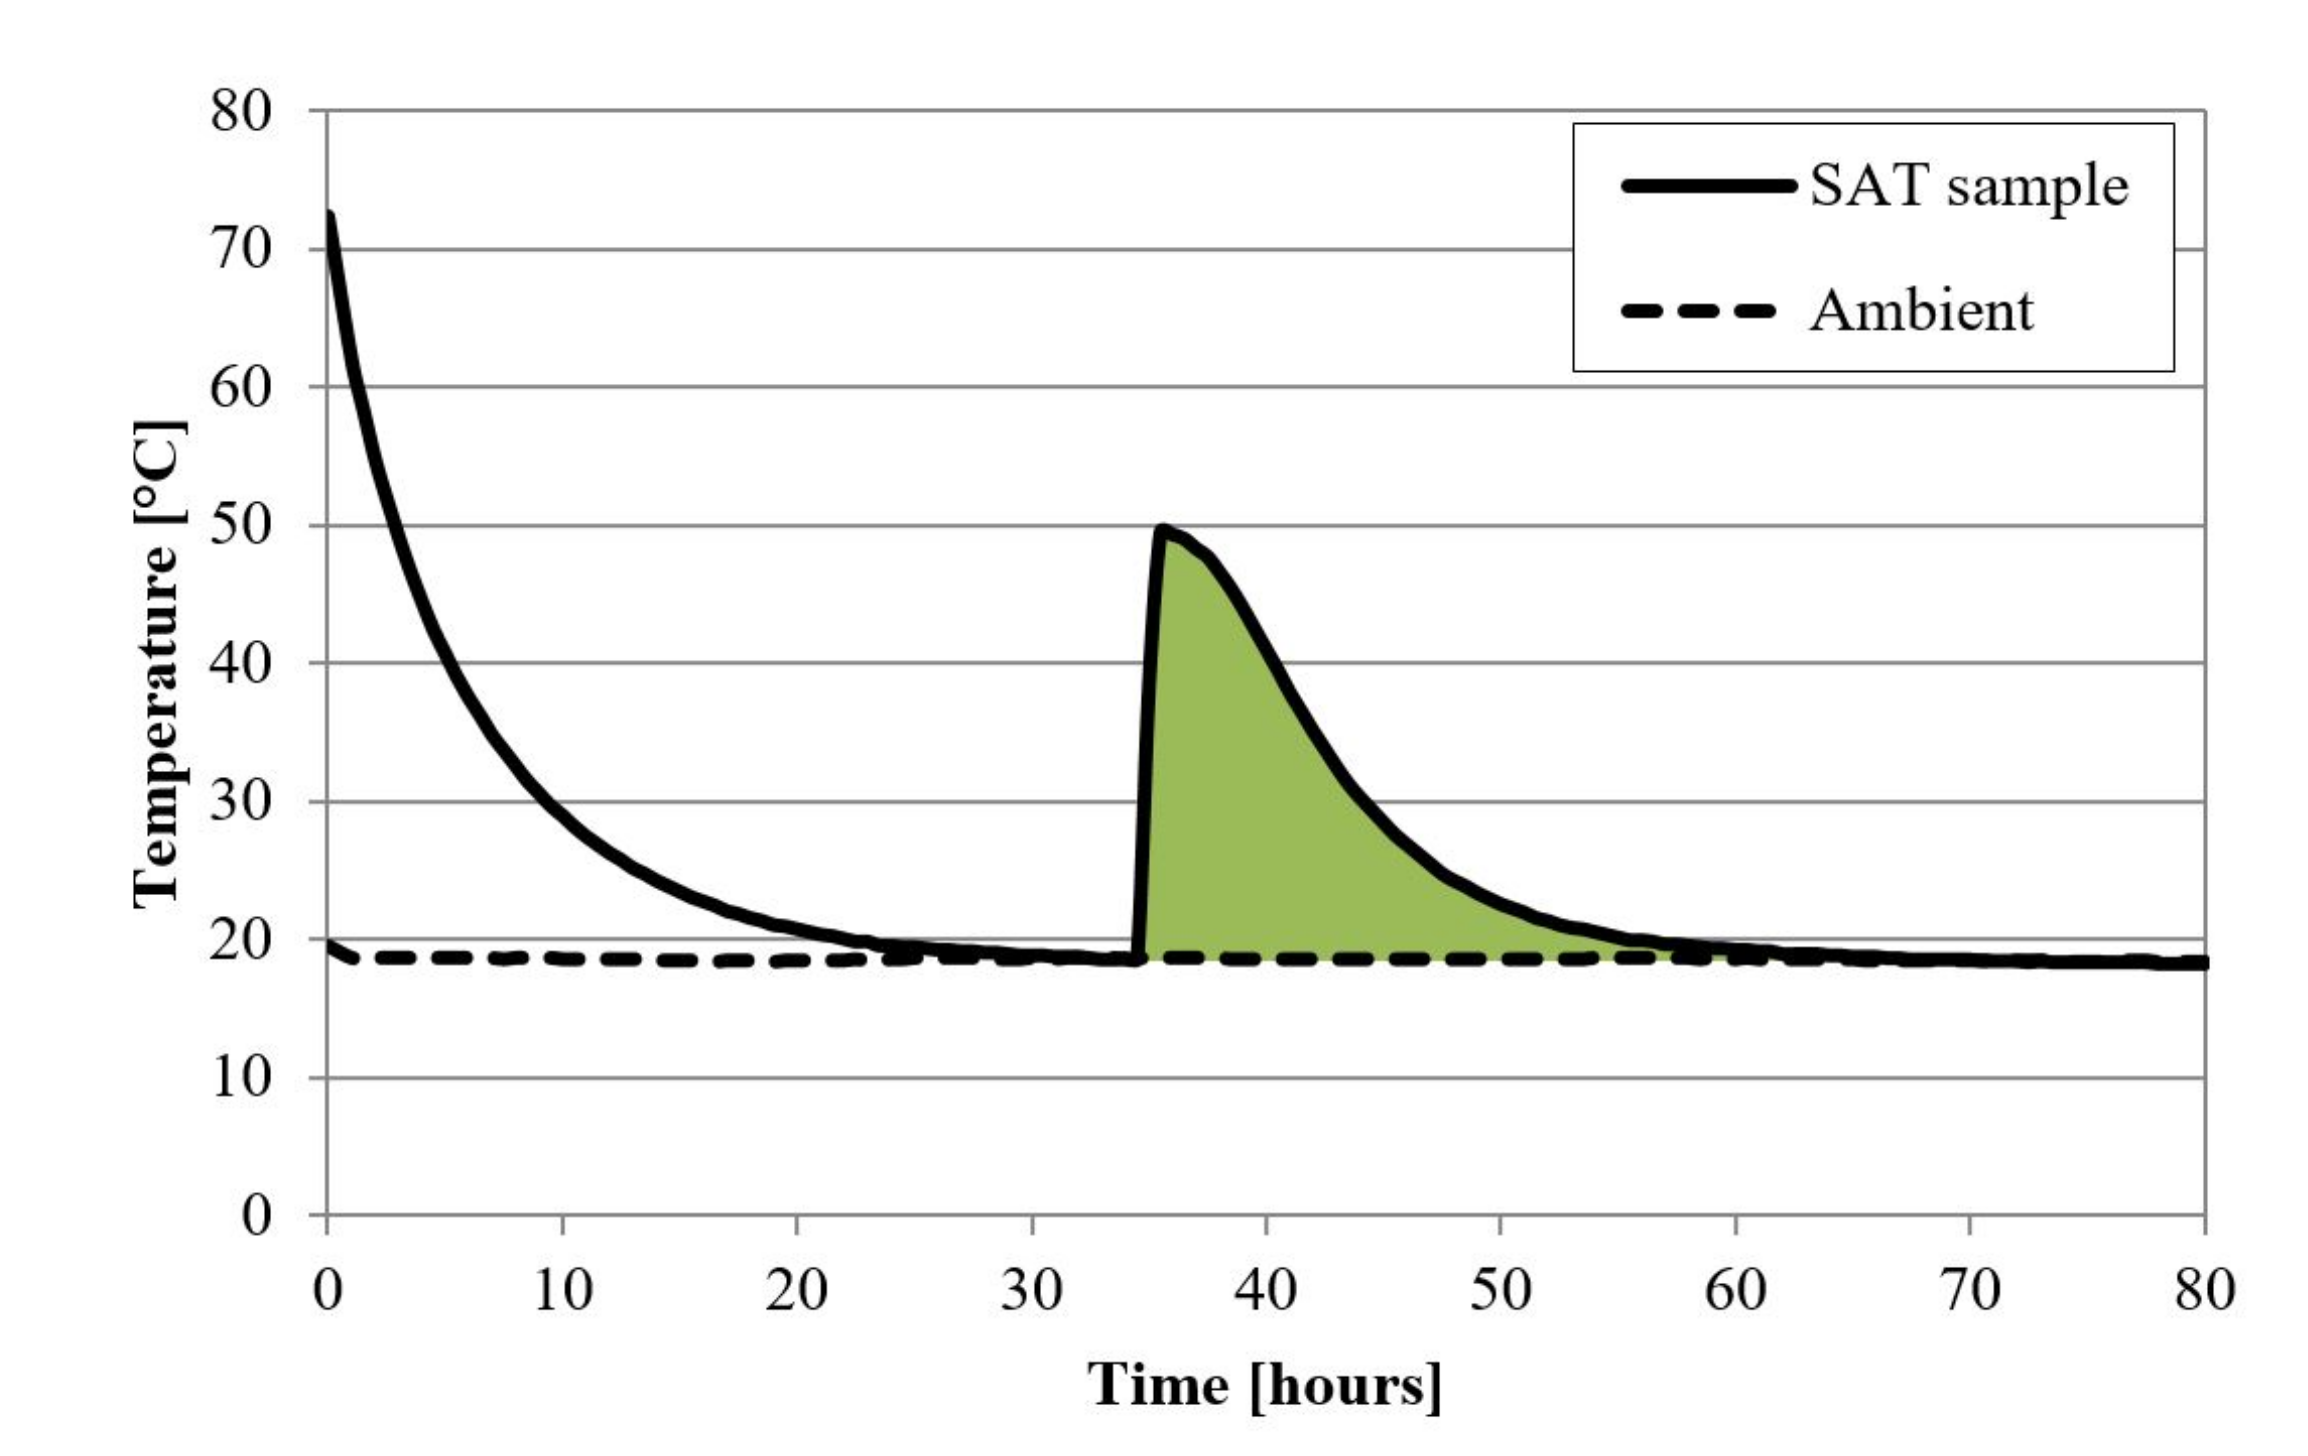
In the case of supercooled SAT, a typical temperature profile consists in heating up the sample in the oven from approximately 20 to 90 °C followed by cooling down to ambient temperature at approximately 20 °C. Then, the crystallization of supercooled SAT is initiated inside an insulated chamber by means of a seed crystal, and the temperature–time curve during the temperature rises due to the crystallization enthalpy, and the succeeding cooling down to ambient temperature is measured. Figure 25 depicts the temperature development of a SAT sample, where the heat content was evaluated as the thermal energy dispersed to the ambience (green area).

DTU Multiple Storage

The device “DTU multiple storage” consists of multiple (10) identical heat storage units [47] which are subjected to repeated heating and cooling cycles with various temperature levels and durations [44]. SAT has been investigated as PCM utilizing supercooling. The focus of the investigations is the effect of different temperature levels and duration of charge on the supercooling stability of SAT. Illustrations of the testing device are given in Figure 26.
Regarding application conditions, discharge is conducted with cold water at 10 °C. As the focus of investigations is the supercooling behavior of SAT, a typical temperature profile consists of the following steps: charging in periods of 8 to 16 h from 10 to 90 °C, cooling down to 10 to 30 °C, 72 h observation period (looking for spontaneous crystallization of the supercooled SAT), intentional initialization of solidification and discharge (at 10 to 30 °C). During the experiments, the following data are measured: temperatures (inlet, outlet) and volume flow rate of the heat transfer fluid, ambient temperature, and heat storage surface temperature.

Summary of Type B Tests

In this study, the experimental setups to investigate the stability of PCM with stable supercooling are dedicated to the properties of SAT. Due to the melting temperature of SAT at 58 °C and its significant supercooling, the experimental devices in this section are being operated within the temperature range of approximately 10 to 90 °C. As the three experimental devices in this section have been designed by the same research group, it is not surprising that they cover different parts of stability investigations on supercooled SAT. The “DTU heat loss method” was applied to identify promising SAT composites by screening samples of up to 200 g with a variety of additive concentrations. The “DTU full scale” setup was used to test prototype stores of up to 200 l storage volume with previously identified promising SAT composites in combination with container and heat exchangers, which are designed to enable stable supercooling. The test setup “DTU multiple storage” was designed to perform long-term stability tests. The operation of up to 10 storage prototype units with 30 l storage volume with typical application conditions (under variation of charging temperature, charging duration, and supercooling periods) is used to elucidate the reliability of developed heat stores.

2.2.3. Type C—Tests on Phase Change Slurries (PCS)

ISE PCS

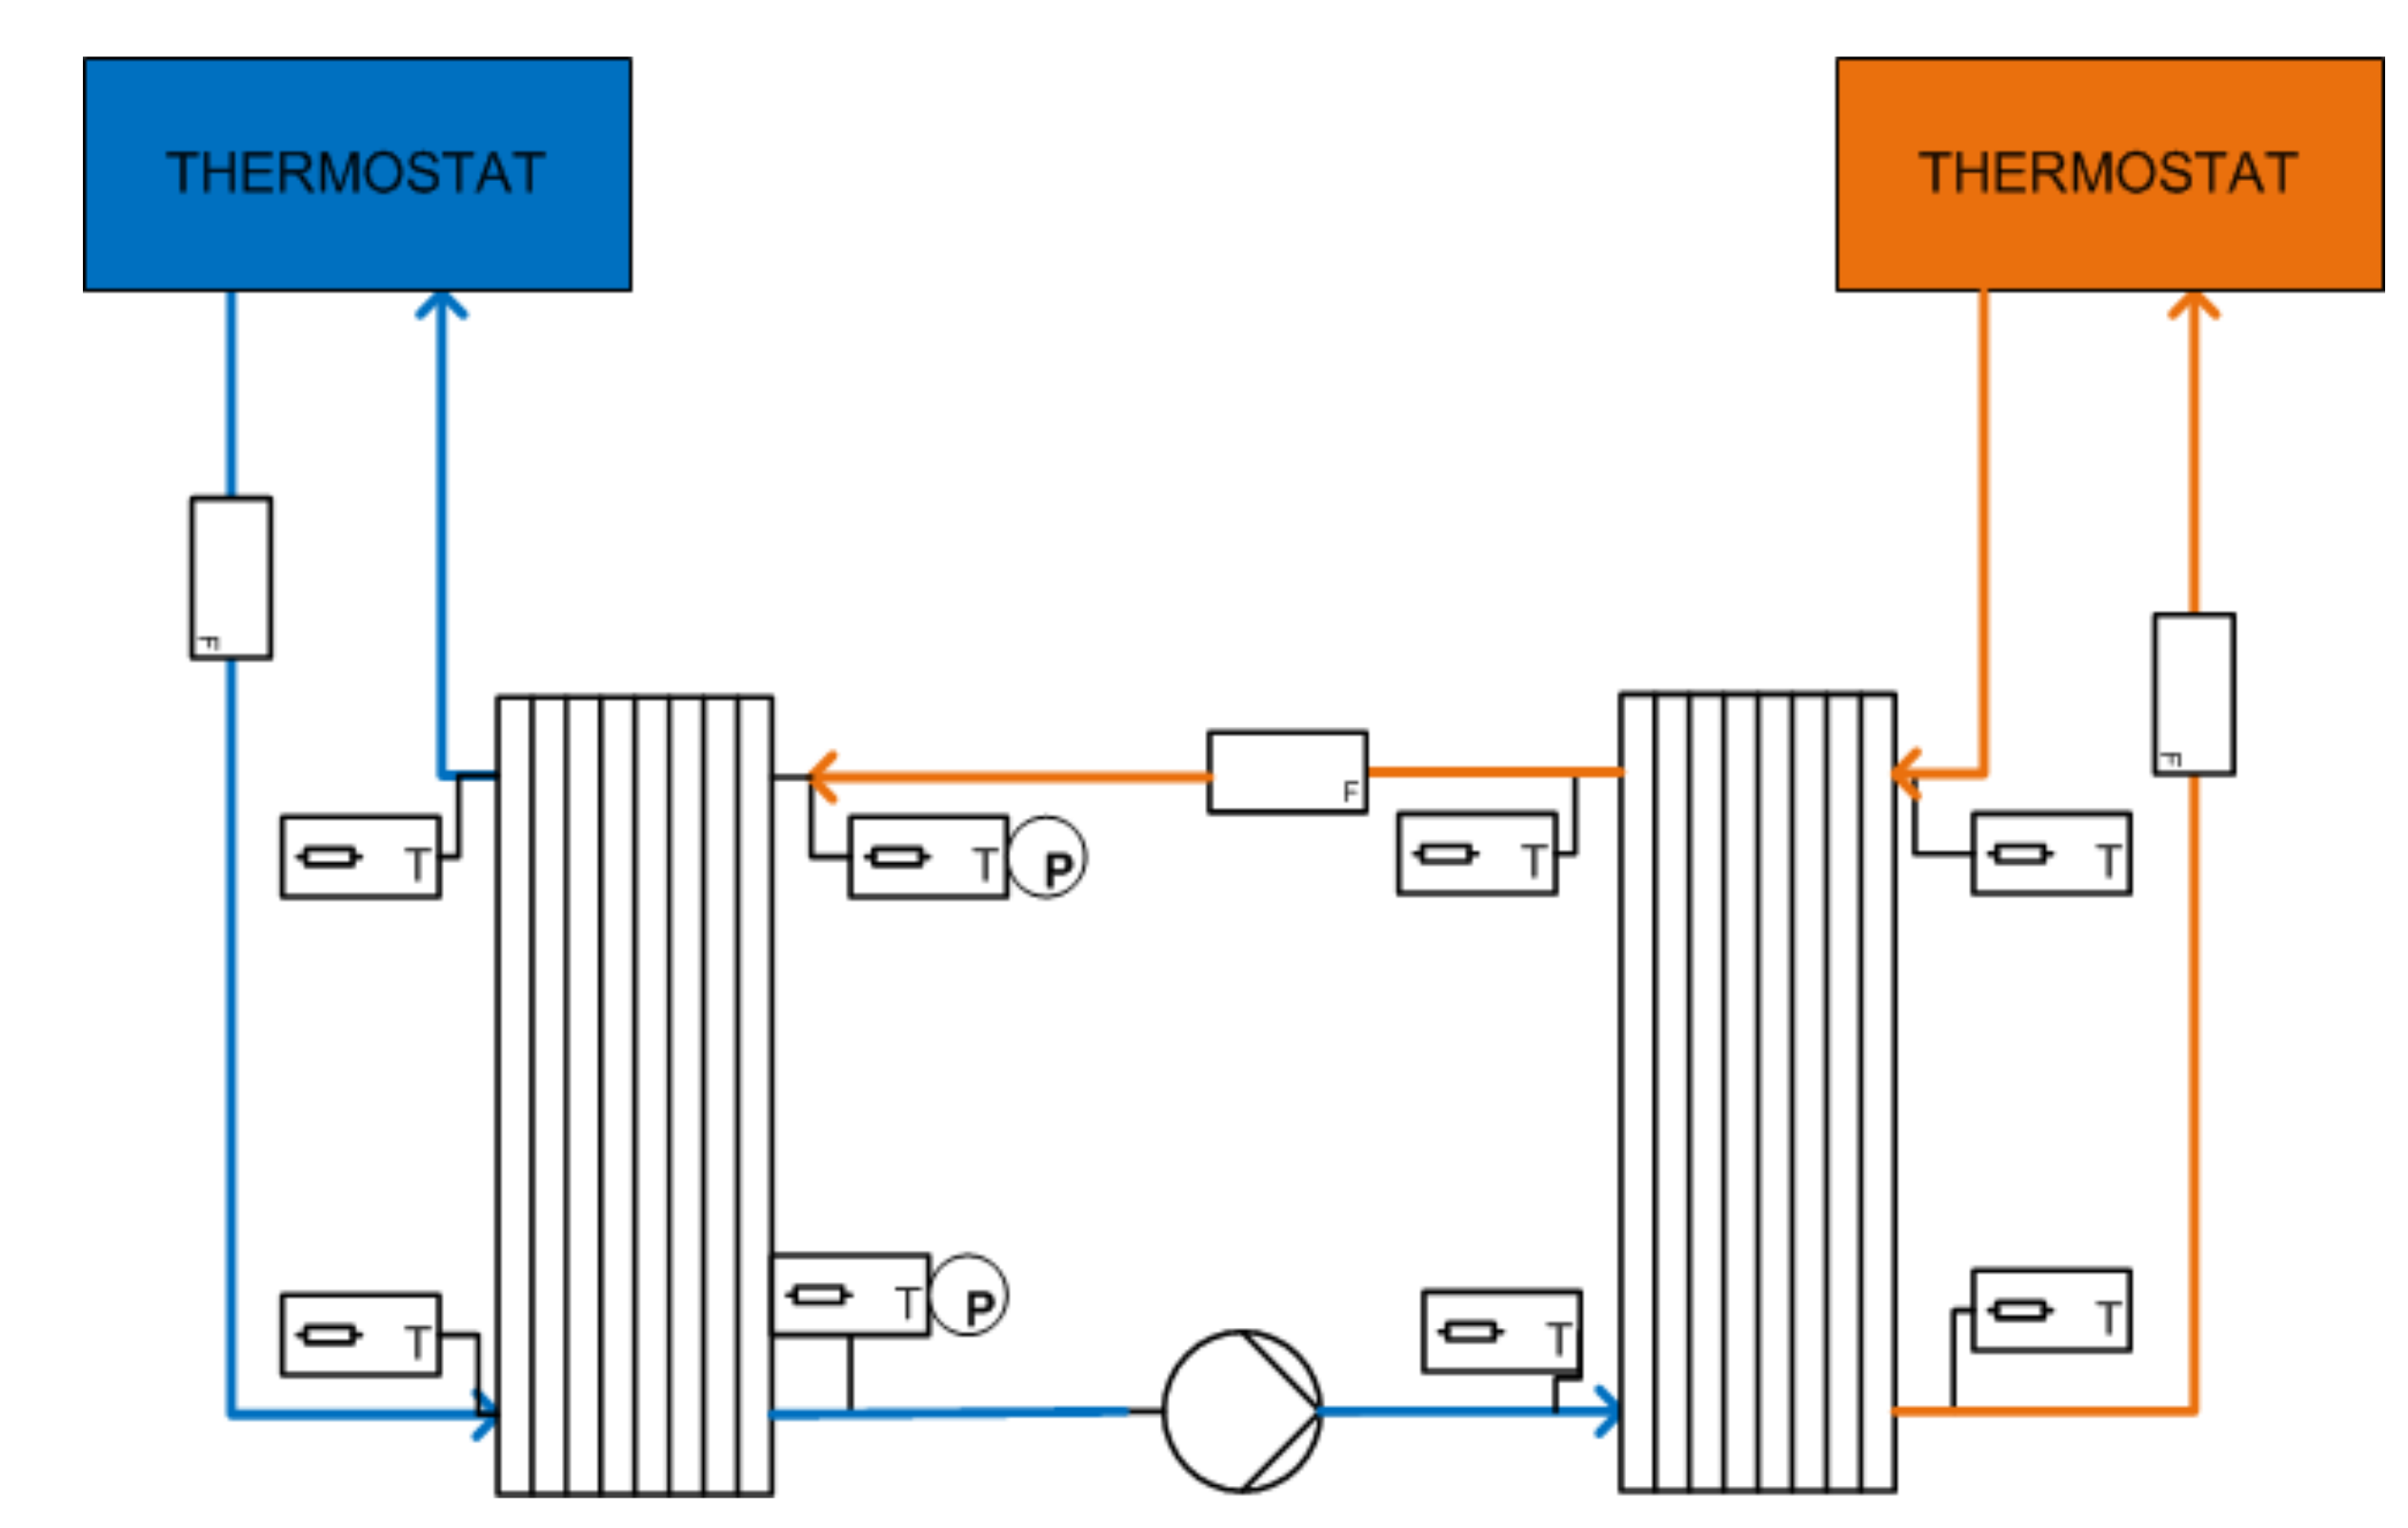
The device “ISE PCS” (Figure 27) is a phase change slurry cycling test rig to determine the stability of PCS while cycling through a hydraulic system in which the dispersed PCM is exposed to repeated phase transitions and shear stress caused by a pump and other hydraulic components. It consists of three hydraulic circuits: the PCS test circuit, a heating circuit, and a cooling circuit; the last two are connected to thermostats (Figure 28). The heat flux in these two circuits is recorded by measuring the volume flows and the temperature difference over the heat exchangers. In the PCS circuit, the volume flow and the temperatures over the heat exchangers are measured as well, so it is possible to monitor the heat flux into and out of the PCS. Additionally, the pressure difference over the cooling heat exchanger on the PCS side is recorded. Samples of PCS for analysis can be taken while the test facility is in operation.
To cycle PCS, the following temperature profile is typically applied: constant temperature at the output of the heating and cooling heat exchanger in the secondary circuit with temperature levels depending on the phase transition temperature range of the dispersed PCM. The cycle rate is determined by the volume of PCS filled into the secondary circuit and the volume flow applied. At 200 l∙h−1 volume flow, approximately 1300 cycles per day are carried out. During the experiments, the following data are measured: temperatures at the inlets and outlets of both heat exchangers in the primary and secondary circuits; volume flows in all three circuits; and pressure loss in the secondary circuit of the cooling heat exchanger. The detection of degradation is done on five different parameters: (a) heat flux into and out of the PCS, (b) pressure drop over the cooling heat exchanger, (c) particle size distribution, (d) enthalpy determination via DSC, and (e) viscosity measurement of samples taken.

Summary of Type C Tests

For this survey, one device for the investigation of the stability of PCS has been considered. Comparing the PCS test rig with the other stability testing devices of type A and type B, it can be observed that the PCS test rig applies the highest heating and cooling rates and the highest number of thermal cycles that are carried out per day to its samples. Such a fast melting and solidification of the sample is possible because PCS consist of PCM in comparably small volumes (emulsified or encapsulated) leading to a large heat transfer area and a relatively fast phase change between solid and liquid. Due to the special properties of PCS, the methods for investigating possible degradation processes also differ from those used for PCM and PCM with stable supercooling.

3. Experimental Techniques to Check a Possible Degradation of PCM

In this section, appropriate methods to check for a possible degradation of the PCM after testing under application conditions are introduced. These methods include an analysis of temperature–time curves (Section 3.1 and Section 3.2), calorimetric measurements and measurements of thermal energy content (Section 3.3, Section 3.5 and Section 3.6), mass change studies (Section 3.4 and Section 3.5), structural investigations (Section 3.7, Section 3.8, Section 3.9, Section 3.10) and tests dedicated to PCS (Section 3.11, Section 3.12, Section 3.13). The abbreviations of the methods used in Table 1 are indicated in parentheses in each subsection title. Information on the uncertainties of standard measuring instruments (e.g., DSC) is discussed in the respective publications on these measuring methods. Uncertainties of special methods that are not based on standard measurements (e.g., Section 3.1, Section 3.2, Section 3.6 and Section 3.7) have to be determined in each individual case and cannot be discussed adequately in the context of this paper.

3.1. Comparison of Temperature–Time Curves of Different Cycles (“T(t)cycles”)

The shape of temperature–time curves upon melting and solidification of a PCM indicate the temperature range of solid–liquid phase change. In addition, the degree of supercooling can be determined by evaluating the temperature–time curves upon cooling. The idea of comparing temperature–time curves of different cycles performed during a thermal cycling test measurement is based on the assumption that a possible degradation of the PCM will have an influence on its thermal properties and, hence, will affect the shape of temperature–time curves during the phase change.
In the case of stability tests on PCM utilizing stable supercooling (type B), temperature–time curves indicate if and when unwanted crystallization occurs.

3.2. Temperature Profile During Material Solidification (“T(t)solid”)

Knowing the heat loss coefficient of a vessel containing supercooled PCM in temperature equilibrium with the ambience, the heat content can be evaluated as the thermal energy dispersed to the ambience. This method was applied for stability tests on PCM utilizing stable supercooling (type B). If the heat content measured in successive storage cycles is reduced, degradation of the PCM may have occurred. A change in the plateau temperature during solidification can also indicate a degradation of the PCM.

3.3. Differential Scanning Calorimetry (“DSC”)

Differential scanning calorimetry (DSC) is a widely used technique to measure the melting temperature and melting enthalpy of PCM. With DSC measurements, enthalpy–temperature curves upon heating and cooling can be determined [48]. Due to the relatively small sample size (in the order of 5 to 20 mg), the degree of supercooling observed in DSC is increased compared with the behavior of PCM in larger quantities [49,50]. Therefore, the analysis of DSC heating curves is more favorable in the context of PCM stability testing: DSC measurements are applied to check if the melting temperature and enthalpy (or the enthalpy–temperature curves) after the testing under application conditions (e.g., thermal cycling tests) are the same as before the test.

3.4. Sample Mass Monitoring after Certain Number of Cycles or Time (“m(t)”)

A clear indication that a certain PCM undergoes some kind of degradation is the decrease of mass with time when it is either cycled or kept at constant temperature above the melting point [51]. Mass decrease can be due to vaporization and, hence, to material loss but also to the formation of volatile species due to the occurrence of chemical reactions so that the PCM composition changes. If mass loss is due to chemical reactions leading to volatile species, not only PCM thermal properties are expected to change but dangerous compounds can be evolved [8]. Note that if PCM is reacting with the surrounding gases (mainly water vapor or oxygen), its mass could increase as well. Therefore, if mass variation is observed for a PCM, the material cannot be implemented in any storage system unless measures are taken for avoiding such behavior (encapsulation, inert environment under pressure, etc.). Ensuring that PCM mass does not change over time under application conditions is a key issue for its validation. Simple experimental procedures such sample weighting after a certain number of cycles or time interval [51] can be designed for detecting the occurrence of possible PCM volatilization and/or degradation.

3.5. Thermogravimetric Analysis (“TGA”)

Another way to study PCM mass variation and possible degradation reactions is performing thermogravimetric analysis (TGA). TGA results can be compared with the results of sample mass monitoring to obtain more information about PCM stability. TGA is a technique that monitors the weight of a sample within a furnace to study the mass changes within a temperature range. This technique is suitable for different thermal analysis, such as decomposition temperature, oxidation, or loss of volatiles. A material sample of a few mg is placed inside the TGA apparatus usually exposed to air or nitrogen atmosphere, which is able to heat it at a controlled rate or maintain it at a defined temperature. The mass of the sample is recorded and can be plotted against temperature or time by means of a thermogravimetric curve (thermogram).
In the case of PCM, TGA can be used to determine its maximum working temperature, usually defined as the temperature at which the sample loosed 1.5 wt % of its initial mass or after the dehydration process, and also the final degradation temperature, which can be extracted from the thermogram. Moreover, if TGA measurements are performed at various heating rates, degradation kinetics could be obtained as well and hence an estimation of the PCM lifetime [52].

3.6. Comparison of the Thermal Energy Content in Repeated Storage Cycles (“Δhcycles”)

The thermal energy content of investigated samples determined for repeated storage cycles indicates cyclic material stability for applied test conditions (sample size, temperatures, cooling and heating rates). Observations can be analyzed regarding the initial storage cycle and/or in comparison with different material compositions (e.g., for the identification of the optimal amount of additives). Furthermore, the dependency of cyclic stability on the degree and the duration of PCM supercooling (type B) can be investigated. The thermal energy content of prototype storages including PCM, heat transfer fluid, and container material determined under typical application conditions is used to check the reliability of the investigated storage.

3.7. Visually (“vis.”)

In the case of solid–liquid PCM, a visual observation of possible phase separation is a useful and simple measure to detect a degradation of a PCM during experimental testing. The presence of solid material at a temperature where the PCM should be completely molten is a clear indication of phase separation. Thereby, a visual control of phase separation can be favorable compared to measured temperature–time curves. If the temperature sensor is not in thermal contact with the precipitated solid, the measured temperature–time curves may not be affected by the phase separation. Practically, a visual check of degradation can be carried out by taking pictures at given time intervals or temperature steps followed by an analysis of pictures from different thermal cycles. In addition, simply looking at the sample after the experimental investigations is a reliable measure to visually check degradation.
In the case of degradation tests performed on organic PCM at elevated temperatures, a visual check also includes a possible change in the PCM color. For example, a browning of sugar alcohols indicates a thermal degradation of the sample [53].

3.8. X-ray Powder Diffraction (“XRD”)

X-ray powder diffraction (XRD) is mainly employed for the phase identification of a crystalline material, which can be used to perform compound identification. Therefore, the material is finely ground, homogenized, and the average bulk composition is determined. Based on these features, XRD can be easily applied to determine changes in the crystalline structure or the formation of new materials of a solid PCM due to a degradation process.
XRD measurements are presented as a diffractogram, where the X-ray intensity is plotted as a function of the scanning angle. The typical aspect of a diffractogram consists of a horizontal baseline alternated with sharp peaks denoted as diffractions. These diffractions are used to identify the compounds present in the sample. If, e.g., due to a degradation on thermal cycling, new solid compounds appear in the solid PCM, they can be identified when comparing the diffractogram of the original sample with that of the degraded sample. Mass concentrations as low as 2% with respect to the sample mass can be detected.
A potential phase separation can also be investigated by extracting aliquots from different locations of the PCM sample submitted to thermal cycling and comparing their phase/compound compositions by XRD. Some XRD devices can perform measurements under different temperatures, giving the possibility to study the variations of the structure of the solid PCM upon heating or cooling.

3.9. Fourier Transform Infrared Spectroscopy (FT-IR)

Fourier transform infrared (FT-IR) spectroscopy is an analytical technique based on the vibrations of a molecule that is irradiated with infrared radiation at a specific wavelength range due to selective absorption of infrared radiation by the sample material. Since the wavelengths that are absorbed by the sample material are characteristic of its molecular structure, this technique allows identifying molecular components and structures of organic and inorganic materials.
FT-IR with attenuated total reflectance (ATR) allows analyzing the PCM chemical degradation caused by thermal cycling. The use of ATR has the advantage that the sample does not require any previous specific preparation to obtain the spectra. When the material is oxidized or degraded as a result of thermal cycling, a total or partial disappearance of the characteristic peaks and/or the appearance of new peaks are observed in the spectra.

3.10. Reflected Light Microscopy (RLM)

In the case of the “ISE capsules” test rig, reflected light microscopy (RLM) is used for repeated optical inspections of PCM macrocapsules. With RLM, possible damage of the capsules walls can be detected that would lead to leakage of the PCM out of the capsules.

3.11. Pressure Loss of Cooling Heat Exchanger (ΔpHX)

Measuring the pressure loss of a cooling heat exchanger is a method that is appropriate for the stability testing of PCS. An unstable PCS (e.g., damaged microcapsules) releases PCM material, which crystallizes at the heat exchanger surface when cooling below the crystallization temperature. PCM crystallizing at the heat exchanger surface increases the pressure drop over the heat exchanger. Therefore, this technique is a proper inline detection for a possible degradation of a PCS.

3.12. Particle Size Analysis (PSA)

PCS show a change in particle size distribution when they degrade. Particle size measurement can be done inline or with separate devices (e.g., laser diffractometer). Using separate devices, samples have to be taken while the material is in a degradation process (e.g., conveyed in a hydraulic loop).

3.13. Viscosity Measurement (μ)

Viscosity measurements can be used to detect the degradation of PCS. A change in particle size is usually connected to a change in viscosity. However, even if there is no change in particle size, a reduction of the PCM fraction can occur due to separation in hydraulic systems. Such a separation leads to lower viscosity.

4. Conclusions

The present survey is based on 18 experimental devices to investigate the long-term stability of solid–liquid PCM. The experiments are divided into thermal cycling stability tests, tests on PCM with stable supercooling, and tests on the stability of phase change slurries (PCS).
Comparing the technical specifications and the applied test conditions, a large variety can be observed among the mostly self-built test rigs. Most of the devices are being used to perform thermal cycling stability tests. Depending on the type of PCM to be investigated and the intended application, different testing conditions are chosen, such as temperature range of investigation, heating and cooling rates to perform thermal cycles, sample container materials, and the atmosphere that the PCM sample is in contact with. Sample sizes in the order of few milliliters allow for the quick screening of properties, whereas samples of several hundred milliliters and more allow evaluating the material’s behavior without the enhanced supercooling typically observed in measurements on small samples. The chosen speed of PCM cycling depends on several boundary conditions, such as the sample size under investigation. Typically, the larger the sample, the slower the cycling. Relatively slow cycling of larger samples is often done in order to study the thermal cycling behavior of PCM under application conditions with few cycles per day to be carried out. So far, there is no consensus on how to accelerate stability tests of PCM reasonably.
While several test rigs are designed to investigate different types of PCM for different applications, tests on PCM with stable supercooling are dedicated—but not limited—to SAT. Applied temperatures (charging, discharging, and ambient) as well as the degree and the duration of supercooling should be in accordance to the conditions of the aimed application.
In addition to the solid–liquid phase transition, tests on PCS investigate the mechanical stability of capsules or emulsions during pumping the PCS.
Overall, the comparison of experimental devices can be an encouragement to discuss and develop uniform standards of PCM stability testing. The fact that many further devices are being used in other research groups strengthens this. A possible goal for future work in this context could be to propose a guideline for long-term stability investigations or to further develop existing testing regulations, e.g., the regulations from the “RAL Quality Association PCM”. Investigating the stability of PCM under application conditions requires, first, knowledge about the application and, second, a method to translate the application requirements into experimental testing conditions. Thereby, the second step influences the technical design of testing devices and applied testing procedures. It is especially this “translation” that is nowadays being done in a highly non-standardized manner. Further work toward a standardization of PCM stability testing is recommended.

Author Contributions

Conceptualization, C.R., S.H. (Stefan Hiebler), R.B., L.F.C., G.Z., G.E., M.D., G.D., O.F., R.R., D.G., S.G., S.H. (Stephan Höhlein), A.K.-H. and L.Z.; Funding acquisition, C.R., S.H. (Stefan Hiebler), R.B., L.F.C., G.Z., G.E., M.D., G.D., O.F., R.R., D.G., S.G., S.H. (Stephan Höhlein), A.K.-H. and L.Z.; Investigation, C.R., S.H. (Stefan Hiebler), R.B., L.F.C., G.Z., G.E., M.D., G.D., O.F., R.R., D.G., A.C.K., S.G., S.H. (Stephan Höhlein), A.K.-H., N.B. and L.Z.; Methodology, C.R., S.H. (Stefan Hiebler), R.B., L.F.C., G.Z., G.E., M.D., G.D., O.F., R.R., D.G., S.G., S.H. (Stephan Höhlein), A.K.-H. and L.Z.; Writing—original draft, C.R.; Writing—review and editing, C.R., S.H. (Stefan Hiebler), R.B., L.F.C., G.Z., G.E., M.D., G.D., O.F., R.R., D.G., S.G., S.H. (Stephan Höhlein), A.K.-H. and L.Z. All authors have read and agreed to the published version of the manuscript.

Funding

This survey has been carried out within the framework of IEA ES Annex 33/SHC Task 58 “Material and Component Development for Compact Thermal Energy Storage”, a joint working group of the “Energy Storage” (ES) and the “Solar Heating and Cooling” (SHC) Technology Collaboration Programmes of the International Energy Agency (IEA). The responsibility for the content of this publication is with the authors. The work of ZAE Bayern is part of the project properPCM and was supported by the German Federal Ministry of Economic Affairs and Energy under the project code 03ET1342A. The work of CIEMAT is part of two projects: ACES2030 (S2018/EM-4319) which is supported by Comunidad de Madrid and European Structural Funds through and SFERA III (GA No 823802) which is supported by European Union’s Horizon H2020 Research and Innovation Programme. The work of DTU was supported by HM Heizkörper GmbH and the Danish Energy Agency through the EUDP program. The work of EHU is part of the project Sweet-TES (RTI2018-099557-B-C22), funded by the Spanish Ministry of Science, Innovation and Universities. The work of GREiA was partially funded by the Ministerio de Ciencia, Innovación y Universidades de España (RTI2018-093849-B-C31—MCIU/AEI/FEDER, UE) and by the Ministerio de Ciencia, Innovación y Universidades—Agencia Estatal de Investigación (AEI) (RED2018-102431-T). The authors would like to thank the Catalan Government for the quality accreditation given to their research group (GREiA 2017 SGR 1537). GREiA is certified agent TECNIO in the category of technology developers from the Government of Catalonia. This work is partially supported by ICREA under the ICREA Academia programme. The work of HSLU was partially funded by the Swiss Competence Centre for Energy Research on Heat and Electricity (SCCER HaE). The authors would like to thank the SCCER HaE as well as METTLER TOLEDO AG for the support given. The work of Fraunhofer ISE was part of the projects KOLAN (FKZ 03ESP357B) and KOKAP (FKZ 03ET1463A) which were administrated by the Projektträger Jülich (PtJ) and funded by the German Federal Ministry of Economic Affairs and Energy. The work of LAMTE was supported by Intel Corporation, along with the Natural Sciences and Engineering Research Council of Canada (NSERC) and the Canada Foundation for Innovation. The work of LGCgE is partly funded by the French National Research Agency (ANR) under the project "Hybrid storage and heat exchanger device with PCM—EUROPA". Noé Beaupere’s PhD work was funded by the French Alternative Energies and Atomic Energy Commission (CEA) Grenoble. The work of LTTT is part of the project MALATrans and was funded by the German Federal Ministry for Economic Affairs and Energy (BMWi) under the project code 03ESP227B.

Conflicts of Interest

The authors declare no conflict of interest. The funders had no role in the design of the study; in the collection, analyses, or interpretation of data; in the writing of the manuscript, or in the decision to publish the results.

Nomenclature

DSCDifferential scanning calorimetry
FT-IRFourier transform infrared spectroscopy
HTFHeat transfer fluid
PCMPhase change material
PCSPhase change slurry
PMMAPoly (methyl methacrylate)
PSAParticle size analysis
RLMReflected light microscope
SATSodium acetate trihydrate
TESThermal energy storage
TGAThermogravimetric analysis
TCMThermochemical material
XRDX-ray diffraction spectroscopy
hSpecific enthalpy/J∙g−1
mMass/kg
μViscosity/Pa∙s
TTemperature/°C
tTime/s

References

  1. Mehling, H.; Cabeza, L.F. Heat and Cold Storage with PCM; Springer: Berlin, Germany, 2008. [Google Scholar]
  2. Zalba, B.; Marın, J.M.; Cabeza, L.F.; Mehling, H. Review on thermal energy storage with phase change: Materials, heat transfer analysis and applications. Appl. Therm. Eng. 2003, 23, 251–283. [Google Scholar]
  3. Cabeza, L.F.; Castell, A.; Barreneche, C.D.; De Gracia, A.; Fernández, A.I. Materials used as PCM in thermal energy storage in buildings: A review. Renew. Sustain. Energy Rev. 2011, 15, 1675–1695. [Google Scholar]
  4. Zsembinszki, G.; Fernández, A.G.; Cabeza, L.F. Selection of the Appropriate Phase Change Material for Two Innovative Compact Energy Storage Systems in Residential Buildings. Appl. Sci. 2020, 10, 2116. [Google Scholar]
  5. IEA ES Annex 33/SHC Task 58 “Material and Component Development for Compact Thermal Energy Storage”. Available online: https://task58.iea-shc.org/ (accessed on 17 August 2020).
  6. Ferrer, G.; Solé, A.; Barreneche, C.; Martorell, I.; Cabeza, L.F. Review on the methodology used in thermal stability characterization of phase change materials. Renew. Sustain. Energy Rev. 2015, 50, 665–685. [Google Scholar]
  7. Rathgeber, C.; Grisval, A.; Schmit, H.; Hoock, P.; Hiebler, S. Concentration dependent melting enthalpy, crystallization velocity, and thermal cycling stability of pinacone hexahydrate. Thermochim. Acta 2018, 670, 142–147. [Google Scholar]
  8. Bayón, R.; Rojas, E. Development of a new methodology for validating thermal storage media: Application to phase change materials. Int. J. Energy Res. 2019, 43, 6521–6541. [Google Scholar]
  9. RAL Quality Association PCM. Quality and Testing Specifications for Phase Change Materials. 2018. Available online: http://www.pcm-ral.org/pcm/en/quality-testing-specifications-pcm/ (accessed on 17 August 2020).
  10. Englmair, G.; Jiang, Y.; Dannemand, M.; Moser, C.; Schranzhofer, H.; Furbo, S.; Fan, J. Crystallization by local cooling of supercooled sodium acetate trihydrate composites for long-term heat storage. Energy Build. 2018, 180, 159–171. [Google Scholar]
  11. Desgrosseilliers, L. Design and Evaluation of a Modular, Supercooling Phase Change Heat Storage Device for Indoor Heating. Ph.D. Thesis, Dalhousie University, Halifax, NS, Canada, 2016. Available online: https://dalspace.library.dal.ca/handle/10222/73309 (accessed on 17 August 2020).
  12. Englmair, G.; Moser, C.; Furbo, S.; Dannemand, M.; Fan, J. Design and functionality of a segmented heat-storage prototype utilizing stable supercooling of sodium acetate trihydrate in a solar heating system. Appl. Energy 2018, 221, 522–534. [Google Scholar]
  13. Englmair, G.; Kong, W.; Berg, J.B.; Furbo, S.; Fan, J. Demonstration of a solar combi-system utilizing stable supercooling of sodium acetate trihydrate for heat storage. Appl. Therm. Eng. 2020, 166, 114647. [Google Scholar]
  14. Englmair, G.; Moser, C.; Schranzhofer, H.; Fan, J.; Furbo, S. A solar combi-system utilizing stable supercooling of sodium acetate trihydrate for heat storage: Numerical performance investigation. Appl. Energy 2019, 242, 1108–1120. [Google Scholar]
  15. Duquesne, M.; Del Barrio, E.P.; Godin, A. Nucleation triggering of highly undercooled Xylitol using an air lift reactor for seasonal thermal energy storage. Appl. Sci. 2019, 9, 267. [Google Scholar]
  16. Puupponen, S.; Mikkola, V.; Ala-Nissila, T.; Seppälä, A. Novel microstructured polyol-polystyrene composites for seasonal heat storage. Appl. Energy 2016, 172, 96–106. [Google Scholar]
  17. Rathod, M.K.; Banerjee, J. Thermal stability of phase change materials used in latent heat energy storage systems: A review. Renew. Sustain. Energy Rev. 2013, 18, 246–258. [Google Scholar]
  18. Bayón, R.; Biencinto, M.; Rojas, E.; Uranga, N. Study of hybrid dry cooling systems for STE plants based on latent storage. In Proceedings of the ISEC Conference, Graz, Austria, 3–5 October 2018. [Google Scholar]
  19. Rodríguez-García, M.M.; Rojas, E.; Bayón, R. Test campaign and performance evaluation of a spiral latent storage module with Hitec® as PCM. In Proceedings of the SWC 2017/SHC2017 Conference, Abu Dhabi, UAE, 29 October–2 November 2017. [Google Scholar]
  20. Rodríguez-García, M.M.; Bayón, R.; Rojas, E. Stability of D-mannitol upon melting/freezing cycles under controlled inert atmosphere. Energy Procedia 2016, 91, 218–225. [Google Scholar]
  21. Biedenbach, M.; Klünder, F.; Gschwander, S. Investigations on the stability of metallic cans for PCM macro-encapsulation. In Proceedings of the International Institute of Refrigeration (IIR), Birmingham, AL, USA, 2–5 September 2018. [Google Scholar]
  22. Kahwaji, S.; Johnson, M.B.; Kheirabadi, A.C.; Groulx, D.; White, M.A. Stable, low-cost phase change material for building applications: The eutectic mixture of decanoic acid and tetradecanoic acid. Appl. Energy 2016, 168, 457–464. [Google Scholar]
  23. Kheirabadi, A.C.; Groulx, D. Design of an automated thermal cycler for long-term phase change material phase transition stability studies. In Proceedings of the COMSOL Conference 2014, Boston, MA, USA, 8–10 October 2014. [Google Scholar]
  24. Kahwaji, S.; Johnson, M.B.; Kheirabadi, A.C.; Groulx, D.; White, M.A. Fatty acids and related phase change materials for reliable thermal energy storage at moderate temperatures. Sol. Energy Mater. Sol. Cells 2017, 167, 109–120. [Google Scholar]
  25. Kahwaji, S.; Johnson, M.B.; Kheirabadi, A.C.; Groulx, D.; White, M.A. A comprehensive study of properties of paraffin phase change materials for solar thermal energy storage and thermal management applications. Energy 2018, 162, 1169–1182. [Google Scholar]
  26. Beaupere, N. Pilotage de la Libération de Chaleur et Etude du Vieillissement de Matériaux à Changement de Phase. Ph.D. Thesis, Université d’Artois/CEA Grenoble, Grenoble, France, 2019. [Google Scholar]
  27. Orak, F.; König-Haagen, A.; Brüggemann, D. Effect of Nucleators on Heat Storage Properties of Salt Hydrates. In Proceedings of the 2017 11th International Renewable Energy Storage Conference (IRES 2017), Düsseldorf, Germany, 14–16 March 2017. [Google Scholar]
  28. Navarro, L.; Solé, A.; Martín, M.; Barreneche, C.; Olivieri, L.; Tenorio, J.A.; Cabeza, L.F. Benchmarking of useful phase change materials for a building application. Energy Build. 2019, 182, 45–50. [Google Scholar]
  29. Oró, E.; Gil, A.; Miró, L.; Peiró, G.; Álvarez, S.; Cabeza, L.F. Thermal energy storage implementation using phase change materials for solar cooling and refrigeration applications. Energy Procedia 2012, 30, 947–956. [Google Scholar]
  30. Gil, A.; Oró, E.; Castell, A.; Cabeza, L.F. Experimental analysis of the effectiveness of a high temperature thermal storage tank for solar cooling applications. Appl. Therm. Eng. 2013, 54, 521–527. [Google Scholar]
  31. Gil, A.; Oró, E.; Miró, L.; Peiró, G.; Ruiz, A.; Salmerón, J.M.; Cabeza, L.F. Experimental analysis of hydroquinone used as phase change material (PCM) to be applied in solar cooling refrigeration. Int. J. Refrig. 2014, 39, 95–103. [Google Scholar] [CrossRef]
  32. Peiró, G.; Gasia, J.; Miró, L.; Cabeza, L.F. Experimental evaluation at pilot plant scale of multiple PCMs (cascaded) vs. single PCM configuration for thermal energy storage. Renew. Energy 2015, 83, 729–736. [Google Scholar] [CrossRef] [Green Version]
  33. Prieto, C.; Miró, L.; Peiró, G.; Oró, E.; Gil, A.; Cabeza, L.F. Temperature distribution and heat losses in molten salts tanks for CSP plants. Sol. Energy 2016, 135, 518–526. [Google Scholar] [CrossRef] [Green Version]
  34. Peiró, G.; Gasia, J.; Miró, L.; Prieto, C.; Cabeza, L.F. Experimental analysis of charging and discharging processes, with parallel and counter flow arrangements, in a molten salts high temperature pilot plant scale setup. Appl. Energy 2016, 178, 394–403. [Google Scholar] [CrossRef] [Green Version]
  35. Gasia, J.; de Gracia, A.; Peiró, G.; Arena, S.; Cau, G.; Cabeza, L.F. Use of partial load operating conditions for latent thermal energy storage management. Appl. Energy 2018, 216, 234–242. [Google Scholar] [CrossRef] [Green Version]
  36. Peiró, G.; Prieto, C.; Gasia, J.; Jové, A.; Miró, L.; Cabeza, L.F. Two-tank molten salts thermal energy storage system for solar power plants at pilot plant scale: Lessons learnt and recommendations for its design, start-up and operation. Renew. Energy 2018, 121, 236–248. [Google Scholar] [CrossRef]
  37. Gil, A.; Peiró, G.; Oró, E.; Cabeza, L.F. Experimental analysis of the effective thermal conductivity enhancement of PCM using finned tubes in high temperature bulk tanks. Appl. Therm. Eng. 2018, 142, 736–744. [Google Scholar] [CrossRef]
  38. Gasia, J.; de Gracia, A.; Zsembinszki, G.; Cabeza, L.F. Influence of the storage period between charge and discharge in a latent heat thermal energy storage system working under partial load operating conditions. Appl. Energy 2019, 235, 1389–1399. [Google Scholar] [CrossRef]
  39. Mselle, B.D.; Verez, D.; Zsembinszki, G.; Borri, E.; Cabeza, L.F. Performance Study of Direct Integration of Phase Change Material into an Innovative Evaporator of a Simple Vapour Compression System. Appl. Sci. 2020, 10, 4649. [Google Scholar] [CrossRef]
  40. Dannemand, M.; Dragsted, J.; Fan, J.; Johansen, J.B.; Kong, W.; Furbo, S. Experimental investigations on prototype heat storage units utilizing stable supercooling of sodium acetate trihydrate mixtures. Appl. Energy 2016, 169, 72–80. [Google Scholar] [CrossRef] [Green Version]
  41. Dannemand, M.; Johansen, J.B.; Kong, W.; Furbo, S. Experimental investigations on cylindrical latent heat storage units with sodium acetate trihydrate composites utilizing supercooling. Appl. Energy 2016, 177, 591–601. [Google Scholar] [CrossRef] [Green Version]
  42. Englmair, G.; Furbo, S.; Dannemand, M.; Fan, J. Experimental investigation of a tank-in-tank heat storage unit utilizing stable supercooling of sodium acetate trihydrate. Appl. Therm. Eng. 2020, 167, 114709. [Google Scholar] [CrossRef]
  43. Kong, W.; Dannemand, M.; Johansen, J.B.; Fan, J.; Dragsted, J.; Englmair, G.; Furbo, S. Experimental investigations on heat content of supercooled sodium acetate trihydrate by a simple heat loss method. Sol. Energy 2016, 139, 249–257. [Google Scholar] [CrossRef] [Green Version]
  44. Dannemand, M.; Furbo, S. Supercooling stability of sodium acetate trihydrate composites in multiple heat storage units. Refrig. Sci. Technol. 2018, 227–231. [Google Scholar] [CrossRef]
  45. Niedermaier, S.; Biedenbach, M.; Gschwander, S. Characterisation and enhancement of phase change slurries. Energy Procedia 2016, 99, 64–71. [Google Scholar] [CrossRef] [Green Version]
  46. Peiró, G. High Temperature Thermal Energy Storage for Solar Cooling and Solar Thermal Power Plants Applications. Ph.D. Thesis, University of Lleida, Lleida, Spain, 2017. Available online: http://hdl.handle.net/10803/462071 (accessed on 17 August 2020).
  47. Deng, J.; Furbo, S.; Kong, W.; Fan, J. Thermal performance assessment and improvement of a solar domestic hot water tank with PCM in the mantle. Energy Build. 2018, 172, 10–21. [Google Scholar] [CrossRef]
  48. Gschwander, S.; Haussmann, T.; Hagelstein, G.; Barreneche, C.; Ferrer, G.; Cabeza, L.; Diarce, G.; Hohenauer, W.; Lager, D.; Rathgeber, C.; et al. Standardization of pcm characterization via DSC. Refrig. Sci. Technol. 2016, 70–75. [Google Scholar] [CrossRef]
  49. Rathgeber, C.; Schmit, H.; Miró, L.; Cabeza, L.F.; Gutierrez, A.; Ushak, S.N.; Hiebler, S. Enthalpy-temperature plots to compare calorimetric measurements of phase change materials at different sample scales. J. Storage Mater. 2018, 15, 32–38. [Google Scholar] [CrossRef] [Green Version]
  50. Rathgeber, C.; Miró, L.; Cabeza, L.F.; Hiebler, S. Measurement of enthalpy curves of phase change materials via DSC and T-History: When are both methods needed to estimate the behaviour of the bulk material in applications? Thermochim. Acta 2014, 596, 79–88. [Google Scholar] [CrossRef]
  51. Bayón, R.; Rojas, R. Feasibility study of D-mannitol as phase change material for thermal storage. AIMS Energy 2017, 5, 404–424. [Google Scholar] [CrossRef]
  52. Doyle, C.D. Estimating isothermal life from thermogravimetric data. J. Appl. Polym. Sci. 1962, 6, 639–642. [Google Scholar] [CrossRef]
  53. Solé, A.; Neumann, H.; Niedermaier, S.; Martorell, I.; Schossig, P.; Cabeza, L.F. Stability of sugar alcohols as PCM for thermal energy storage. Sol. Energy Mater. Sol. Cells 2014, 126, 125–134. [Google Scholar] [CrossRef]
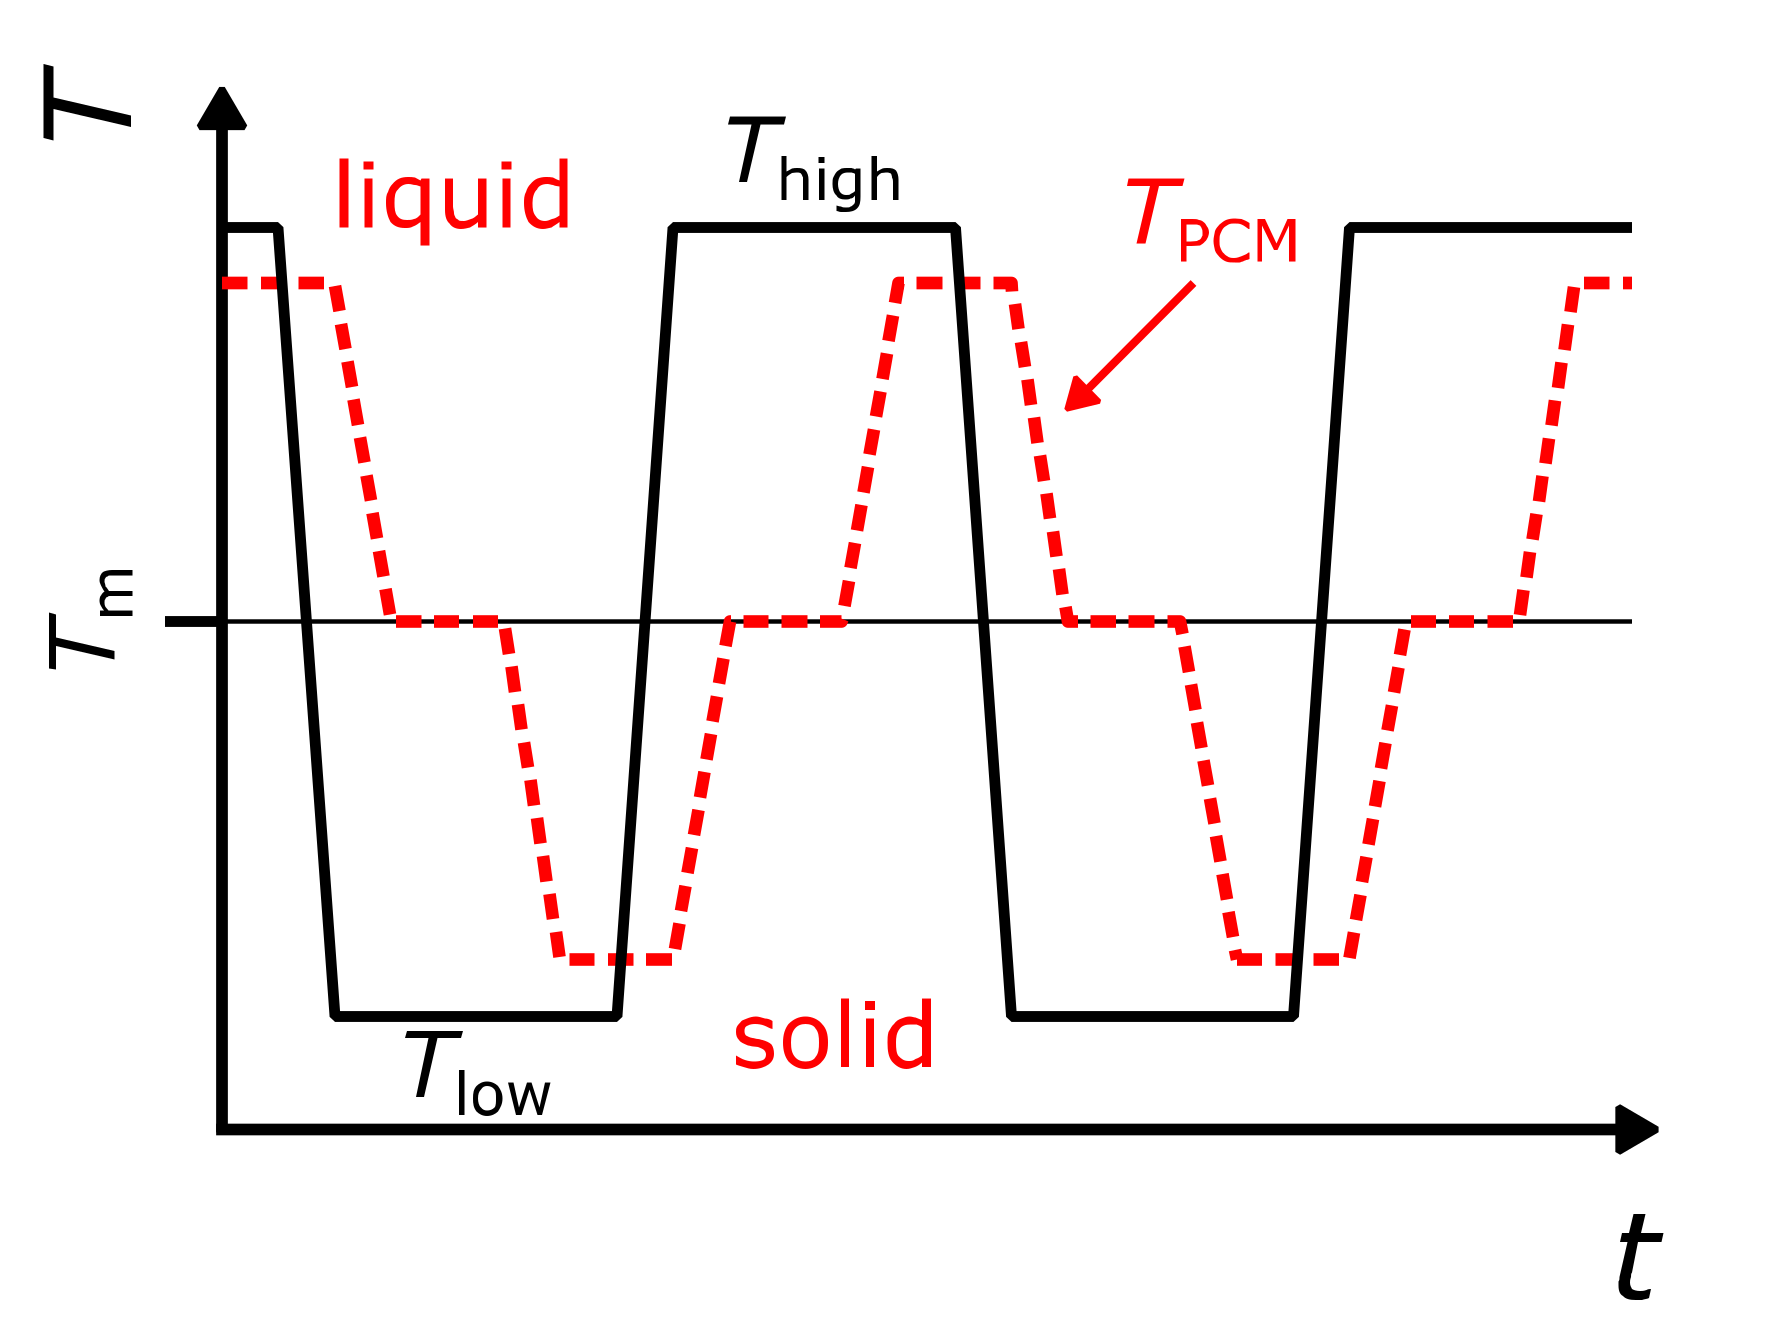
Figure 1. Idealized temperature–time curves of a thermal cycling stability experiment of a solid–liquid phase change material (PCM); PCM temperature (red dashed line); and heat transfer medium temperature (black solid line).
Applsci 10 07968 g001
Figure 2. Setup outside (a) and oven inside (b) of the device “CIEMAT I”.
Applsci 10 07968 g002
Figure 3. Setup outside (a) and oven inside (b) of the device “CIEMAT II”.
Applsci 10 07968 g003
Figure 4. Setup outside and furnace (a) and setup inside (b) of the device “CIEMAT III”.
Applsci 10 07968 g004
Figure 5. Pictures of stability testing device “EHU”; thermostatic bath (a), glass tube and cap (b), thermally cycled samples (c).
Applsci 10 07968 g005
Figure 6. Picture of stability testing device “HSLU”.
Applsci 10 07968 g006
Figure 7. Sample containers of the stability testing device “HSLU” (a), reaction calorimetry unit (b).
Applsci 10 07968 g007
Figure 8. Typical temperature profiles of the stability testing device “HSLU” (fixed heating and cooling rate (a), constant temperature difference upon heating and fixed cooling rate (b)); jacket temperature Tj, and reaction temperature Tr.
Applsci 10 07968 g008
Figure 9. Schematic of stability testing device “ISE capsules”.
Applsci 10 07968 g009
Figure 10. Peltier test rig.
Applsci 10 07968 g010
Figure 11. (a) Schematic diagram showing the various components of the thermal cycler general assembly, (b) photograph of the actual experimental setup, and (c) photograph of the housing unit with the heating and cooling elements and vials containing PCM (reproduced with permission from [22], Elsevier, 2016).
Applsci 10 07968 g011
Figure 12. Typical temperature–time profile of stability testing device “LAMTE”.
Applsci 10 07968 g012
Figure 13. Fluxmetric bench “LGCgE” (a), parallelepipedal poly (methyl methacrylate) (PMMA) sample containing PCM with the lateral heat fluxmeters before installation in the insulation (b).
Applsci 10 07968 g013
Figure 14. Ramps of temperature and heat fluxes measurements during thermal cycling of sodium acetate trihydrate (SAT).
Applsci 10 07968 g014
Figure 15. View of the stability testing device “LTTT” (a) and detailed view of the arrangement of the sample holders (b).
Applsci 10 07968 g015
Figure 16. Picture of stability testing device “UDL-GREiA I”.
Applsci 10 07968 g016
Figure 17. (a) Picture and (b) scheme of stability testing device “UDL-GREiA II” (reproduced with permission from [46], University of Lleida, 2017). The letters in the figure (a) correspond to: (a) electrical heater, (b) air–heat transfer fluid (HTF) heat exchanger, (c) hot tank, (d) cold tank, (e) plate heat exchanger HTF–molten salt, (f) HTF loop, (g) molten salt, (h) acquisition and recording system, (i) latent thermal energy storage system, and (j) sensible thermal energy storage system.
Applsci 10 07968 g017
Figure 18. Picture (a) and scheme (b) of test facility “UDL-GREiA III”.
Applsci 10 07968 g018
Figure 19. Pictures of stability testing device “ZAE”.
Applsci 10 07968 g019
Figure 20. Temperature–time curves measured with the stability testing device “ZAE”.
Applsci 10 07968 g020
Figure 21. Visual observation of phase separation of a solid–liquid PCM in the device “ZAE”.
Applsci 10 07968 g021
Figure 22. Testing device “DTU full scale”: PCM heat storage test facility at DTU (a), schematic of charge and discharge loop (b).
Applsci 10 07968 g022
Figure 23. Temperature profile of a test cycle with supercooling of PCM (device “DTU full scale”).
Applsci 10 07968 g023
Figure 24. (a) Glass jar with lid, (b) the well-insulated box, (c) locations of temperature sensors (“DTU heat loss method”).
Applsci 10 07968 g024
Figure 25. Exemplary cooling process of PCM samples in the device “DTU heat loss method”.
Applsci 10 07968 g025
Figure 26. Testing device “DTU multiple storage”: PCM heat storage test facility at DTU (a), schematic of charge and discharge loop (b).
Applsci 10 07968 g026
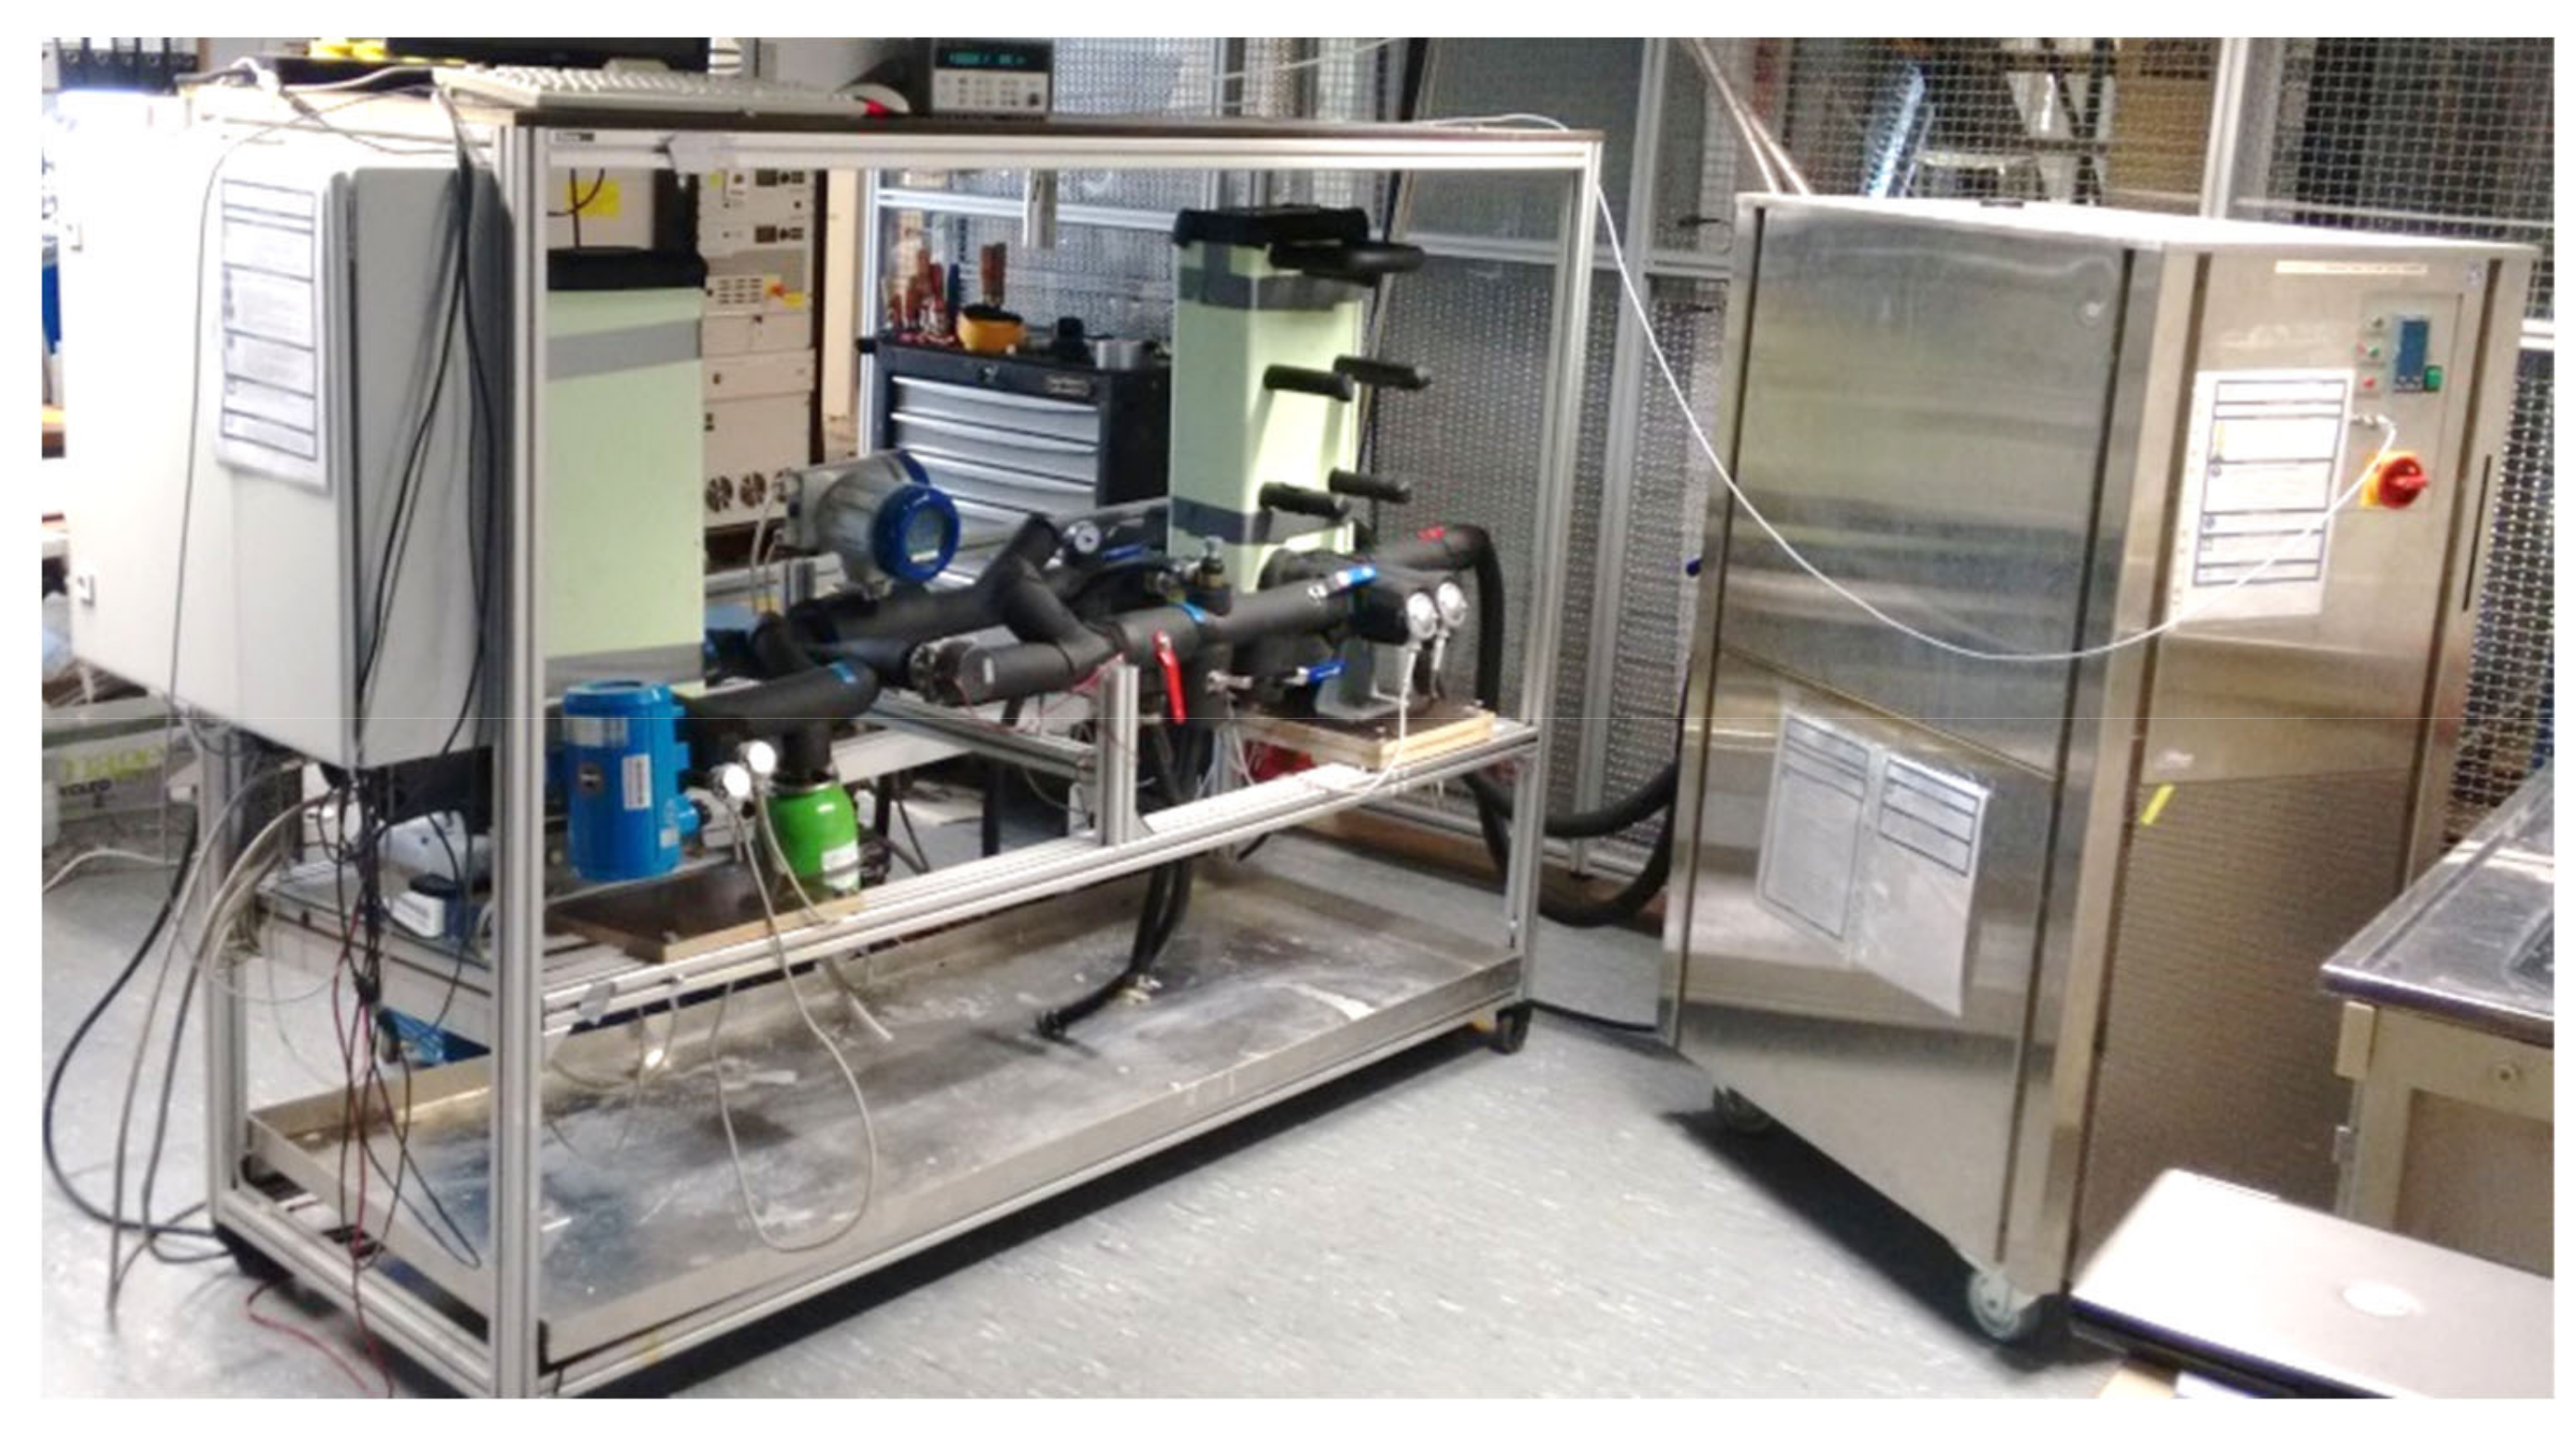
Figure 27. Picture of stability testing device “ISE PCS”.
Applsci 10 07968 g027
Figure 28. Schematic of stability testing device “ISE PCS”.
Applsci 10 07968 g028
Table 1. Specifications of testing devices (device types A–C explained in Section 2.1). Explanations of columns: typical size (range) of the investigated sample; temperature range of measurements ΔT; heating and cooling rates between isothermal segments; typical number of melting–solidification cycles per day; atmosphere the PCM sample is in contact with; abbreviations used for stability tests: T(t)cycles = comparison of temperature–time curves of different cycles, m(t) = sample mass monitoring after certain number of cycles or time, vis. = visually, Δhcycles = comparison of the thermal energy content in repeated storage cycles, T(t)solid. = temperature profile during material solidification, ΔpHX = pressure loss of cooling heat exchanger, µ = viscosity measurement, further abbreviations in nomenclature; material of sample container.
Device Name (Type)Sample SizeΔT/°CHeating, Cooling Rate/K∙min−1Cycles Per DayAtmosphereStability TestsSample ContainerRef.
CIEMAT I (A)60–100 mLRT 1–3501–20 1airT(t)cycles, DSC, m(t)glass, ceramic[18,19]
CIEMAT II (A)10 mLRT–5001–20, natural1airT(t)cycles, DSC, m(t)ceramic[18,19]
CIEMAT III (A)60 mLRT–5001–20, natural1air, N2, ArT(t)cycles, DSC, m(t)ceramic[20]
EHU (A)5 g−45–200 variablevariableair, N2, ArDSC, vis., XRD, FTIRglass, metal-
HSLU (A)1 × 100 mL, 3 × 25 mL, 5 × 8 mL−40–180 10; 0.510airT(t)cycles, DSC, vis.glass-
ISE capsules (A)<22 L 3−10–801; 110air DSC, m(t), RLMpolystyrene[21]
ISE Peltier (A)10–100 mL−30–200variable<24airDSC, vis.stainless steel
LAMTE (A)3–6 mL−5–125 13; 7<140airDSCglass, plastic[22,23,24,25]
LGCgE (A)270 mL5–800.05–0.32–3 air, vacuumT(t)cycles, Δhcycles, T(t)solid.PMMA[26]
LTTT (A)10–100 ml−20–180 variablevariableairT(t)cycles, DSCglass, metal, plastic[27]
UDL-GREiA I (A)18 × 0.5 mL4–9950; 50100airDSC, FT-IR, TGApolypropylene [4,28]
UDL-GREiA II (A)154 L20–4001; natural1airDSC, FT-IR, TGAstainless steel[29,30,31,32,33,34,35,36,37,38]
UDL-GREiA III (A)8 L−10–800.5; 12airDSC, FT-IR, TGAaluminum, stainless steel[39]
ZAE (A)60 ml−30–220 12airT(t)cycles, DSC, vis.glass, stainless steel[7]
DTU full-scale (B)100–200 L20–90 1; 0.50.2 (0.4 2)airT(t)cycles, Δhcyclesmetal, plastic[40,41,42]
DTU heat loss (B)200 g 20–90 1; natural0.25 (0.5 2)airT(t)cycles, Δhcycles, T(t)solid.glass jar, metal lid[43]
DTU multiple (B)10 × 30 L8–93 0.15; 3–40.25airT(t)cycles, Δhcyclesstainless steel[44]
ISE PCS (C)3.5 L−10–80140; 100 41300 4- −5DSC, ΔpHX, PSA, μstainless steel[45]
1 RT = room temperature, 2 without supercooling of SAT, 3 max. bath volume, 4 at 200 l∙h−1, 5 PCS in contact with water.
Publisher’s Note: MDPI stays neutral with regard to jurisdictional claims in published maps and institutional affiliations.