Article

Flexural Behavior of Post-Tensioned Concrete Beams with Multiple Internal Corroded Strands

Department of Civil and Environmental Engineering, Chung-Ang University, Seoul 06974, Korea
*
Author to whom correspondence should be addressed.
Appl. Sci. 2020, 10(22), 7994; https://doi.org/10.3390/app10227994
Submission received: 9 October 2020 / Revised: 27 October 2020 / Accepted: 10 November 2020 / Published: 11 November 2020

Abstract

:
The corrosion of prestressing steel in prestressed concrete bridges is a critical safety issue. To evaluate the strength of a prestressed concrete beam with corroded strands, it is necessary to know the mechanical properties of the corroded strands in terms of their tensile strength and ductility. In this study, material models were suggested using tensile tests of corroded strands which had been taken from existing bridges. Five prestressed concrete beams with multiple internal corroded strands of different corrosion levels and locations were fabricated and tested using the three-point bending test. The beams with corroded strands near the support did not show meaningful flexural behavior changes, while the beams with corrosion in the mid-span showed significant strength reduction. In order to suggest the appropriate evaluation of the flexural strength of a prestressed concrete beam with corroded strands, material models of the corroded strands were divided into two model categories: a bi-linear material model and a brittle material model. Strength evaluations of the corroded prestressed concrete beams according to f p s approximation and strain-compatibility using OpenSEES were conducted. Results suggested the use of the strain compatibility method only when the section loss was greater than 5%.

1. Introduction

Recently, various investigations and studies on prestressed concrete (PC) girder bridges where corrosion has occurred have been conducted [1,2,3]. The studies have shown that the corrosion that occurred on bridges in use was due to the tendons not being properly protected from corrosion-inducing components such as air, water, and chloride. In addition, it was not easy to find corrosion due to grout, so there were many cases where corrosion was only found after abnormalities had been discovered in the structure. Pape and Melchers [4] carried out a loading test on corroded pre-tensioned concrete girders recovered from a 45-year-old bridge. The test results showed that the performance of corroded PC girders had been overestimated compared to the strength and displacement calculated based on design theory. This was the same for all specimens, and the difference increased linearly according to the degree of corrosion.
Moawad et al. [5] fabricated bonded fully PC beams with accelerated corrosion using electrochemical techniques. After flexural tests had been conducted, the results showed that the flexural strength had been reduced by up to 10%, and that the ductility and initial stiffness were reduced compared to the non-corroded specimens. The reduction in load-carrying capacity due to corrosion was also can be found in conventional reinforced concrete structures [6,7]. This study also proposed an evaluation method for the deformation behavior of corroded PC beams using the strain compatibility method and statistical corrosion model. Rinaldi et al. [8] conducted similar tests on PC beams corroded by means of electrochemical techniques. The specimens had different levels of corrosion and were categorized by the mass loss of the corroded strands. The results showed that low corrosion levels led to a sharp ductility reduction and the crushing of the concrete, while severe corrosion of the strands led to the local rupture of wire. The author tried to evaluate the ultimate force using the stress block approach for concrete; however, it had limitations in that the sectional reduction could not be considered in the calculation. Wang et al. [9] studied the effect of insufficient grout and strand corrosion on PC beams. The author also electrochemically accelerated strand corrosion, and the level of corrosion was measured by mass loss. The result showed that strand corrosion in non-grouted ducts led to pretension loss, a reduction in cracking load, a reduced number of cracks, and a larger crack spacing.
The studies introduced above did not consider the quantitative residual capacity of corroded strands, despite it being necessary to predict the behaviors of corroded PC beams. Zhang et al. [10] conducted loading tests on corroded PC beams and tensile tests on artificially corroded strands. The author also measured the sectional loss using a contour gauge to define the relationship between the sectional loss due to corrosion and tensile behavior. This was used to evaluate the global behavior of corroded PC beams using the strain compatibility method. A major difference in this study compared to other research was the adoption of the quantitative evaluation of corroded strands, which enabled the reasonable prediction of the residual capacity of corroded PC beams.
There has been much research on the mechanical properties of corroded strands [11,12,13,14,15]. These studies have tried to specify the corrosion behavior of strands based on visual inspection, mass loss, and section loss. Jeon et al. [16] suggested an equivalent material model of corroded strands based on research and finite element analysis, and Lee et al. [17] developed this model using a probabilistic approach. Eventually, a previous study [18] conducted tensile tests on a total of 86 corroded strands taken from existing corroded PC bridges and proposed empirical mechanical properties. The study also introduced a method for evaluating the strength of corroded PC beams.
In this study, we conducted flexural loading tests on five PC beams with three strands. The corrosion had been induced in advance at the center of the beam and near the support. Based on material models from the tensile tests of the corroded strands, the flexural test results were compared with recommended strength evaluation methods. Evaluation of the flexural behavior of the corroded beams was suggested and verified by the comparison.

2. Flexural Tests on Corroded PC Beams

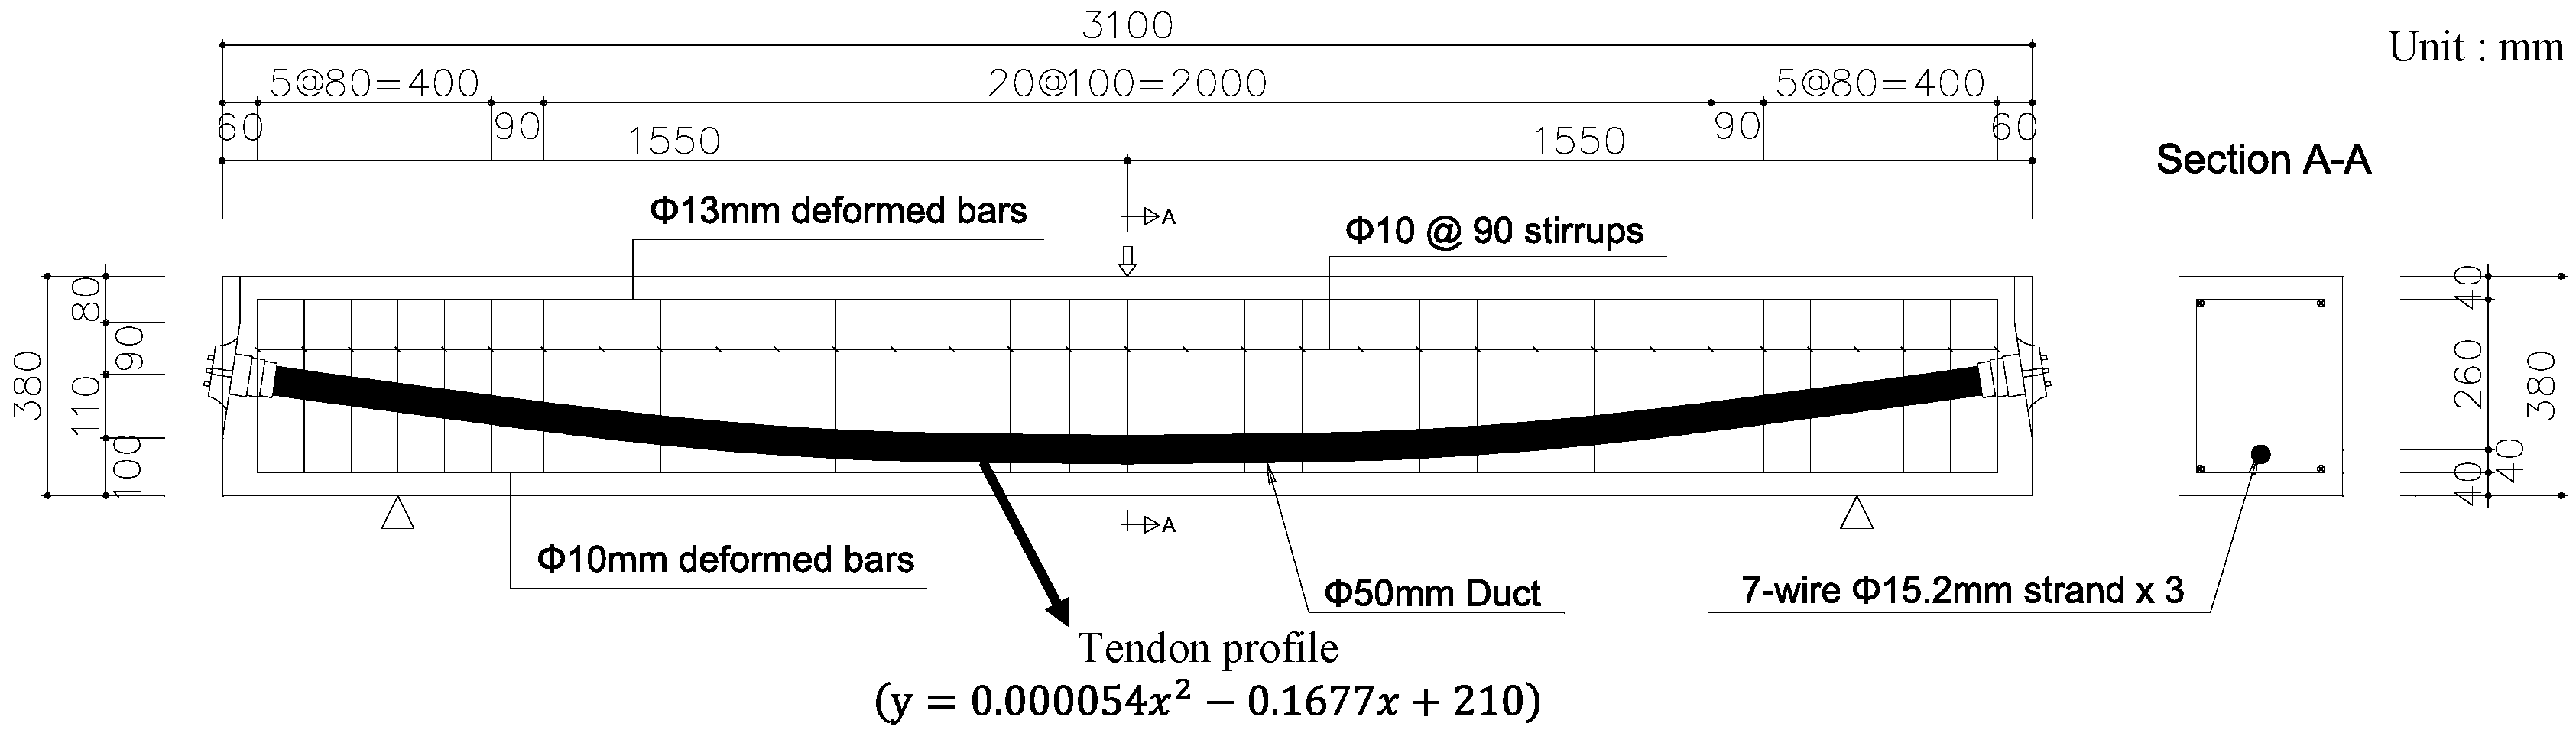
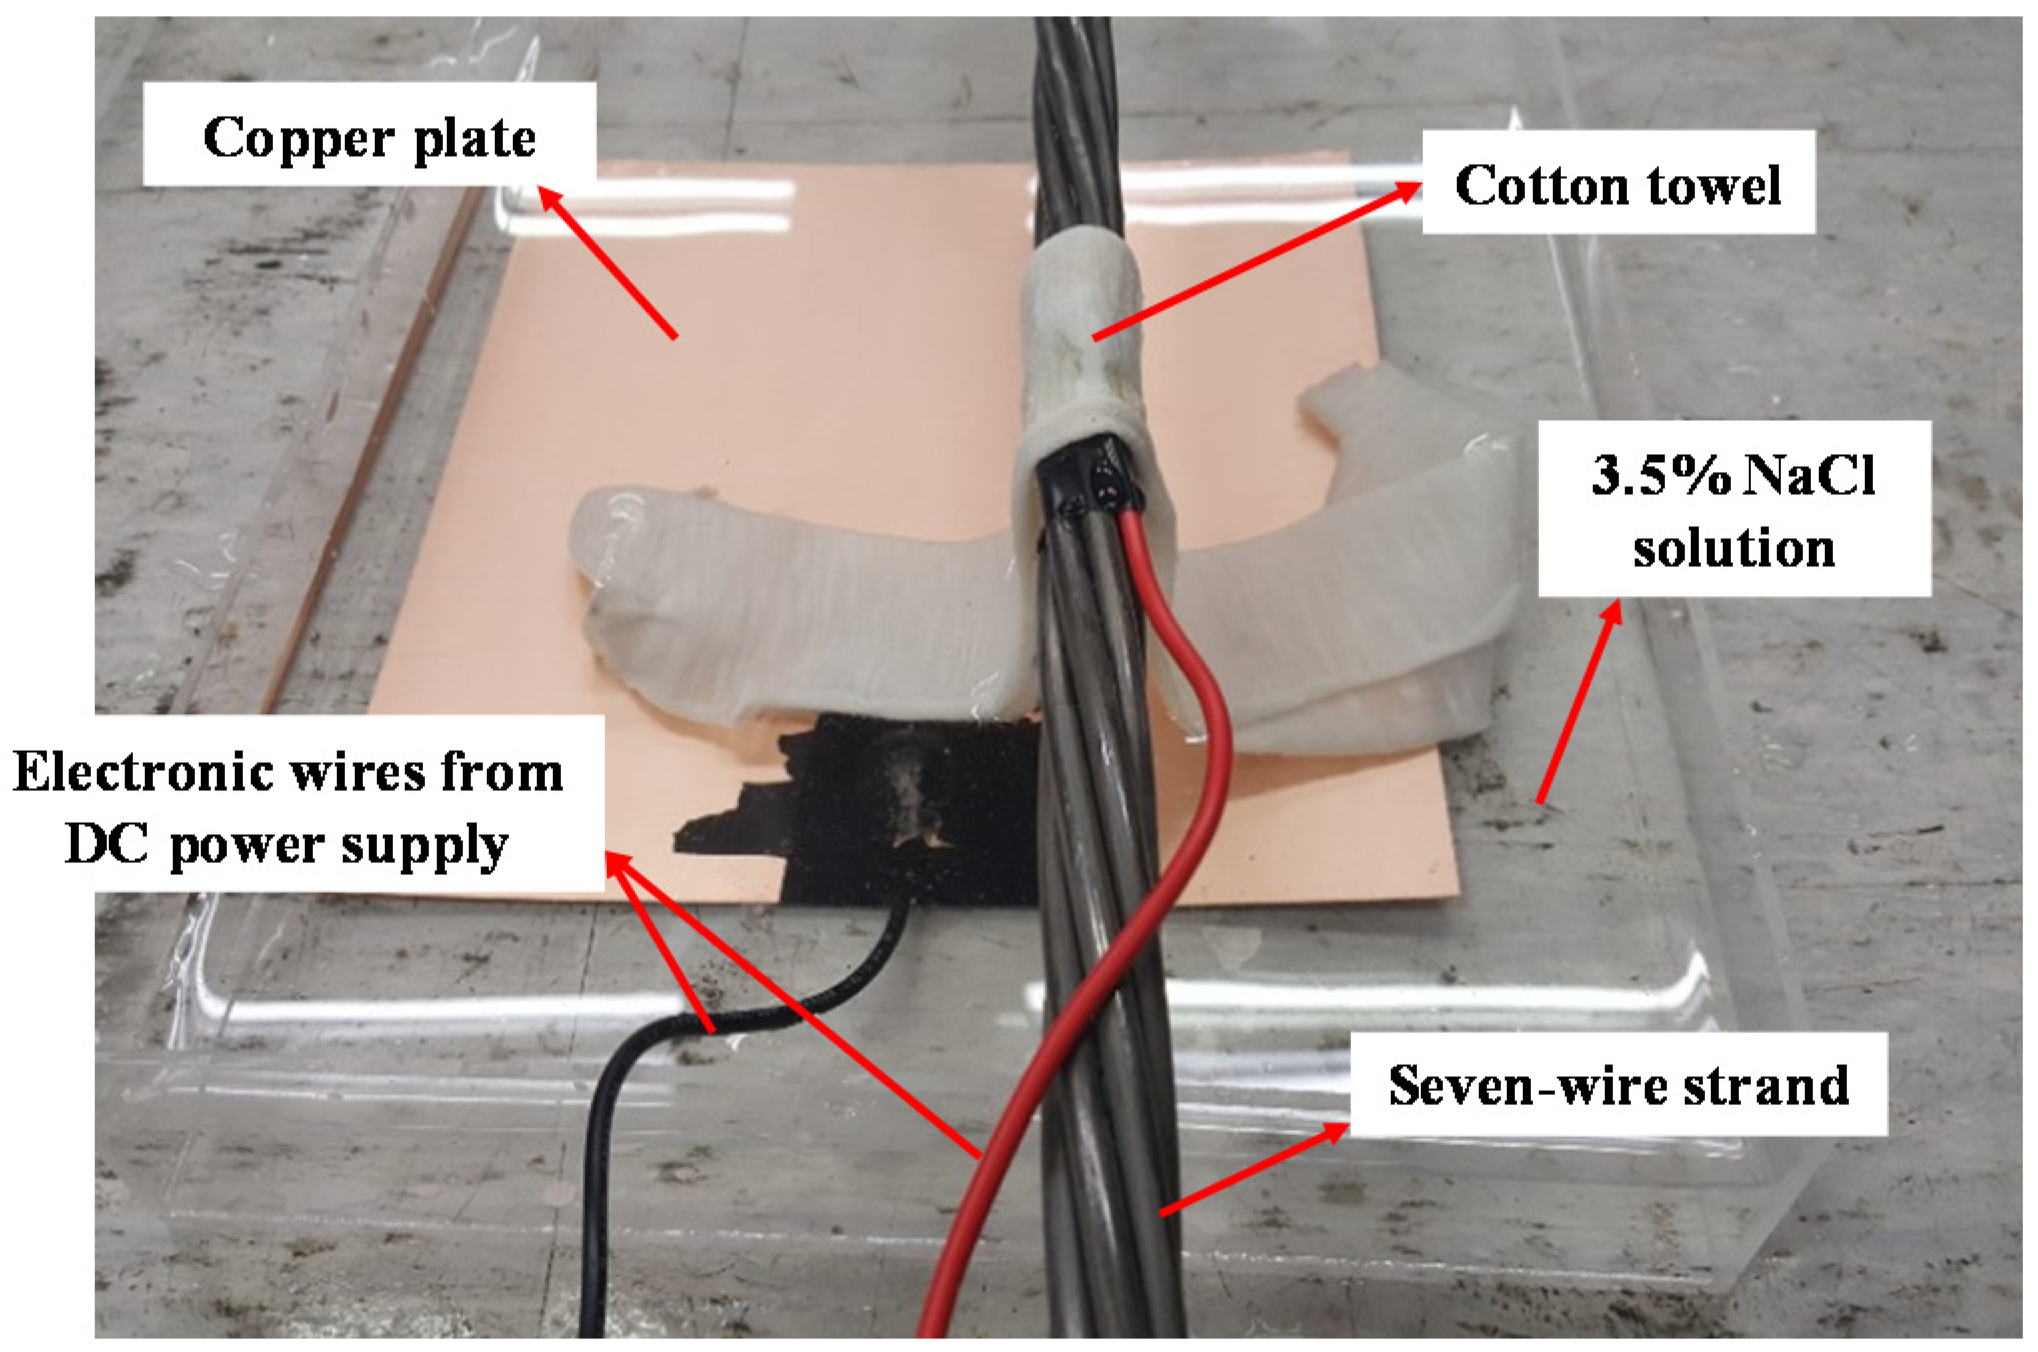
2.1. Fabrication of Test Specimens
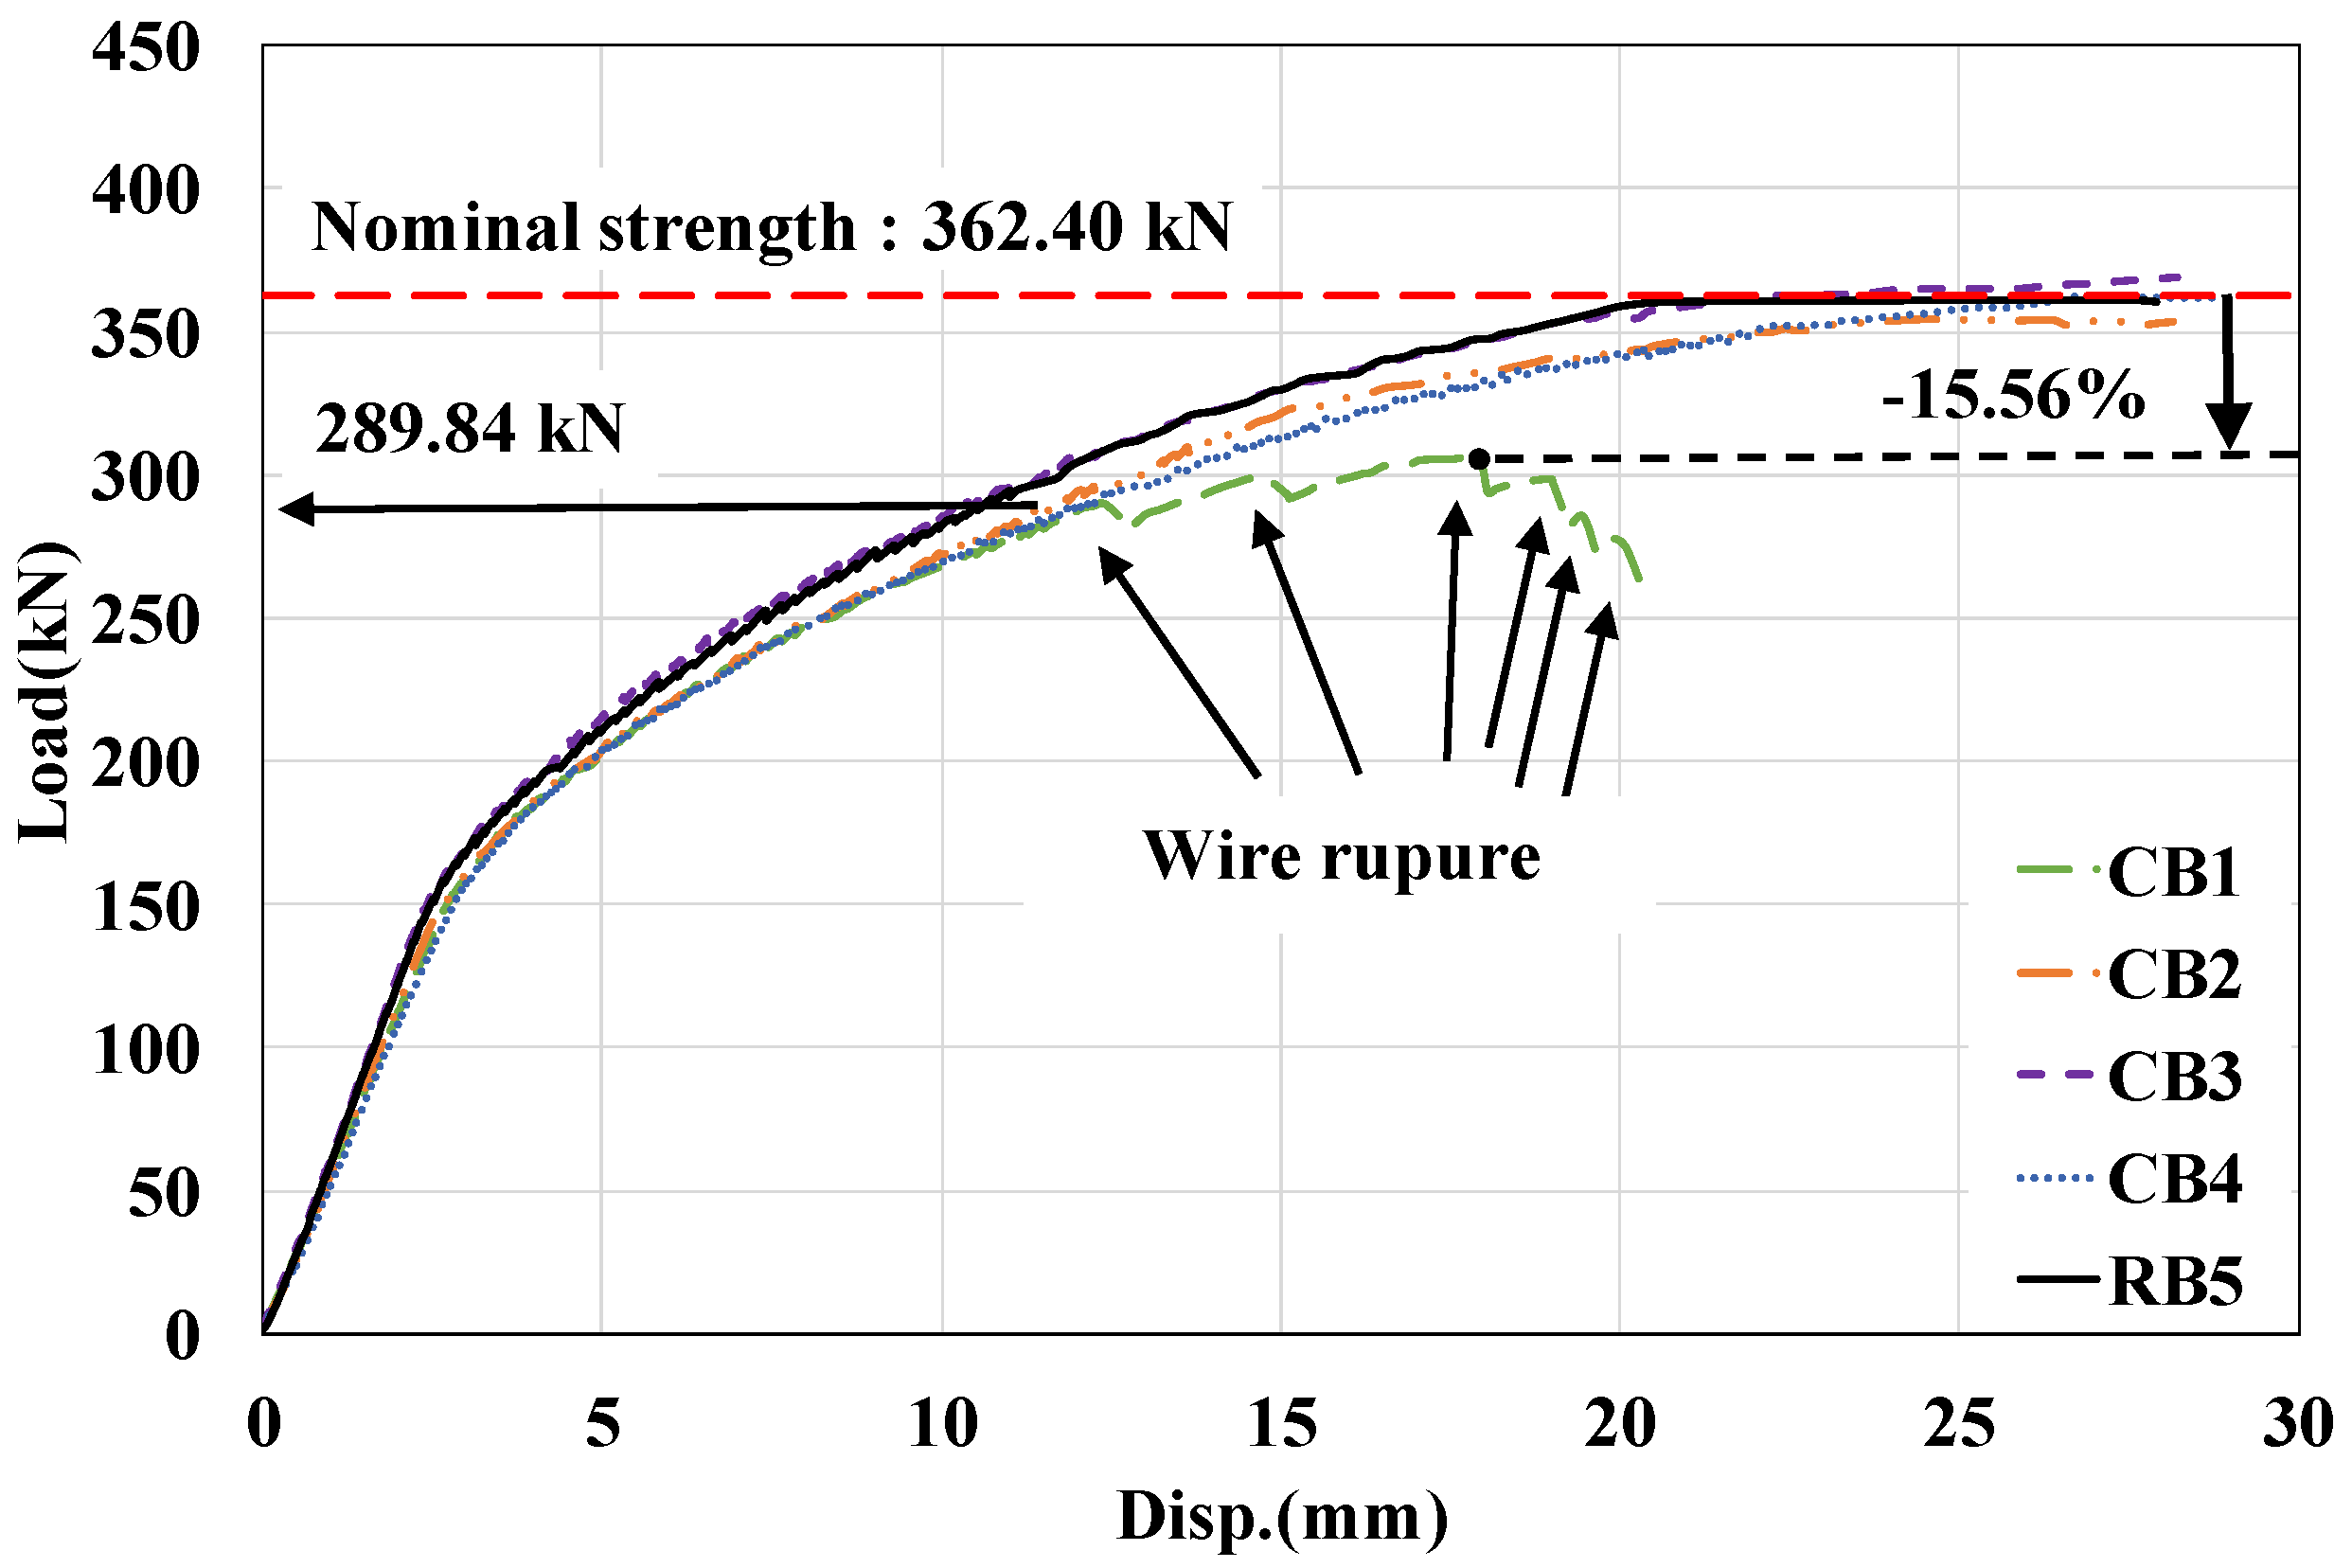
The studies relating to corroded PC beams fabricated for lab tests have mostly dealt with single straight strands. However, existing PC girders’ tendons consist of a bundle of strands with a parabolic profile, so it is necessary to understand the behavior of corroded PC beams with multiple strands. Figure 1 shows a detailed drawing of the PC specimens. A total of five PC beam specimens were fabricated of dimensions 380 × 280 × 3100 mm. Two compressive rebars of diameter 13 mm and two tensile rebars of diameter 10 mm were used. Three strands of diameter 15.2 mm and a nominal area of 138.7 mm2 (according to KS F 7002 [19]) were placed along the tendon profile shown in Figure 1.
Prior to the strands being placed, they were artificially corroded using the impressed current method (ICM) as shown in Figure 2. This method has been adopted by some studies [20,21] on strand corrosion and is known to cause corrosion relatively quickly compared to other methods. A strand and a copper plate are connected to the positive and negative electrode of a DC power supply supplying a certain level of current, and the copper plate is immersed in a 3.5% NaCl solution. In order to induce corrosion in a specific location, a cotton towel is hung on the strand, and the tip immersed in a 3.5% NaCl solution so that electric current flows continuously. A total of ten strands were corroded using this method, and the period of corrosion induction time was set randomly to achieve different levels of corrosion.
A Lu et al. [12] proposed hemispherical pit configuration to evaluate the cross-sectional loss of corroded strands using a pit depth, and the configuration was simplified with three idealized pit configurations in previous studies [16,18] as shown in Figure 3 (when comparing the shape and Figure 3b, Figure 3b had larger cross-sectional loss up to a pit depth of about 2 mm and the model of Lu et al. [12] became larger after that). The section loss measurement was conducted on six outer wires excluding the core wire which cannot be evaluated for section loss. The cross-sectional loss of a strand (called strand-unit section loss from here on) was defined as the sum of the section loss of each wire (called wire-unit section loss from here on). Likewise, a tendon-unit section loss was the sum of the three strand-unit section losses.
To define the most corroded section, the measuring technique was conducted every 20 mm along the length of corrosion. Among the measured strand-unit section losses, the biggest strand-unit section loss was selected as the degree of corrosion of the strand. This method has the benefit of being able to find the highest section loss among the length and apply this to practical inspection more easily than other measurement methods [18]. Equations (1)–(3) were mathematically derived from geometric shapes of the pit configurations so that section loss could be measured with only one variable, the pit depth.
The corroded strands were placed on each specimen as shown in Table 1. Four PC beams with corroded strands, identified as CB, and a non-corroded PC beam, identified as RB, were prepared. CB1 only had corrosion in the middle of span, while the others had it located 300 mm from the support to the center. The cross-sectional loss of the wires and strands shown in Table 1 indicate those with the highest cross-sectional loss in the tendons of each specimen. After the strands had been placed, prestressing force was applied, and grout was injected.
The corrosion has been found near the support in a case study [18], and the study conducted a PC beam test with single strand. The test considered two cases of corrosion at midspan and one case of corrosion near the support, and the result showed significant reduction in load-carrying capacity in the former case, but not in latter case. However, a recent study [21] showed that corrosion caused bond strength degradation and global strength decrease, even though the location was not midspan, and Kaba et al. [22] also found that tendon rupture of a full-sized PC girder exhibited reduced flexural stiffness in unbonded cases. Therefore, CB2, CB3, and CB4 were prepared to observe the effect of corrosion near the support on global behavior, especially with respect to the bond degradation behavior because there was doubt that the severe corrosion near support can cause deteriorated flexural behavior of PC beams. CB2 had the largest tendon-unit section loss, CB3 had the largest wire-unit section loss, and CB4 had the smallest section loss among them. Considering the results of the tensile test of corroded strands [18], the cross-sectional loss higher than that of Table 1 was less meaningful (so not considered) because a significant elongation capacity decrease occurred.
The study on bond behavior of corroded strand [23] proposed effective bond length for corroded strands under flexural load considering single strand, and Equations (4) and (5) were derived to obtain effective bond length to give effective prestress in this paper. This means that the bond strength does not decrease if the cross section is out of the length and means that the global flexural behavior does not change if the length does not reach the midsection. Since the PC beams considered herein had three strands, the R ( η ) can be considered with three sectional losses: wire-unit section loss, strand-unit section loss, and tendon-unit section loss. Based on those three sectional losses, effective bond length of Equation (4) was calculated as shown in Table 1.
A s l , 1 =   2 r 2 [ arccos ( 1 d p 2 r ) 1 2 sin { 2 arccos ( 1 d p 2 r ) } ]
A s l , 2 =   r 2 [ 2 { arccos ( d p 2 r ) } π s i n { 2 arccos ( d p 2 r ) } ]
A s l , 3 =   r 2 [ arccos ( 1 d p r ) 1 2 s i n { 2 arccos ( 1 d p r ) } ]
where A s l , 1 3 are the losses of sectional areas according to the type of pit configuration, r is the radius of the wire, and d p is the pit depth (from 0 to 2r) measured by a depth gauge at the deepest location
l e b = F p e 0.7 R ( η ) τ m a x L p
R ( η ) =   {                     1.0                                               η     6 %     2.03 e 0.118 η                                   η   >   6 %
where l e b and F p e are the effective bond length and prestressing force of strands, respectively; R ( η ) is the normalized maximum bond stress; L p is the circumference of a strand (= 4 / 3 π d s ), and d s is the diameter of a strand; η is strand-unit section loss due to corrosion; τ m a x is the maximum bond stress taken as 1.25 f c k and 2.5 f c k for the good and other bond condition, respectively.
Figure 4 shows the test setup. The test was conducted under three-point bending with simple supports, the span length between the supports being 2500 mm. A hydraulic jack applied the load to a steel beam of width 200 mm (to distribute the stress concentration), and a load cell was located between them. Another the load cell was installed between the end of beam and the anchor to establish the initial prestressing force, which was 400 kN (on average). The PC beams were loaded until concrete crushing at the top was observed, or the strength decreased by 10% after the peak strength.
Table 2 shows the mechanical properties of materials used in the PC beam specimens. The average compressive strength of the concrete was 44.07 MPa from three cylinder tests (size of 100 × 200 mm) conducted on the same day as the loading test. All PC beam specimens were fabricated with the same concrete mix. The reinforcement was SD400 based on KS D 3504 [24], which had the range of yield strength, σ y , of 400–520 MPa and the ultimate strength, σ u , of 1.15 times of yield strength (1.15 × σ y ) or more. The yield and ultimate strength of rebar were considered as 400 and 560 MPa, respectively. The elastic modulus of rebars, E s , was 200 GPa. The yield, σ p y , ultimate, σ p u , strength, and elastic modulus, E p s , of the strands from average value of three tensile test results were 1656, 1867 MPa, and 195 GPa, respectively. The ultimate strain of the strands, ε p u , was 0.0754. The yield strength was determined using the 0.2% offset method by KS D 7002 [19].

2.2. Test Results

Figure 5 shows the load-displacement behaviors of the test specimens, and the results are summarized in Table 3. The nominal strength of the PC beam with non-corroded strands was calculated as 362.40 kN, which was based on the conventional concrete stress block theory and the bilinear elasto-plastic model of steels. Using this calculation, the effective prestress of the strands was 688 MPa due to the somewhat large loss, as the prestressing of the three strands and anchor caused large short-term losses. RB5, which had no corrosion, faced a situation where a support slightly went out of place (about 10 mm in total), and the load no longer increased after a displacement of 20 mm. Therefore, although the strength was estimated to be 361.13 kN, it is expected to be higher than the original nominal strength.
CB2, CB3, and CB4 did not show any noticeable difference in load-displacement behaviors. The cracking loads were the same as RB5, and the maximum loads were also similar to that of RB5. Only CB2, which had the second greatest tendon-unit section loss, exhibited reduced strength (2% less than the nominal strength). However, it was difficult to know if this difference was due to corrosion, as CB3 had the highest strength even though it had the second highest wire-unit section loss, and it exhibited similar post-cracking stiffness to RB5. This could be explained by the fact that the corrosion occurring in the parabolic tendon near the supports was below the level of corrosion represented here and did not significantly affect the global behavior—possible reasons may be the generation of a low bending moment as well as the tensile stress due to its location near the neutral axis in the section. Coronelli et al. [25] also found this phenomenon in their study whereby the remaining portion of a wire could provide residual prestressing effects when wire failure occurred close to the support. In addition, the effective bond length from wire-unit section loss in Table 1 did not seem to be valid. When considering effective bond length from strand-unit or tendon-unit section loss, the degradation of bond strength due to the degree of corrosion in the PC specimens did not affect the global behaviors.
CB1, which had the greatest section loss in the middle of the span, exhibited six wire ruptures during the loading. The load suddenly dropped by 9 kN when the load reached 289.84 kN with the first wire rupture. The maximum load was 306.01 kN when the third wire ruptured, which decreased the load from the nominal strength by 15.56%. The proportion of the three wires lost in the total strand cross-sectional area was about 14%. The rupture of the wires in the governing section of the PC beams showed a very close correlation with the ultimate strength. However, since it is not possible to predict how many corroded wires will fail during the ultimate stage of evaluating the behavior of the member, it would be reasonable to define the first wire rupture as the moment at which the life of the member ends. The load at which the first wire failed is referred to as the ultimate strength from here on.
According to a recent study [10], the corrosion caused a change in the structural failure mode and post-cracking behavior when the corrosion-induced section loss of a strand was over 11%. However, the failure mode varied with corrosion locations; the corroded wires of CB1 had failed earlier exhibiting concrete crush despite a section loss of 9.49%, while others exhibited concrete crush after the tensile reinforcements yielded. CB1 also had a reduced cracking load of 130 kN, but no difference in the post-cracking stiffness. This seems to be due to the different corrosion induction; CB1 had severe corrosion in the middle of the span, and specimens from the study had corrosion along half of the span (without grout). Therefore, the location of corrosion in a bonded PC beam is an important variable in terms of performance evaluation.
Figure 6a shows the side view when CB1 was deconstructed after the experiment, and Figure 6b,c show the failed sections of the 1st and 2nd strands recovered from CB1, respectively. The section losses in Table 4 were measured before those applied to the specimen using section loss measurement method with Figure 3 and Equations (1), (2), and (3). The number of failed wires was found to be six as shown in the load-displacement behavior in Figure 5—however, it did not occur evenly among the corroded strands. Five wires failed at the 1st strand even though the section losses were not much different from the 2nd strand. This may mean that the stress distribution occurs only between the wires within a strand, but not between adjacent strands. To clearly explain this phenomenon, further study is required, including unbonded cases.

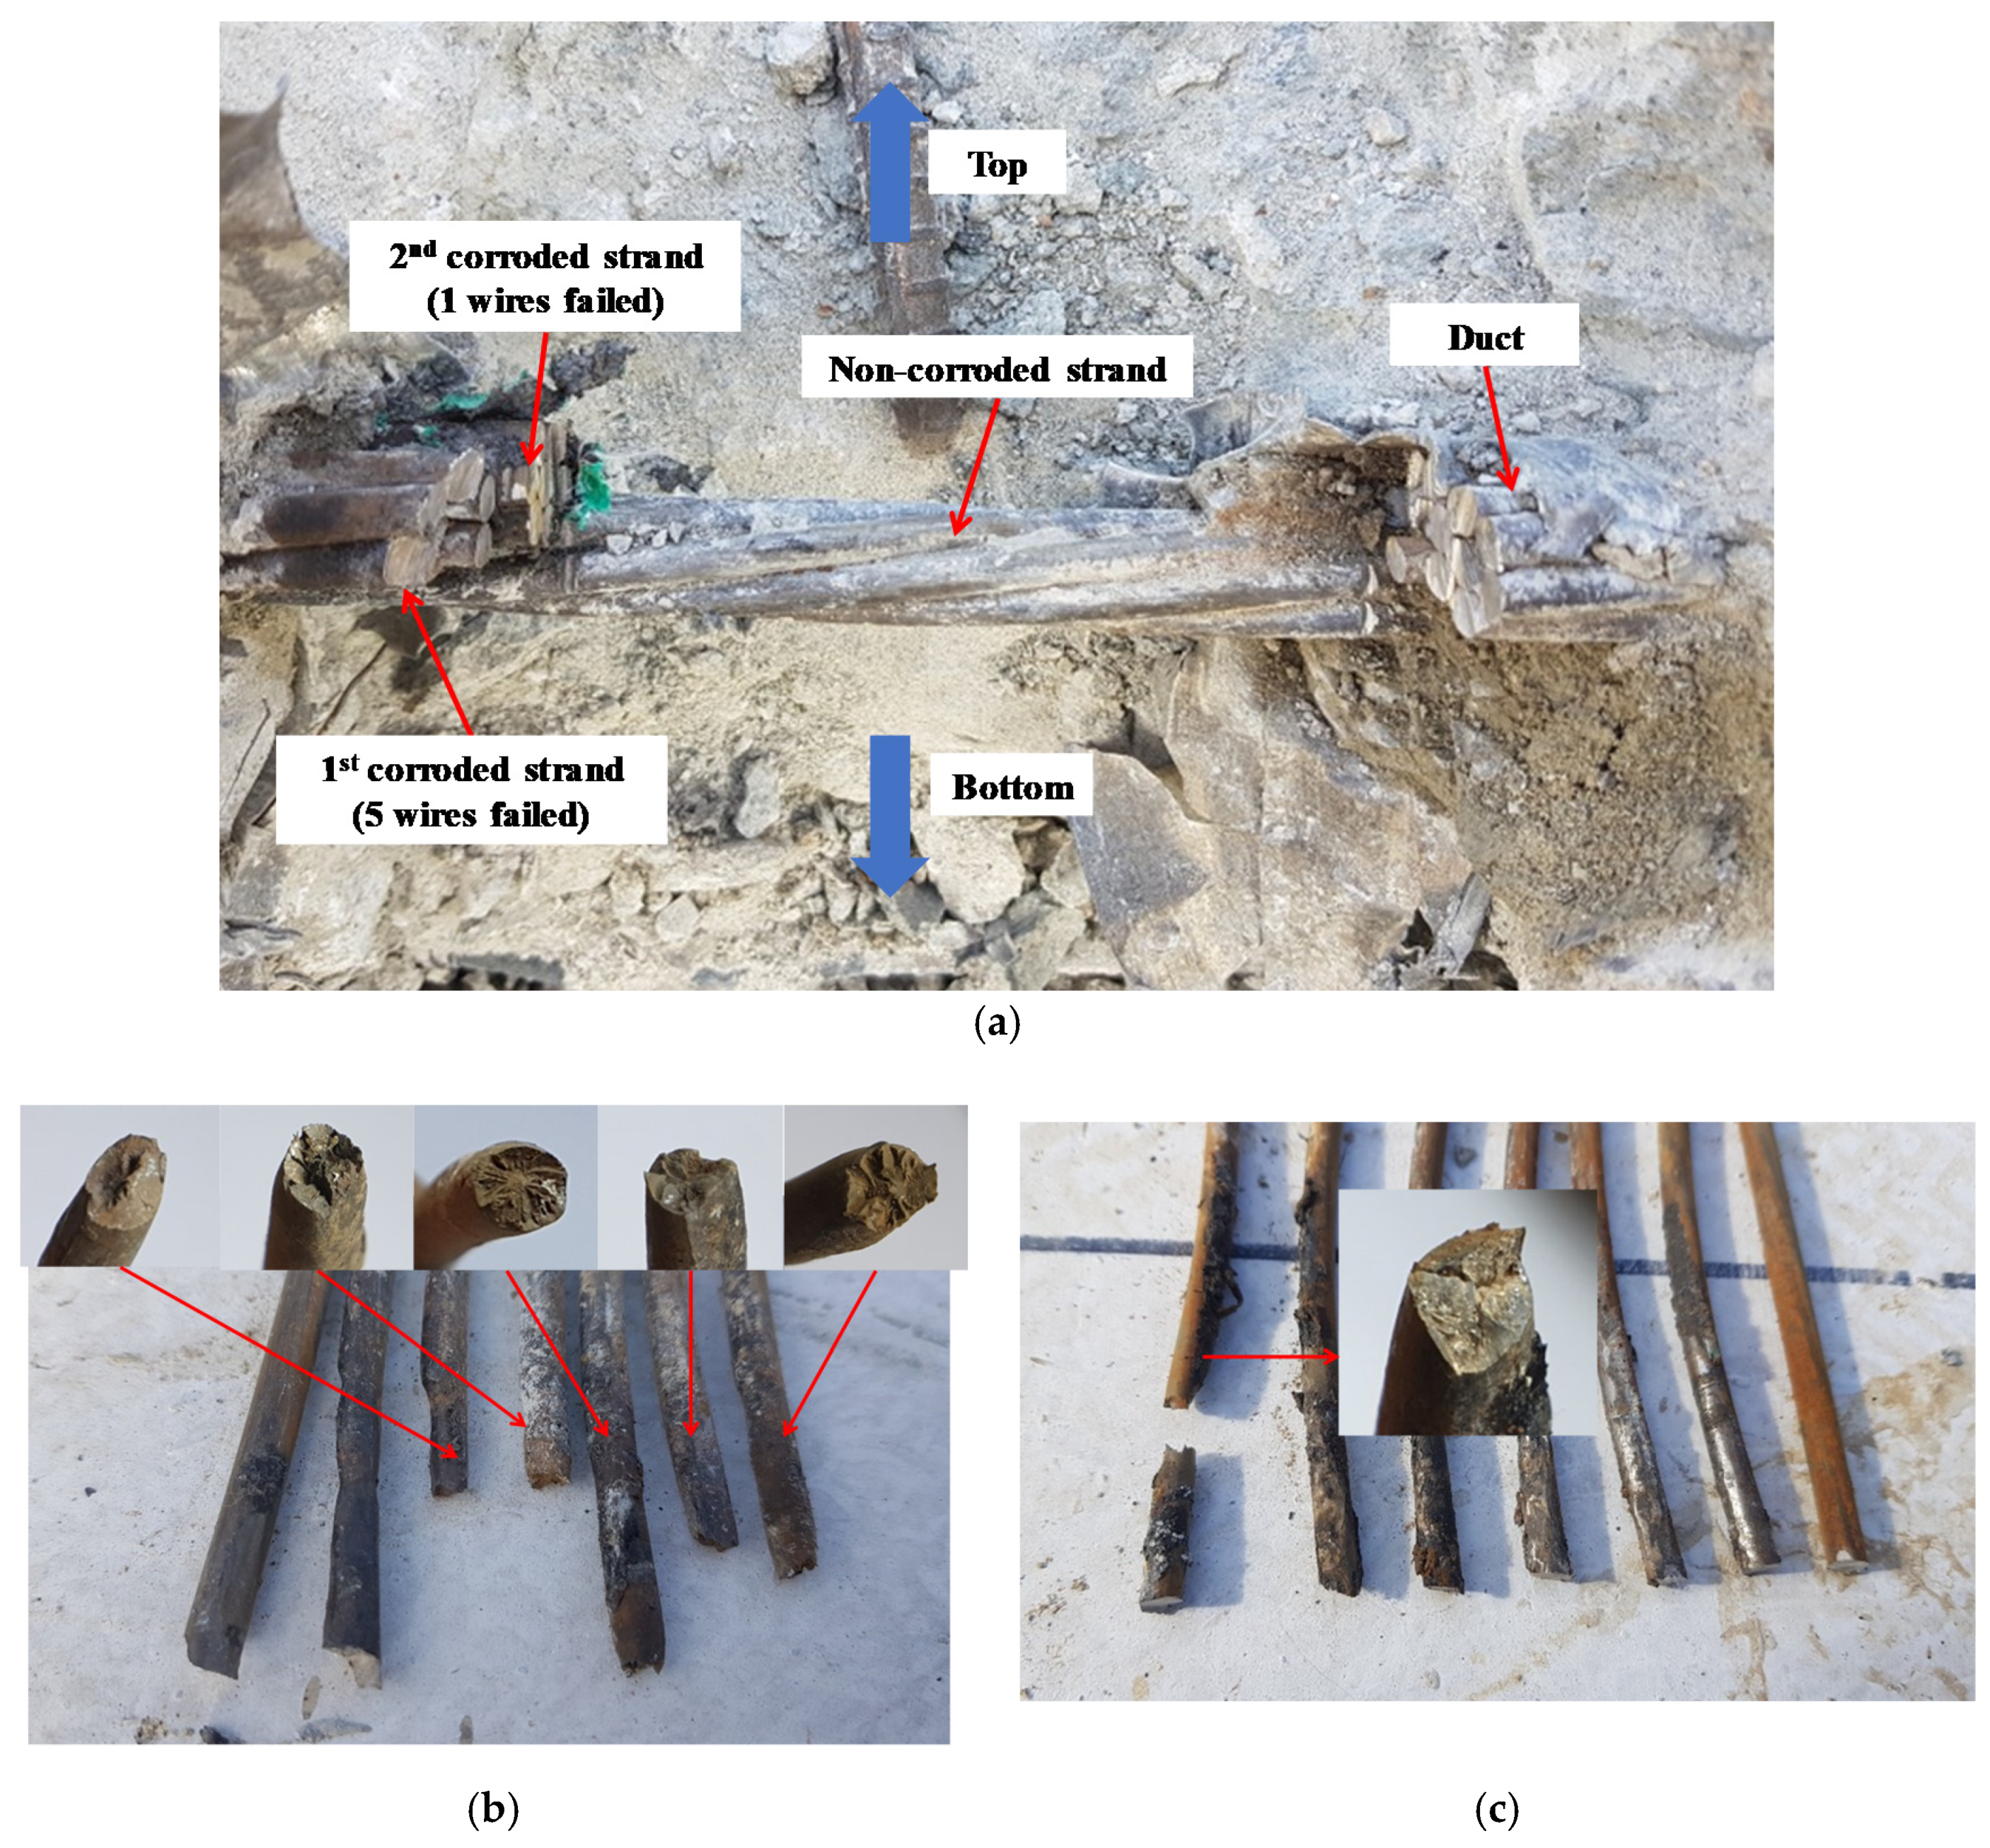
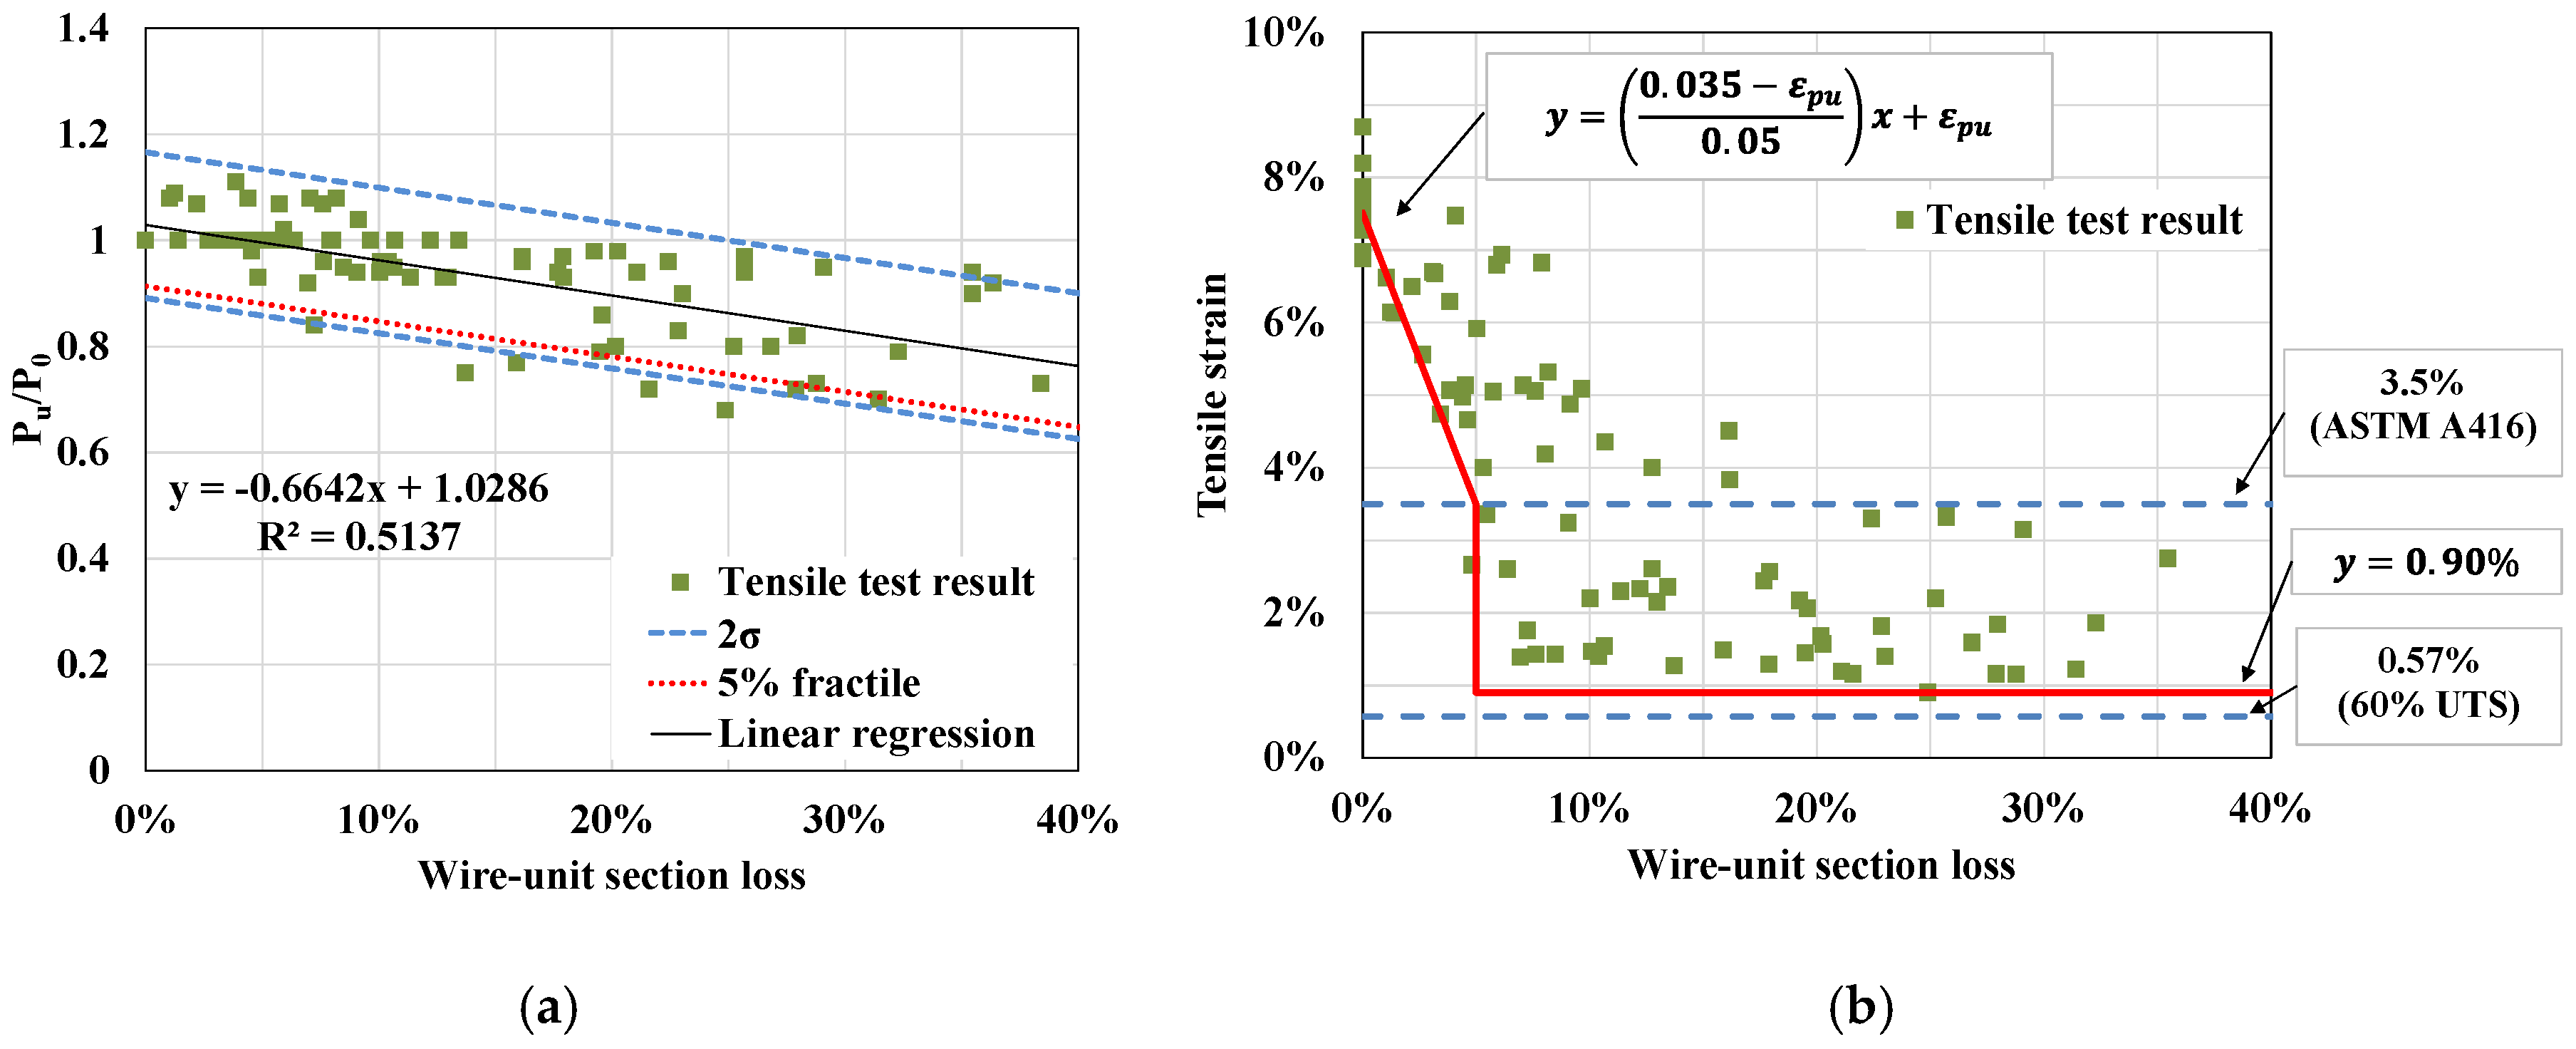
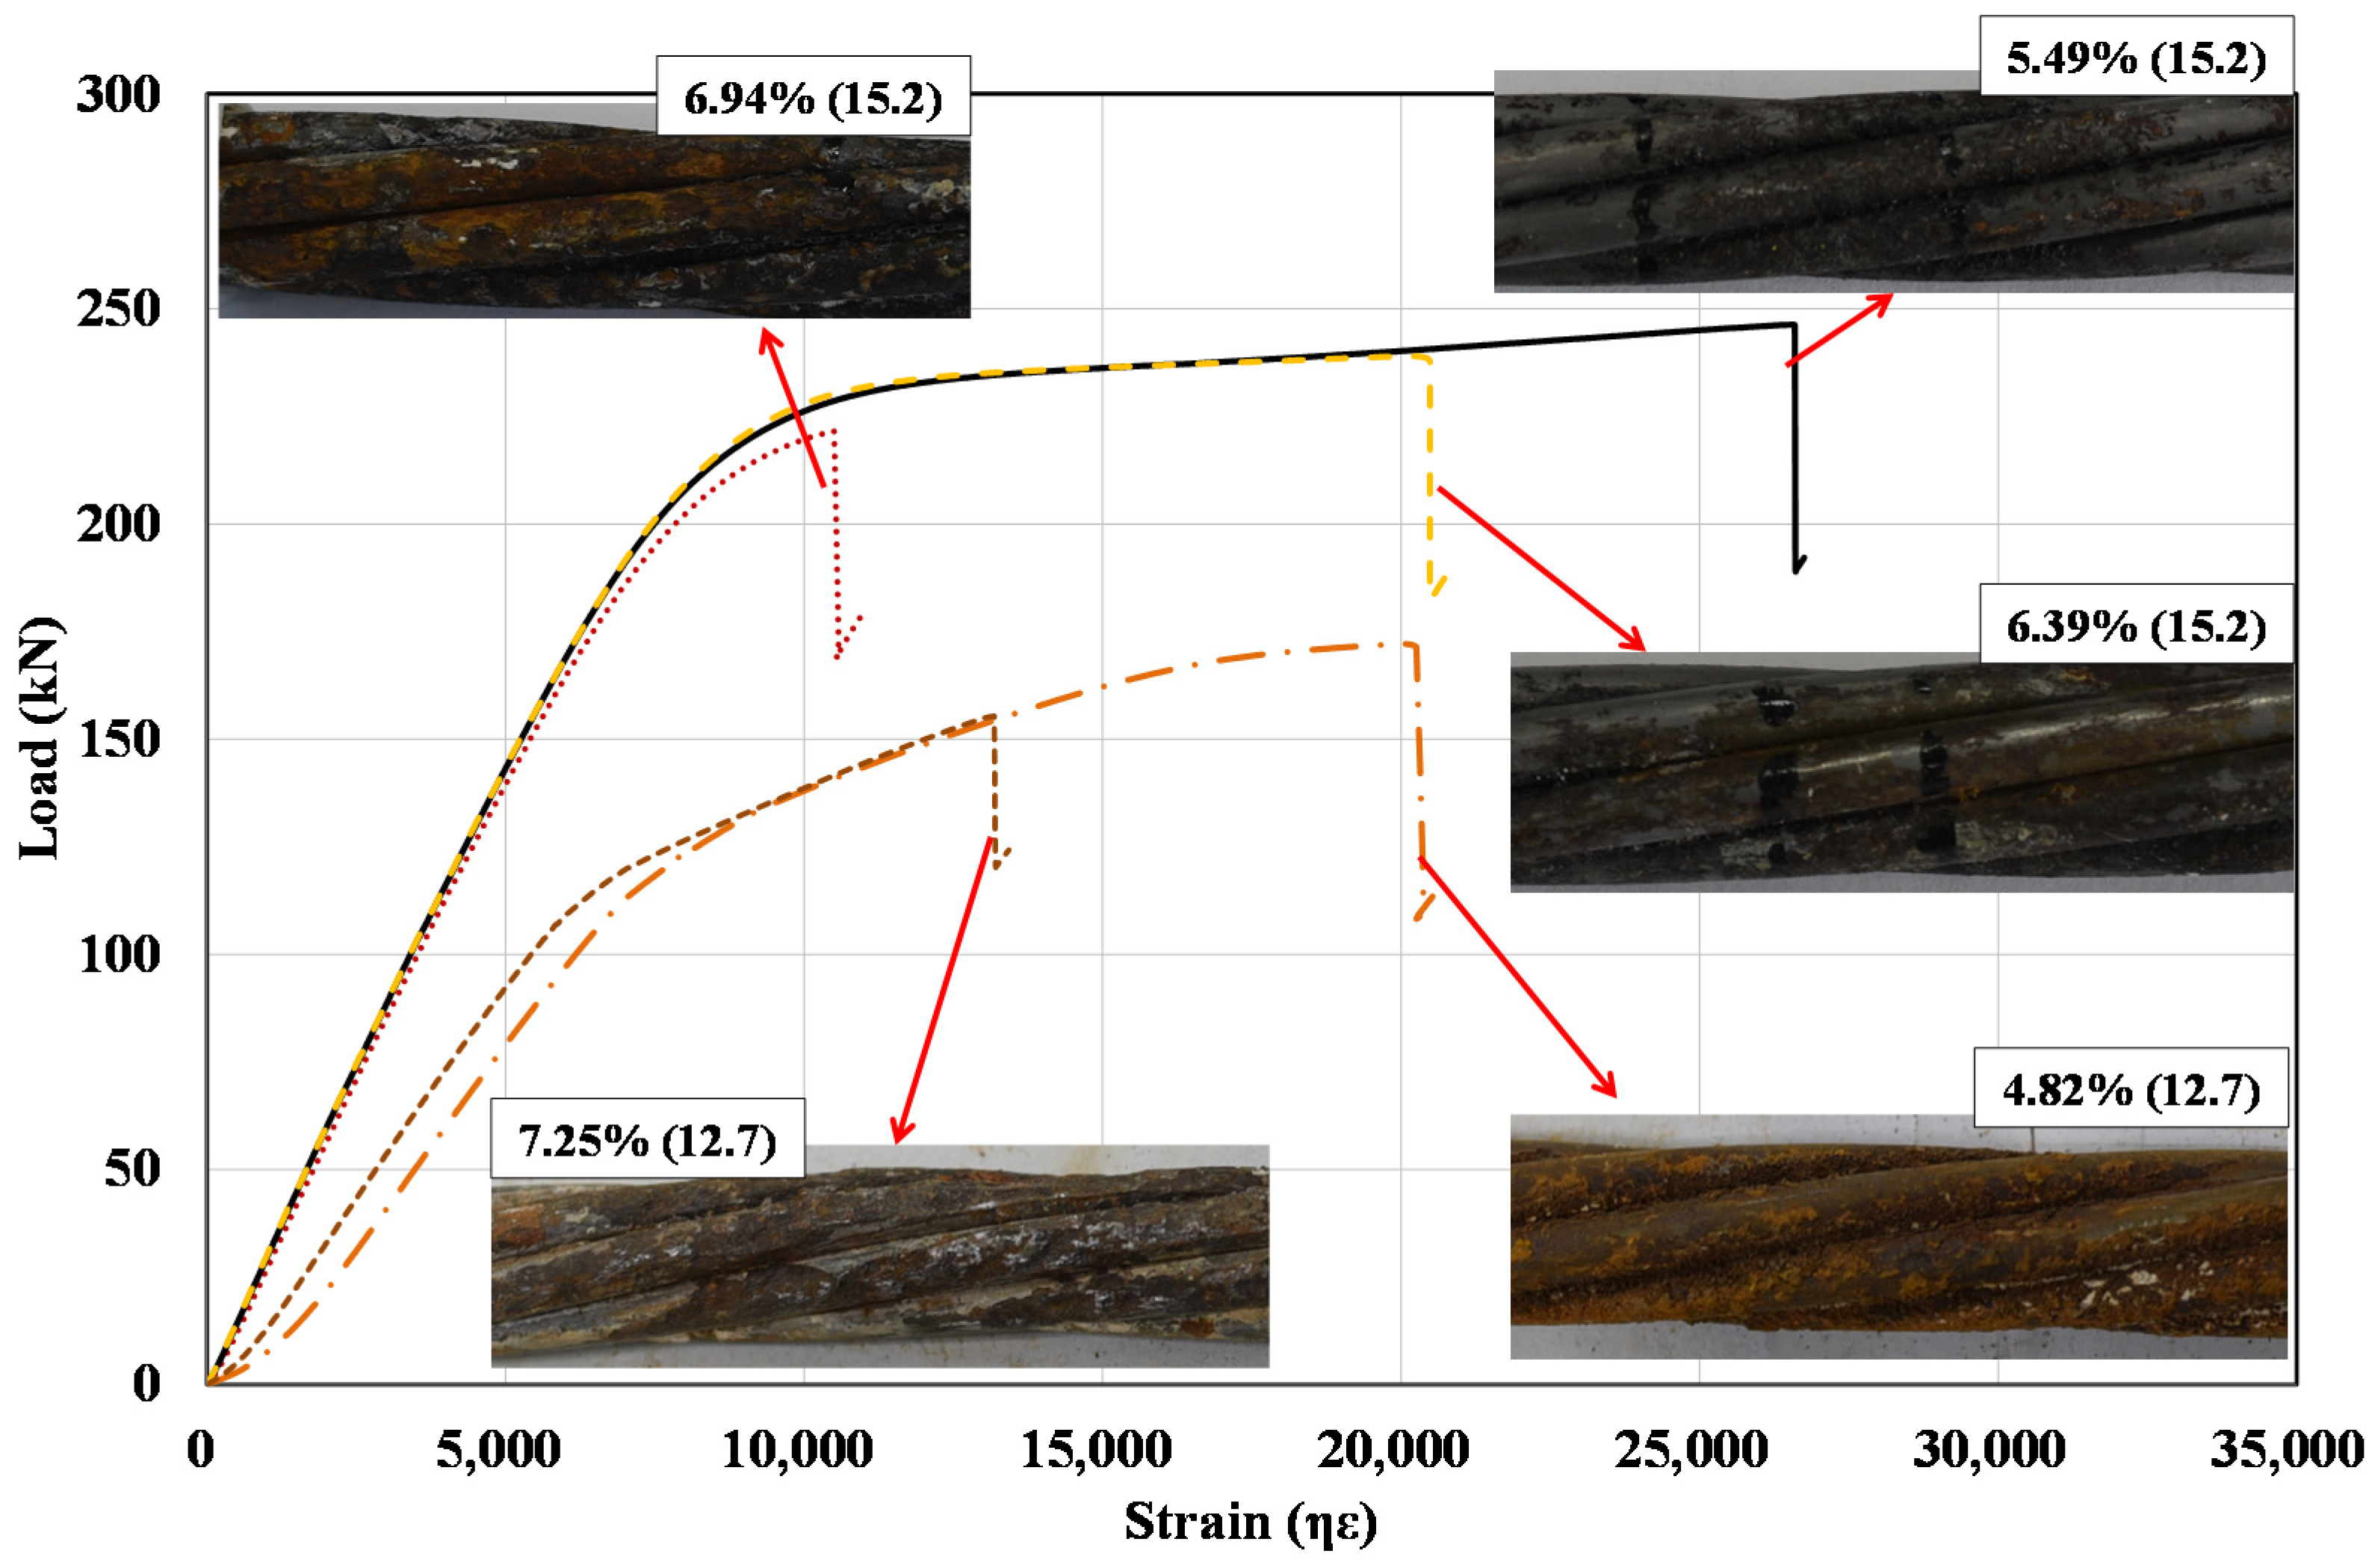
3. Residual Mechanical Properties of Corroded Strands

In previous research [18], residual mechanical properties were introduced based on the tensile test results of 86 corroded strands. From these results, it was found that the yield properties were not significantly affected by corrosion, and that the ultimate properties could be defined using empirical expressions. Figure 7 shows the ultimate strength and strain of the 86 corroded strands with respect to the wire-unit section loss—the wire-unit section loss being the section loss of the most corroded wire in a strand. The reason for the use of wire-unit section loss as a parameter was that the ultimate properties (shown in Figure 7) were defined as “when the first wire ruptured during the tensile tests”. The residual ultimate strength (shown in Figure 7a) illustrates a relationship in which the strength decreases linearly as the cross-sectional loss increases. A 5% fractile line, expressed as Equation (6), is proposed to account for this deviation. The fractile line is defined as the “residual ultimate strength” of the corroded strands.
According to study on the corrosion-induced failure mechanism of prestressing steel [18], corrosion can cause stress concentration in pit corrosion, and local corrosion attack in the form of pitting or wide pitting corrosion, and the load bearing capacity may get lost at an early stage due to brittle fracture. Since the environmental conditions causing corrosion are different for each bridge and for each prestressing steel, the amount of local stress concentration is unpredictable. However, the decrease in elongation capacity of prestressing steel strand due to corrosion is required to be defined to evaluate deteriorated behavior of corroded PC beams. Therefore, the term ultimate strain was used as an indicator of the average decrease in tensile capacity due to corrosion induced section loss so that the tensile capacity could be expressed by the material model, even though ultimate strain of “metal” has no correlation with corrosion induced section loss. The ultimate strains of corroded strands could be obtained by dividing the elongation by the target length.
According to the previous research [16], it has been found that the elongation capacity of the corroded strand decreases linearly and rapidly at around 5% of cross-sectional loss, using finite element analysis. This was also observed in a few tensile test specimens as shown in Figure 8, which shows five examples of tensile test results and their corrosion features with “wire-unit section loss (type of strand)”. The test results imply that there can be a large reduction in elongation capacity of corroded strands even in moderate corrosion of 5% section loss.
Unlike the previous research [18], a new approach to the residual ultimate strain of the corroded strands was considered as shown in Figure 7b. With cross-sectional losses within 5%, the ultimate strain tended to decrease linearly; however, it sharply decreased with large deviations, after which it converged to a certain value. Therefore, the relationship between the residual ultimate strain and the section loss could be defined by dividing it into “before” and “after” 5% loss categories. Because the total elongation of 7-wire strands should not be less than 3.5%—according to the American Society for Testing and Materials standard ASTM A416 [26]—the residual ultimate strain for section loss less than 5% was defined by a straight line connecting 7.52% of the ultimate strain of non-corroded strands and 3.5% of ASTM A416 [26].
After the 5% section loss, the ultimate strain was defined as 0.9%, the lowest strain from the tests, regardless of the corrosion level. This was to induce a conservative evaluation of the ultimate properties in consideration of large deviations due to corrosion. The expressions are shown in Equation (7). The effective prestress force applied to the tendons of PC bridges in operation is known to be 60% of the ultimate tensile stress (UTS). In the case of strands of grade 1860 MPa, 60% of the UTS was calculated to be 0.57% of the strain. Considering the lowest ultimate strain, 0.9%, it could be determined that strands with severe corrosion had a marginal strain of 0.33%. This meant that if the strain due to a live load exceeded 0.33%, the corroded strands could fail.
F c . p u F p u = 0.6642 η   + 0.913
ε c . p u =   { ( 0.035 ε p u 0.05 ) η + ε p u                                                 η     5 % 0.009                                                                                               η   >   5 %
where F p u and F c . p u are the ultimate loads of the non-corroded and corroded strands (kN), respectively; ε p u and ε c . p u are the ultimate strains of the non-corroded and corroded strands, respectively; η is the wire-unit section loss.

4. Flexural strength Evaluation of Corroded PC Beams

4.1. f p s Approximation

To evaluate the flexural strength of PC beams, ACI 318-14 [27] suggests that both the strain compatibility method and the approximate value of f p s , which refers to the stress of the strand when the compressive strain, ε c , of concrete becomes 0.003. These two methods were adopted in this paper. Equation (8) is the revised approximate expression for f c . p s from ACI 318-14 [27]. The ultimate stress of a corroded strand, f c . p u , is derived from the most corroded strand in a tendon, because the moment of the first wire rupture is defined as the ultimate strength of a corroded PC beam. The f c . p u can be obtained by dividing F c . p u from Equation (6) by the gross sectional area of the strand, A p s . The use of A p s is to reflect the corrosion effect on the stress–strain curve.
f c . p s = f c . p u   [ 1 γ p β 1 { ρ p f c . p u f c k + d d p ( ω ω ) } ]
where
f c . p s :The stress of the corroded prestressing strand or tendon when ε c is 0.003
f c . p u :The ultimate stress of the most corroded prestressing strand in a tendon ( = F c . p u / A p s )
A p s :The cross-sectional area of the gross strand-unit section
γ p :The coefficient according to the type of strand    { 0.55   w h e n   f p y / f p u 0.80 0.40   w h e n   f p y / f p u 0.85 0.28   w h e n   f p y / f p u 0.90
β 1 :The ratio between the depth of an equivalent rectangular concrete stress block and the neutral axis depth (=a/c)
ρ p :The prestressing steel ratio ( = A c . p t / b d p )
A p t :The cross-sectional area of the gross tendon-unit section
d :The depth of the tensile reinforcement
d p :The depth of the prestressing strand
ω :The tensile reinforcement index ( = ρ f y f c k ,     ρ = A s b d )
ω ’:The compression reinforcement index ( = ρ f y f c k ,     ρ = A s b d )

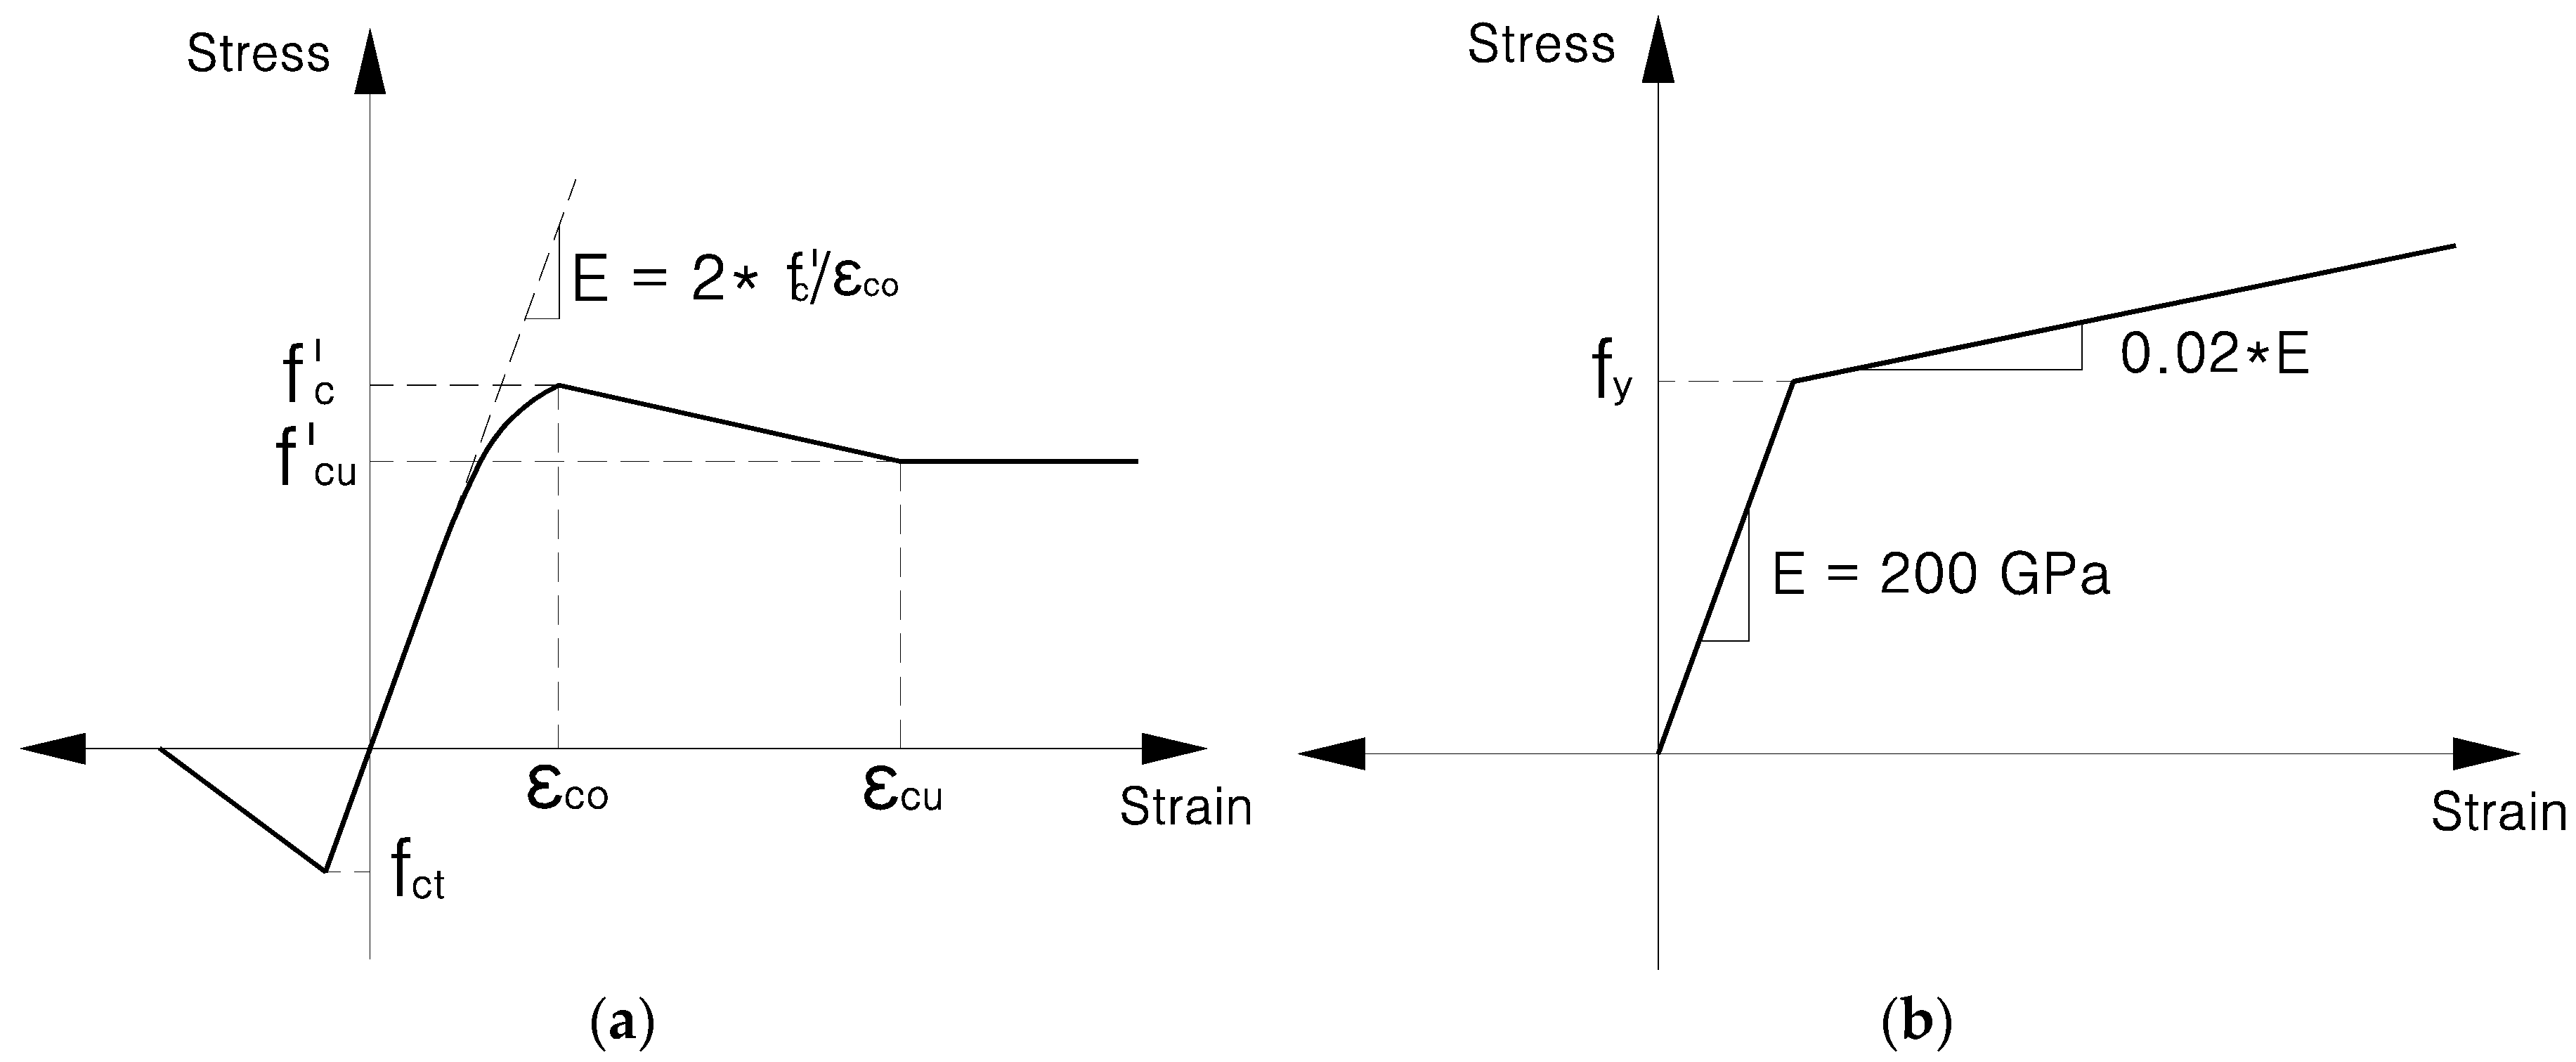
4.2. Strain Compatibility Using OpenSEES

According to a previous study, it was found that the corrosion on strands led to a rapid reduction in elongation. Therefore, using the f p s approximation has limitations in the evaluation of the PC beams, because it considers only a reduction in the ultimate strength of corroded strands. To consider the effect of reduced elongation, the Open System for Earthquake Engineering Simulation (OpenSEES) [28] analysis program was used for the strain compatibility method in this paper. This program uses the fiber elements assigned with section properties, and the analysis is conducted using the strain compatibility method on the sections.
The analysis modeling is shown in Figure 9. Since the parabolic tendon profile could not be reflected in the strain compatibility analysis, the element was divided into length t (10 mm), and the position of the tendon in each element was changed gradually according to the tendon profile. Each section of the element consisted of four rebars and three strands spaced 20 mm apart, which were then modeled as if bonded perfectly. The cross-sectional area of the strands was not changed according to the corrosion, because the material model included the effect of corrosion. The distance between two supports was 2500 mm.
The concrete material model used in this paper was the modified Kent and Park model [29] which has been predefined in OpenSEES [28]—using the name concrete02—as shown in Figure 10a. In this model, the stress–strain curve follows the example of the Kent and Park model [29] up to the peak strength, f c . The linear decrease was then defined in the post peak branch as expressed in Equation (9). Linear tension softening was also considered in this model, and the material properties (shown in Table 5) were defined based on Eurocode 2 [30] and the cylinder test.
The material model of reinforcements was defined using the bi-linear curve (as shown in Figure 10b)—predefined and named steel01 in OpenSEES [28]. The yield stress, f y , was 400 MPa. The elastic modulus, E, was 200 GPa.
f c =   { f c [ 2 ε c ε c o ( ε c ε c o ) 2 ]                                                                 ε c     ε c o f c ( ε c     ε c o ε c u     ε c o ) · ( f c f c u )                                 ε c   >   ε c o
where f c and ε c are the compressive stress and strain, respectively; f c and f c u are the maximum stress and crushing stress, respectively; ε c o and ε c u are the strain at the maximum stress and crushing stress, respectively; and f c t is the tensile strength of concrete.
Based on the material properties shown in Table 2, the bi-linear model was used for the non-corroded strands. In the case of η ≤ 5%, the material model of corroded strands was defined as shown in Figure 11a. Because the yield properties were not affected significantly by corrosion [18], f p y was unchanged, and the ultimate properties were defined using Equations (6) and (7). The f c . p u can be obtained by dividing F c . p u by the gross sectional area of the strand, A p s . A p s is used to reflect the corrosion effect on the stress–strain curve. In the case of η > 5%, the ultimate properties were lower than the yield properties, and brittle behaviors were observed in the tensile tests. Therefore, the material model of corroded strands was built based on the brittle material model (as shown in Figure 11b) considering only the ultimate properties from Equations (6) and (7), with the stiffness changed to the secant stiffness, E s e . After the f c . p u , a sharp decrease in strength was modeled in both corroded cases to simulate the wire rupture. These were modeled using the multilinear material model predefined in OpenSEES [28].

5. Comparison and Discussion

5.1. Comparison of Evaluation Methods with Test Results

Table 6 shows a comparison of the experimental results and the flexural strength evaluated using the f p s approximation method and the strain-compatibility method. Firstly, in the case of the non-corroded PC beam (RB5), the flexural strength was evaluated to be 346.48 kN using the strain compatibility method, which was 4.39% lower than the nominal flexural strength. On the other hand, the f p s approximation resulted in a flexural strength of 363.66 kN, which was 0.30% higher than the nominal flexural strength. As mentioned earlier, RB5 facing the situation support went slightly out of place, so the evaluation methods were compared to the nominal flexural strength. Secondly, in the cases of specimens, CB2, CB3, and CB4, there were no significant differences in global behavior. These results were caused by the low flexural moment at the location of corrosion—thus, both evaluation methods showed the same flexural strength with RB5. Thirdly, in the case of CB1, which had corrosion in the middle of the span, the flexural strength using the strain compatibility method was 290.26 kN, a 0.14% difference. The f p s approximation method resulted in a flexural strength of 299.22 kN, which was 3.23% higher than the test result.

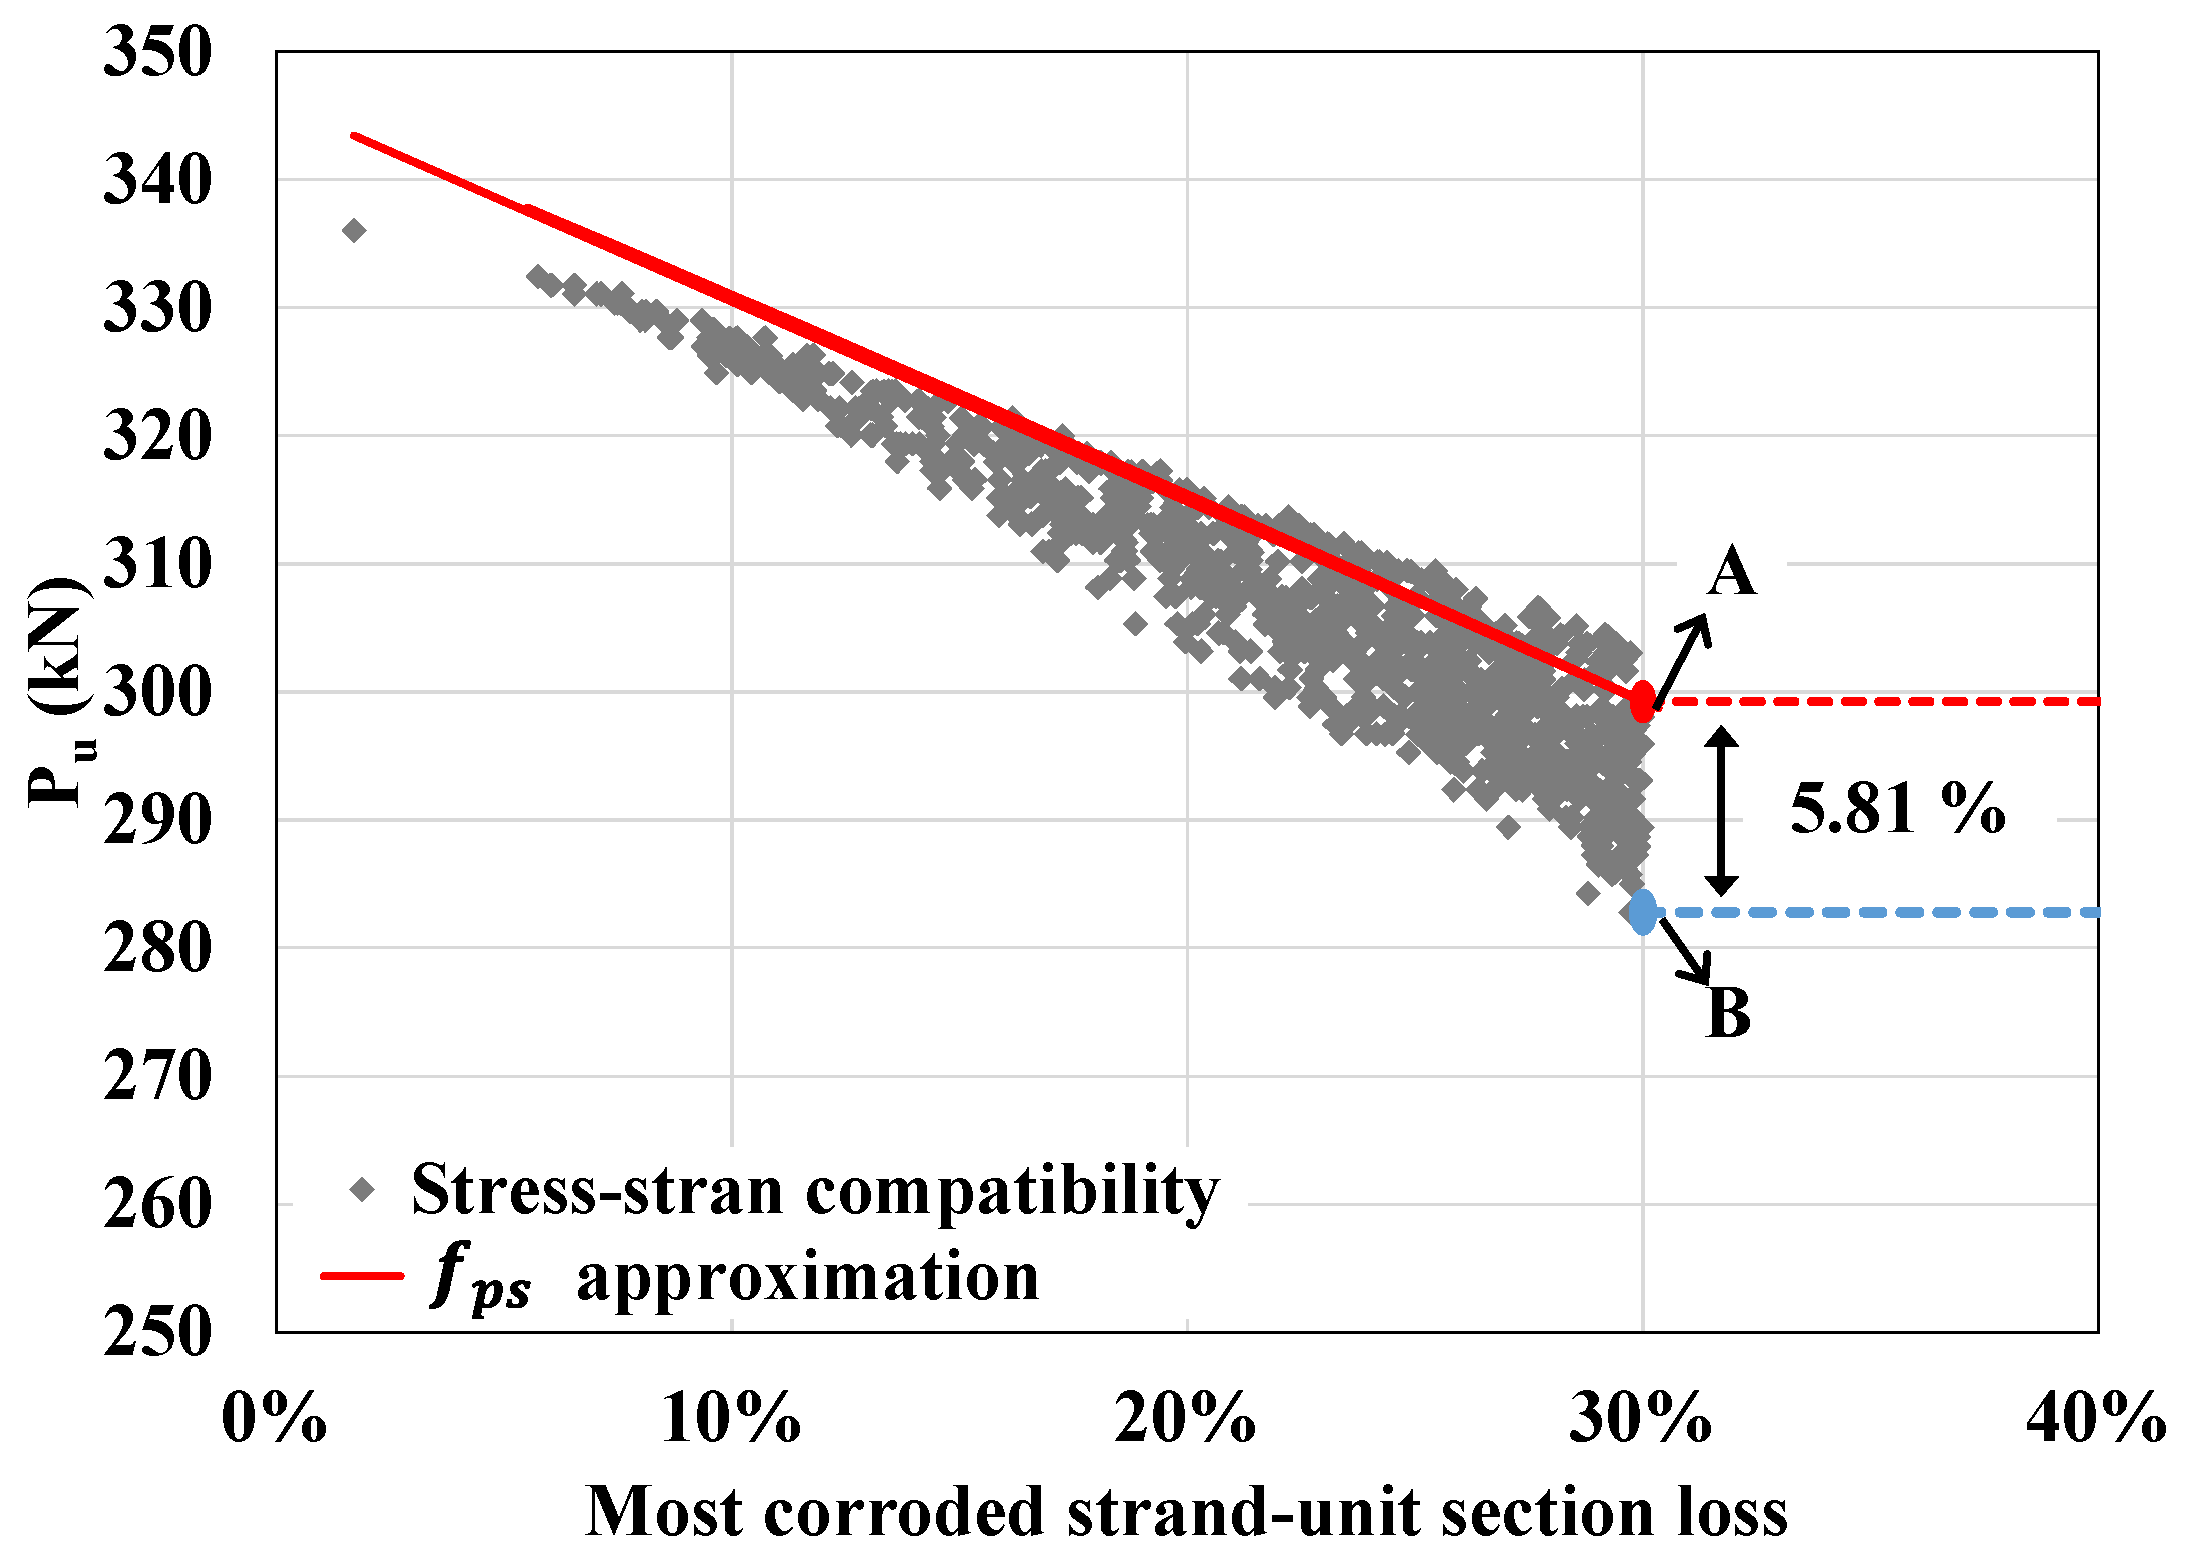
5.2. Comparison between the Methods Using Monte-Carlo Simulation

The strain-compatibility method resulted in relatively more accurate estimations because the f p s approximation method could not include the rapid strain reduction. Furthermore, the material model—as shown in Figure 11b—resulted in the initial stiffness reduction in the corroded strands. Therefore, the three separate models of the strands (in Figure 9) simulated the flexural strength with large variations of total area losses due to corrosion.
To calculate the difference in strength evaluation of the corroded PC beams, between the strain-compatibility method and the f p s approximation method, Monte-Carlo simulation was conducted. The Monte-Carlo simulation is a traditional probabilistic technique and is very useful to evaluate the probability of failure [31]. Random variables for the simulation were the section losses of the strands in the interval of 0 to 30% and applied to the three strands separately. Consequently, the total interval of variables was (0%, 0%, 0%)–(30%, 30%, 30%). Based on the section loss, the material models were changed based on Figure 11.
Figure 12 shows the results of the Monte-Carlo simulation on CB1 with respect to 1000 random variables. Because the f p s approximation method considered only the ultimate strength of the most corroded strand, there was no variation at the same point of cross-sectional loss. Point A denotes the strength at 30% loss, which was 299.22 kN. On the other hand, the strain compatibility method showed a different flexural strength even in the same section loss of the most corroded strand, because it reflected three different corrosion properties, and the variation increased with the amount of section loss. Point B shows the flexural strength to be 282.78 kN when the three strands exhibited section losses of (30%, 30%, 30%). The difference between A and B was 5.81%. When it comes to existing PC beams, only the outer strands in tendons can be inspected for section loss; therefore, it is required to assume that all strands have the same section loss as the inspected most corroded strands. B represents this situation—the result of A provides a somewhat overestimated strength. In addition, this gap could be larger in full-sized PC girders because those had dozens of strands in a tendon
Figure 13 shows the suggested decision-making flow for flexural strength evaluation. Starting with the 5% section loss, the difference in the strength evaluations between the two methods increased, so only the strain compatibility method was proposed when the section loss exceeded 5%. For practical use, we recommend the use of the f p s approximation method in cases where the section loss is less than 5%, or else to the use the strain compatibility, with the assumption that the measured greatest section loss is equal to those of the unmeasurable strands.

6. Conclusions

In this study, a total of five PC beam specimens were fabricated and tested under three-point bending with variables of corrosion location and the level of corrosion. To recommend the evaluation methods for corroded PC beams, the f p s approximation and strain-compatibility methods were evaluated. The material properties of the corroded strands are also proposed herein. The detailed conclusions of this study are as follows:
(1)
From the PC beam loading test, the corrosion of strands located close to the support did not have a significant influence on the global behavior. This was because of the lower flexural moment of the loading and sufficient bond strength between the strands and the surrounding concrete. However, when the beam had tendon-unit section loss of 9.49% in the middle of the span, the ultimate strength of the beam exhibited a 15.56% reduction after the rupture of the third wire.
(2)
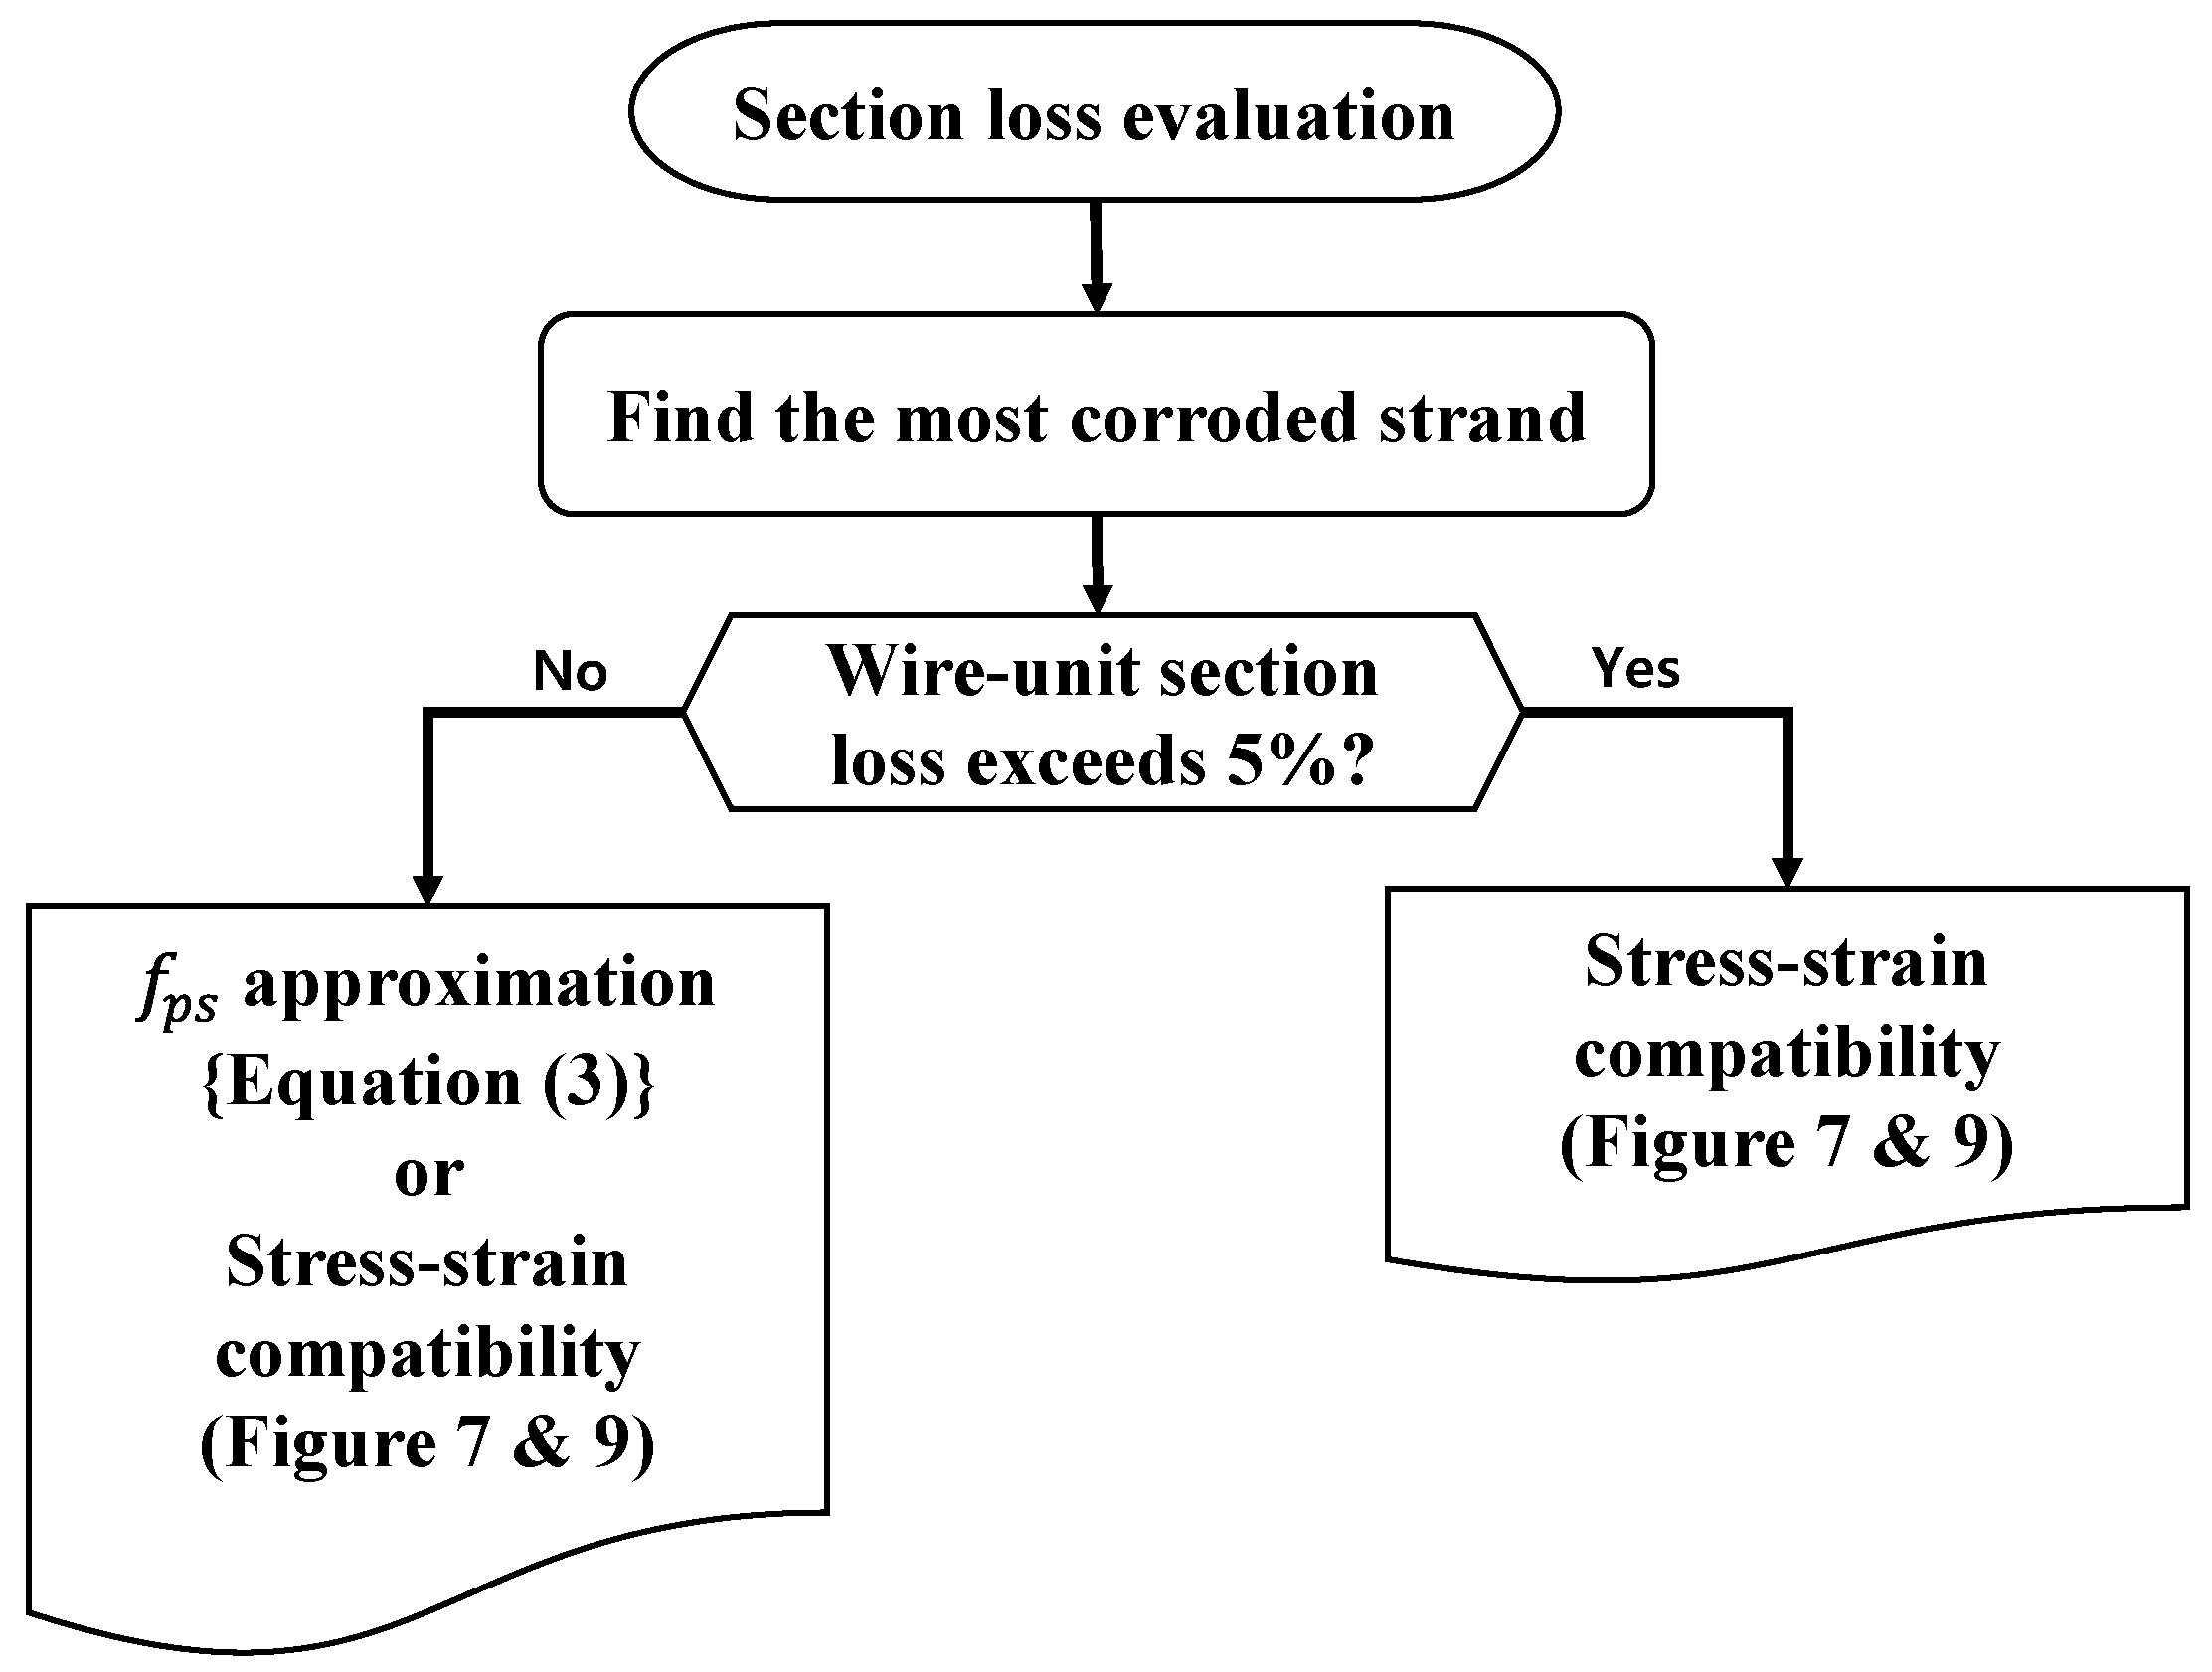
Based on the tensile test results of the corroded strands, the ultimate properties of corroded strands were defined. Because the ultimate strain decreased sharply after section loss of 5%, the material models of the corroded strands were divided into two categories; the bi-linear material model and the brittle material model were used in the cases where the section loss was lower and higher than 5%, respectively.
(3)
Strength evaluations of the corroded PC beams according to the f p s approximation and the strain-compatibility methods using OpenSEES were compared to the test results. The strain compatibility method exhibited relatively higher accuracy with a difference of 1.59% and 0.14% for non-corroded and corroded PC beams, respectively. When PC beams had multiple strands, the strain compatibility method was more practical to apply separately, using different corrosion properties.
(4)
According to the Monte-Carlo simulation, the difference between the evaluated flexural strength based on both methods increased with the level of section loss when the section loss exceeded 5%. Therefore, a decision-making flow chart was proposed, which suggests the use of the strain compatibility method only after a section loss of 5%.

Author Contributions

Conceptualization, C.-S.S.; methodology, C.-S.S. and C.-H.J.; validation, C.-H.J.; formal analysis, C.-H.J.; investigation, C.-H.J.; resources, C.-H.J.; data curation, C.-H.J.; writing—original draft preparation, C.-H.J.; writing—review and editing, C.-S.S and C.-H.J.; visualization, C.-H.J.; supervision, C.-S.S; project administration, C.-H.J.; funding acquisition, C.-S.S. All authors have read and agreed to the published version of the manuscript.

Funding

This study was funded by the Ministry of Land, Infrastructure and Transport (MOLIT) of the Korean government and the Korea Agency for Infrastructure Technology Advancement (KAIA).

Acknowledgments

This study was supported by a grant (18SCIP-B128570-02) from the Smart Civil Infrastructure Research Program funded by the Ministry of Land, Infrastructure and Transport (MOLIT) of the Korean government and the Korea Agency for Infrastructure Technology Advancement (KAIA). This study was also supported by the Chung-Ang University Young Scientist Scholarship in 2016.

Conflicts of Interest

The authors declare no conflict of interest.

References

  1. VDOT. Evaluation of Grout and Strands at 13 Tendon Locations and Selected Vertical PT Bars at Fixed Piers: Maintenance and Repair Using Corrosion Mitigation Systems (Final Report); Virginia Department of Transportation: Richmond, VA, USA, 2013.
  2. Trejo, D.; Hueste, M.B.D.; Gardoni, P.; Pillai, R.G.; Reinschmidt, K.; Im, S.B.; Kataria, S.; Hurlebaus, S.; Gamble, M.; Ngo, T.T. Effect of Voids in Grouted Post-Tesioned Concrete Bridge Construction: Electrochemical testing and Reliability Assessment; Texas Transportation Institute: Austin, TX, USA, 2009. [Google Scholar]
  3. Carsana, M.; Bertolini, L. Corrosion failure of post-tensioning tendons in alkaline and chloride-free segregated grout: A case study. Struct. Infrastruct. Eng. 2015, 11, 402–411. [Google Scholar] [CrossRef]
  4. Pape, T.M.; Melchers, R.E. Performance of 45-year-old corroded prestressed concrete beams. Proc. Inst. Civ. Eng. Struct. Build. 2013, 166, 547–559. [Google Scholar] [CrossRef] [Green Version]
  5. Moawad, M.; El-Karmoty, H.; Zanaty, A.E. Behavior of corroded bonded fully prestressed and conventional concrete beams. HBRC J. 2018, 14, 137–149. [Google Scholar] [CrossRef] [Green Version]
  6. Malumbela, G.; Alexander, M.; Moyo, P. Steel corrosion on RC structures under sustained service loads—A critical review. Eng. Struct. 2009, 31, 2518–2525. [Google Scholar] [CrossRef]
  7. Campione, G.; Cannella, F.; Minafo, G. A simple model for the calculation of the axial load-carrying capacity of corroded RC columns. Mater. Struct. 2015, 49, 1935–1945. [Google Scholar]
  8. Rinaldi, Z.; Imperatore, S.; Valente, C. Experimental evaluation of the flexural behavior of corroded P/C beams. Constr. Build. Mater. 2010, 24, 2267–2278. [Google Scholar] [CrossRef]
  9. Wang, L.; Zhang, X.; Zhang, J.; Ma, Y.; Xiang, Y.; Liu, Y. Effect of insufficient grouting and strand corrosion on flexural behavior of PC beams. Constr. Build. Mater. 2014, 53, 213–224. [Google Scholar] [CrossRef]
  10. Zhang, X.; Wang, L.; Zhang, J.; Liu, Y. Corrosion-induced flexural behavior degradation of locally ungrouted post-tensioned concrete beams. Constr. Build. Mater. 2017, 134, 7–17. [Google Scholar] [CrossRef]
  11. Reis, R.A. Corrosion Evaluation and Tensile Results of Selected Post-Tensioning Strands at the SFOBB Skyway Seismic Replacement Project; California Department of Transportation: Sacramento, CA, USA, 2007. [Google Scholar]
  12. Lu, Z.H.; Li, F.; Zhao, Y.G. An Investigation of Degradation of Mechanical Behaviour of Prestressing Strands Subjected to Chloride Attacking. In Proceedings of the International Conference on Durability of Concrete Structures, Shenzhen University, Shenzhen, China, 30 June–1 July 2016. [Google Scholar]
  13. Wu, X.; Li, H. Effect of Strain Level on Corrosion of Prestressing Steel Strands. In Proceedings of the International Association for Bridge and Structural Engineering, Zurich, Switzerland, 21–23 September 2016; pp. 292–299. [Google Scholar]
  14. Hartt, W.H.; Lee, S.K. Projecting Corrosion-Induced Bridge Tendon Failure Resulting from Deficient Grout: Part I–Model Development and Example Results. Corrosion 2016, 72, 991–998. [Google Scholar] [CrossRef]
  15. Yoo, C.H.; Park, Y.C.; Kim, H.K. Modeling Corrosion Progress of Steel Wires in External Tendons. J. Bridg. Eng. 2018, 23, 04018098. [Google Scholar] [CrossRef]
  16. Jeon, C.H.; Lon, S.; Shim, C.S. Equivalent material model of corroded prestressing steel strand. J. Mater. Res. Technol. 2019, 8, 2450–2460. [Google Scholar] [CrossRef]
  17. Lee, J.B.; Lee, Y.J.; Shim, C.S. Probabilistic prediction of mechanical characteristics of corroded strands. Eng. Struct. 2020, 203, 203. [Google Scholar] [CrossRef]
  18. Jeon, C.H.; Nguyen, C.D.; Shim, C.S. Assessment of Mechanical Properties of Corroded Prestressing Strands. Appl. Sci. 2020, 10, 4055. [Google Scholar] [CrossRef]
  19. Korean Standards Association. KS D 7002: Uncoated Stress-Relieved Steel Wires and Strands for Prestressed Concrete; Korean Standards Association: Seoul, Korea, 2011. (In Korean)
  20. Lee, B.S.; Koh, K.T.; Ismail, M.A.; Ryu, H.S.; Kwon, S.J. Corrosion and Strength Behaviors in Prestressed Tendon under Various Tensile Stress and Impressed Current Conditions. Adv. Mater. Sci. Eng. 2017, 2017, 1–7. [Google Scholar] [CrossRef] [Green Version]
  21. Li, F.; Yuan, Y. Effects of corrosion on bond behavior between steel strand and concrete. Constr. Build. Mater. 2013, 38, 413–422. [Google Scholar] [CrossRef]
  22. Kaba, K.; Watanabe, S.; Yoshikawa, T.; Saito, S. Experimental study on the effect of PC tendon rupture on load-carrying capacity of PC girder. J. Struct. Eng. A. 2020, 66A, 725–732. [Google Scholar]
  23. Wang, L.; Zhang, X.; Zhang, J.; Dai, L.; Liu, Y. Failure analysis of corroded PC beams under flexural load considering bond degradation. Eng. Fail. Anal. 2017, 73, 11–24. [Google Scholar] [CrossRef]
  24. Korean Standards Association. KS D 3504: Steel Bars for Concrete Reinforcement; Korean Standards Association: Seoul, Korea, 2011. (In Korean)
  25. Coronelli, D.; Castel, A.; Vu, N.A.; Fancois, R. Corroded post-tensioned beams with bonded tendons and wire failure. Eng. Struct. 2009, 31, 1687–1697. [Google Scholar] [CrossRef]
  26. ASTM A416/A416M-18. Standard Specification for Low-Relaxation, Seven-Wire Steel Strand for Prestressed Concrete; ASTM International: West Conshohocken, PA, USA, 2018. [Google Scholar]
  27. ACI Committee 318. Building Code Requirements for Structural Concrete (ACI 318-14); American Concrete Institute: Farmington Hills, MI, USA, 2015. [Google Scholar]
  28. McKenna, F.; Fenves, G.L. Open System for Earthquake Engineering Simulation (OpenSees); Pacific Earthquake Engineering Research Center (PEER), University of California: Berkeley, CA, USA, 2004. [Google Scholar]
  29. Kent, D.C.; Park, D. Flexural members with confined concrete. J. Struct. Div. 1971, 97, 1969–1990. [Google Scholar]
  30. British Standards Institution. Eurocode 2: Design of Concrete Structures; British Standard; BSI: London, UK, 2008. [Google Scholar]
  31. Ferreira, R.M. Probability-Based Durability Analysis of Concrete Structure in Marine Environment. Ph.D. Thesis, Department of Civil Engineering, School of Engineering, University of Minho, Braga, Portugal, 2004. [Google Scholar]
Figure 1. Detailed drawing of the prestressed concrete (PC) beam specimens.
Applsci 10 07994 g001
Figure 2. Induction of electrochemical corrosion using the impressed current method (ICM).
Applsci 10 07994 g002
Figure 3. Section loss measurement using (a) pit depth gauge and (bd) three idealized pit configurations [16,18].
Applsci 10 07994 g003
Figure 4. Test setup.
Applsci 10 07994 g004
Figure 5. Load-displacement behaviors from test results.
Applsci 10 07994 g005
Figure 6. Deconstruction of CB1 after the loading test. (a) Side view, (b) failed section of 1st corroded strand, (c) failed section of 2nd corroded strand.
Applsci 10 07994 g006
Figure 7. Tensile test results of corroded strands, (a) relationship between the ultimate load and the wire-unit section loss, (b) relationship between the ultimate tensile strain and the wire-unit section loss.
Applsci 10 07994 g007
Figure 8. Tensile test results of corroded strands.
Applsci 10 07994 g008
Figure 9. Analysis model for PC beams in OpenSEES.
Applsci 10 07994 g009
Figure 10. Material models for (a) concrete and (b) reinforcement.
Applsci 10 07994 g010
Figure 11. Material models of corroded strands in case of (a) η ≤ 5% (b) η > 5%.
Applsci 10 07994 g011
Figure 12. Monte-Carlo simulation of CB1.
Applsci 10 07994 g012
Figure 13. Flow chart for strength evaluation of corroded PC beams.
Applsci 10 07994 g013
Table 1. Beam test specimens.
ID# of Corroded StrandsCorrosion LocationWire-Unit Section Loss
( l e b )
Strand-Unit Section Loss
( l e b )
Tendon-Unit Section Loss
( l e b )
CB12Midspan30.22%
(6596 mm)
14.26%
(1003 mm)
9.49%
(571 mm)
CB23300 mm from support22.54%
(2665 mm)
9.51%
(573 mm)
8.84%
(529 mm)
CB3229.02%
(5725 mm)
10.71%
(660 mm)
6.89%
(420 mm)
CB4319.55%
(1872 mm)
6.94%
(423 mm)
6.80%
(416 mm)
RB50----
Table 2. Mechanical properties of materials.
Rebars
(KS D 3504)
Concrete
(Cylinder Test)
Strands
(Tensile Test)
σ y : 400 MPa
σ u : 560 MPa
E s : 200 GPa
σ c : 44.07 MPa σ p y : 1652 MPa
σ p u : 1883 MPa
E p s : 195 GPa
ε p u : 0.0752
Table 3. Test results of PC beam specimens.
IDCracking Load
(kN)
Maximum Load
(kN)
Failure Mode
CB1130289.84
(when 1st wire failed)
Compressive concrete crush after rupture of six wires
CB2140354.27Compressive concrete crush
CB3140367.75Compressive concrete crush
CB4140362.11Compressive concrete crush
RB5140361.13Compressive concrete crush
Table 4. Inspection of corroded wires in CB1.
StrandWiresSection LossStrandWiresSection Loss
1st strandCore wire-2nd strandCore wire-
130.22%118.45%
213.03%20.00%
311.66%317.26%
416.52%413.83%
53.09%529.77%
627.59%623.11%
Table 5. Mechanical properties of concrete for material model
f c t f c f c u ε c o ε c u
3.5 MPa44.07 MPa0.85× σ c = 37.46 MPa0.002380.0035
Table 6. Flexural strength comparison between the test results and the evaluation methods.
IDMaximum Loads of...
ExperimentStrain Compatibility
(Difference)
f p s Approximation
(Difference)
CB1289.84 kN
(when 1st wire failure)
290.27 kN
(0.14%)
299.22 kN
(3.23%)
CB2339.08 kN346.48 kN
(−4.39% from nominal strength)
363.66 kN
(0.30% from nominal strength)
CB3352.07 kN
CB4336.63 kN
RB5352.07 kN
Publisher’s Note: MDPI stays neutral with regard to jurisdictional claims in published maps and institutional affiliations.

