Review

Application of Corrected Methods for High-Resolution XRF Core Scanning Elements in Lake Sediments

Institute for Ecological Research and Pollution Control of Plateau Lakes, School of Ecology and Environmental Science, Yunnan University, Kunming 650500, China
*
Author to whom correspondence should be addressed.
Appl. Sci. 2020, 10(22), 8012; https://doi.org/10.3390/app10228012
Submission received: 29 October 2020 / Revised: 10 November 2020 / Accepted: 10 November 2020 / Published: 12 November 2020
(This article belongs to the Section Earth Sciences)

Abstract

:
Contemporary studies emphasize theoretical and analytical aspects of monitoring water quality within lacustrine settings. The X-ray fluorescence (XRF) core scanner provides the most rapid, non-destructive high-resolution elemental measurements for unprocessed sediments. However, the analytical precision of measured elemental composition may be offset due to water content and inhomogeneities in the physical properties of the sediment. A range of calibration approaches developed specifically for converting XRF scanning intensities to element fractions has been made available. Here, two lake sediment-cores retrieved from southwest China were used to evaluate the performance of various calibration methods. In particular, the influence of sediment properties on XRF scanning intensities was assessed by redundancy analyses (RDA) and the generalized additive model (GAM). The results demonstrate that for fine-grained sediments, the impact of grain size results in only minor deviations in the XRF scanning intensities. Water content of the lake sediment was shown to be the most important factor influencing the XRF scanning intensities, especially for light elements (e.g., Al to Fe). Significant decreases in XRF scanning intensities may occur when sediment water content is greater than 47%. We recommend testing the element fractions obtained via conventional techniques throughout the core and applying the multivariate log-ratio calibration for high-resolution XRF scanning elements within lake sediments.

Graphical Abstract

1. Introduction

The X-ray fluorescence (XRF) core scanner (hereafter “XRF-scan”) provides a rapid, cost-effective and non-destructive means of obtaining high-resolution elemental measurements and has been widely used in climatic and environment studies [1,2,3,4,5,6]. However, the elemental intensities determined from wet sediments using the XRF core scanner are heavily influenced by the sediment properties (i.e., grain size, water content and surface elevation) of the core [7,8,9,10,11,12,13,14], particularly for high-resolution scans [10]. In such cases, the XRF-scan results are typically presented as intensities of detected elements, usually in counts or counts per second, rather than quantitative results [10]. Comparisons between the XRF-scan with conventional destructive techniques for determining element geochemistry (e.g., ICP-MS, ICP-OES, EDP-XRF and WD-XRF) in which the influences of sediment inhomogeneities were removed, could yield quantitative element weighted-proportions or mass fractions (in percentage or mg/kg; hereafter referenced as “conventional-fractions”) [7,10,11,15,16]. However, conventional approaches are time-consuming, low resolution and require a large amount of sample material [7,11]. Various studies have attempted to transform XRF-scan data to conventional element fraction data using a range of methods, with linear regression being the most common [1,8,9,17]. Weltje and Tjallingii [10] applied various non-linear functions to transform XRF-scan intensities into fractions. Other studies have employed element ratios to reduce analytical uncertainties caused by inhomogeneous sediment properties [3,12,18,19,20]. Unfortunately, these ratios are insufficient to enable rigorous statistical analysis of compositional data [10].
Several normalized calibration methods and log-ratio calibration models which convert XRF-scan intensities to conventional element fractions have been developed, such as the normalized median-scaled (NMS) calibration [9], the normalized polynomial-scaled (NPS) calibration [7], the log-ratio calibration equation (LRCE) [10] and the multivariate log-ratio calibration (MLC) model [21]. The performance of specific calibrations has been investigated in some detail, for instance Weltje et al. [21] evaluated the log-ratio methods LRCE and MLC, whilst Chen et al. [7] compared the NMS, NPS and MLC methods. Furthermore, Dunlea et al. [16] compared the linear calibration, LRCE and MLC methods. However, to our knowledge, there is no comprehensive evaluation of each of these XRF-scan calibrations. In addition, the impact of sediment properties on XRF-scan intensities remains unclear.
In the present study, we evaluated the NMS [9], NPS [7], LRCE [10] and MLC [21] calibration methods by utilizing high-resolution XRF-scan results from a lake sediment core (FXH-B2). This was achieved via: 1) comparing the calibrated XRF-scan intensities with their known elemental fractions; and 2) quantitative evaluation of the calibration performance using the mean squared relative error (MSRE) of elements. The most suitable calibration method was then applied to a separate 18.12 m-long sediment core (LGH2) to assess the extent to which specific sediment properties (i.e., grain size and water content), affected the XRF-scan results.

2. Description of the Calibration Methods

For conventional XRF techniques, calibration involves converting XRF-scan intensities to element fractions; the calibration is achieved using the following equation [22,23]:
W i j = K j · I i j · M i j · S i
where W i j represents the fraction of element j in specimen I, I i j represents the net intensity of element j in specimen I, K j represents the sensitivity or detection efficiency of the measurement device, M i j refers to matrix effects which scatter, absorb or enhance the intensity of element j by other elements in specimen I, and S i represents specimen effects relative to the sediment properties. In conventional XRF measurements, detection efficiency K j and specimen effects S i are fixed, and the element fraction W i j is estimated from its intensity I i j with a correction factor given by matrix effects ( M i j ) [10]. However, the specimen effects S i are not constant due to inhomogeneous sediment properties (grain-size distribution and water content) within sediment cores. Two types of calibrations have been developed to eliminate such specimen effects. One is the normalized calibration, which scales the XRF-scan intensities to the scale of conventional-fractions and then normalizes to percentages (%) prior to subsequent calibration, including the NMS calibration [9] and the NPS calibration [7]. The other is the log-ratio calibration included in LRCE [10] and the improved MLC calibrations [21] whereby the ratio of XRF-scan intensities and their log transformations are used during the calibration.

2.1. Normalized Median-Scaled (NMS) Calibration

The NMS calibration involves three stages: (i) the XRF-scan intensities are scaled to the range of element compositions using the median value of conventional-fractions, which attempts to reduce the specimen effects (see detail in [9]); (ii) the scaled data are normalized by constraining the sum of element components of each sample to 100%; and (iii) the normalized XRF-scan data rather than the raw XRF-scan intensities are converted to element fractions using linear regression equations.

2.2. Normalized Polynomial-Scaled (NPS) Calibration

The NPS calibration includes the same procedures as the NMS calibration, except for the scaling and normalization process [7]. The NPS employs quadratic polynomial fits instead of median values (as in NMS) to scale the XRF-scan intensities, which eliminates the influences of temporal variations in water content (see detail in [7]). Thereafter, the polynomial-scaled value is normalized to the sum of conventional-fractions for all element components rather than being constrained to unity [7].

2.3. Log-Ratio Calibration Equation (LRCE)

For the LRCE calibration, the conventional-fractions and its overlapping XRF-scan intensities were first transformed using an additive log-ratio (alr) transformation, in which one of the tested elements was selected as the denominator/additive, to eliminate specimen effects [10]. This resulted in a linear relationship between alr-transformed element fractions and its XRF-scan intensities. Therefore, the alr-transformed element of long-core sediment can be calculated using linear regression equations. As such, the element fractions from our sediment cores were obtained by applying the inverse log-ratio transformation [10].

2.4. Multivariate Log-Ratio Calibration (MLC)

The MLC is a multivariate extension of the LRCE calibration [21]. The centered log-ratio (clr) transformation whereby the geometric mean of all elements in each specimen is used as the denominator of the ratios solves the selection problem of the denominator element in LRCE. Partial least squares regression was employed to calculate the clr-transformed elements to element fractions (see details in [21]). Furthermore, an “undef” parameter is introduced to represent the union of all elements which have not been detected by the XRF-scan (i.e., carbon, oxygen and nitrogen) and by the conventional destructive techniques used to provide the reference element fractions for calibration. The LRCE and MLC approaches have been implemented in a software package XELERATE (http://www.ascar.nl/).

3. Materials and Analytical Methods

3.1. Cores

Two lake sediment cores drilled using a UWITEC platform and piston corer (http://www.uwitec.at/) were obtained from Southwestern China in order to investigate geochemical variations with grain size and water content in lithogenic sediments. The lake watersheds of the two lakes are mainly underlain by limestone, mudstone, shale, sandstone and Quaternary alluvium (Figure 1).
Lake Fuxian is the second deepest freshwater lake in China; it has a maximum depth of 158.9 m and a surface area of 216.6 km2 [24]. Core FXH-B2 (24°24′57.48″ N, 102°52′6.24″ E, 1722.5 m a.s.l.) is 2.96-m long and was retrieved from the southern part of Lake Fuxian in a water depth of 76.8 m (Figure 1a).
Lake Lugu is an alpine fresh-water lake with a surface area of 57.7 km2. Core LGH2 is 18.12-m long and retrieved from the southern basin of Lake Lugu (27°40′49″ N, 100°48′06″ E, 2692.2 m a.s.l.) in a water depth of 41.3 m (Figure 1b). All collected core segments were split into two halves. One half was used for the XRF-scan, and the other half was subsampled at 1-cm intervals and freeze-dried for further investigations. The sediment lithology of core FXH-B2 is dominated by brown clay and dark-brown silt [24]. Core LGH2 is mainly composed of dark clay and dark-gray silt, occasionally intercalated with thin layers of dark-gray sand.

3.2. Sampling and Analyses

The split sections of cores FXH-B2 and LGH2 were flattened and then covered by a thin (4 μm) Ultralene film to avoid water film formation and contamination of the measurement prism of the core scanner. Geochemical measurements were undertaken at 5-mm intervals using the Avaatech XRF core scanner (Avaatech B.V., Nederland; http://www.avaatech.com/), located at Yunnan Normal University, in which a rhodium anode X-ray tube was used as the X-ray source. Separate scans at three voltages were carried out: (i) at 0.75 mA for 10 s using no filter, and tube voltages set to 10 kV (for Al, Si, K, Ca, Ti, Mn, Fe); (ii) at 0.5 mA for 20 s using a Pd-thin filter, with the tube voltage set to 30 kV (for Cu, Zn, Rb, Sr, Zr, Pb); and (iii) at 0.75 mA for 30 s using a Cu filter, with the tube voltage set to 50 kV (for Ba). The X-ray illumination area was set at 0.5 cm in the down-core direction and 0.2 cm in the cross-core direction for core FXH-B2, and 0.2 cm in the down-core direction and 1.2 cm in the cross-core direction for core LGH2. All scans were run down the center of the split core.
In order to calibrate the XRF-scan intensities, 74 samples at 4-cm increments in core FXH-B2 and 26 samples at 60-cm increments in core LGH2 were selected for elemental proportions measurements. Prior to the measurements, samples were freeze-dried and compressed into powder pellets. The element proportions were determined by conventional XRF methods using a PANalytical Axios Advanced PW4400 X-ray Fluorescence (WD-XRF; Malvern Panalytical Ltd., Malvern, Worcestershire, U.K.; https://www.malvernpanalytical.com/en/products/product-range/axios-fast) spectroscope at the Institute of Earth Environment, Chinese Academy of Sciences. The analytical uncertainties are estimated to be 1−2% for all major metals, and the relative standard deviation is <5% for the trace metals.
Sediment samples from core LGH2 were obtained at 1-cm intervals for determination of water content and grain-size distributions. Water content was measured by weighting the samples prior to and after freeze-drying. Samples for grain-size analysis were pretreated with 10% H2O2 to remove organic matter and then washed with 10% HCl to remove carbonates. Finally, they were rinsed with deionized water and dispersed with 10 mL of 0.05 mol L–1 (NaPO3)6 in an ultrasonic vibrator for 10 min. Grain-size distributions between 0.02 μm and 2000 μm were measured using a Malvern Mastersizer 2000 laser grain-size analyzer (Malvern Panalytical Ltd., Malvern, Worcestershire, U.K.; https://www.malvernpanalytical.com/en/products/product-range/mastersizer-range/mastersizer-2000) and assigned to 100 size classes.

3.3. Data Processing

The obtained XRF-scan intensities of core FXH-B2 were calibrated to element fractions by the aforementioned calibration methods (the calibrated XRF-scan intensity hereafter called “calibrated-XRF”). The XRF-scan data was directly compared with conventional-fractions and calibrated-XRF results. Forty samples (hereafter “reference samples”), for which conventional-fraction data from core FXH-B2 were available, were used to convert XRF-scan intensities to calibrated-XRF element fractions. The remaining 34 samples (hereafter “remaining samples”) of conventional-fractions were used to evaluate the differences between the XRF-scan data and conventional-fractions and to assess the performance of the different calibrations. A squared relative error (SRE) and mean squared relative error (MSRE) of elements, as presented below, were used to measure the goodness-of-fit to perform the evaluation:
S R E =   1 n p = 1 n [ ( C p q C q M · W q M W p q ) / W p q ] 2
M S R E =   1 D q = 1 D S R E
where n and D represent the number of the remaining samples and number of the calibrated elements, respectively, W q M and C q M represent the median values of the remaining conventional-fractions and remaining XRF-scan/calibrated-XRF of element q, respectively, and W p q and C p q are the conventional-fraction and XRF-scan/calibrated-XRF of element q at depth p, respectively.

4. Results

4.1. Experimental Results

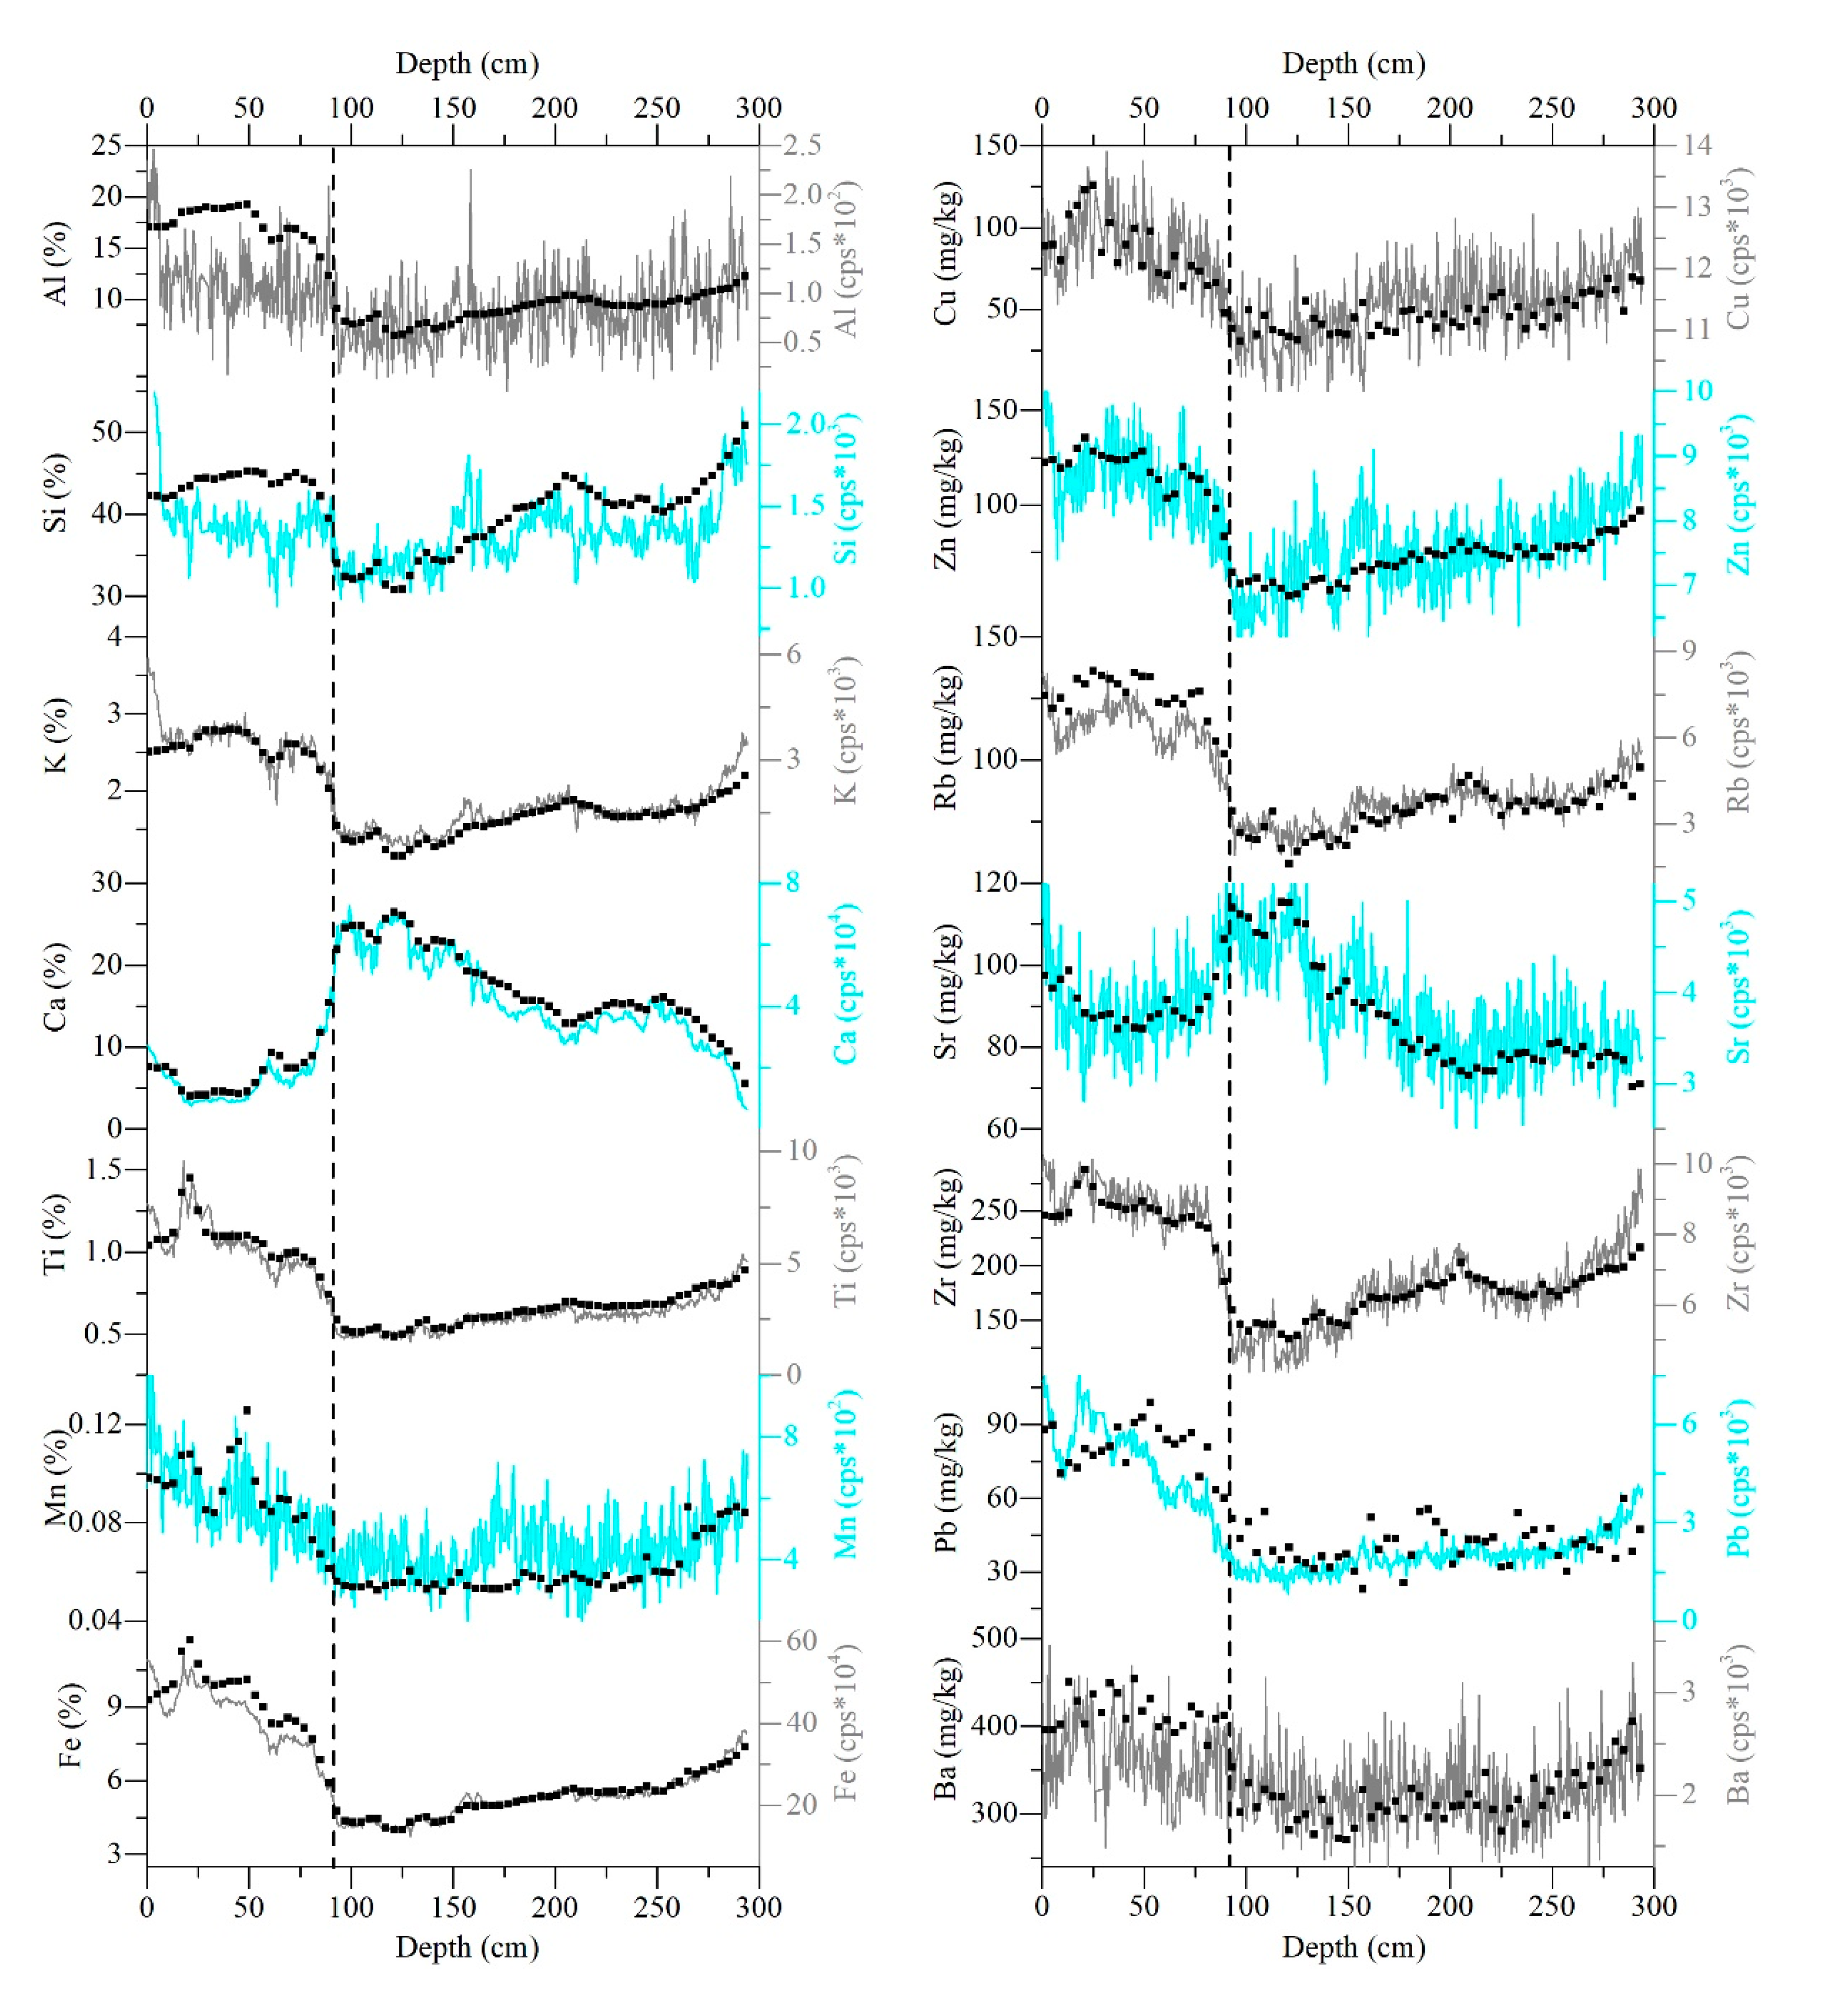
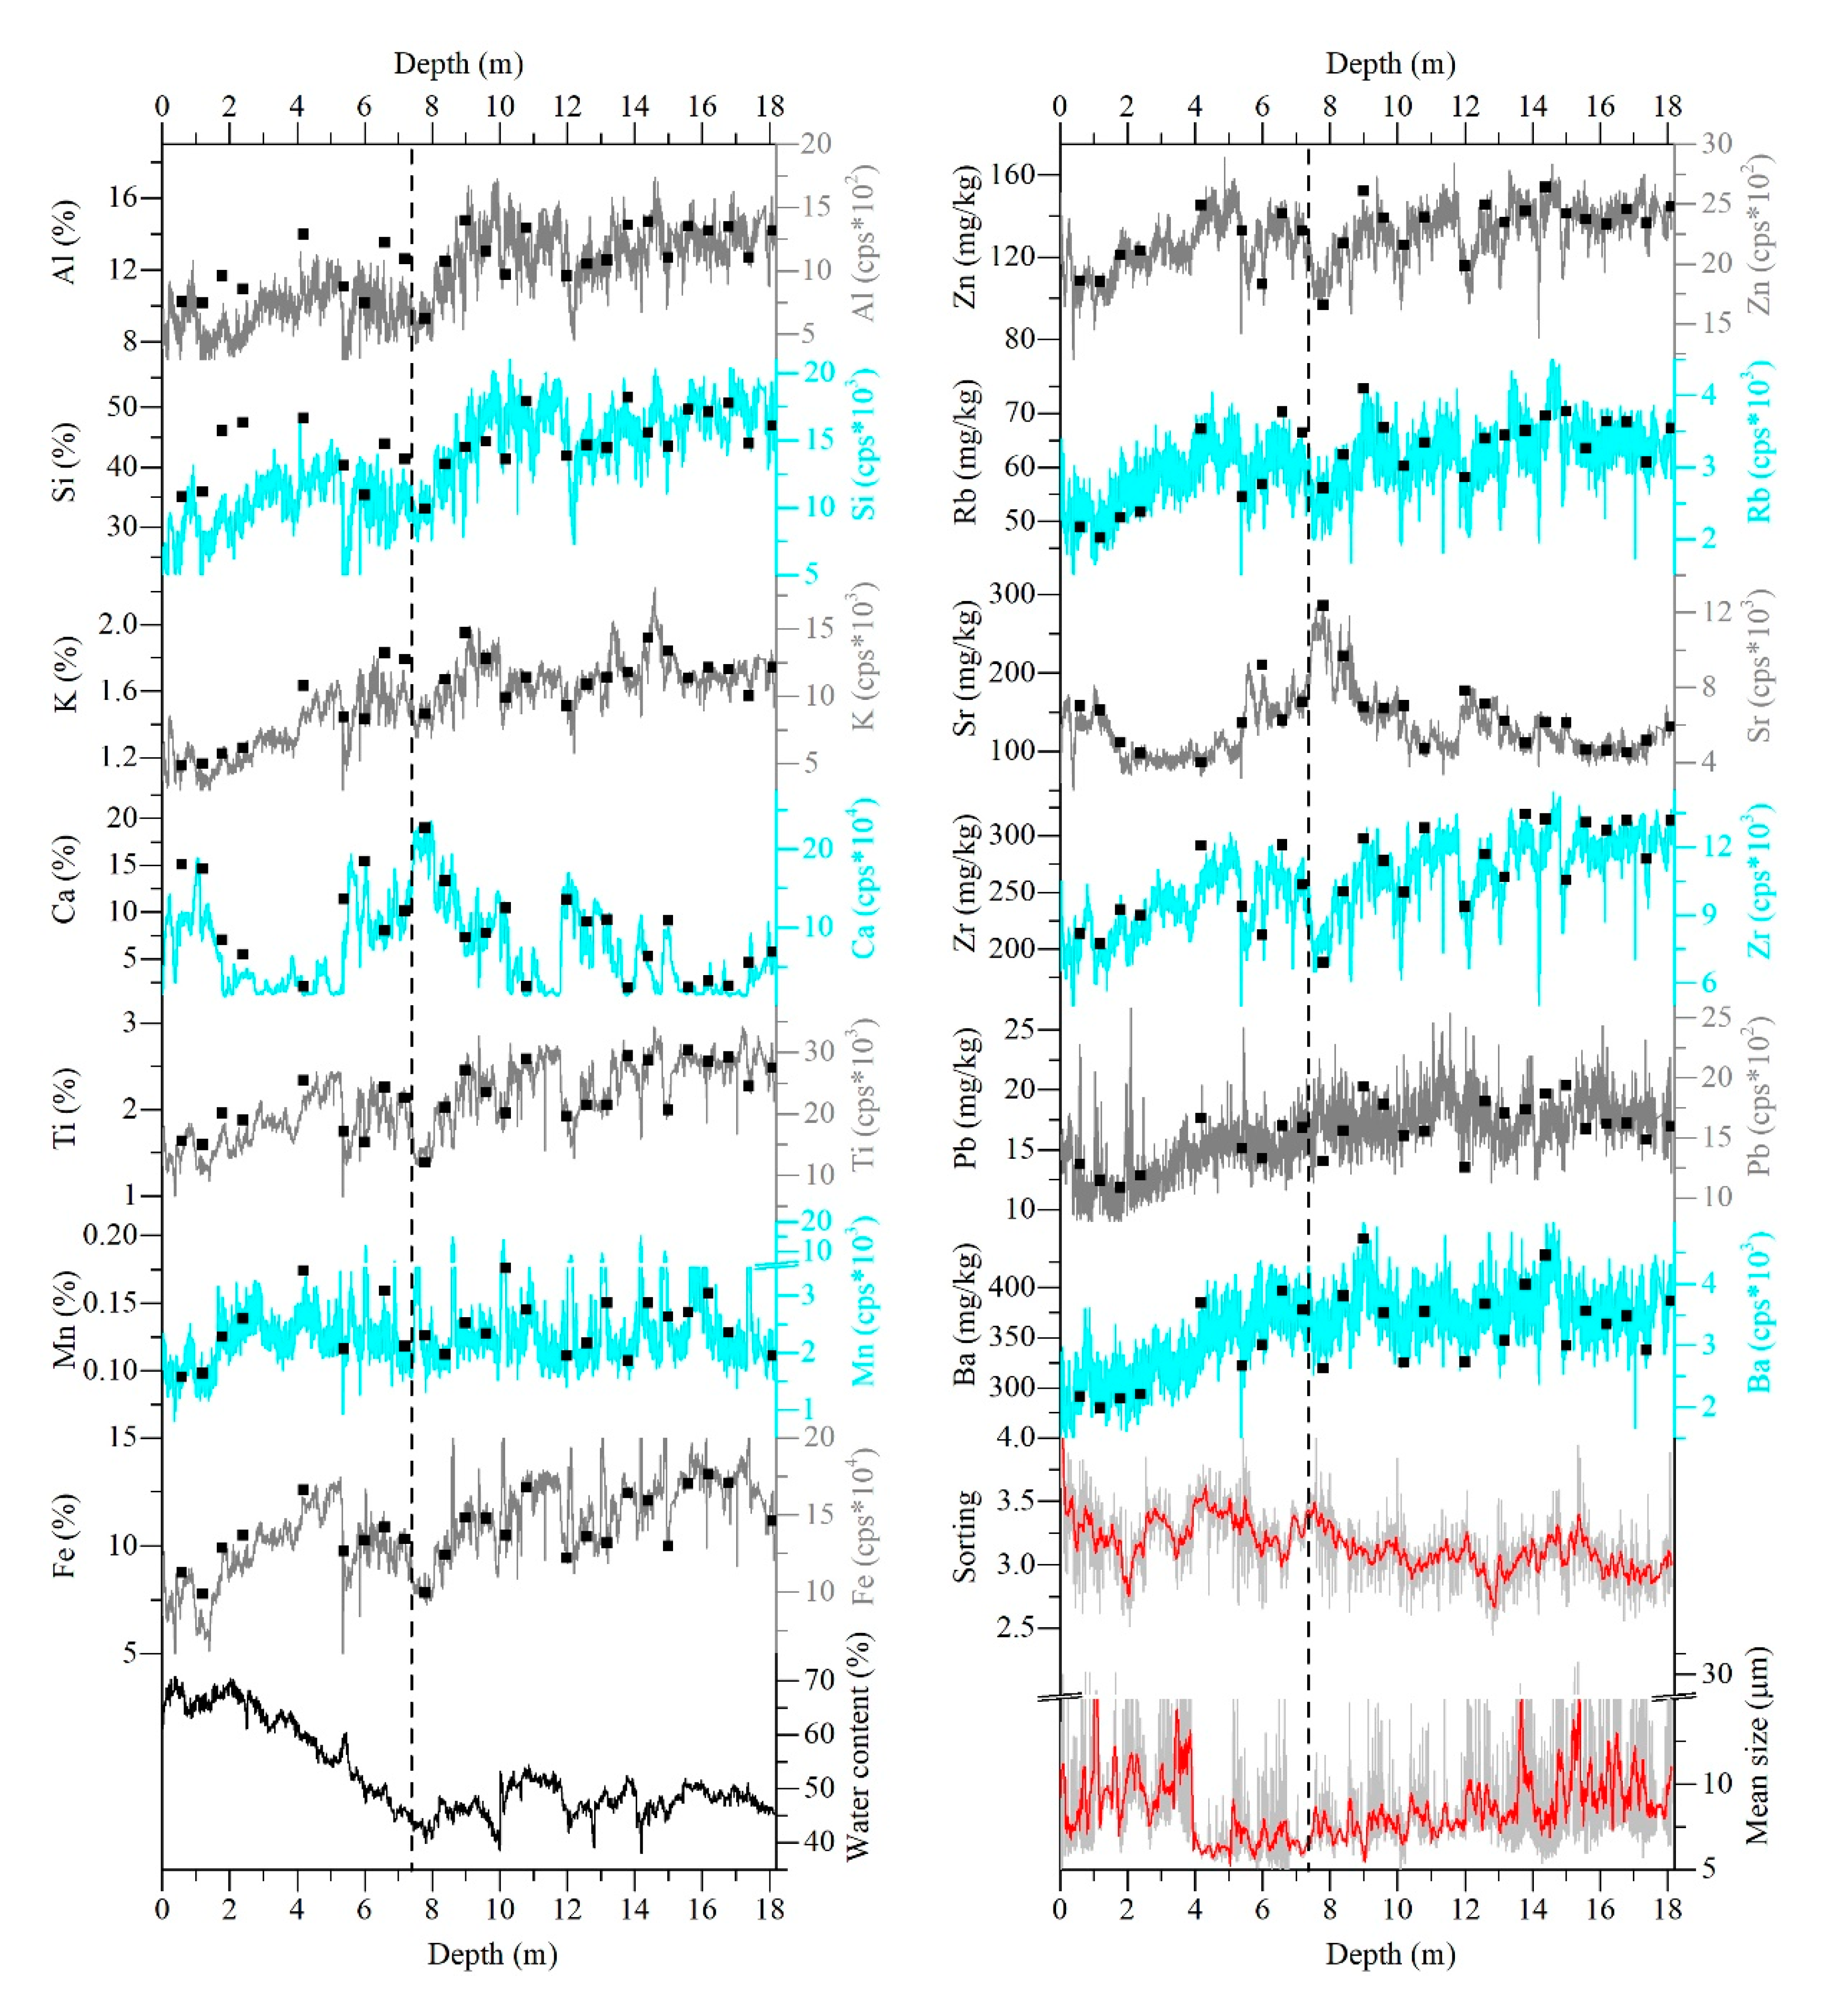
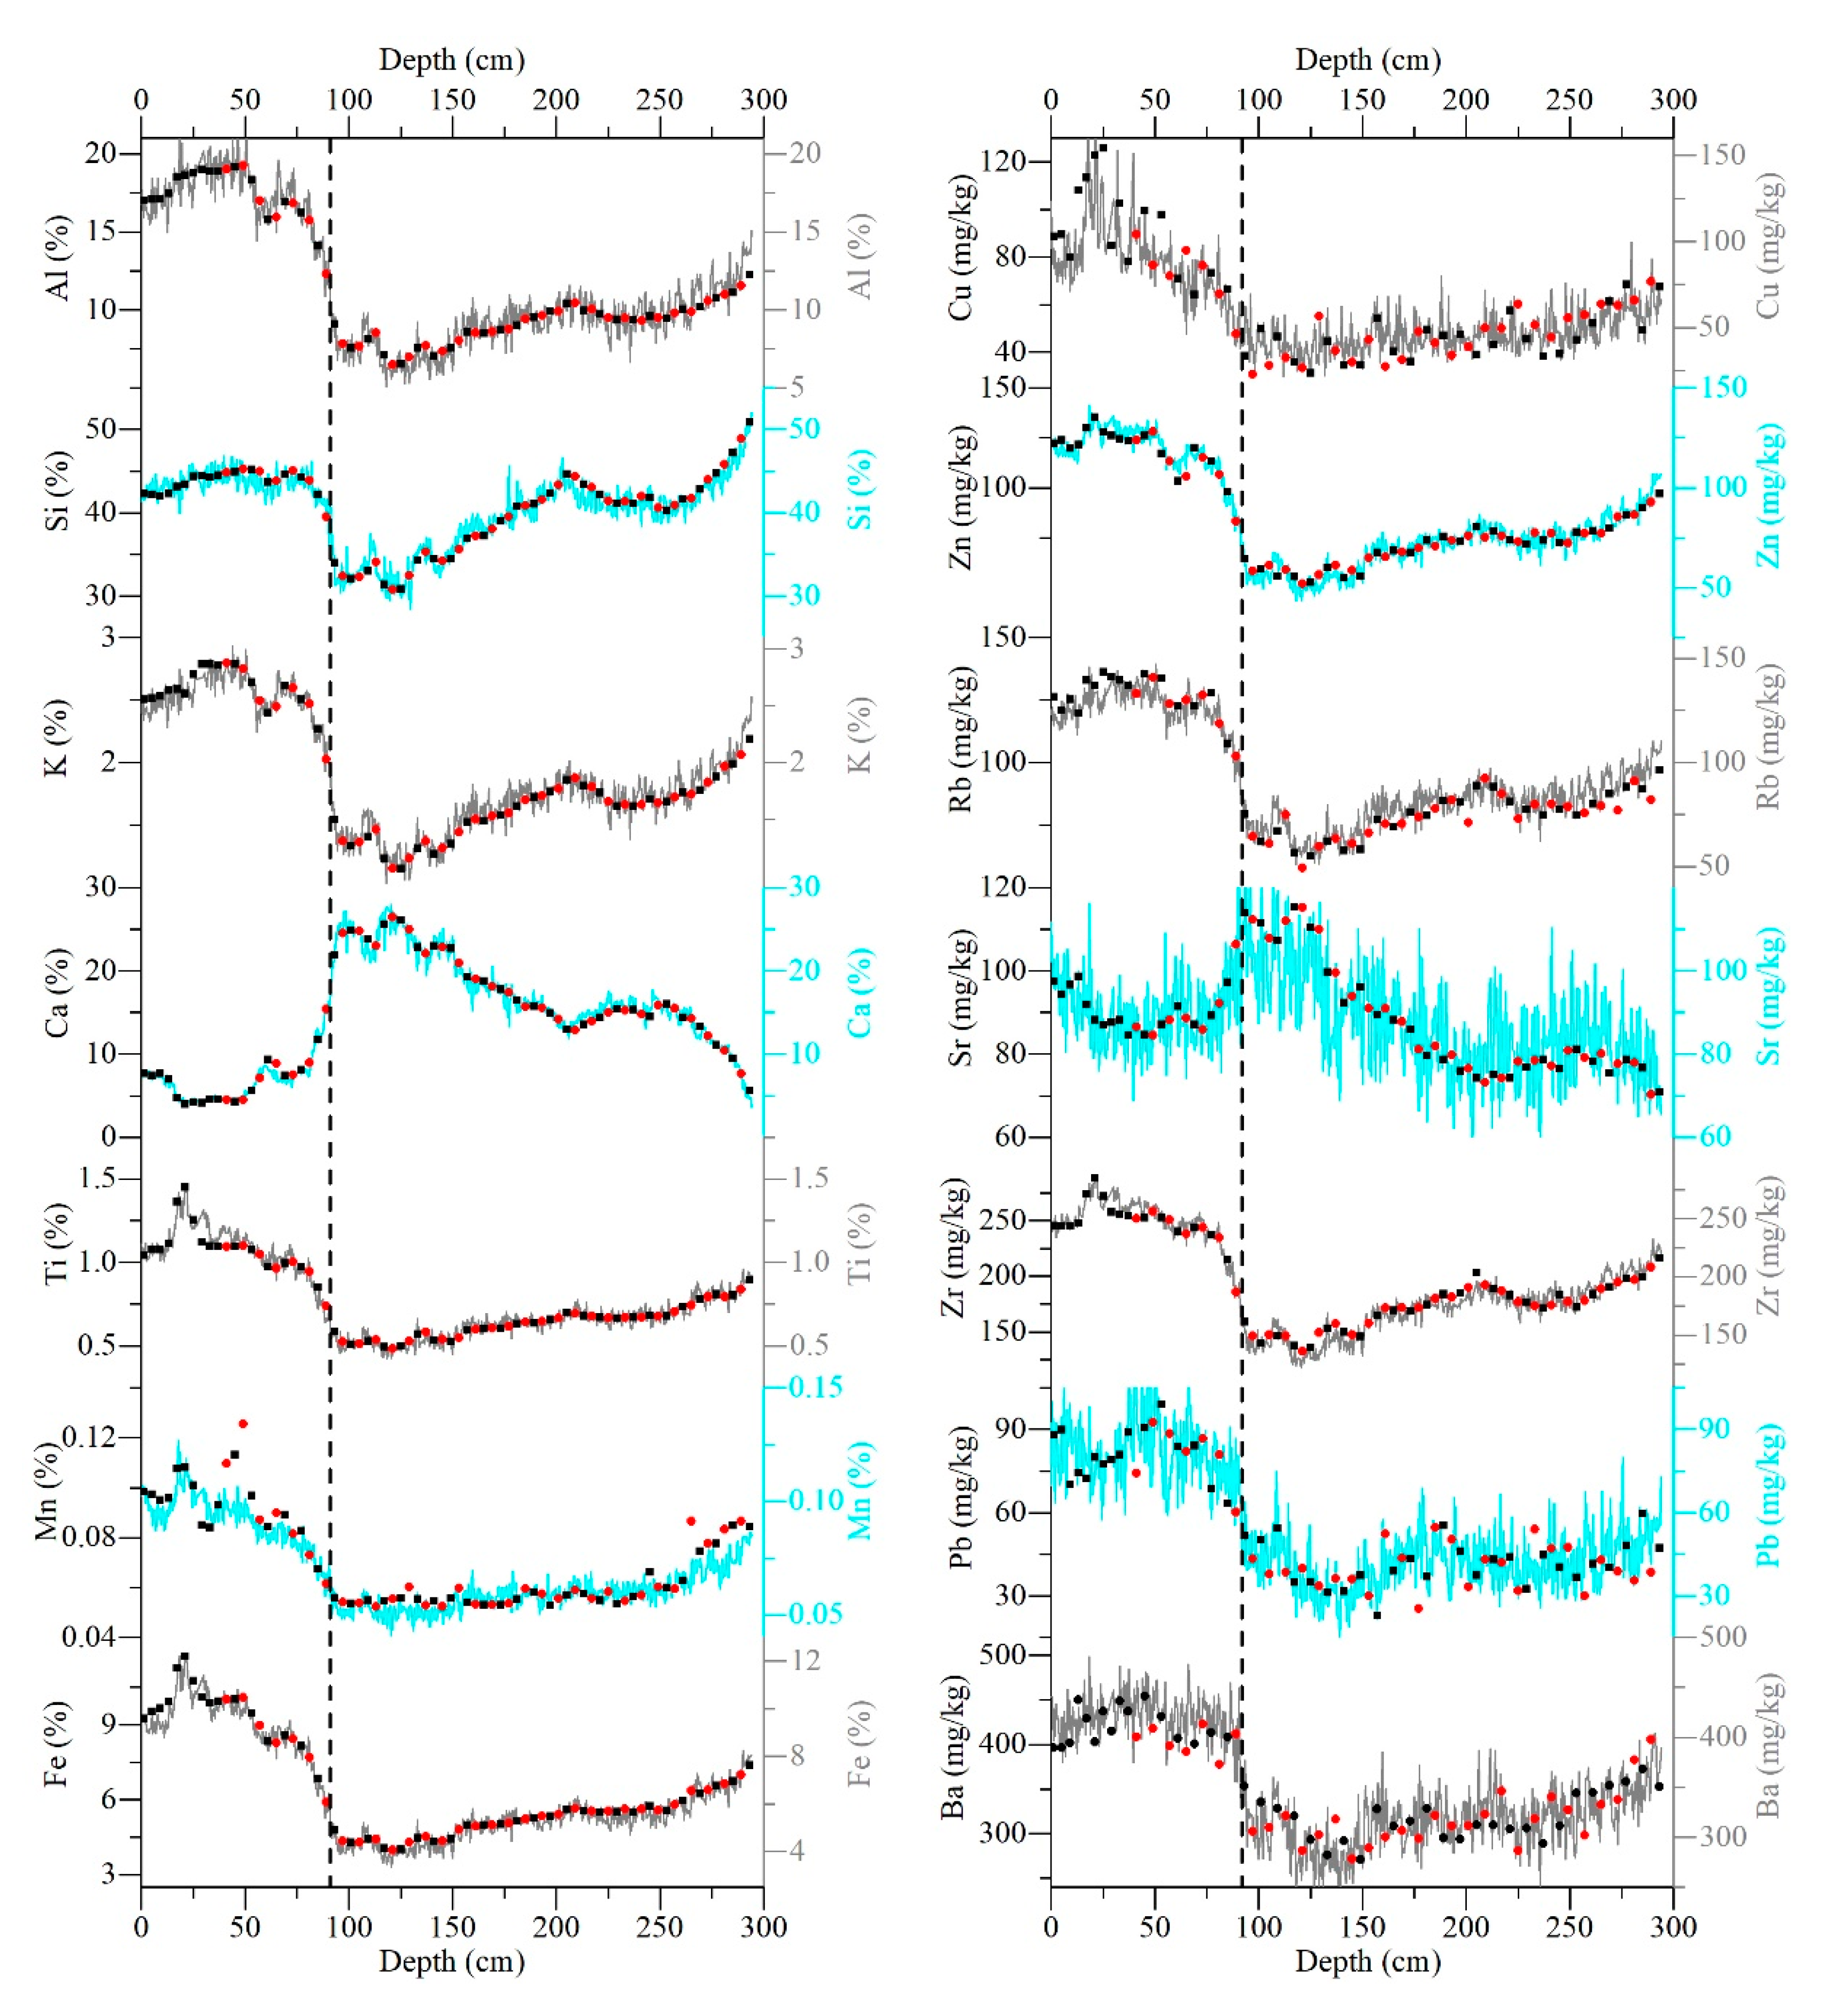
The XRF-scan intensities coupled with element fractions obtained in Core FXH-B2 and LGH2 are reported in Figure 2 and Figure 3, respectively. The changes in XRF-scan intensities show higher variance than those for the conventional-fractions except for the elements K, Ca, Ti and Fe (Figure 2). Furthermore, all the XRF-scan intensities show low deviations relative to the conventional-fractions in the lower part of the sediment cores. However, elements Al and Si exhibit large deviations in the upper part of both cores (0–92 cm in core FXH-B2 and 0–744 cm in core LGH2), in which the water content was shown to be relatively high compared to below (Figure 2 and Figure 3). The mean grain-size of core LGH2 varies from 3 to 33 μm, with fine silt (mean: 10 μm) in the top part (0–387 cm) and the bottom part (1361–1812 cm) of the core, and coarse clay (mean: 7 μm) in the middle part of the core (388–1360 cm). The grain size of core LGH2 is typically well-sorted (ranging from 2.4 to 4.7; mean: 3.2), though sorting increases throughout the core from the bottom to the top.

4.2. The Calibrated-XRF Results

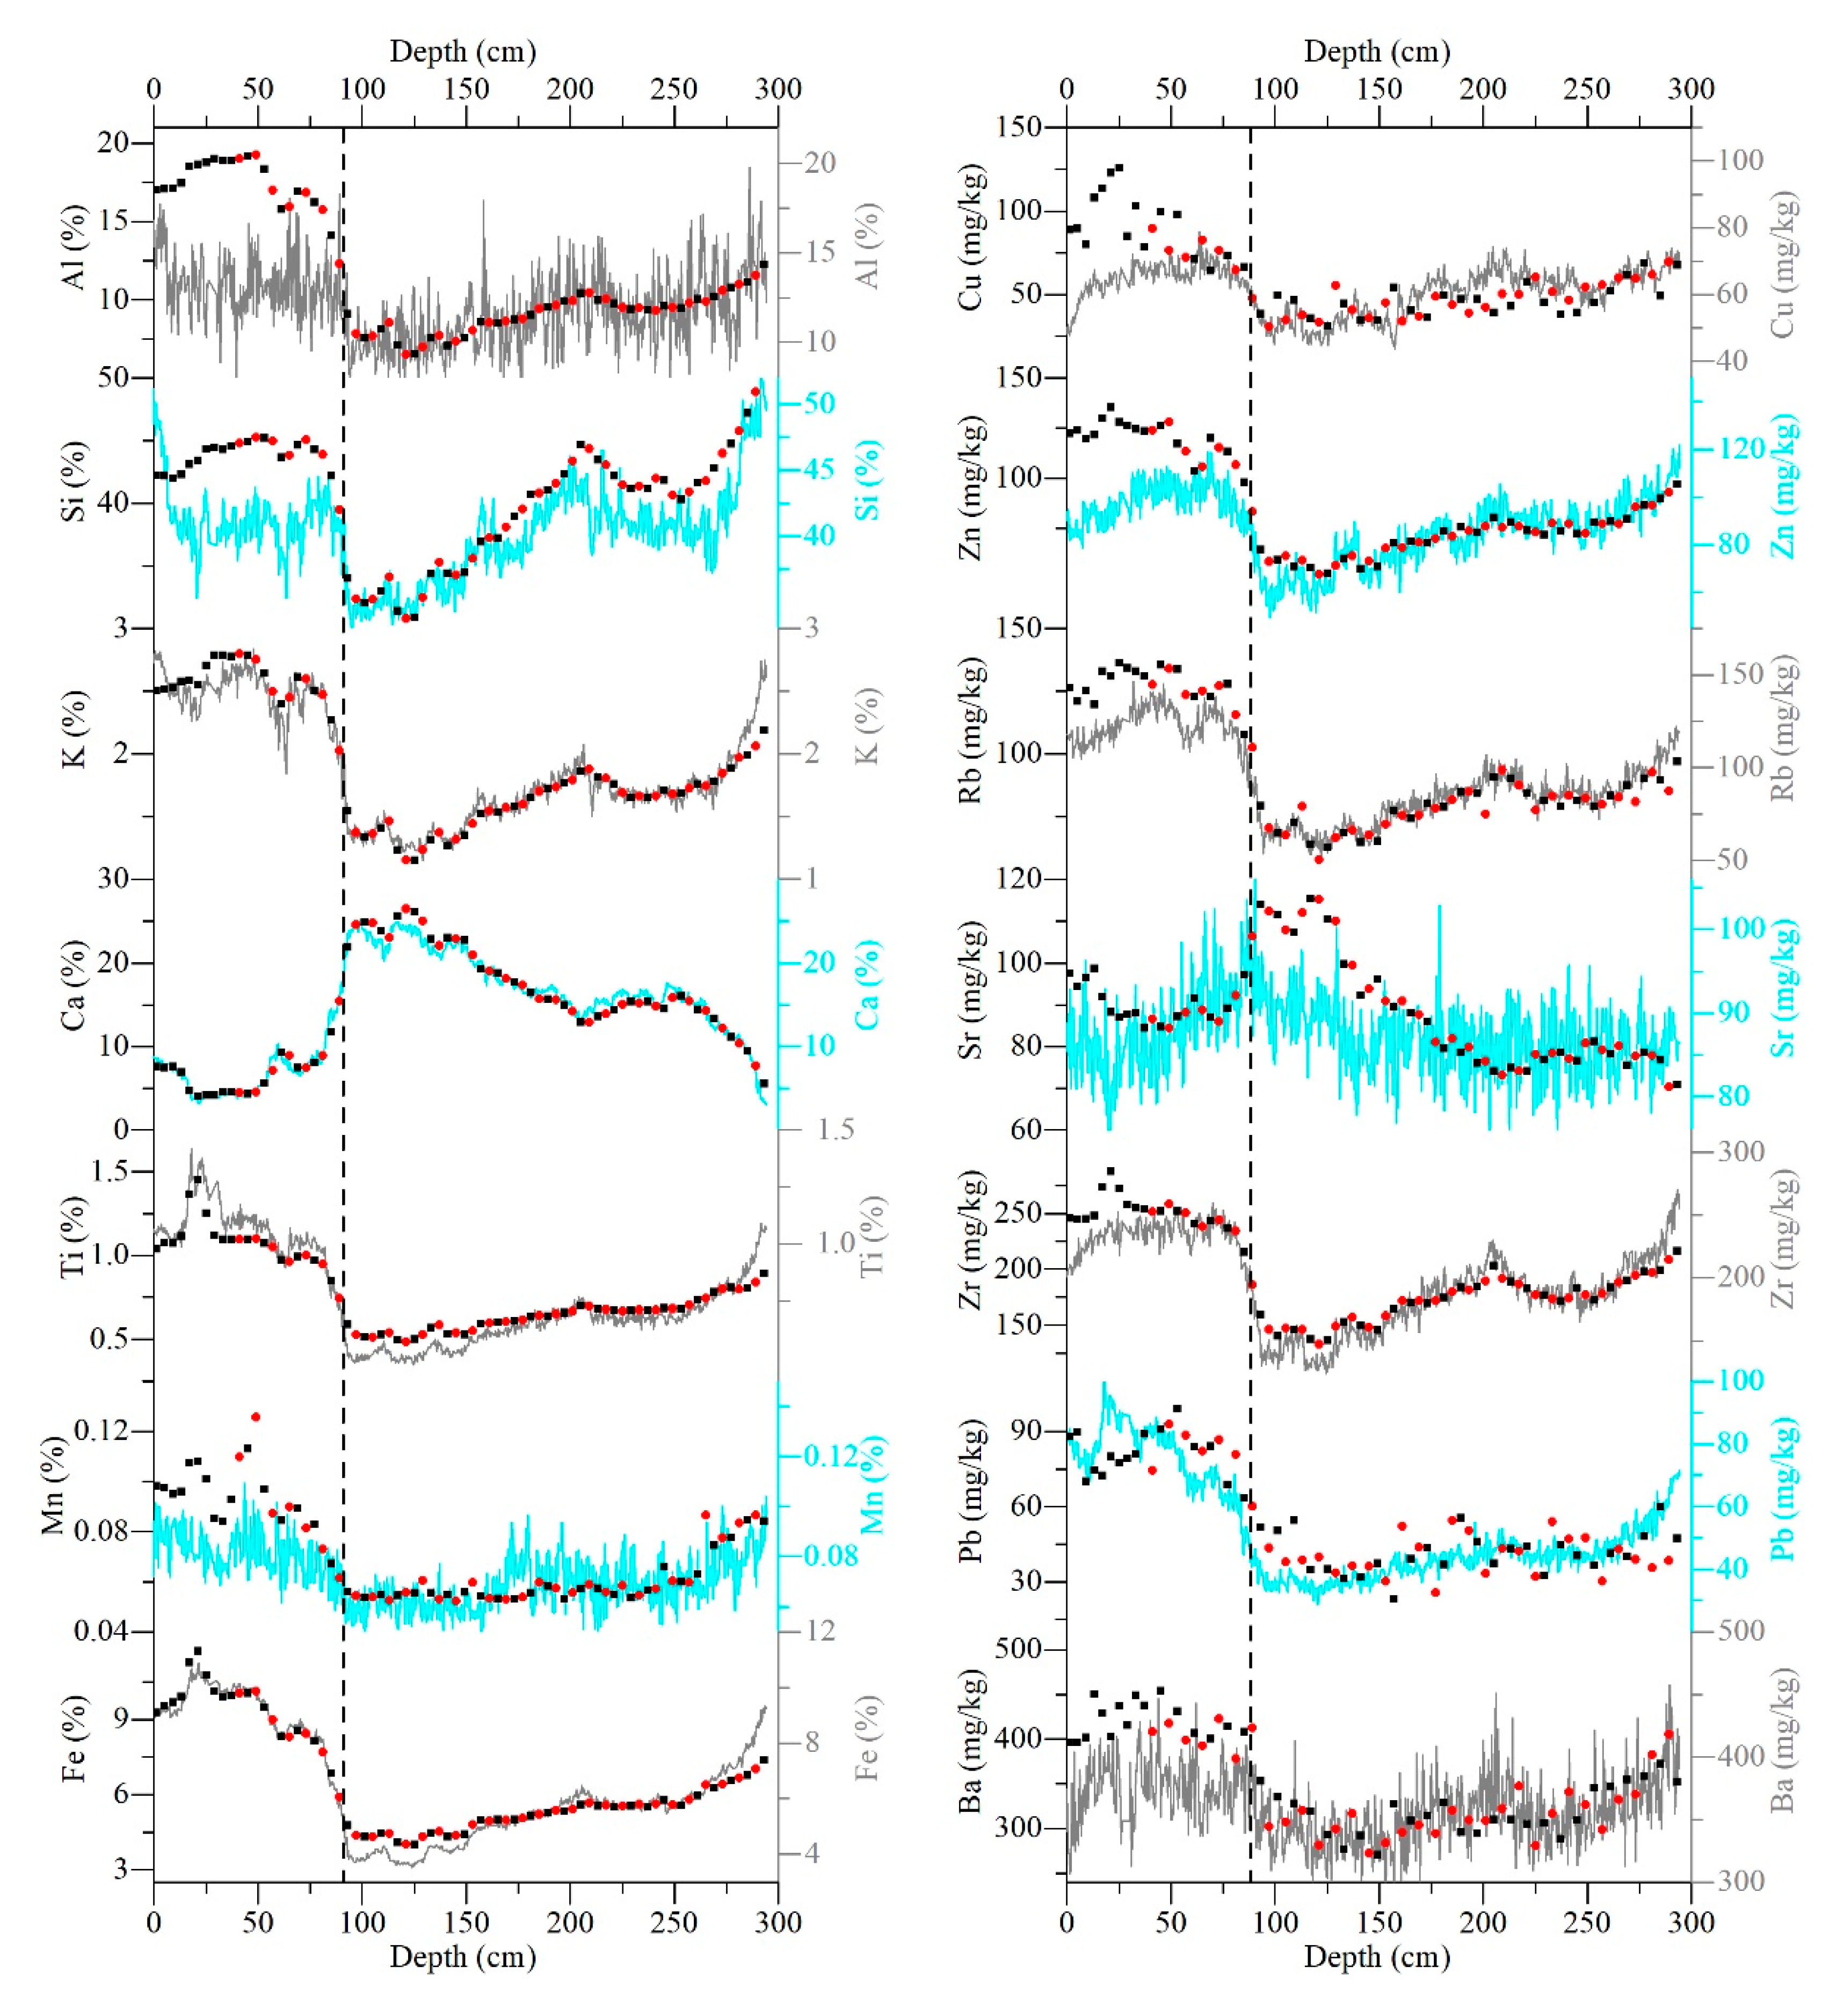
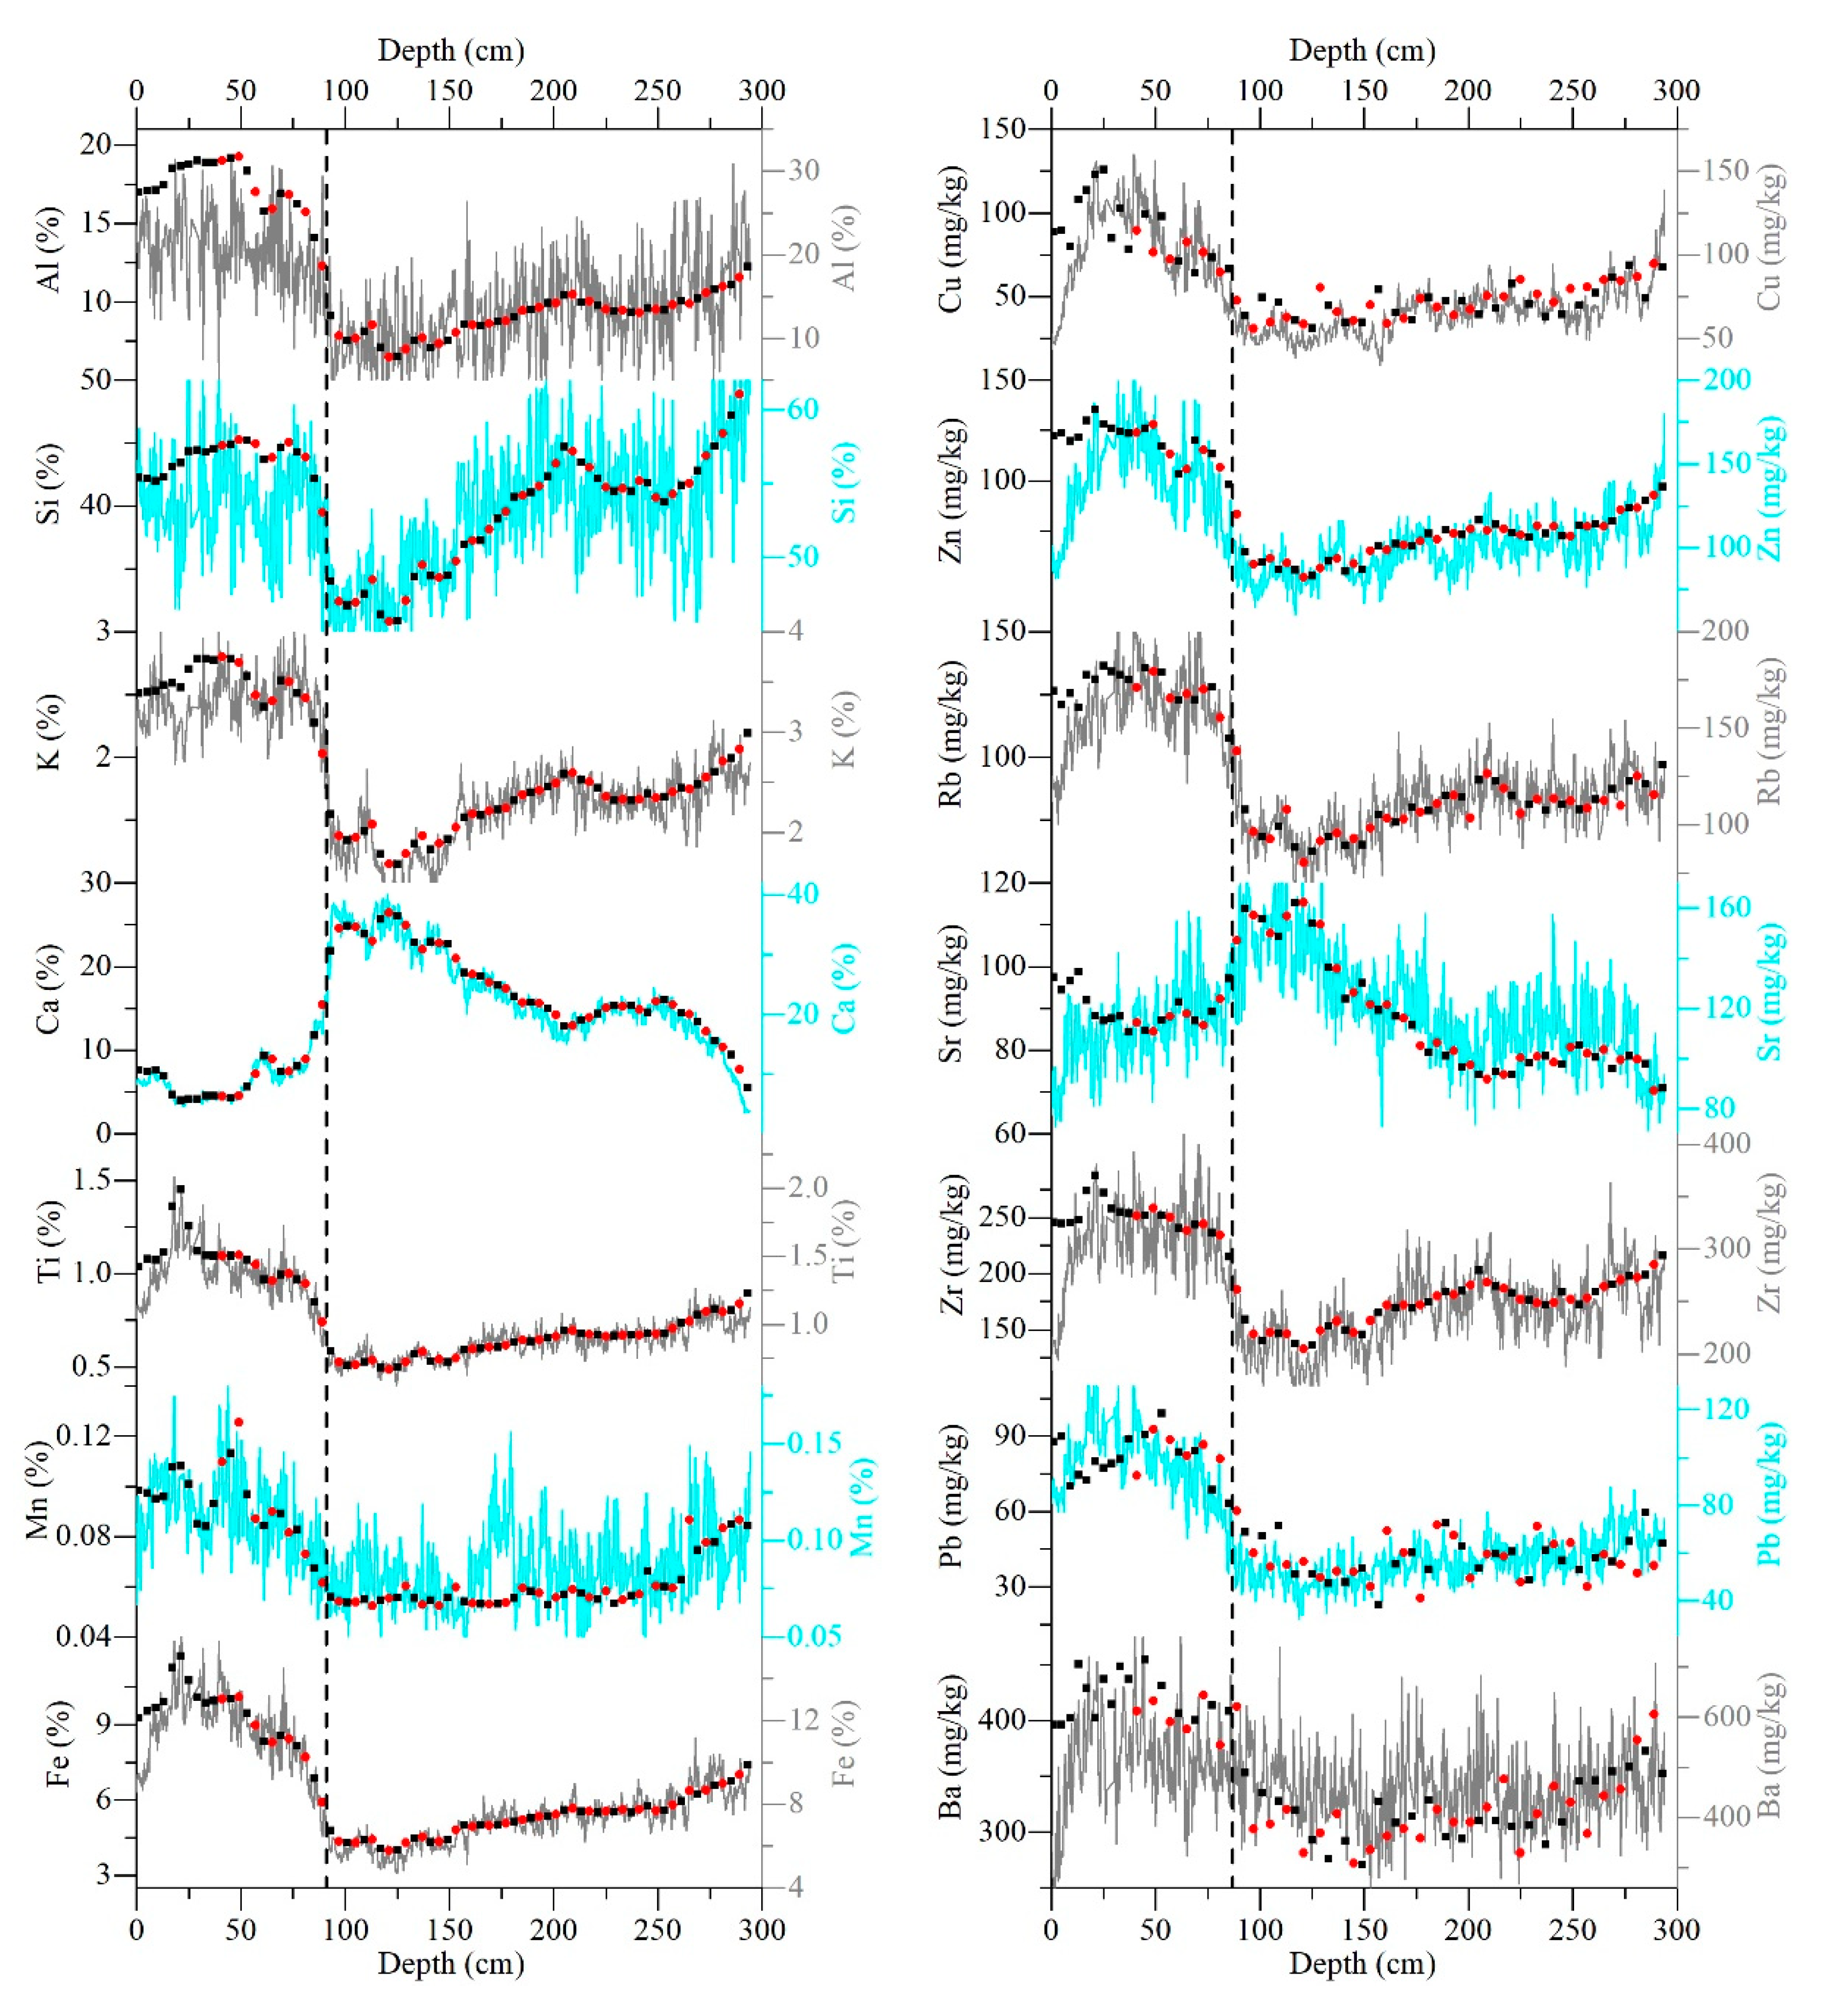
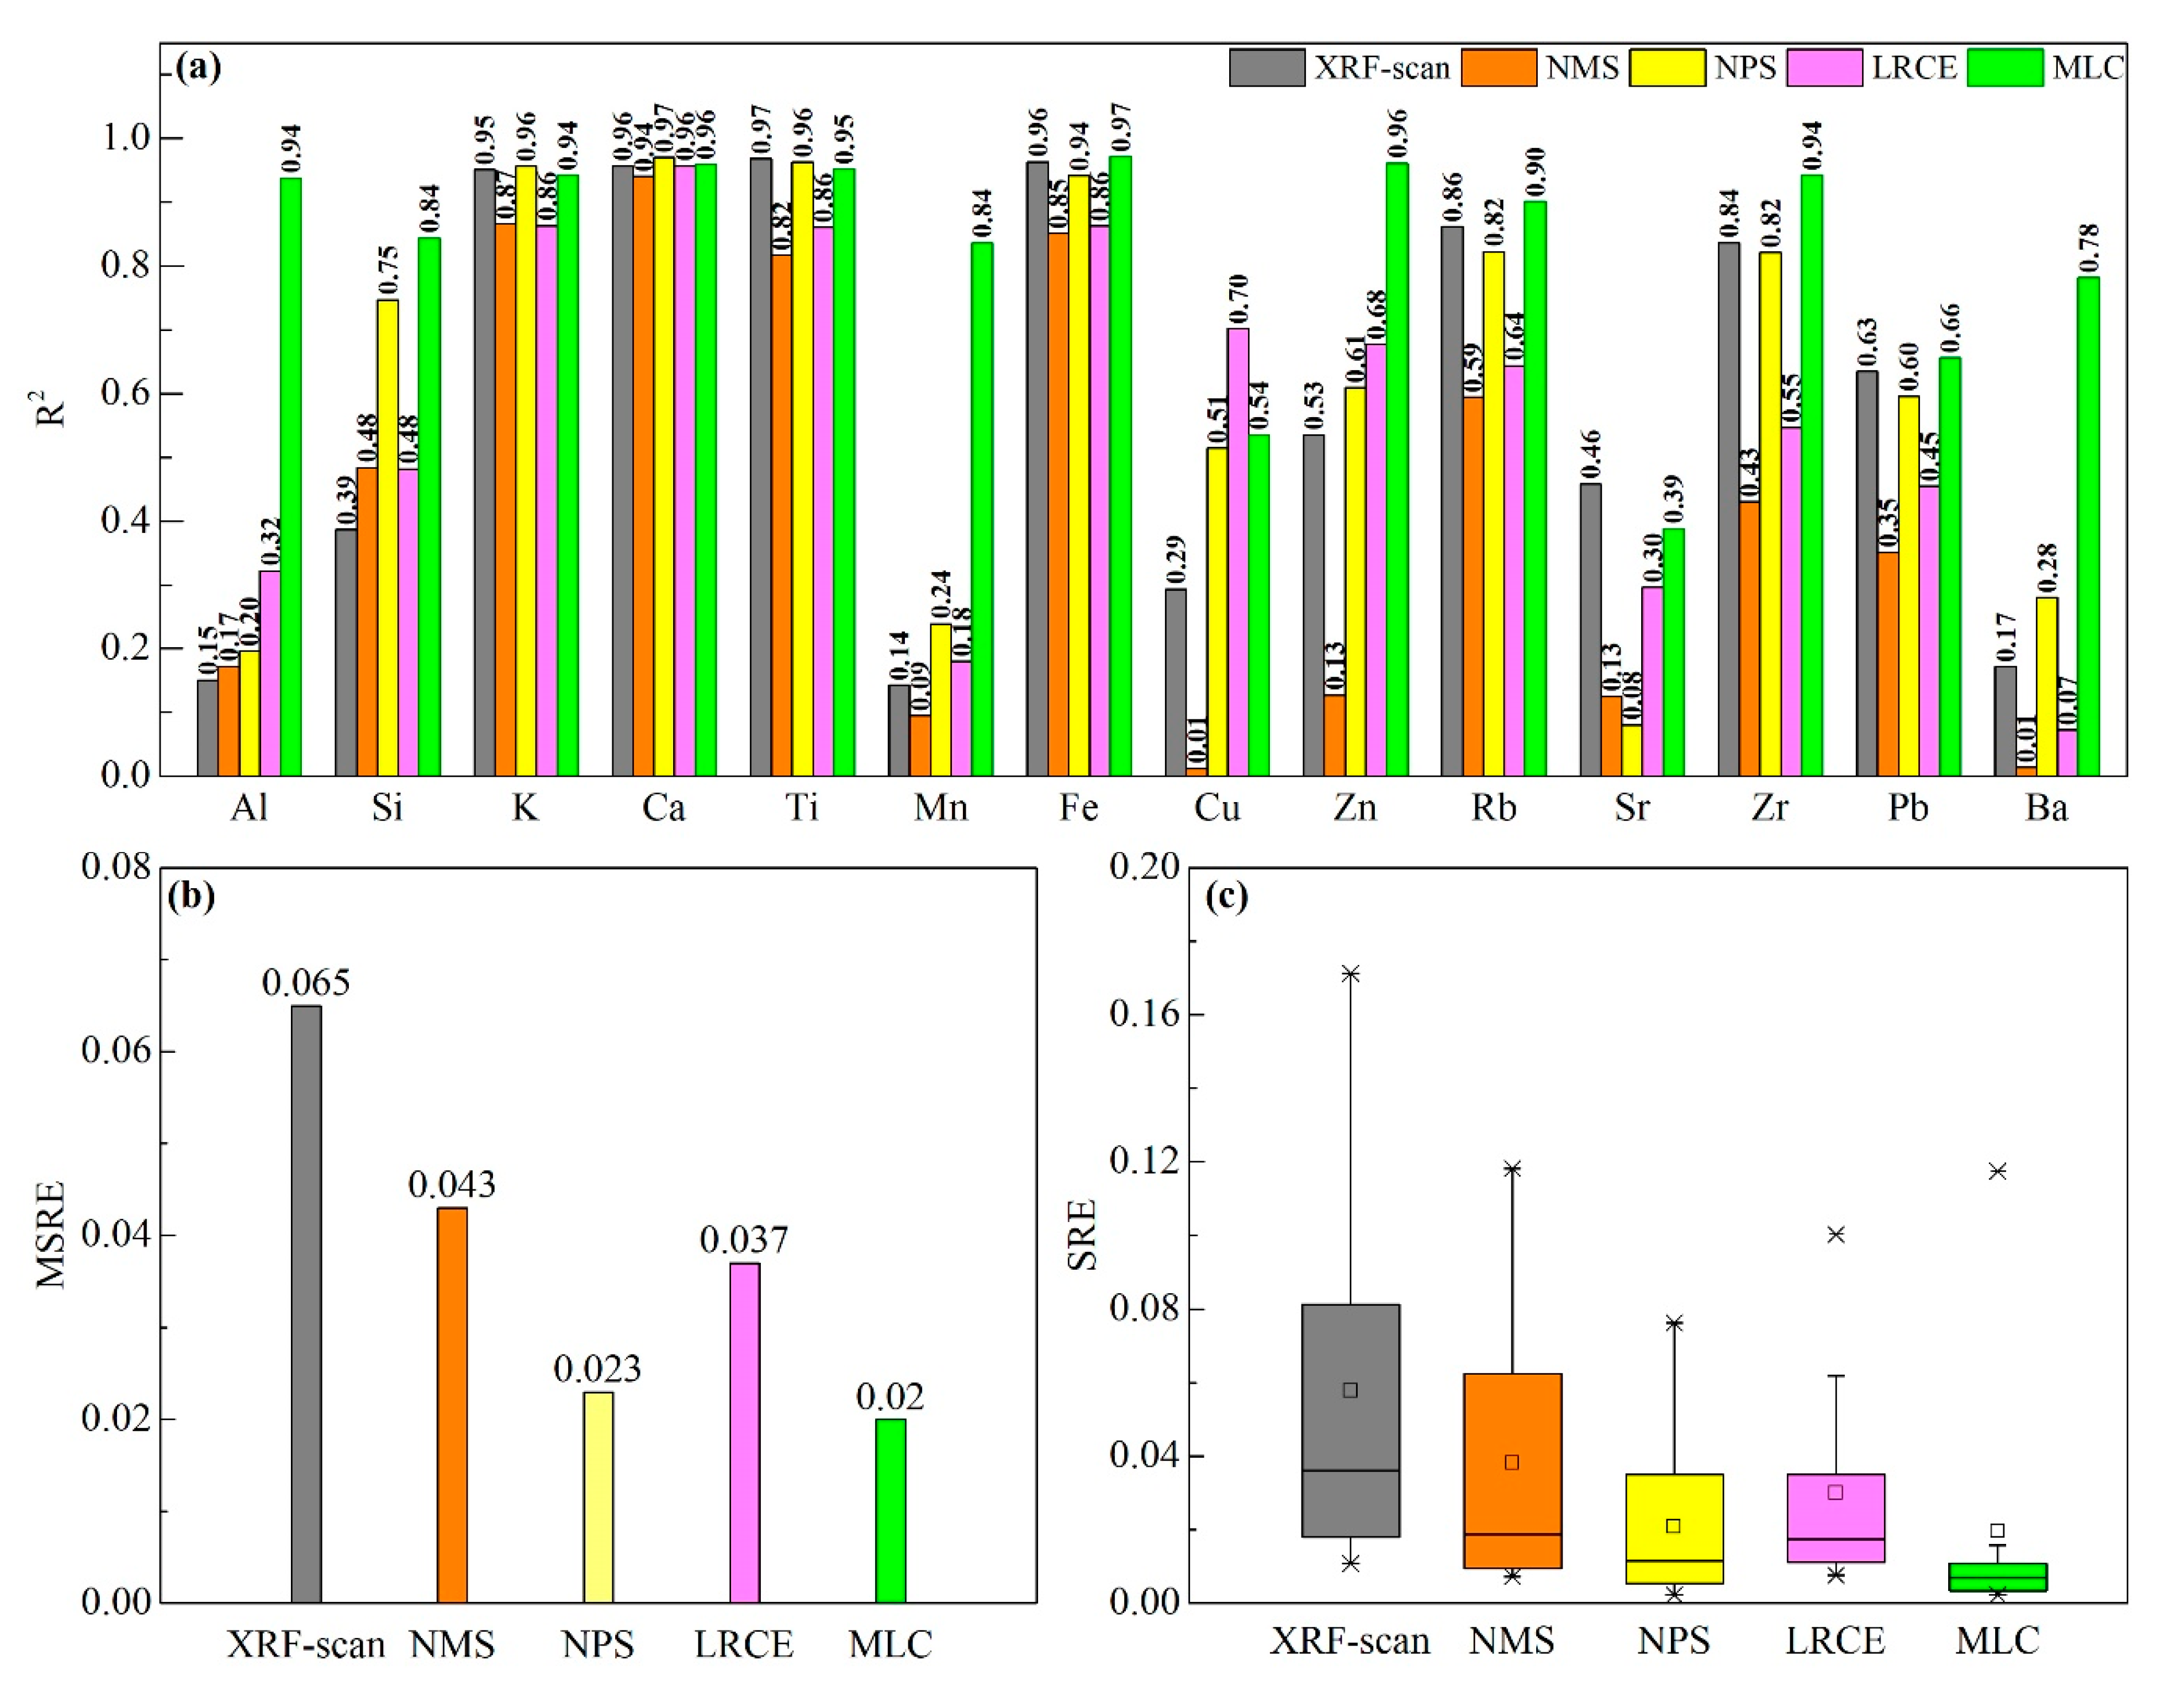
The calibrated-XRF results are plotted in Figure 4 (NMS), Figure 5 (NPS), Figure 6 (LRCE) and Figure 7 (MLC) to compare their predictive power. The goodness-of-fit statistics of the four calibration models are also plotted in Figure 8 (also see Table A1 and Table A2). The figures clearly show that the NMS (Figure 4) and LREC methods (Figure 6) yield calibrated-XRF results which are poorly calibrated to the conventional-fractions except for elements K, Ca, Ti and Fe (Figure 8a). The NPS method yields better calibrated-XRF results compared to the former two calibrations (Figure 5, Figure 8b,c: smaller MSRE and SRE). However, the calibrated-XRF elements Al and Si still exhibit large deviations compared to the conventional-fractions in the upper part of core FXH-B2 (Figure 5). The MLC method is shown to yield the best calibrated-XRF results (Figure 8b,c: with lowest MSRE and SRE), which are consistent with the conventional-fractions (Figure 7). In particular, the goodness-of-fit generated by the MLC calibration is significantly improved compared to the other three calibrations, notably Al, Si and Ba (Figure 8a).

5. Discussion

5.1. Comparative Performance of the Calibration Methods

The goodness-of-fit statistics demonstrate the predictive power of the four calibration methods (Figure 8, Table A1 and Table A2). The comparative evaluation highlights the lack of fit of the NMS method (Figure 8), which scaled the XRF-scan intensities by the mean value of conventional-fractions and converted the intensities to fractions using linear regression equations [9]. However, the scaling process used in the NMS can only reduce the scale differences between XRF-scan and conventional-fractions, but fails to adequately reduce specimen effects [7]. Notably, linear regression equations can only be applied to elements which exhibit linear relations (such as K, Ca, Ti and Fe of core FXH-B2), but this does not hold true for most elements [10].
The LRCE calibration is only slightly more effective than the NMS calibration (Figure 8b,c), because there are linear relations between the log-ratios of element fractions and log-ratios of the XRF-scan data [10]. However, the quality of the LRCE calibrations depends on which element is selected as the common log-ratio denominator and the data range and variances of the denominator may influence the true variances of the calibrated-XRF. Both NMS and LRCE constrain the calibrated-XRF to unity, which may cause a significant error if the sediment element components do not match those of the XRF-scan or if a major element found in the XRF-scan is not included in the conventional-fractions [9]. The performance of the NPS method was shown to be markedly better compared with the NMS and LREC methods (Figure 8b,c). This is because the influence of long-term changes in water content on the XRF-scan has been eliminated using a quadratic polynomial fit prior to the XRF-scan being converted to calibrated-XRF for the NPS method. However, where the variances of downcore water content are not taken into account, especially at the top of the core where the highest water content occurs, this results in the inaccurate calibration of Al and Si which are easily influenced by pore water fluctuations [11] (Figure 5). The MLC calibration exhibited the best performance with the highest correlation coefficient values (R2) for all elements (Figure 8a), and the lowest MSRE (Figure 8b) and SRE (Figure 8c). Weltje et al. [21] highlight that the MLC approach benefits from clr-transformation and partial least squares regression in order to better eliminate the influences of matrix effects, specifically attenuation or enhancement of specific XRF-scan intensities due to the presence of other elements or water content [11].

5.2. Assessing the Influence of Sediment Properties on XRF-scan Elements within Lake Sediments

The comparisons of XRF-scan and conventional-fractions indicate that artificial deviations occurred in the XRF-scan elemental detection. Such deviations are larger for the relatively light elements (e.g., Al, Si and K) rather than for the heavy elements (Figure 2 and Figure 3). Deviations are thought to be primarily due to both specimen (i.e., inhomogeneous sediment properties, including water content and grain size) and matrix effects [11]. In order to assess the influence of sediment properties on XRF-scan intensities within lake sediments, core LGH2 was calibrated to element fractions using the MLC calibration, which effectively eliminates the influences of specimen effects and matrix effects. The XRF-scans were then scaled to the median value of a given XRF-calibrated element. The deviations ( D i j ) between the XRF-scan element j and the calibrated-XRF element j of the same specimen i were calculated using the following equation:
D i j ( % ) = I i j I j M · C j M C i j C i j * 100
where I i j and C i j represent the XRF-scan intensity and the XRF-calibrated element j in specimen i, respectively and I j M and C j M are the median values of the XRF-scan intensity and the XRF-calibrated element j, respectively.
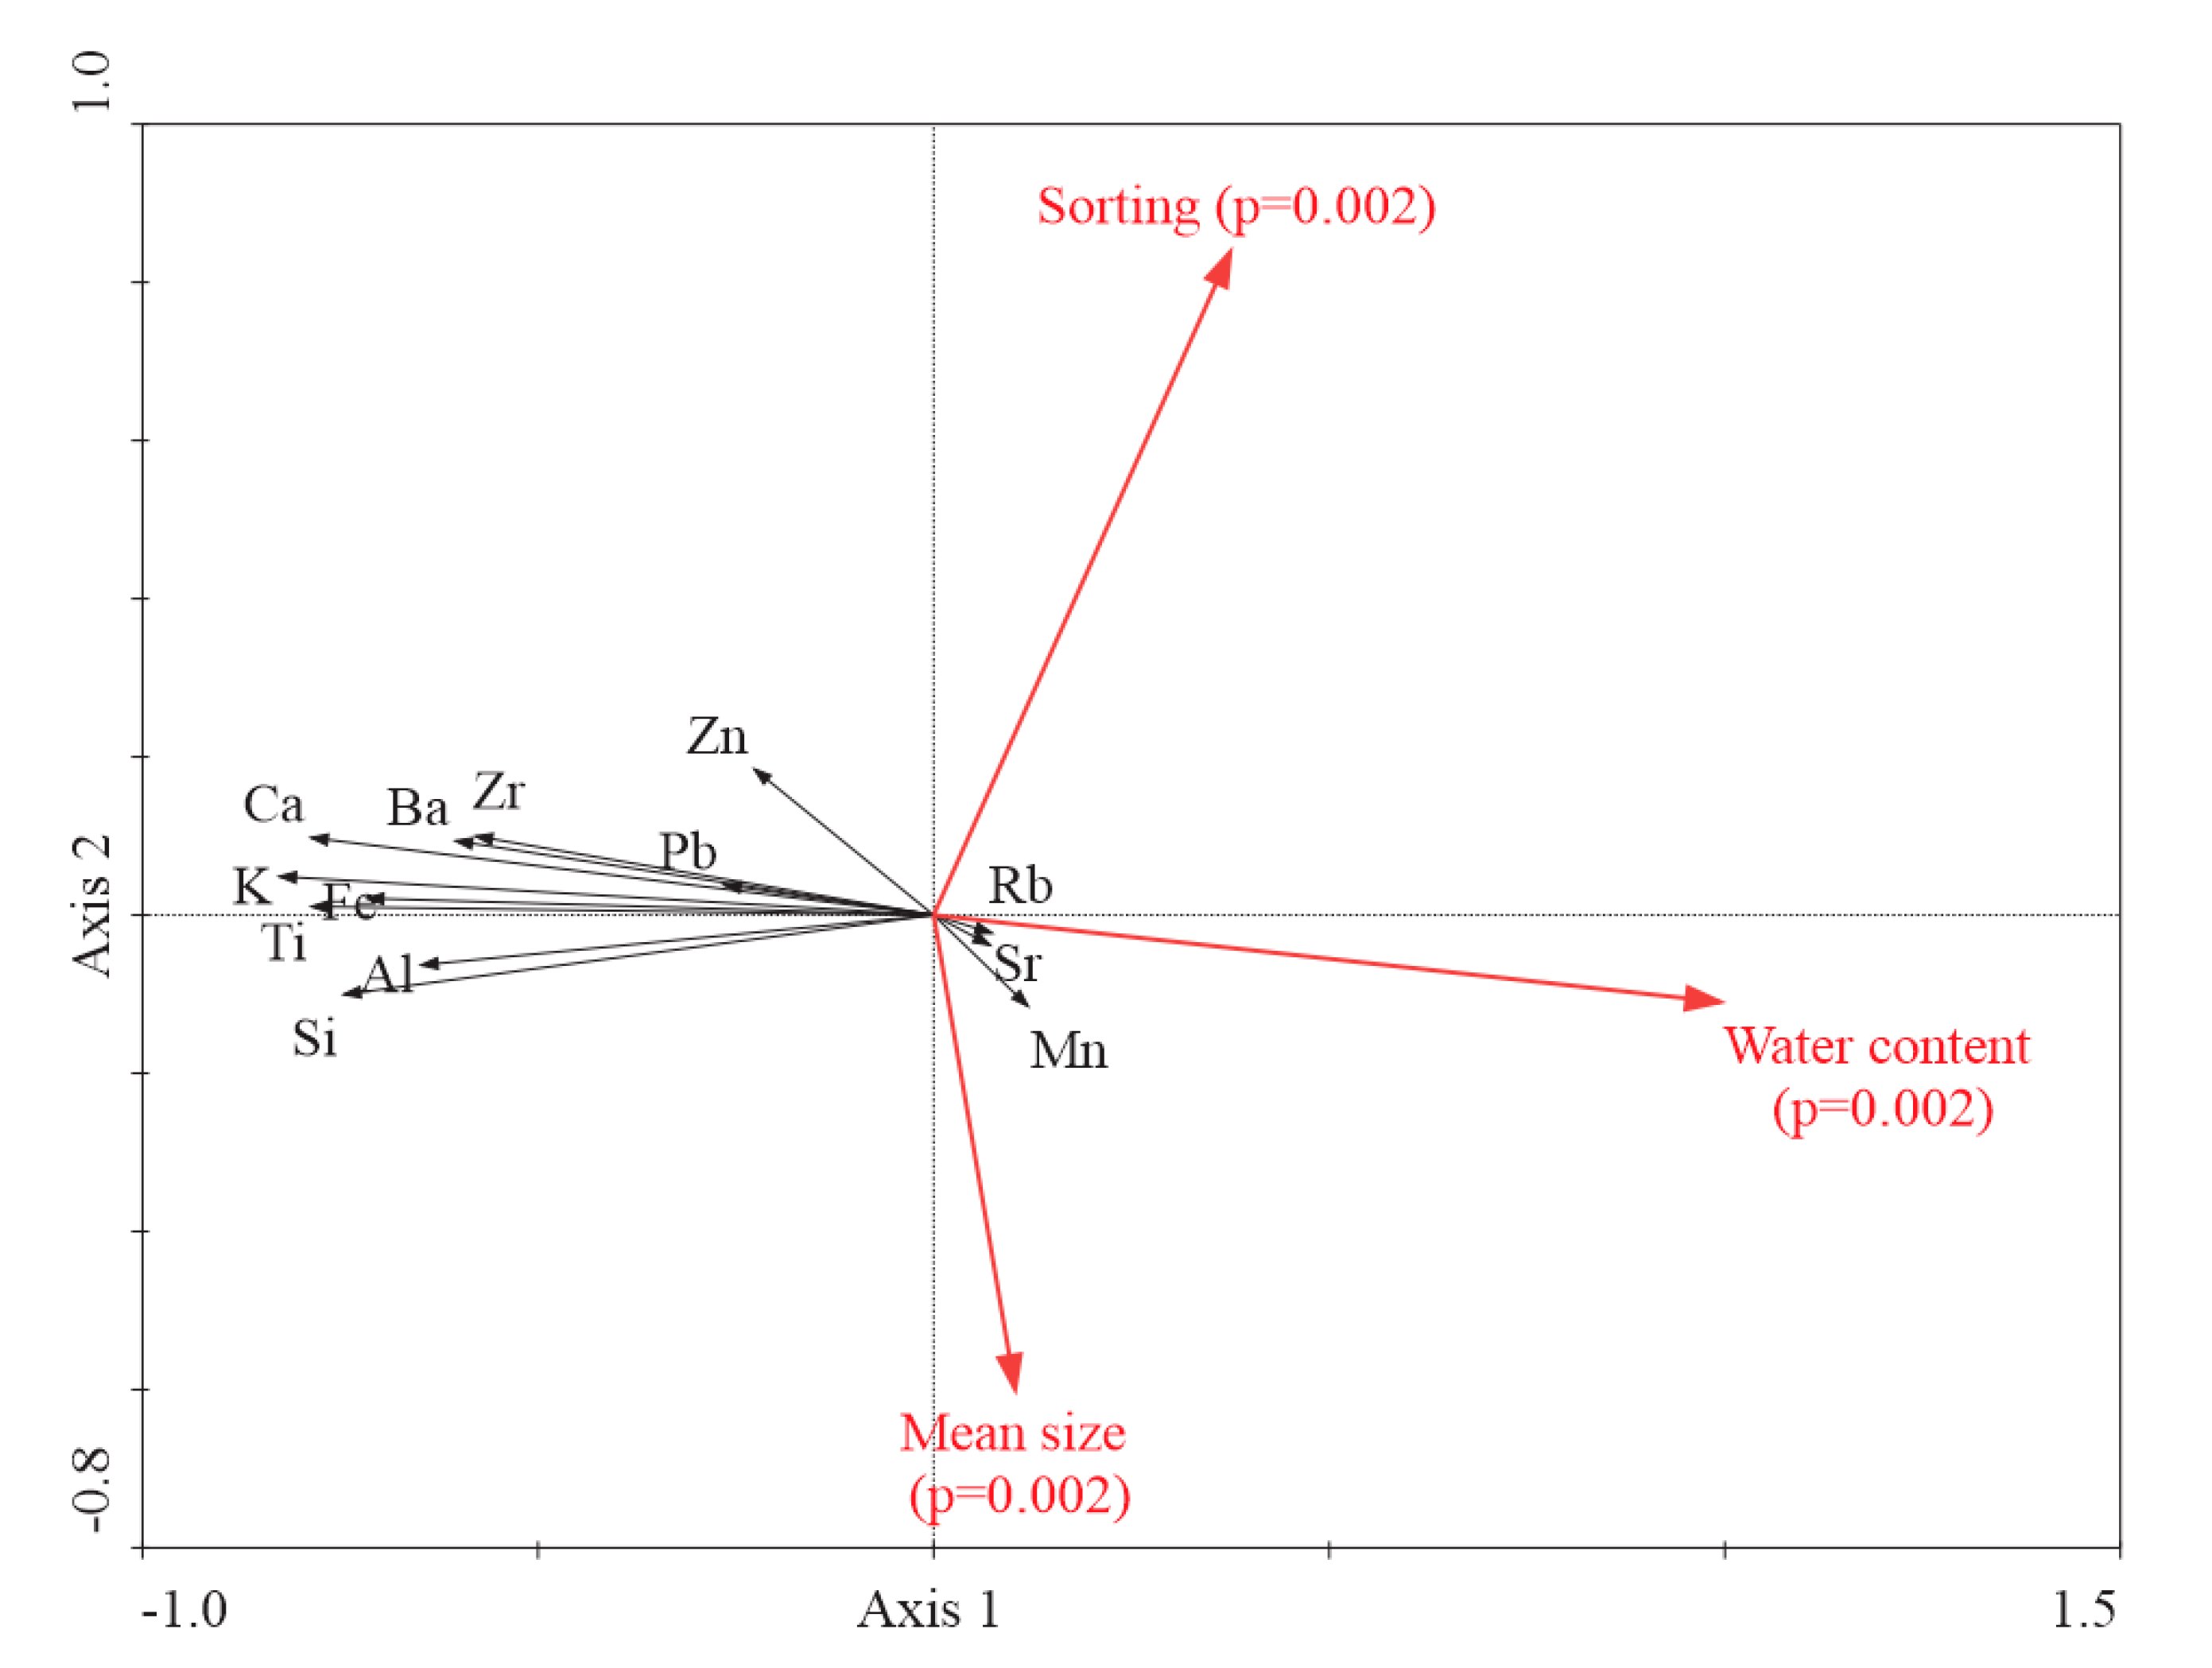
The element deviations and sediment properties were taken into account for redundancy analysis (RDA) in Canoco for windows 4.5 to examine the relationships between the element deviations and sediment properties (Figure 9), as expected sediment properties, including sorting, mean grain size and water content, explained significant proportions (p < 0.05) of the element deviations (Figure 9). Factors of sorting and mean grain size only explained 6.6% and 0.7% of dataset deviations, respectively, similar to previous studies [11]. In contrast, water content explained 43% of the element deviations especially for the light elements (Al, Si, K, Ca, Ti and Fe; Figure 9). This phenomenon results from the pore water dilutive and absorption effects [25]. First, pore water may dilute the sediment solid phase [25,26]. Second, it can absorb the X-ray radiation of the sediment causing lower XRF-scan intensities and low measurement accuracy. This effect predominantly influences the elements with weaker fluorescence energies, which in accordance with Moseley’s law relate primarily to elements with a lower atomic number such as Al and Si [8,11]. Furthermore, a pore water film may form directly between the protective foil and sediment surface. This phenomenon could artificially enhance the absorption effect of pore water [8,11,13].
To assess the impacts of water content on the light elements, element deviations and water content were used in the generalized additive model (GAM) [27] (Figure 10). The GAM results reveal an inverse relationship between element deviations and water content. For Al (Figure 10a), Si (Figure 10b) and Ti (Figure 10e), when water content is below 52%, it has little impact on element deviation. However, a significant XRF-scan intensities decrease (up to 40%) was observed when water content was > 52%. With respect to K and Ca, a significant XRF-scan intensities decrease appears (up to 30% and 20%, respectively) when water content is >47%. Fe is insensitive to changes in water content compared to the other five elements, with no significant decrease observed until water content was 56%.

6. Conclusions

The comparison of four recent XRF-scan calibration methods indicates that the NMS and LREC calibrations do not work well in sediments characterized by large changes in downcore water content. In contrast, the NPS method, which eliminates the influences of long-term changes in water content, exhibits a relatively good calibration. However, the NPS method fails to calibrate light element fractions (such as Al and Si) towards the core-top where water content increases markedly. Notably, we show that the MLC method is capable of efficiently converting almost all the detected XRF-scan intensities to fractions. For fine-grained sediments, grain size exhibits little impact on the XRF-scan data. Water content within the lake sediment was found to be the most important factor influencing the XRF-scan intensities, especially for the light elements (From Al to Fe). A significant decrease of XRF-scan accuracy may occur when the sediment water content is >47%. Therefore, we strongly recommend selecting a range of different samples throughout any given core, testing element fractions and applying the MLC method when performing high-resolution XRF-scan measurements in the determination of elemental fractions within lake sediments.

Author Contributions

Conceptualization, X.Z. and H.Z.; methodology, X.Z.; software, X.Z.; validation, X.Z., Y.Z., H.W., Q.L. and F.L.; formal analysis, X.Z.; investigation, X.Z., W.P. and L.D.; resources, F.C.; data curation, X.Z. and U.A.; writing—original draft preparation, X.Z. and H.Z.; project administration, H.Z.; funding acquisition, H.Z. and X.Z. All authors have read and agreed to the published version of the manuscript.

Funding

This research was funded by the National Natural Science Foundation of China, grant number 41901104 and 41820104008, the Yunnan Provincial Government Leading Scientist Program, grant number 2015HA024, the Yunnan Postdoctoral Science Foundation and China Postdoctoral Science Foundation, grant number 2019M663584.

Acknowledgments

We thank Hassan Azarmdel and Xuemei Chen for his/her help on the software implementation. We also thank Christopher J. Oldknow from University of Liverpool, United Kingdom, for improving the language. We appreciate the comments and suggestions by Hongli Pang.

Conflicts of Interest

The authors declare no conflict of interest.

Abbreviations

XRFX-ray fluorescence;
RDAredundancy analyses;
GAMgeneralized additive model;
ICP-MSinductively coupled plasma mass spectrometry;
ICP-OESinductively coupled plasma optical emission spectrometry;
EDP-XRFenergy dispersive polarization X-ray fluorescence;
WD-XRFwavelength dispersive X-ray fluorescence;
NMSnormalized median-scaled;
NPSnormalized polynomial-scaled;
LRCElog-ratio calibration equation;
MLCmultivariate log-ratio calibration;
alradditive log-ratio transformation;
clrcentered log-ratio;
SREsquared relative error;
MSREmean squared relative error.

Appendix A

Table A1. The correlation coefficient (R2, p < 0.05) between the XRF-scan/calibrated-XRF and conventional-fractions of all fourteen elements in the remaining samples.
AlSiKCaTiMnFeCuZnRbSrZrPbBa
XRF-scan0.150.390.950.960.970.140.960.290.530.860.460.840.630.17
NMS0.170.480.870.940.820.090.850.010.130.590.130.430.350.01
NPS0.200.750.960.970.960.240.940.510.610.820.080.820.600.28
LRCE0.320.480.860.960.860.180.860.700.680.640.300.550.450.07
MLC0.940.840.940.960.950.840.970.540.960.900.390.940.660.78
Table A2. The squared relative error (SRE) and the mean squared relative error (MSRE) of the XRF-scan/calibrated-XRF for all fourteen elements in the remaining samples.
MSREAlSiKCaTiMnFeCuZnRbSrZrPbBa
XRF-scan0.0580.1710.0130.1070.0810.0280.0550.0180.0680.0390.0250.0160.0110.1440.033
NMS0.0380.1180.0080.0070.0180.0090.0630.0090.0790.0490.0180.0200.0170.0890.030
NPS0.0210.0540.0040.0020.0060.0020.0350.0060.0420.0190.0100.0150.0050.0760.013
LRCE0.0300.1000.0080.0120.0110.0080.0620.0090.0250.0210.0170.0180.0140.0820.035
MLC0.0200.0110.0020.0060.0090.0030.0090.0030.1170.0050.0080.0160.0030.0790.006

References

  1. Jansen, J.H.F.; Gaast, S.J.V.D.; Koster, B.; Vaars, A.J. CORTEX, a shipboard XRF-scanner for element analyses in split sediment cores. Mar. Geol. 1998, 151, 143–153. [Google Scholar] [CrossRef]
  2. Croudace, I.W.; Rindby, A.; Rothwell, R.G. ITRAX: Description and evaluation of a new multi-function X-ray core scanner. Geol. Soc. Lond. Spec. Publ. 2006, 267, 51–63. [Google Scholar] [CrossRef] [Green Version]
  3. Rothwell, R.G.; Hoogakker, B.; Thomson, J.; Croudace, I.W.; Frenz, M. Turbidite emplacement on the southern Balearic Abyssal Plain (western Mediterranean Sea) during Marine Isotope Stages 1–3: An application of ITRAX XRF scanning of sediment cores to lithostratigraphic analysis. Geol. Soc. Lond. Spec. Publ. 2006, 267, 79–98. [Google Scholar] [CrossRef]
  4. Francus, P.; Lamb, H.; Nakagawa, T.; Marshall, M.; Brown, E.; Members, S.P. The potential of high-resolution X-ray fluorescence core scanning: Applications in paleolimnology. PAGES News 2009, 17, 93–96. [Google Scholar] [CrossRef] [Green Version]
  5. Kümmerer, V.; Drago, T.; Veiga-Pires, C.; Silva, P.F.; Magalhães, V.; Mena, A.; Lopes, A.; Rodrigues, A.I.; Schmidt, S.; Terrinha, P.; et al. Exploring Offshore Sediment Evidence of the 1755 CE Tsunami (Faro, Portugal): Implications for the Study of Outer Shelf Tsunami Deposits. Minerals 2020, 10, 731. [Google Scholar] [CrossRef]
  6. García-Giménez, R.; Frias, M.; Vigil De La Villa, R.; Martínez-Ramírez, S. Ca/Si and Si/Al Ratios of Metakaolinite-Based Wastes: Their Influence on Mineralogy and Mechanical Strengths. Appl. SCI-Basel 2018, 8, 480. [Google Scholar] [CrossRef] [Green Version]
  7. Chen, Q.; Kissel, C.; Govin, A.; Liu, Z.; Xie, X. Correction of interstitial water changes in calibration methods applied to XRF core-scanning major elements in long sediment cores: Case study from the South China Sea. Geochem. Geophy. Geosyst. 2016, 17, 1925–1934. [Google Scholar] [CrossRef] [Green Version]
  8. Tjallingii, R.; Röhl, U.; Kölling, M.; Bickert, T. Influence of the water content on X-ray fluorescence core-scanning measurements in soft marine sediments. Geochem. Geophy. Geosyst. 2007, 8, 1525–2027. [Google Scholar] [CrossRef]
  9. Lyle, M.; Olivarez Lyle, A.; Gorgas, T.; Holbourn, A.; Westerhold, T.; Hathorne, E.; Kimoto, K.; Yamamoto, S. Data report: Raw and normalized elemental data along the Site U1338 splice from X-ray fluorescence scanning. Proc. Integr. Ocean Drill. Program 2012, 320, 321. [Google Scholar] [CrossRef]
  10. Weltje, G.J.; Tjallingii, R. Calibration of XRF core scanners for quantitative geochemical logging of sediment cores: Theory and application. Earth Planet Sci. Lett. 2008, 274, 423–438. [Google Scholar] [CrossRef]
  11. Hennekam, R.; de Lange, G. X-ray fluorescence core scanning of wet marine sediments: Methods to improve quality and reproducibility of high-resolution paleoenvironmental records. Limnol. Oceanogr-Meth. 2012, 10, 991–1003. [Google Scholar] [CrossRef]
  12. Löwemark, L.; Chen, H.F.; Yang, T.N.; Kylander, M.; Yu, E.F.; Hsu, Y.W.; Lee, T.Q.; Song, S.R.; Jarvis, S. Normalizing XRF-scanner data: A cautionary note on the interpretation of high-resolution records from organic-rich lakes. J. Asian Earth Sci. 2011, 40, 1250–1256. [Google Scholar] [CrossRef]
  13. Kido, Y.; Koshikawa, T.; Tada, R. Rapid and quantitative major element analysis method for wet fine-grained sediments using an XRF microscanner. Mar. Geol. 2006, 229, 209–225. [Google Scholar] [CrossRef]
  14. Cappuccio, G.; Cibin, G.; Dabagov, S.; Di Filippo, A.; Piovesan, G.; Hampai, D.; Maggi, V.; Marcelli, A. Challenging X-ray Fluorescence Applications for Environmental Studies at XLab Frascati. Condens. Matter 2018, 3, 33. [Google Scholar] [CrossRef] [Green Version]
  15. Hennekam, R.; Jilbert, T.; Mason, P.R.D.; de Lange, G.J.; Reichart, G. High-resolution line-scan analysis of resin-embedded sediments using laser ablation-inductively coupled plasma-mass spectrometry (LA-ICP-MS). Chem. Geol. 2015, 403, 42–51. [Google Scholar] [CrossRef]
  16. Dunlea, A.G.; Murray, R.W.; Tada, R.; Alvarez Zarikian, C.A.; Anderson, C.H.; Gilli, A.; Giosan, L.; Gorgas, T.; Hennekam, R.; Irino, T.; et al. Intercomparison of XRF Core Scanning Results From Seven Labs and Approaches to Practical Calibration. Geochem. Geophy. Geosyst. 2020, 21. [Google Scholar] [CrossRef]
  17. Lei, G.; Zhang, H.; Chang, F.; Zhu, Y.; Li, C.; Xie, X.; Lei, Y.; Zhang, W.; Pu, Y. Comparison and correction of element measurements in lacustrine sedmients using X-ray fluorescence core-scanning with ICP-OES method: A case study of Zigetang Co. J. Lake Sci. 2011, 23, 287–294, (In Chinese with English abstract). [Google Scholar]
  18. Thomson, J.; Croudace, I.W.; Rothwell, R.G. A geochemical application of the ITRAX scanner to a sediment core containing eastern Mediterranean sapropel units. Geol. Soc. Lond. Spec. Publ. 2006, 267, 65–77. [Google Scholar] [CrossRef]
  19. Richter, T.O.; Van der Gaast, S.; Koster, B.; Vaars, A.; Gieles, R.; de Stigter, H.C.; De Haas, H.; van Weering, T.C. The Avaatech XRF Core Scanner: Technical description and applications to NE Atlantic sediments. Geol. Soc. Lond. Spec. Publ. 2006, 267, 39–50. [Google Scholar] [CrossRef]
  20. Chawchai, S.; Kylander, M.E.; Chabangborn, A.; Löwemark, L.; Wohlfarth, B. Testing commonly used X-ray fluorescence core scanning-based proxies for organic-rich lake sediments and peat. Boreas 2016, 45, 180–189. [Google Scholar] [CrossRef]
  21. Weltje, G.J.; Bloemsma, M.R.; Tjallingii, R.; Heslop, D.; Röhl, U.; Croudace, I.W. Prediction of Geochemical Composition from XRF Core Scanner Data: A New Multivariate Approach Including Automatic Selection of Calibration Samples and Quantification of Uncertainties. In Micro-XRF Studies of Sediment Cores: A Perspective on Capability and Application in the Environmental Sciences, 1st ed.; Croudace, I.W., Rothwell, R.G., Eds.; Springer: Dordrecht, The Netherlands, 2015; pp. 507–534. [Google Scholar]
  22. Jenkins, R. X-Ray Fluorescence Spectroscopy, 2nd ed.; Wiley: New York, NY, USA, 1999; p. 207. [Google Scholar]
  23. De Vries, J.L.; Vrebos, B. Quantification of infinitely thick specimens by XRF analysis. In Handbook of X-Ray Spectrometry, 2nd ed.; Grieken, R.V., Markowicz, A., Eds.; Marcel Dekker, Inc.: New York, NY, USA, 2002; pp. 341–405. [Google Scholar]
  24. Li, T.; Zhang, H.; Cai, M.; Chang, F.; Hu, J. The composition of carbonate matters in the sediments from Lake Fuxian and significance of paleoclimate and water level changes. Quat. Sci. 2019, 39, 642–654, (In Chinese with English abstract). [Google Scholar]
  25. Ge, L.; Lai, W.; Lin, Y. Influence of and correction for moisture in rocks, soils and sediments on in situ XRF analysis. X-Ray Spectrom. 2005, 34, 28–34. [Google Scholar] [CrossRef]
  26. Phedorin, M.A.; Goldberg, E.L. Prediction of absolute concentrations of elements from SR XRF scan measurements of natural wet sediments. Nucl. Instrum. Meth. A 2005, 543, 274–279. [Google Scholar] [CrossRef]
  27. Hastie, T.J.; Tibshirani, R.J. Generalized Additive Models, 1st ed.; CRC Press: Boca Raton, FL, USA, 1990; pp. 136–166. [Google Scholar]
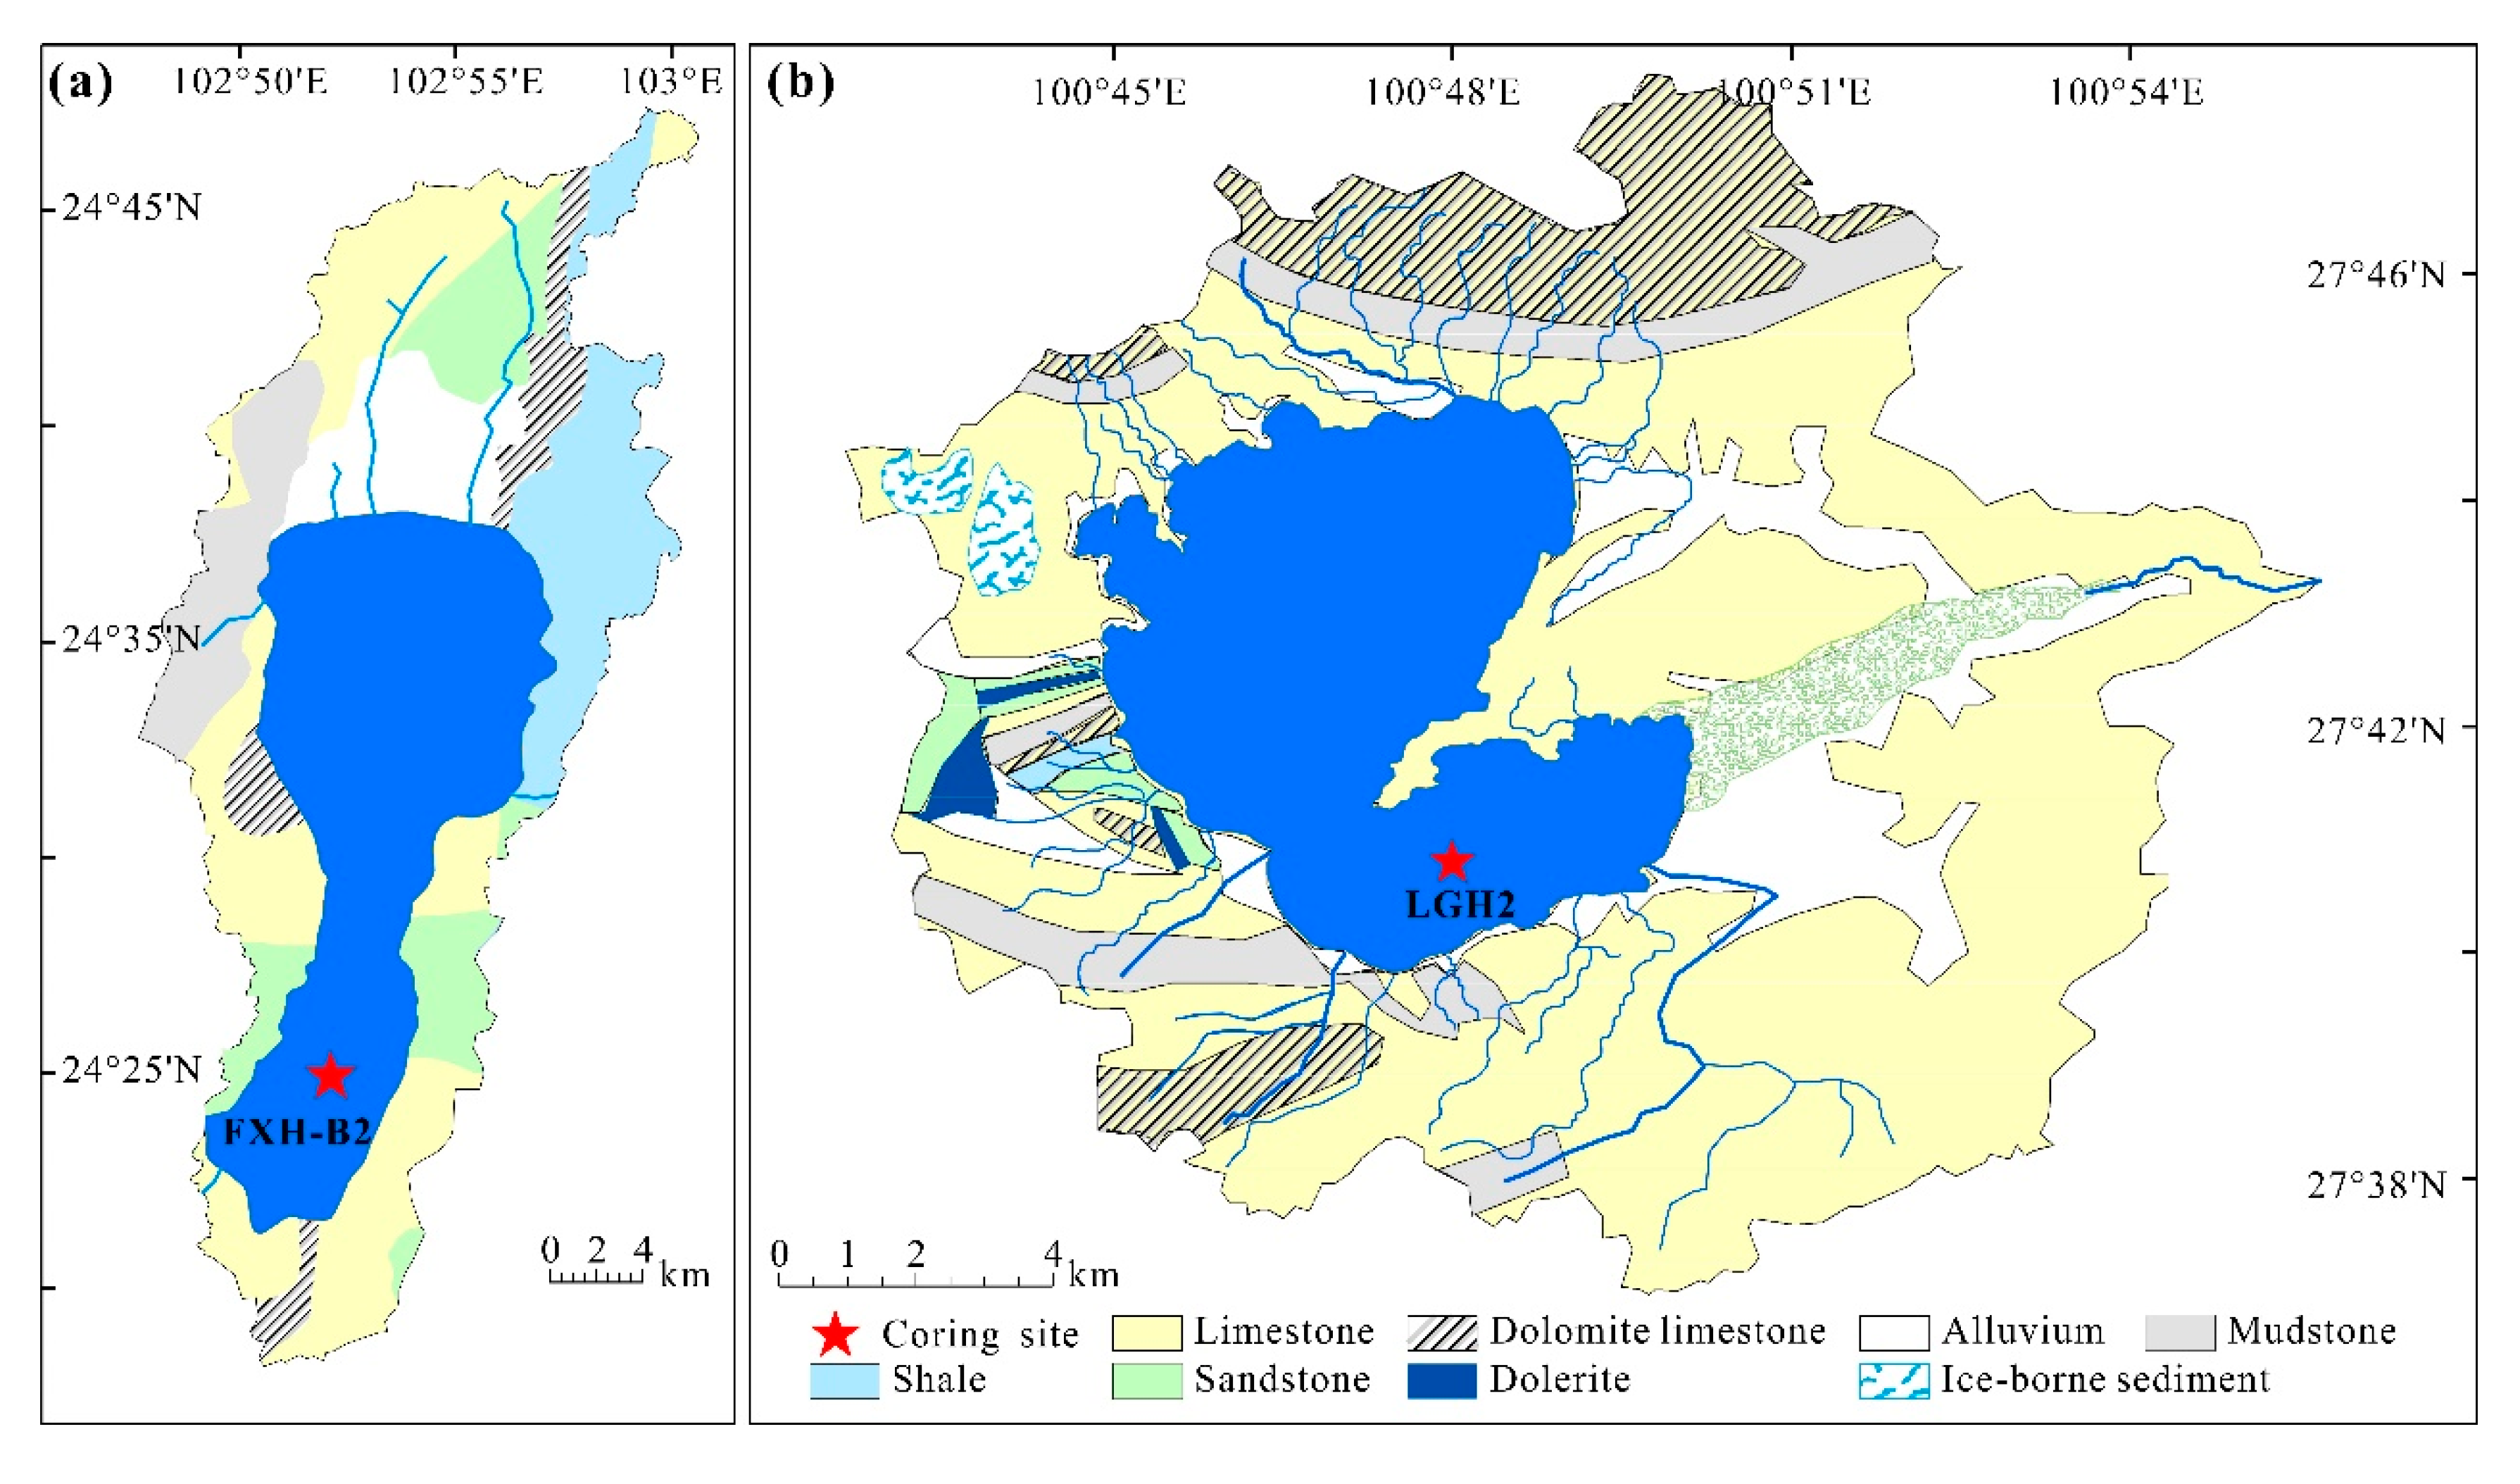
Figure 1. Geological maps with the locations of the cores used in this study. (a) Core FXH-B2 was retrieved from Lake Fuxian, and (b) core LGH2 was retrieved from Lake Lugu. Source: the Bureau of Geology and Mineral Resources of Yunnan Province (1982).
Applsci 10 08012 g001
Figure 2. Downcore changes in XRF-scan intensities (gray and cyan lines) and conventional-fractions (black dots) of core FXH-B2. The black dash line indicates the depth position of 92 cm.
Applsci 10 08012 g002
Figure 3. Downcore changes in XRF-scan intensities (gray and cyan lines), conventional-fractions (black dots), water content (black line), mean grain-size and grain-size sorting (original data are plotted in light grey, with 20-point Savitzky-Golay smooth-filtered data plotted as the red curves) of core LGH2. The black dash line indicates the depth position 744 cm from where the water content increased significantly.
Applsci 10 08012 g003
Figure 4. Downcore changes in NMS calibrated-XRF (gray and cyan lines) and conventional-fractions for core FXH-B2. Note: red dots indicate remaining samples; black dots indicate the reference samples.
Applsci 10 08012 g004
Figure 5. Downcore changes in NPS calibrated-XRF (gray and cyan lines) and conventional-fractions for core FXH-B2. Note: red dots indicate remaining samples; black dots indicate the reference samples.
Applsci 10 08012 g005
Figure 6. Downcore changes in the LRCE calibrated-XRF (gray and cyan lines) and conventional-fractions for core FXH-B2. Note: red dots indicate remaining samples; black dots indicate the reference samples.
Applsci 10 08012 g006
Figure 7. Downcore changes in MLC calibrated-XRF (gray and cyan lines) and conventional-fractions for core FXH-B2. Note: red dots indicate remaining samples; black dots indicate the reference samples.
Applsci 10 08012 g007
Figure 8. Goodness-of-fit statistics of calibrated-XRF for the remaining samples from core FXH-B2. (a) The correlation coefficient R2 between the XRF-scan/calibrated-XRF and conventional-fractions of all fourteen elements in the remaining samples. (b,c) The mean squared relative error (MSRE) and the squared relative error (SRE) of the XRF-scan/calibrated-XRF (NMS, NPS, LRCE and MLC) for all fourteen elements in the remaining samples, respectively.
Applsci 10 08012 g008
Figure 9. Redundancy analysis (RDA) showing relationships between sediment properties (mean grain size, sorting and water content) and element deviations of core LGH2.
Applsci 10 08012 g009
Figure 10. Smoothing curves (black curves) obtained by applying the GAM model based on element deviations and water content for core LGH2. (af) Represent the deviations of element Al, Si, K, Ca, Ti and Fe, respectively. The light-gray shade denotes the 95% confidence limits. Tick marks on the x-axis represent tested samples from core LGH2. Red dots indicate the threshold for the element deviations. The yellow bars indicate the samples (only 57 of the 1081 specimens) with deviant low or high water content which are not included in our discussion.
Applsci 10 08012 g010
Publisher’s Note: MDPI stays neutral with regard to jurisdictional claims in published maps and institutional affiliations.