Article

MobiDiabet: Mobile Telemonitoring System for Patients with Type 2 Diabetes Mellitus (T2DM)

by
Anakaren Alcala Juárez
1,
Manuel Alejandro Hernández Villegas
1,
Eduardo López Domínguez
1,*,
Yesenia Hernández Velázquez
1,
Saúl Domínguez Isidro
1,
Liliana Ovando Diego
2,
Olivia Hernández Sánchez
2,
Jorge De La Calleja
3,
Saúl Eduardo Pomares Hernández
4,5 and
María Auxilio Medina Nieto
3
1
Laboratorio Nacional de Informática Avanzada, Xalapa, Veracruz 91000, Mexico
2
Instituto Mexicano del Seguro Social, Pedro Mora Beristain s/n, Xalapa, Veracruz 91055, Mexico
3
Postgraduate Department, Universidad Politécnica de Puebla, Puebla 72640, Mexico
4
Instituto Nacional de Astrofísica, Óptica y Electrónica, Puebla 72840, Mexico
5
Laboratory for Analysis and Architecture of Systems, CNRS, 31400 Toulouse, France
*
Author to whom correspondence should be addressed.
Appl. Sci. 2020, 10(22), 8036; https://doi.org/10.3390/app10228036
Submission received: 28 September 2020 / Revised: 5 November 2020 / Accepted: 10 November 2020 / Published: 12 November 2020
(This article belongs to the Special Issue New Trends in Medical Informatics)

Abstract

:
According to the International Diabetes Federation, in 2019, approximately 416.7 million people worldwide suffered from type 2 diabetes mellitus (T2DM). T2DM is a chronic degenerative disease of long term and slow progression. This condition requires a strict follow-up by physicians and nutritionists, combined with rigorous adherence to treatment by the patient to avoid possible complications. In this context, this paper describes the analysis, design, development, and preliminary usability assessment of a telemonitoring system focused on the monitoring, control, and remote nutritional therapy of people with T2DM. The proposed system comprises two mobile web applications, one focused on the patient and another oriented to physicians and nutritionists. The central services that our system provides to the patient and health personnel are: generate risk alerts; consult food menu options; receive recommendations; consult results of the food intake frequency questionnaire; patient history management; record anthropometry of patients, and review health education material. We carry out a preliminary usability assessment of our system based on a field study with four physicians, two nutritionists, and seven patients with T2DM. Based on the obtained results, our telemonitoring system shows a satisfactory/favorable opinion in terms of usability from the users’ perspective.

1. Introduction

Considering data from countries reported by the International Diabetes Federation (IDF) in 2019, 463 million people had diabetes, of which 90% had type 2 diabetes mellitus (T2DM) [1]. In México, the 2016 National Health and Nutrition Survey (ENSANUT) reports a prevalence of previously diagnosed diabetes mellitus of 9.4%. On the other hand, and according to the National Institute of Statistics and Geography (INEGI), type 2 diabetes mellitus ranks second as a cause of mortality with 105,574 deaths [2]. Diabetes is a metabolic disorder resulting from insulin secretion deficiency, the inappropriate action of this hormone, or both conditions′ coexistence. Long-term chronic hyperglycemia is accompanied by damage, dysfunction, and various organs′ insufficiency, especially eyes, kidneys, nerves, heart, and blood vessels [3].
According to the official Mexican standard NOM-015-SSA2-2018 focused on prevention, detection, diagnosis, treatment, and control of diabetes mellitus [4], the treatment that patients with T2DM must carry out includes the adoption of a comprehensive management plan, which involves the establishment of treatment goals adapted to the characteristics of the patient, non-pharmacological management, pharmacological treatment, patient education, self-monitoring, and early detection/palliation of complications. Furthermore, the medical personnel, who follow up on these types of patients, must have information about glucose levels, calorie intake, and physical activity that patients perform periodically to identify changes in their state of health early and take the appropriate actions [4].
In this context, some works [5,6,7,8,9,10,11,12,13] have proposed systems focused on the monitoring, control, and treatment of people with T2DM. However, these systems lack necessary services that contribute to the personalized management of diabetes, such as:
  • Recommendations by specialists (physicians and nutritionists) mainly in potential risk situations,
  • Diet control that includes menus and eating patterns prepared by specialists and assigned according to the calories needed by each patient, and
  • An educational approach that guides and sensitizes patients about the possible complications of their condition.
Therefore, in this work, the analysis, design, development, and preliminary usability assessment of a telemonitoring system focused on the monitoring, control, and remote nutritional therapy of people with T2DM is presented. Our system comprises two mobile web applications, one oriented to medical personnel (physicians and nutritionists specializing in this condition) and another focused on the patient. The patient’s mobile web application provides the following services: record glucose data; generation of risk alerts (abnormal ranges); choose several food menu options provided by the nutritionist; consult food equivalent to those suggested; receive and/or consult recommendations made by the nutritionist; review results of laboratory studies; consult health education material, and answer the food intake frequency questionnaire.
On the other hand, the mobile web application focused on health personnel provides the following services: patient medical history management; consult results of the food intake frequency questionnaire; record patient laboratory results; generate recommendations by the nutritionist; register menus and eating patterns by the nutritionist; management of material for health education (videos); and record the anthropometry of patients.
Services developed in our system were reviewed, validated, and evaluated in terms of usability by medical specialists, nutritionists, and patients. Based on the obtained results, our telemonitoring system shows a satisfactory/favorable opinion in terms of usability from the users′ perspective. Therefore, the system proposed in this work can be considered as a software tool that would complement and contribute to telemonitoring, continuous control, personalization of patient treatment, and prevention of complications of T2DM in health institutions.

2. Materials and Methods

Follow-up of patients with T2DM at the Mexican Social Security Institute (IMSS) occurs following the official Mexican standard NOM-015-SSA2-2018 focused on prevention, detection, diagnosis, treatment, and control of diabetes mellitus [4]. The treatment plan includes the setting of aims adapted to the characteristics of the patient, non-pharmacological management, pharmacological treatment, education, and awareness of patients about their condition, self-monitoring, prevention, and early detection/palliation of complications.
The main goals of T2DM treatment are to relieve symptoms, prevent acute and chronic complications, improve quality of life, and reduce mortality from this disease or its complications. Treatment must be tailored to the specific characteristics and needs of the patient. Therefore, the patients′ initial treatment includes non-pharmacological and pharmacological measures, food plans, education, and awareness of patients about their condition, weight control, and physical activity, among others [4].
The health personnel who care for the patients are general physicians/family doctors and nutritionists (see Figure 1). The general physician is responsible for assigning a treatment plan for the patient. The treatment plan must be tailored to the specific characteristics and needs of the patient. To follow-up on this plan, the general physician reviews, in each consultation, the laboratory results and a booklet with the results recorded by the patient of the different glucose tests applied daily. The frequency of medical consultations depends on the compliance level with the goals established in the treatment and clinical evolution. Metabolic control and identification of possible health complications are done during the medical consultations with the general physician, as well as other activities such as the record of the patient’s weight, record of his blood pressure, and strength of his education. Each patient requires laboratory studies at least once a year; these studies include blood chemistry test, general urine test, thyroid profile test, complete blood count, among others.
On the other hand, the nutritionist is responsible for establishing food plans. To achieve this, the nutritionist analyzes and considers the patient’s habits to make relevant recommendations that contribute to achieving treatment goals. Therefore, patients need to input the type and frequency of eating specific foods. In consultations with the nutritionist, the appropriate diet is indicated according to the patient’s ideal weight’s caloric requirements. In this regard, the anthropometry record (body measurements) is performed to help in the diet assignation. Visits with the nutritionist are usually monthly (see Figure 1).
Patients with T2DM can live without acute and chronic complications by adopting a treatment tailored to their specific characteristics and needs that involves non-pharmacological management, pharmacological treatment, education, and awareness of patients about their condition, self-monitoring, prevention, early detection/palliation of complications, and continuous control with specialists. Therefore, our system’s analysis and design are based on the current monitoring and control process carried out in the IMSS for patients with this chronic disease, which aligns with the official Mexican standard NOM-015-SSA2-2018. To prove the system usability, tests were carried out under fictitious cases, and then the field study was carried out by means of the selection, for convenience, of a sample obtained from the population of patients with T2DM, with the approval of the Local Committee for Health Research (Research Ethics Committee) of the LANIA (Project identification code: 2016412-2016755-IIDIABETES) and the signing of informed consent by participants.
The analysis and design models of the applications that compose the proposed system are presented below. In this regard, different diagrams are used for a better understanding of the modeling. The diagrams for this purpose are: use case diagrams, data model, and component diagram with detailed descriptions to show the action scenarios and expected behavior.

2.1. Use Case Diagrams

Use case (UC) diagrams describe actions of the system behavior from the user’s perspective. These diagrams reflect how medical, nutritionist, and patient users interact with the system and what they must do to obtain the expected result. In our telemonitoring system for patients with type 2 diabetes mellitus, a total of 25 use cases were grouped into four diagrams: (a) Security, (b) General physician follow-up, (c) Nutrition, and (d) Patient application. Figure 2 shows the users, also named actors, who interact with the proposed telemonitoring system for patients with T2DM:
  • Doctor/physician: This actor is a general physician, with an intermediate level in the use of technology, which provides care to different patients monthly and with access to consultations with internet infrastructure.
  • Nutritionist: The nutritionist actor is a nutrition specialist, with an intermediate level in the use of technology, serving multiple patients monthly, and with access to internet infrastructure.
  • Patient: This actor is a person with a diagnosis of T2DM, with first level care, i.e., medical care, provided in family medicine units. For this type of user, the experience in the use of technology is not mandatory.
  • Administrator: This actor can be a general physician, with an intermediate level in the use of technology, with access to internet infrastructure.

2.1.1. Security UC Diagram

Figure 3 shows the UC diagram of security. The actors involved in this diagram are the physician, nutritionist, administrator, and patient.
  • UC-01 Authenticate: In this UC, users enter their user information, such as username and password, to get access to their respective applications.
  • UC-02 CRUD Users: The user who interacts with this UC is only the administrator who is the exclusive actor who can create, read, update, and delete physicians, nutritionists, and patients of the system.
  • UC-03 Videos Management: This UC aims to handle the health education material and add links to videos.

2.1.2. General Physician Follow-Up UC Diagram

This diagram consists of six UCs, in which the user doctor/physician performs tasks such as medical history, consultation of glucose records, patient progress, video report, history of alerts, and the registration of laboratory results (see Figure 4).
  • UC-04 CRUD Clinical history: This UC is for the management of the patient’s medical history; the general physician is in charge to create, update, and delete the medical history information concerning the patient’s health status.
  • UC-05 Consult glucose results: In this case, the physician can review the glucose results that the patient has been recording and are presented in a table indicating the test date, type of blood glucose test, and the glucose result.
  • UC-06 Consult patient progress: The physician can review monthly all the results of a patient, which are displayed in graphs, to see the progress.
  • UC-07 Consult video report: This section of health education shows the videos that the patient has seen.
  • UC-08 Consult alert history: In this section, the physician can review all alerts generated to a patient when recording glucose results.
  • UC-09 CR Laboratory studies: The physician can record the results of the different laboratory studies such as blood chemistry test, liver biometrics, thyroid profile test, general urine test, and liver function test, which have been performed on the patient. Furthermore, the physician can also see the records with reference values.

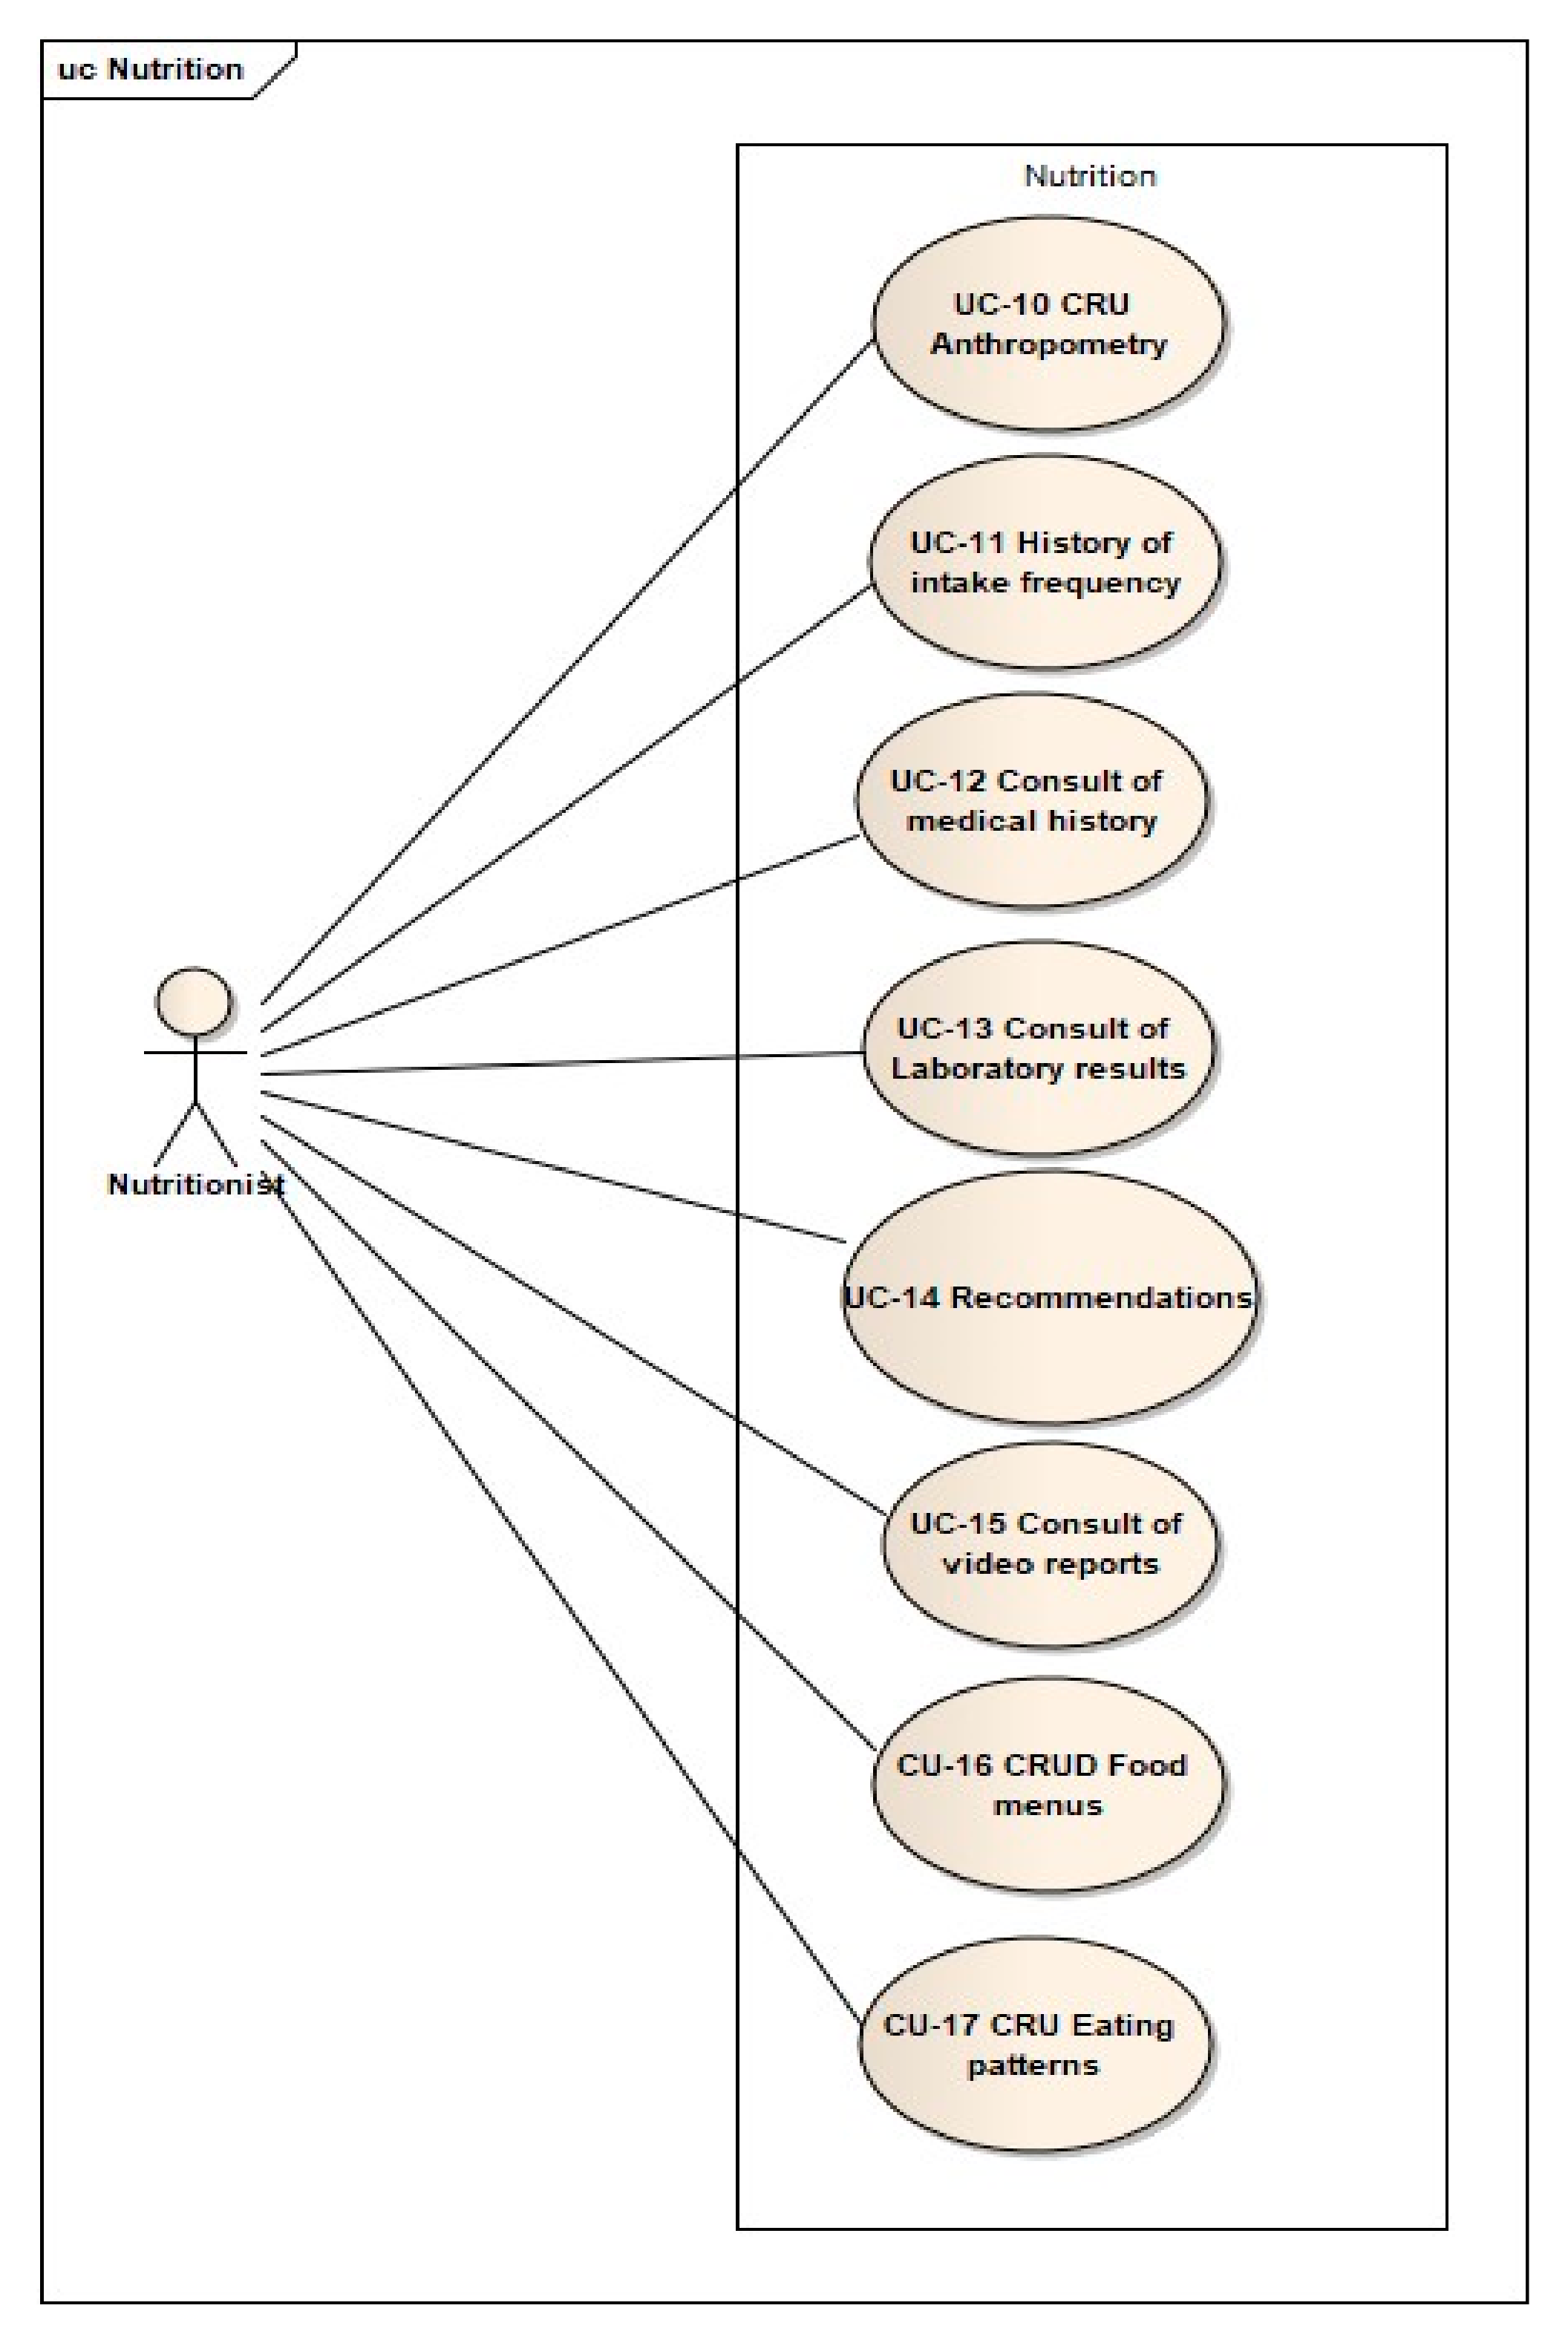
2.1.3. Nutrition UC Diagram

It is composed of eight UCs, in which the main actor is the nutritionist, who interacts with the system through the following use cases (see Figure 5).
  • UC-10 CRUD Anthropometry: This allows the nutritionist to record the anthropometry data of patients, to assign an appropriate food plan, and to monitor their treatment.
  • UC-11 History of intake frequency: This UC allows the nutritionist to review the responses to the frequency of food intake questionnaire, which patients respond to before an appointment.
  • UC-12 Consult of medical history: This enables the nutritionist to monitor the information about the patient’s medical history.
  • UC-13 Consult of Laboratory results: This allows the nutritionist to review patient laboratory data and the general physician reports.
  • UC-14 Recommendations: This UC allows the nutritionist to submit personal recommendations to patients.
  • UC-15 Consult of video reports: Through this UC, the nutritionist can see the list of videos that each patient has seen from the health education section.
  • UC-16 CRUD Food menus: This use case allows the nutritionist to manage the food menus that will be consulted by the patients.
  • UC-17 CRU Eating patterns: This use case allows the administration of eating patterns that the nutritionist can add and modify, which patients can consult.

2.1.4. Patient Application UC Diagram

This diagram includes nine use cases aimed at the patient-user, who performs different tasks, such as consult of the menu and eating patterns, consult of informative videos, recommendations, alerts, laboratory results, registration of glucose results, among others (Figure 6).
  • UC-18 Consult food menu: The patient can consult the different food menus with the calories previously assigned by the nutritionist.
  • UC-19 Consult eating pattern: The patient sees the eating pattern assigned by the nutritionist.
  • UC-20 Consult equivalent foods: The patient can choose the food groups containing a list of foods that have the quantity and measure unit appropriate to intake.
  • UC-21 Record questionnaire responses: the patient answers to the questionnaires in this UC to know the type and frequency of the food that he eats. The nutritionist will consult the answers in UC-11.
  • UC-22 Consult recommendations: The patient can see the recommendations that the nutritionist sent before.
  • UC-23 Record glucose results: This allows the patient to records glucose results depending on the type of blood glucose test performed.
  • UC-24 Consult glucose history: The patient can check the history of all glucose reports.
  • UC-25 Consult laboratory results: This allows the patient to review the results of laboratory tests that the physician previously recorded.
  • UC-26 Consult health education videos: Through this UC, the patient can consult and view videos recommended by physicians in the health education section, and mark those the patient has seen.

2.2. Data Model

The data model describes the structure of the telemonitoring system database for patients with T2DM, which is established in the PostgreSQL database manager (see Figure 7). The database of the proposed system is composed of 35 tables that include primary keys to identify each entity (or table), as well as foreign keys that represent the relationship between tables. The database is prepared in order to be adapted to system updates, i.e., if it is required to add tables or attributes in the existing ones, it is also prepared for the development of food menus by the nutritionist and the modification of the reports about the food intake frequency questionnaire. This data model also shows the relationships between tables that guarantee the integrity of the stored information.
The main tables of the data model of the proposed system are described below. Tables′ names, in Figure 7, are presented in Spanish according to the database implementation.
  • FoodsItems: This table contains the food items with the details of the equivalent system.
  • AlertsToDoctor: This table stores the generated alerts when patients record inadequate glucose levels.
  • Anthropometry: The nutritionist uses this table for allocating caloric intake. This table is associated with a specific food group and is related to the patient’s table.
  • HematicBiometry: This table contains all registers of the patient’s laboratory results.
  • QuestionnaireIF: This stores all the responses to the food intake frequency questionnaire.
  • VideoStatus: This table is linked to Videos and Patients tables, and this has the registers of the videos seen by the patients.
  • Urinalysis: This table contains the results of the patient’s laboratory studies.
  • LiverFunction: This table has the results of the liver function test of a patient.
  • FoodGroups: This table contains food groups such as vegetables, fruits, legumes, among others.
  • MedicalHistory: This table contains fields concerning the management of the patient’s medical history.
  • Doctor: This contains the ID number, specialty, and other information on the health personnel.
  • FoodMenus: This stores the description, calories, and food menus.
  • Nutritionist: This contains the nutritionist’s ID number that is related to multiple patients.
  • Patients: This table contains patients′ data and relationships with the health personnel in charge of each one among other useful information.
  • NutritionalPattern: This table contains the nutritional pattern assigned by the nutritionist.
  • ThyroidProfile: This contains the results of thyroid function tests.
  • BloodChemistry: This table contains the laboratory results recorded by the patient of his blood chemistry tests.
  • RecomendationsToPatient: This stores the recommendations that the nutritionist makes to patients.
  • GlucoseResults: This table is one of the most important, because this contains the glucose results that the patient records, and this is related to the Patients and AlertsToDoctor tables
  • LaboratoryResults: This contains the relationship with the table of patients and the different laboratory results such as blood chemistry test, thyroid profile test, general urine test, liver function test, and complete blood count.
  • Rols: This table is one of the main ones, because it holds the types of users that can access the system.
  • Users: This is one of the main tables, because it contains the general information of the users registered in the system, both health personnel and patients.
  • Videos: This contains the description and link of the videos for the health education section.

2.3. Component Diagram

The architecture and technologies used in the proposed system are presented through a component diagram; each element of this diagram is an essential part of the system, see Figure 8. In this regard, we rely on the model-view-controller (MVC) pattern, which separates the business logic from the user interface as follows:
  • Model: This component is exclusively responsible for managing the application data and storing the information that users add.
  • View: This represents the model state, without being directly linked to this component; its goal is to show the information to the user.
  • Controller: This component represents the link between the model and the view. It is responsible for notifying the model when the user manipulates the view and is responsible for managing the changes that the user makes.
The main advantages of the MVC pattern include the scalability of the application; it favors the adaptation and growth of the application and the maintainability, because it is composed of independent modules, and changes in modules would cause a minor impact on parts that could be associated [14].
As the component diagram shows (Figure 8), the technologies adopted for the View were HTML and Angular, which makes requests to the Spring MVC controller. These requests are executed through Web services (RESTful) connected through objects to the Spring entities, which apply Data Access Objects (DAO) connection entities. DAOs are connected to the database model in PostgreSQL by means of the Java Persistence API (JPA). The description of the components is as follows:
  • Web mobile application: Handles elements present in the graphical user interface.
  • Data Access Object: Maps the information that is stored in the database. This mapping is performed to manipulate the information from code before appearing at the graphical interface or database.
  • Spring MVC controller: Controls the application logic and responds to requests from the graphical interface or some other process that perform requests.
  • Database: Manages the system’s database.
Figure 8 shows the proposed technologies to implement the components of the system. A description of these technologies is as follows:
  • PostgreSQL is an open-source relational database system.
  • Angular is a web application development framework made in JavaScript by Google. Angular is flexible to work with different patterns.
  • Java is a multiplatform programming language that can be used to create different applications for personal computers, mobile devices, or the web.
  • Spring MVC is an open-source framework that works as a framework for the Java platform.

3. Results: Telemonitoring System

The proposed system was developed according to the design guidelines established in the previous section. This section describes services that allow the health personnel and the patient to carry out the monitoring, control, and remote nutritional therapy in people with type 2 diabetes mellitus (T2DM). Performed tests for each application are also described to ensure the correct functioning of the system.

3.1. Mobile-Web-Application Focused on Health Personnel

This mobile web application for medical personnel holds 12 services, including user authentication. The primary services of each user are described below: administrator, physician, and nutritionist.

3.1.1. Administrator User Services

These application services are for the registration of medical personnel, nutritionists, and patients (see Figure 9). The only user who can access these services is the administrator user. The administrator can update the information of a patient, physician, or nutritionist by selecting the edit section (see Figure 9). Some users share the same type of information for registration; however, their data vary depending on the type of role, requesting other information such as specialty, office, and hours of attention (see Figure 10 and Figure 11). The administrator is also the one who attaches details and links to the videos for the health education section, as shown in the screenshot of Figure 12. It also has a section where one can view a table with the videos that have been registered (see Figure 13).

3.1.2. Physician User Services

This section presents the services of the general physician user. The general physician’s main menu contains a table in which the list of patients assigned to monitor the T2DM treatment is presented (see Figure 14). The physician must select a patient to access the system’s specific services of monitoring, control, and treatment. These services are described below.
Clinical history module. The clinical history consists of 5 sub-modules: clinical history, glucose results, patient treatment progress, video report, and report or alert history (see Figure 15). Each one presents different information that is only available to the physician and nutritionist. The sub-modules are described below.
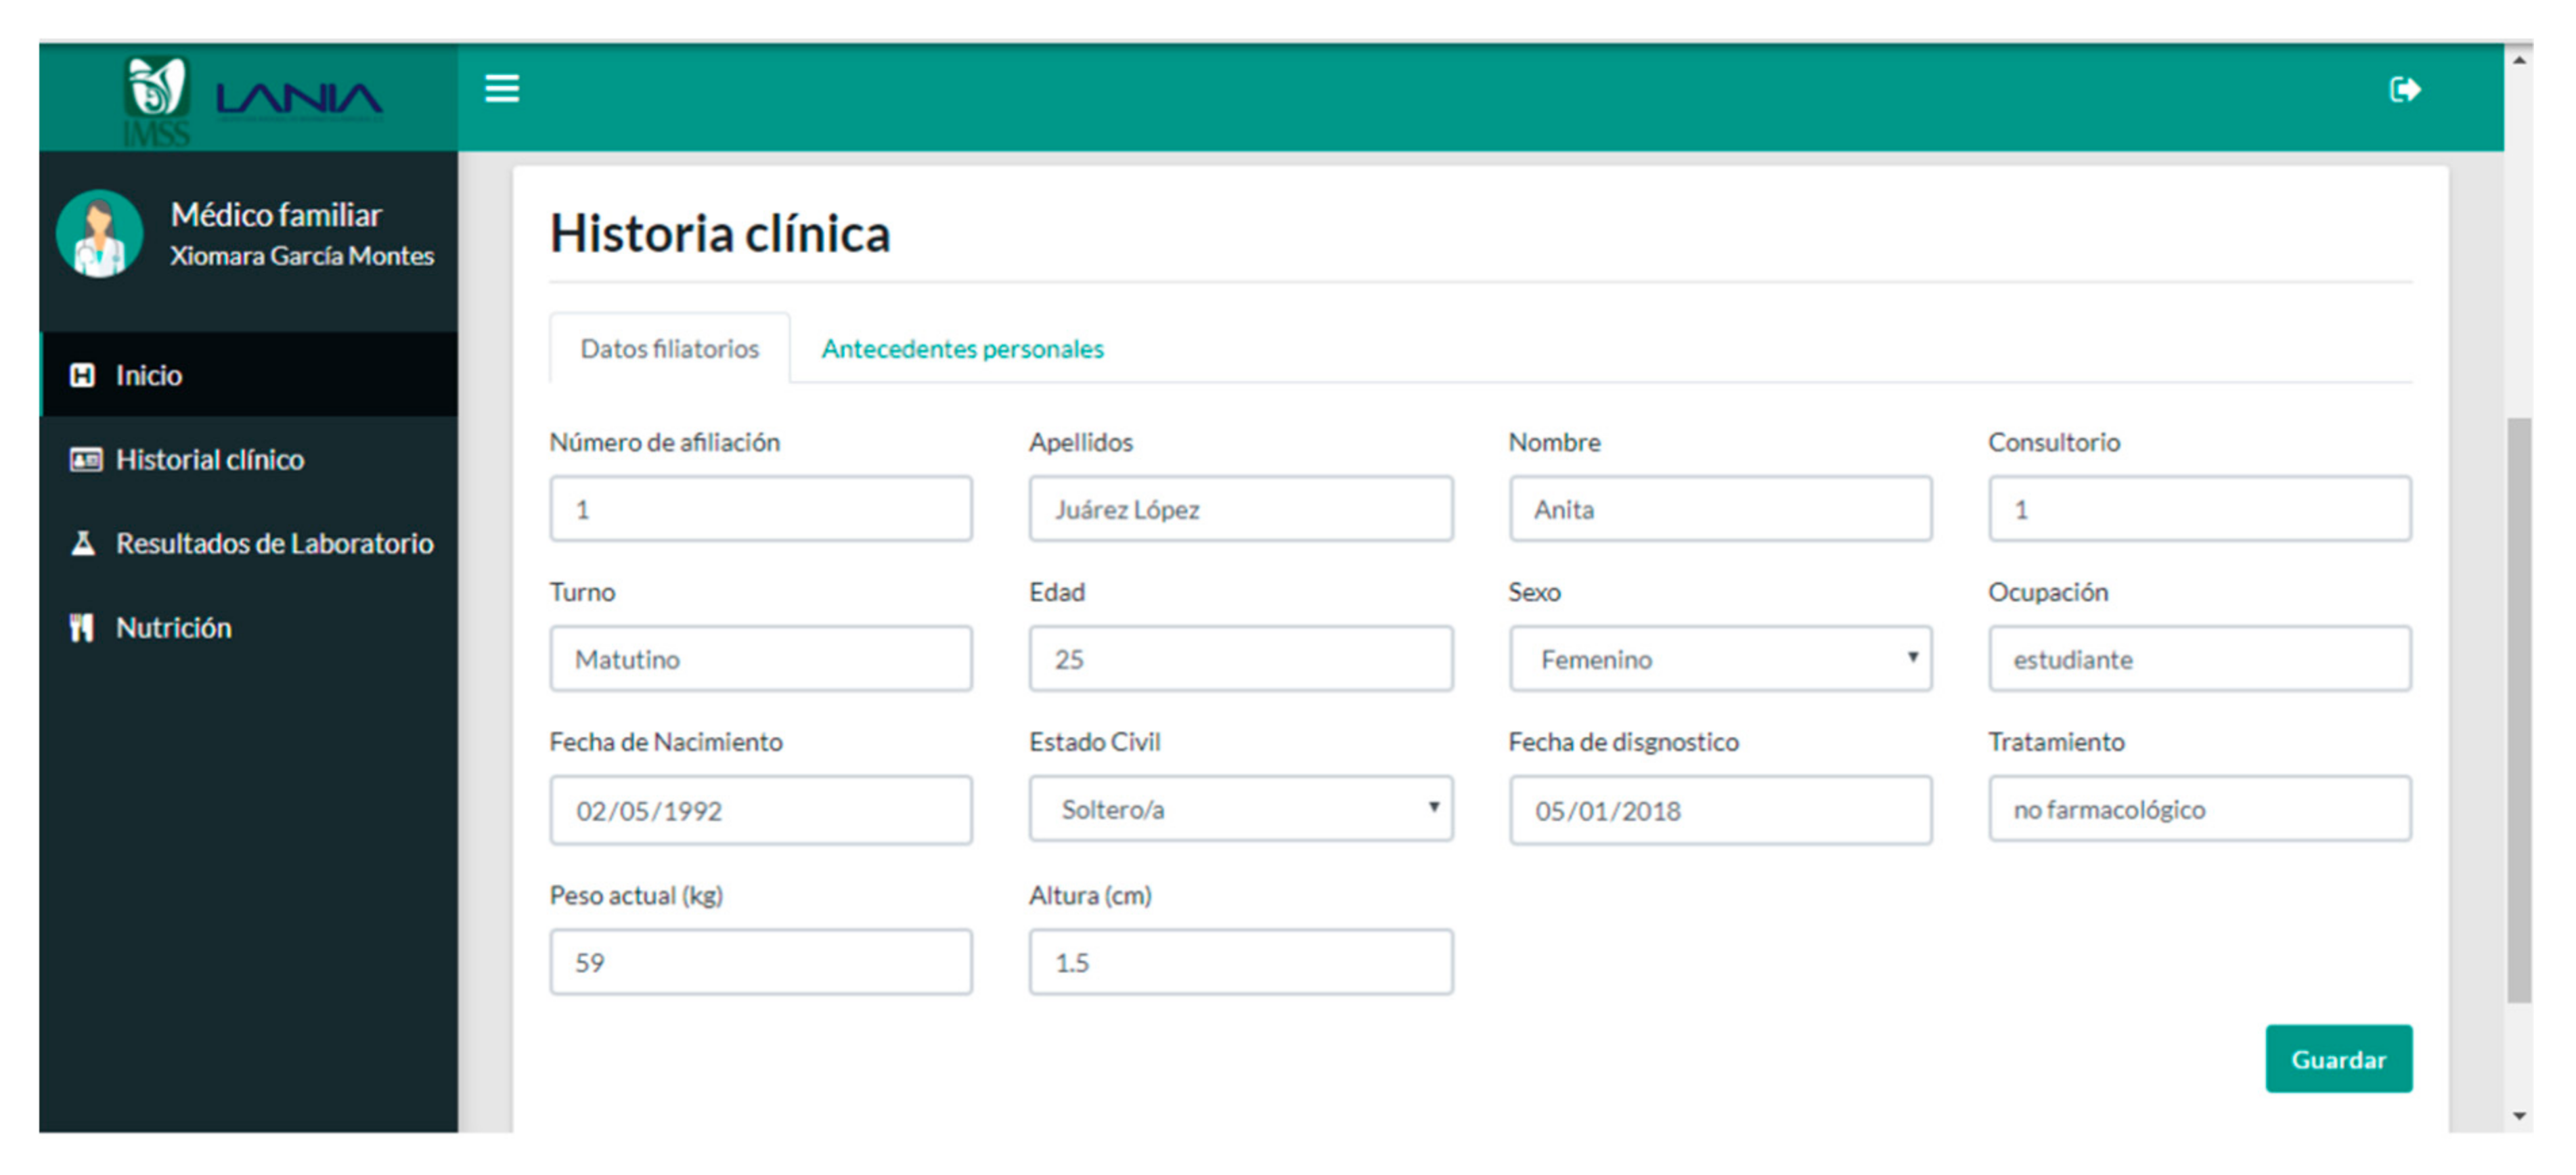
  • Clinical history: This option is composed of two sections (see Figure 16). The first section shows the patient’s data, such as membership number, name, birth date, occupation, weight, height, age, marital status, date of diagnosis, and treatment. On the other hand, the second section is composed of personal history, which is divided into two groups: harmful habits and pathological personal background (see Figure 17). The option of harmful habits is recorded if the patient consumes alcohol, tobacco, or drugs. Concerning pathological personal background, chronic diseases, allergies, trauma, and surgical issues that the patient has suffered are recorded.
  • Glucose results: In the glucose result sub-module, the physician can visualize the results that the patient enters from the patients′ application, with the details of the date, type of blood glucose test, and result. In this service, the physician can filter the results by periods of specific dates and types of blood glucose test (see Figure 18).
  • Patient treatment progress: This sub-module shows to the physician the evolution of the patient’s glucose levels in graph format. The patient’s glucose levels are represented with a blue line, and the red lines represent the acceptable ranges of upper and lower glucose levels; the graph is consulted for a date period and the type of blood glucose test (preprandial and postprandial) (see Figure 19).
  • Video report: The video report sub-module is proposed to report to the physician the videos that have been consulted by the patient through the patients′ application. This section shows a table with the name and status of the video; if the video is not in the table, it means that the patient has not seen it (Figure 20).
  • Alert history: In this sub-module, the physician has a list of different alerts that the system reports based on the data entered by the patient. These alerts are generated when a patient records glucose levels outside the fixed acceptable range (see Figure 21). The physician can see the date on which the alert was generated, the type of blood glucose test, and the description.
Laboratory results module. In this module, physicians can record different laboratory results such as blood chemistry test, complete blood count, general urine test, liver function test, thyroid profile test, among others (see Figure 22). Each sub-module has the required fields for the income of the corresponding results (see Figure 23).
The sub-modules of laboratory results have histories of each registered study (see Figure 24).
When selecting the display button, the detailed description of the selected laboratory result is presented. Each result is compared with the reference values. The system marks the results with *A when the lab result shows high values, and with *B when the lab result shows low values (see Figure 25).
Nutrition/general physician module. In this module, the physician can visualize the pattern and nutritional menu that the nutritionist previously assigned to the patient (see Figure 26). This section is a support for decision-making in the treatment of the patient and cannot be modified by the physician.

3.1.3. Nutritionist User Services

This section presents the modules′ services specific for users with a nutritionist role from the mobile web application. The first step to access these services is to select a patient (see Figure 27).
The main services provided by the system to a nutritionist are nutrition, load patterns, and food menus. These services are described below by modules and sub-modules.
Nutrition module. This module is composed of four sub-modules aimed at the registration and consultation of general parameters such as height, weight, age, among others, which are essential for the calculation of body mass index, adjusted weight, required calories, among others:
  • Anthropometry: For the patient’s anthropometry record, the nutritionist first verifies or adjusts the current height and weight fields, and the system automatically calculates the ideal weight, overweight (additional body weight), body mass index, total calorie requirement, fiber intake, total caloric value (TCV), and adjusted weight (see Figure 28). This module assists the nutritionist in determining the eating plan to be assigned to the patient. This sub-module also provides a history of anthropometry records.
  • Menu and eating pattern: In this service, the menu and eating pattern assigned to the patient is presented (see Figure 29). This section shows to the nutritionist and general physician the nutritional plan of the patient in order to provide information for adjustment or change of treatment of the patient.
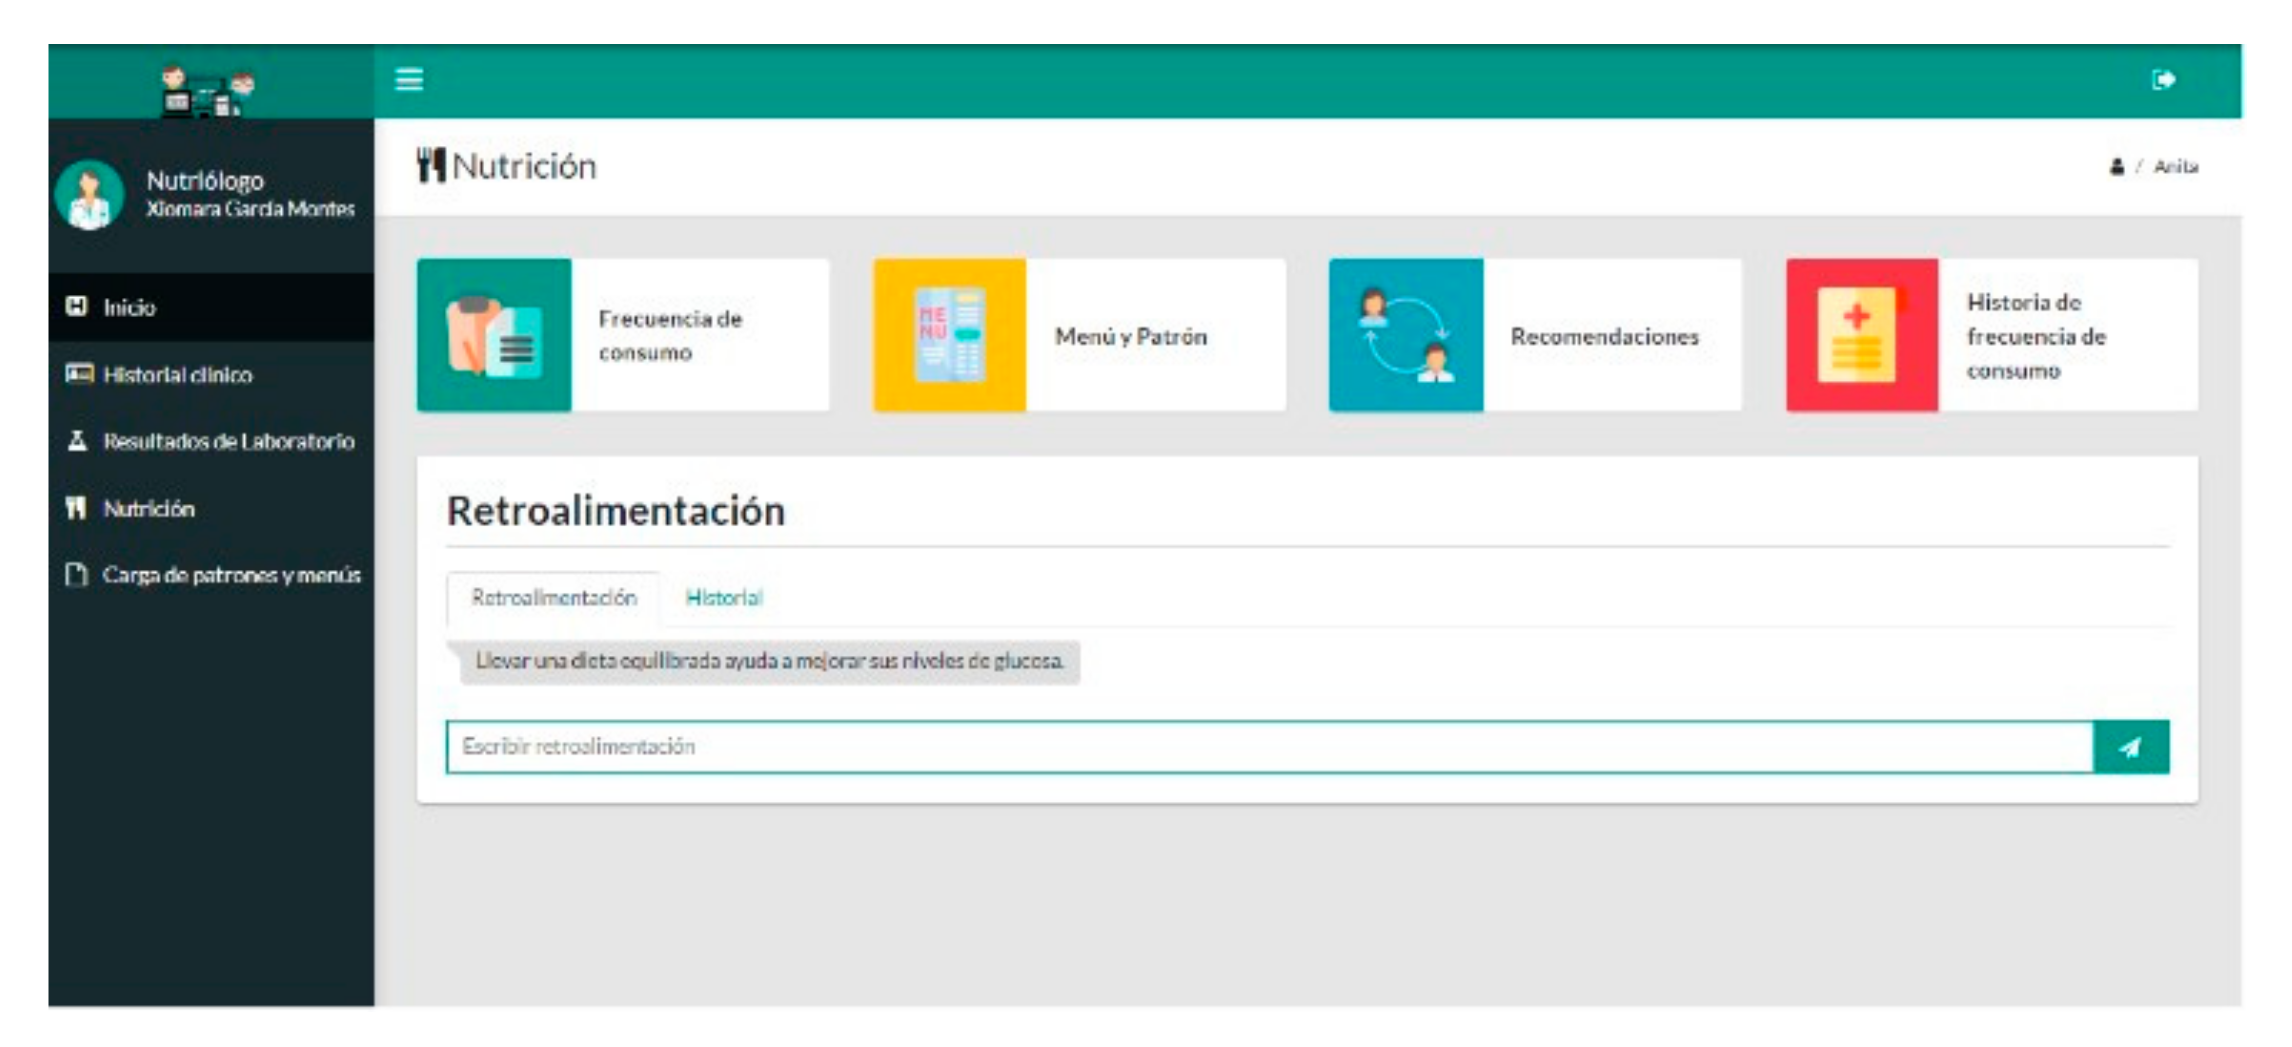
  • Recommendations: This sub-module provides a service that allows the nutritionist to make recommendations in real-time to the patient to adjust the progress of nutritional management (see Figure 30). This service allows the nutritionist to communicate with the patient continuously and remotely. It also provides a history of the recommendations sent to the patient. Based on the current monitoring and control process carried out for patients with T2DM, which aligns with the official Mexican standard NOM-015-SSA2-2018 [4], the physician must only make recommendations and/or modifications to pharmacological treatment of the patient in-person medical consultations through a medical prescription. Therefore, this functionality was not integrated into the physician’s services.
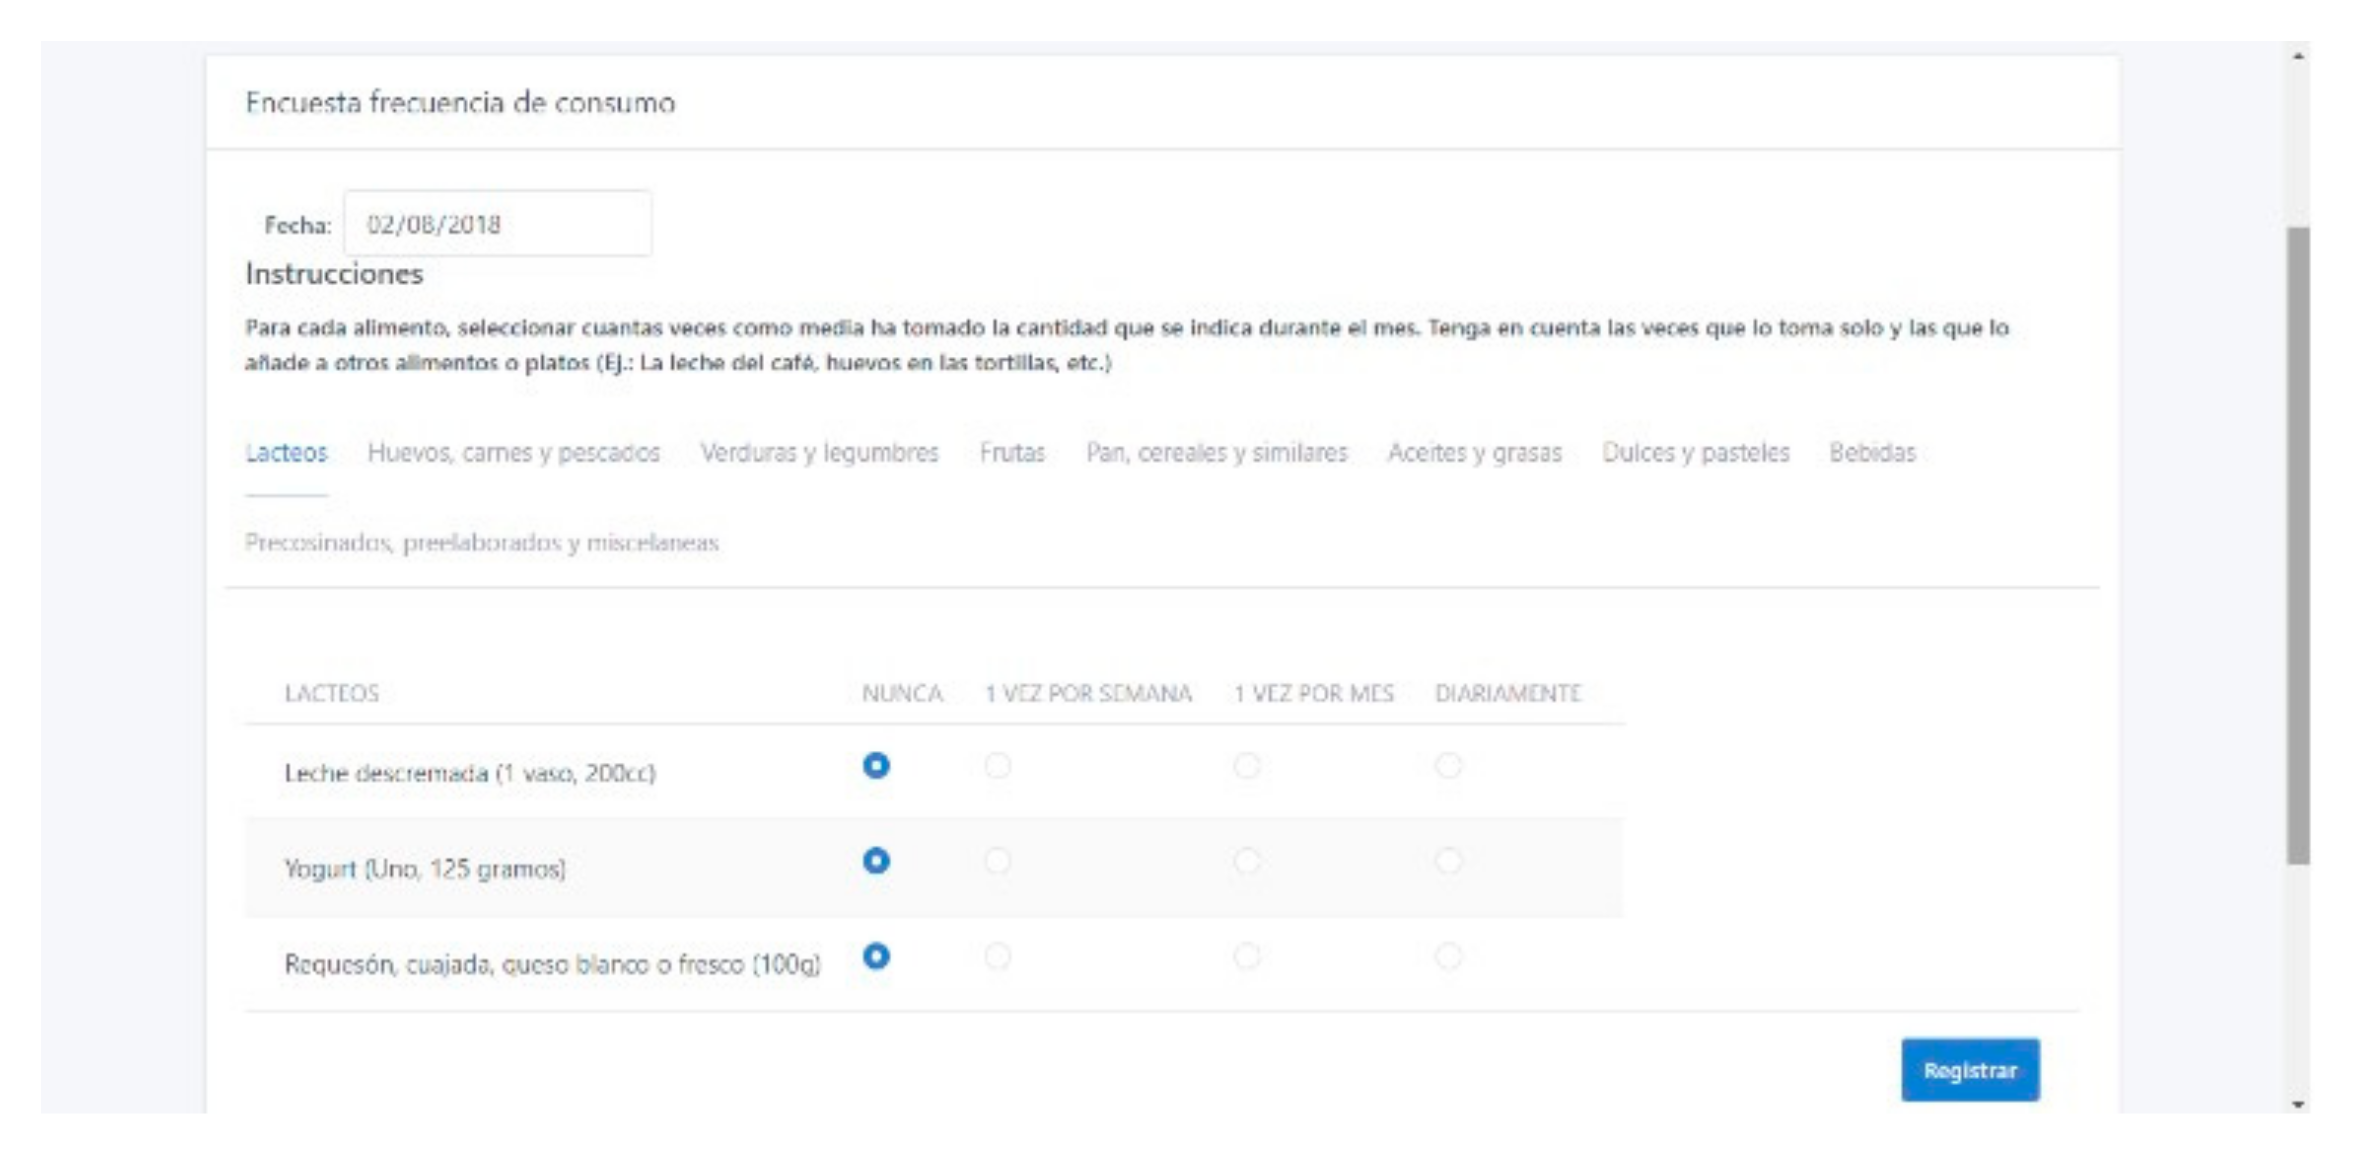
  • History of intake frequency: This section is for the visualization of responses in the food intake frequency questionnaire that patients complete from their application (see Figure 31). This section helps the nutritionist observe foods frequently eaten by the patient to consider them in the elaboration of food menus assigned to the patient.
Load patterns and menus module. The main function of this module is the registration of eating patterns and menus by nutritionists. These eating patterns and menus can later be assigned to patients (see Figure 32).
  • Patterns: In this service, the nutritionist records and edits the eating patterns that are assigned to patients (see Figure 33).
  • Menus: In this service, the nutritionist can record different food menus that are displayed by patients (see Figure 34). The sub-module also has a menu history section, in which the nutritionist can see a list of menus added to the system and remove them (see Figure 35).
The nutritionist also has access rights to consult the information about general physician modules such as clinical history and laboratory results.

3.2. Mobile-Web-Application Focused on the Patient

This patient-oriented mobile web application provides ten services, including user authentication. The main services are described below.

3.2.1. Glucose Record

In the glucose registration module, the patient enters the results of his glucose levels; if the results are outside the ranges established by physicians, alerts are triggered with messages that recommend to the patient a set of preliminary actions that should be taken. Both messages and ranges for alerts were defined by medical specialists (see Figure 36). This is one of the main services, because the data that are recorded are an essential factor for the monitoring and treatment of patients to detect timely and avoid risky situations.
This section also has a history of laboratory results (see Figure 37), with the objective that the patient observes the progress of the treatment.

3.2.2. Health Education Module

In this module, patients can view different videos related to their illness and treatment. These videos are produced and provided by IMSS medical specialists (see Figure 38). The purpose of these videos is to educate and increase awareness among patients about their illness and the benefits of adopting healthy eating habits to avoid complications.

3.2.3. Laboratory Result Module

In this module, the patient can visualize the results of laboratory tests that the medical personnel register, have the sections of blood chemistry test, complete blood count, general urine test, liver function test, and thyroid profile test (see Figure 39).

3.2.4. Nutrition Module

In this module, the patient can consult the eating pattern, assigned menus, and feedbacks, and answer the food intake frequency questionnaire. These services are described below:
  • Pattern: This service shows the patient a scheme for the distribution of rations by food groups assigned by the nutritionist. These eating patterns are previously registered by the nutritionist and are changing according to the indicated calories (see Figure 40). This scheme provides each food group’s list with the different foods and the suggested portions for consuming (see Figure 41).
  • Menus: This service shows the patient, based on the calories established by the nutritionist, different food menu options so that the diet can be varied (see Figure 42).
  • Food intake frequency questionnaire: In this sub-module, the patient answers the food intake frequency questionnaire to inform on food intake preferences (see Figure 43).
  • Recommendations: This sub-module shows recommendations that the nutritionist sends to the patient; the information includes the date and the details of the recommendations. The patient can also search for the recommendations that the nutritionist sent in some range of dates (see Figure 44).

3.3. System Tests

This section describes the tests performed on both applications that compose the system in order to verify its correct operation. The format of the tests performed was as follows (see Table 1):
First, the modules were independently tested, and then integration tests with the patient application were carried out. Tests performed included medical users, nutritionists, and patients.
Tests of health personnel application services.
Table 2 shows the results of the tests performed on the web application services aimed at health personnel. In this table, the services, errors found, resolved, pending, and the iterations performed with different scenarios are listed.
According to the results presented in Table 2, all the identified errors (EF) were corrected and verified again in the third iteration (I) of tests.
Test of patient application services.
Table 3 summarizes the test performed on the patient-oriented application. This table lists the services, errors found (EF), solved (ES), pending (PE), and the iterations (I) performed with different scenarios. The application tests were carried out with the three users of the system, a patient, a physician, and a nutritionist, under a simulated scenario of monitoring and control of the T2DM nutritional therapy.
All tests were carried out by a LANIA (Laboratorio Nacional de Informática Avanzada) quality tester team. Afterward, the system was validated by general physician/family doctors and nutritionists involved in its development.

4. Preliminary Usability Assessment of the Proposed System

We carry out a preliminary usability assessment of our system based on two approaches. The first approach was to evaluate the usability of the system based on a field study with the cooperation of 13 users: 4 medical users, 2 nutritionists, and 7 patient users. In order to measure the effectiveness of the user interface and to identify specific system problems, an assessment was also carried out by three experts of the User-Centered Interactive Systems area, who applied the method of heuristic usability review based on the SIRIUS questionnaire [15]. Both usability assessment approaches of our system are detailed below.

4.1. Description of the Preliminary Usability Assessment of the System Based on a Field Study

In order to measure the quality in the use of both proposed system applications, in this work, a preliminary usability assessment was carried out on the system based on a field study. According to the guidelines of quality in use model of a software product defined in the standards ISO/IEC 25,010 and ISO/IEC 25,022 [16], the following aspects of our system were evaluated: efficiency, effectiveness, satisfaction, presentation, content, and navigation. In order to accomplish the evaluation, the following usability measurement instruments were developed and/or used:
  • Instrument 1: List of tasks to measure effectiveness and efficiency.
  • Instrument 2: User interface satisfaction questionnaire.
  • Instrument 3: Questionnaire of product quality metrics to measure presentation, content, and navigation.
In evaluating and obtaining results, the formulas of the metrics defined in the ISO/IEC 25,022 standard [16] were applied.

4.1.1. Field Study Description

In order to implement the system in a real environment, a set of training for each application service were carried out for users interested in participating in the field study: 4 medical users, 2 nutritionist users, and 7 patient users. The training took place at Veracruz, Mexico. After the capacitation, users began using the respective applications for six months.

4.1.2. Description of Usability Instruments

The instruments used to measure the usability aspects (efficiency, effectiveness, satisfaction, presentation, content, and navigation) of our system are described below.
Description of Instrument 1.
Instrument 1 is a specific task list test for each of the users who were interacting with different system services. This test is divided into two sections, the first section allows to measure the effectiveness in the completeness of tasks, and the second allows to measure the efficiency in the time of tasks performed in the system.
For patient users, the effectiveness and efficiency in health education, nutrition, glucose registration, and laboratory results services were evaluated, this questionnaire consisted of completing 14 tasks corresponding to each service and recording the time spent to perform each one.
For general physician/family doctor users, the effectiveness and efficiency in the clinical history, laboratory results, and nutrition services were evaluated. This questionnaire consisted of completing 18 tasks corresponding to each service and recording the time spent to perform each one.
Regarding the nutritionist users, the effectiveness and efficiency in the services of clinical history, laboratory results, nutrition, load pattern, and menus, were evaluated. This questionnaire consisted of completing 17 tasks corresponding to each service and recording the time spent to perform each one.
Description of Instrument 2.
We used the QUIS 7.0 [17] as our Instrument 2 to measure user interaction satisfaction. This questionnaire consists of thirty-two questions grouped into six categories:
  • Global reaction to the system: Includes questions to know the user’s perception regarding utility, flexibility, facility, among other aspects.
  • Screen: Includes questions aimed at evaluating screen characteristics such as typography, design, distribution, and sequence.
  • System terminology and information: Evaluates whether the terms applied help users to reach their goals and if there is consistency in the positioning and content of the messages.
  • Learning: Collects information about user facility in learning to use the software.
  • System capabilities: It allows identifying the performance and recovery capacity of the system before errors are caused by the user.
  • Ease of use and user interface: Evaluates general aspects of the software interface design.
In this questionnaire, users must answer the questions using a scale of points from 0 to 9. Scores from 0 to 3 are considered as an unacceptable level, from 4 to 6 an acceptable level, and from 7 to 9 a satisfactory level.
Description of Instrument 3.
Our Instrument 3 is an adaptation of the questionnaire for the quality of a product in use and web system, introduced previously [18], which consists of 25 questions related to three characteristics included in a web information system: content, navigation, and presentation. This Instrument is answered through a Likert-5 scale, comprising 5 options: (1) Strongly disagree, (2) Disagree, (3) Neutral, (4) Agree, and (5) Strongly agree. In the content characteristic, the questionnaire measures aspects such as consistency, conciseness, interpretability, updated, significant, and adaptation to the user’s needs. Concerning the presentation characteristic, the questionnaire measures: uniformity and color, uniformity of distribution, consistency in links and controls, compatibility with browsers, readability of information, setting default values in the user interface, data validation, privacy of information, subsequent modification of data entered, ease of recognition of user interface components, cancellation or undo actions, and adaptation to user needs. On the other hand, in the navigation feature, the following features are evaluated within the questionnaire: internal search availability, home page with main options, location of primary navigation menus in the left panel, and significant links.

4.2. Description of the Usability Assessment of the System by Experts

To evaluate and improve the interaction of the user interface with the system, an evaluation by experts in user-centered interactive systems from the University of Veracruz were carried out. Three expert evaluators participated in this assessment, who selected the inspection method to evaluate the applications under each user profile by the cognitive walkthrough method and a checklist for heuristic usability review based on the SIRIUS questionnaire.

4.2.1. Cognitive Walkthrough Method

The cognitive walkthrough consists of completing the tasks that can be done within the system in order to identify design errors or elements that can be improved based on the ease of learning by exploration. The process to carry out this evaluation was as follows:
  • Description of system services to expert evaluators.
  • List the tasks to be developed and create a list of actions for each task necessary to be completed by the evaluators.
  • When performing each action, the evaluator examines the system by answering four questions:
    • Will the user try and get the correct result?
    • Will the user notice that the correct action is available to him/her?
    • Does the user associate the correct action with the result he/she intends to achieve?
    • If the correct action is executed, does the user observe that there is progress towards the objective he/she intends to achieve?
  • The evaluator writes the answers for each action, discussing the results between them.
  • A document is written with the answers and comments on the system.
  • Through this method, errors or failures are detected and corrected within the system, specifically in performing tasks in each of the services for the three types of users.

4.2.2. Heuristic Usability Review Based on SIRIUS

In this type of heuristic evaluation, the evaluators proposed using the SIRIUS Checklist (User-Oriented Web Usability Evaluation System based on the determination of critical tasks) proposed by Olga Carreras Montoto [15], because it is a system Web usability evaluation that brings together a series of characteristics that differentiates it from other proposals such as the following:
  • It can be applied to any website.
  • It generates a percentage value of the level of usability of the evaluated site, therefore a quantitative data.
  • It facilitates the detection of elements with a low degree of usability on the site, setting priorities.
  • The evaluation classifies the websites according to their functionality.
  • It provides a metric that allows measuring the degree of usability achieved in percentage.

4.3. Preliminary Usability Assessment Results

This section first presents the results obtained for each instrument applied in the preliminary usability assessment of the system based on a field study. Afterward, the results obtained in the preliminary usability assessment of the system by experts in the area of user-centered interactive systems are presented.

4.3.1. Results of the Preliminary Usability Assessment of the System Based on a Field Study

Results of instrument 1.
This instrument was applied to 2 nutritionists, 4 physicians, and 7 patients. The results were obtained by applying the following equations defined in the ISO/IEC 25,022 standard [16]. System effectiveness per user:
xi = A/B
where, xi is the effectiveness value of each user, A is the number of tasks completed, and B is the number of tasks attempted. The expression xi ≈ 1 means that the user was able to reach the goals by completing all system tasks. To obtain the average effectiveness percentage (effectivenessavg), the effectiveness values of each user were added and divided by the total number of users:
effectivenessavg = (Σ xi/N) 100
On the other hand, the system efficiency per user is calculated as follows:
xi = Σ xj/N
where xi is the average time of each user, xj is the time to perform a task, and N means the total number of tasks. While xi is closer to the planned time, it indicates that the user was able to reach the goals by completing all the tasks of the system in a satisfactory time. Then, the average time of tasks was calculated by:
B = Σ xi/N
where B is the average time of tasks, and N the total number of users.
Finally, to obtain the average efficiency percentage, the following formula was applied:
efficiencyavg = (A/B) 100
where A means the estimated time of tasks and B the average time of tasks.
The results obtained from the Instrument 1 show the percentage of effectiveness and efficiency of the system concerning whether users can complete the tasks of the system and the spent time (see Table 4).
The results indicate that those physician users were able to complete the tasks of the system, reaching the desired goals with an average effectiveness of 95.8%. On the other hand, the efficiency of medical users in completing the system tasks obtained a result of 90.1%. Concerning nutritionist users, the results indicate that they were able to complete the tasks of the system, reaching the desired goals with an effectiveness of 94.1%. On the other hand, the efficiency of the nutritionist users in completing the system tasks obtained a result of 83%. Finally, the results indicate that patient users were able to complete the tasks of the system, reaching the desired goals with an effectiveness of 92.9%, and the efficiency of patient users in completing the tasks of the system obtained a result of 63.4%. According to the measurement scale proposed previously [19]:
0 ≤ % effectiveness/efficiency ≤ 45: Not satisfactory
46 ≤ %effectiveness/efficiency ≤ 80: Acceptable
81 ≤ %effectiveness/efficiency ≤ 100: Satisfactory
The web application aimed at the health personnel, in general, has a satisfactory level of effectiveness and efficiency from the point of view of physician and nutritionist users. On the other hand, the web application focused on the patient has a satisfactory level of efficacy and an acceptable level of efficiency.
Results of Instrument 2.
The results of Instrument 2 show the level of satisfaction of the system users. In this study, the user interface satisfaction questionnaire [17] was applied from the perspective of the three user profiles that used the applications that make up the system. This instrument was applied to 4 physicians, 2 nutritionists, and 7 patients. The measurement scale of the questionnaire was defined as follows [17]:
0123456789
Not satisfactory Acceptable Satisfactory
The results of each user profile are described below. Table 5 presents the average result obtained for each category of the QUIS 7.0 satisfaction questionnaire [17] assessed by physician users. The results are ordered from the highest grade to the lowest grade.
All categories of the questionnaire obtained an average score of 8.28. According to the measurement scale of the questionnaire, the application for physician users is considered within a satisfactory level.
On the other hand, the results obtained from the questionnaire based on the responses of the nutritionists show an average score of 7.56 (see Table 6). According to the measurement scale of the questionnaire, the web application regarding nutritionist users is considered within a satisfactory level.
Finally, Table 7 shows the average result obtained for each category of the questionnaire based on the responses of the patient users. In this case, the questionnaire categories obtained an average grade of 7.33. Therefore, from the perspective of patient users, the web application of our system is considered at a satisfactory level.
Concerning the presented results, it is observed that physician users provided a satisfactory rating of 8.28 and nutritionist users and patients also provided a satisfactory rating of 7.56 and 7.33, respectively, to the system. Among the characteristics with satisfactory qualification where all types of users coincide are terminology and information and the screen section. On the other hand, the characteristics rated acceptable to satisfactory where all users coincide are usability and user interface and learning capacity.
Results of Instrument 3.
The results of Instrument 3 show the quality of the system based on the questionnaire introduced previously [18], which evaluates three quality attributes: content, navigation, and presentation. The measurement scale used in this questionnaire is 1 to 5 on the Likert scale:
Strongly DisagreeDisagreeNeutralAgreeStrongly Agree
12345
The results of each user profile are described below. Table 8 presents the results obtained from the responses of physician users, registering an average rating of 4.74. Based on the measurement scale, physician users generally agree on all three attributes.
On the other hand, Table 9 shows the results obtained for each attribute of the questionnaire regarding nutritionist users. The nutritionists assigned an average rating of 4.37. In all three attributes, nutritionists agree.
Concerning patient users, the results obtained show an average rating of 4.0, according to the measurement scale (see Table 10). The attributes that obtained a rating on which users match are presentation and content. However, the navigation attribute was the lowest rating with a score that is aligned to neutral opinion.
The characteristics best evaluated by users are the features in system content, with an average rating of 4.47, i.e., they consider that the system has consistency and adapts to the user needs. Then, with an average rating of 4.39, there are presentation features such as color uniformity, browser compatibility, and link consistency. Finally, with an average rating of 4.25, there are navigation features such as the location of primary menus and search availability.

4.3.2. Results of the Usability Assessment of the System by Experts

In this evaluation, results were obtained based on the SIRIUS questionnaire that shows a percentage of usability to the system in the following attributes: general aspects, identity and information, structure and navigation, page layout, understandable and ease, control and feedback, and elements multimedia. Three expert evaluators participated in this evaluation, and forty-seven criteria were considered to assess the services of the physician and nutritionist users and forty-nine criteria to evaluate the services of the patient-user. Table 11 shows the percentages of usability obtained.
The evaluators assigned an average evaluation percentage of 82.51% for the application of physician and nutritionist users, and 83.48% for patient users, with the following criteria in usability being the following: page layout as a clear interface, there is no overload of information, the text of the page is easy to read, it complies with general aspects such as maintaining a recognizable and coherent design, the services are complete and easy to use, it maintains a consistent order in the menu. However, control and feedback were the lowest features in usability percentage because, in some services, the system does not inform the user about what is happening (e.g., processing information), and some data validations were detected in text or numerical fields. Based on the errors and possible improvements identified in both types of evaluations, a series of requirements were obtained for each user profile that allowed different modifications on the system in order to improve its usability.

5. Discussion

Some works [5,6,7,8,9,10,11,12,13] have proposed systems aimed at monitoring and treatment of people with type 2 diabetes mellitus (T2DM). These systems provide different services focused on the telemonitoring of patients with T2DM. Therefore, this section presents a qualitative comparison of our system with other proposed systems based on the desirable services that a telemonitoring system for patients with T2DM should consider for achieving adequate remote monitoring and control (see Table 12). These comparison services were determined based on the analysis of the Official Mexican Standard NOM-015-SSA2-2018 focused on the prevention, detection, diagnosis, treatment, and control of diabetes mellitus, giving priority to the processes and/or information that contributed to reduce the incidence of the disease, to avoid or delay its complications, and reduce the mortality associated with this disease. These services are specified below:
  • Registration of biomedical data by the patient (PR): Consultation and registration of different biomedical data relevant for monitoring and control of treatment
  • Consultation of information by the physician (CD): Access to relevant patient information in real-time for the monitoring and control of patients with T2DM.
  • Clinical history (CH): Record the patient’s medical history, which should include personal data of the patient and medical history.
  • Alert generation (AG): Generation of alerts indicating that the patient is at some risk based on the biomedical parameters recorded.
  • Laboratory analysis record (LR): The record of the results of the laboratory tests requested of the patient, such as blood chemistry test, complete blood count, general urine test, liver function test, and thyroid profile test.
  • Nutrition (N): Have personalized nutritional menus and options for equivalent foods. This service brings the patient the benefit of knowing what foods and in what quantity they can substitute, in case of not having those established in the menu.
  • Health education (HE): Help material is provided with topics related to diabetes, and the care that patients should have. In order to achieve the adoption of habits that help avoid health complications.
  • Recommendations (R): The medical specialist and nutritionist can make suggestions to the patient for their health care.
Based on the analysis shown in Table 12, the proposed systems lack three main elements to carry out adequate monitoring and remote treatment of people with T2DM. First, the systems lack a recommendation service for physicians and nutritionists, which is essential to make timely adjustments to treatment and avoid possible risk situations. Second, in the proposed systems that consider a nutrition service, there is a lack of menus and eating patterns prepared by specialists and assigned according to the calories regarding the patient progress. Finally, they do not provide educational material with issues related to awareness and prevention of possible health complications. In this qualitative comparison, it is noted that the work proposed in VITADAT Diabetes meets various desirable criteria of a telemonitoring system for patients with T2DM. However, this system lacks two important services: laboratory analysis and health education records. Therefore, our work is characterized by providing all desirable services that a telemonitoring system of patients with T2DM should consider for achieving adequate monitoring and continuous control of nutritional therapy based on the Mexican Official Standard NOM-015-SSA2-2018.
On the other hand, a limited number of related works [20,21,22] have carried out usability assessments (see Table 13). These works evaluated their systems mostly based on empirical methods and inquiry methods such as interviews or questionnaires applied to a group of users, to measure the attributes of effectiveness, efficiency, and satisfaction based on Nielsen’s heuristics, resulting in a percentage of usability and know if users recommend using the application. Among these related works, the one proposed in a study [22] stands out. However, this work did not use usability standards that allowed measuring the quality in use of the system that they propose.
Finally, and according to the analysis carried out in a previous study [23], the number of users who participated in our study allowed us to identify probably around 85% of the usability problems in both applications of our system. Some usability problems that were identified by users are the following:
  • The system must show clear messages to users when an error occurs.
  • Lack of contextual help to the user in some services of medical staff and patients.
  • The system must show help messages to the user for entering some data.
All the usability problems identified in our study were corrected.

6. Conclusions and Future Work

In this work, a telemonitoring system focused on the monitoring, control, and remote nutritional therapy of people with T2DM was presented. The system consists of two mobile web applications; one oriented to the medical staff and another to the patient. Our system is characterized by other proposals for offering medical staff and patients services such as record glucose data, generation of risk alerts (abnormal ranges), choose several food menu options provided by the nutritionist, consult food equivalent to those suggested, receive and/or consult recommendations made by the nutritionist, review results of laboratory studies; consult health education material, answer the food intake frequency questionnaire, and interaction between patient and nutritionist in real-time. Through these services, our system helps to achieve continuous monitoring and control, education, and empowerment of the patient regarding their condition, simplification of medical records, and facilitate decision-making for the improvement of the treatment based on the features of each patient. The offered services in both applications were developed based on the Mexican health standard guidelines focused on the prevention, detection, diagnosis, treatment, and control of diabetes mellitus. These services were reviewed and validated by the Mexican Social Security Institute (IMSS) medical personnel, who also contributed to the analysis and definition of requirements. In this work, our system’s preliminary usability assessment was carried out based on a field study with four specialist physicians, two nutritionists, and seven patients with T2DM. Based on the results obtained regarding efficacy, efficiency, satisfaction, content, navigation, and presentation, our telemonitoring system shows a satisfactory/favorable opinion in terms of usability from the users′ perspective. On the other hand, we consider that the main limitations of our system are: a) Users require an internet connection to use the services provided by the system, and b) the system does not allow the general physician to perform interventions on the pharmacological treatment of the patients in real-time. Therefore, our system lacks services that help the physician personalize the patient’s pharmacological therapy in real-time. As future work, the following extensions to the system are proposed:
  • To implement our system in a public or private health institution, we consider performing usability tests with patients and physicians during a year.
  • Automatic calculation of proteins, carbohydrates, and fats that the patient consumes. This for the nutrition module as a complement to the intake frequency answer.
  • A specialized module for physical activity orientation that allows the patient to perform some exercises in support of the treatment.
  • Develop a system version integrated with native applications for Android and iOS mobile devices.
  • Implement a sensor network to obtain medical data of the patients.

Author Contributions

Conceptualization, A.A.J., E.L.D., and Y.H.V.; methodology, A.A.J. and Y.H.V.; software, A.A.J. and M.A.H.V.; validation, M.A.H.V., M.A.M.N., J.D.L.C., and E.L.D.; formal analysis, Y.H.V., M.A.M.N., and J.D.L.C.; investigation, M.A.H.V., Y.H.V., and E.L.D.; resources, L.O.D. and O.H.S.; data curation, S.D.I., J.D.L.C., and M.A.M.N.; writing—original draft preparation, A.A.J. and M.A.H.V.; writing—review and editing, E.L.D., M.A.M.N., and S.D.I.; visualization, S.D.I., L.O.D., S.E.P.H., and O.H.S.; supervision, E.L.D.; project administration, S.E.P.H. and E.L.D.; funding acquisition, A.A.J., M.A.H.V., Y.H.V., S.D.I., J.D.L.C., S.E.P.H., M.A.M.N., and E.L.D. All authors have read and agreed to the published version of the manuscript.

Funding

This research received no external funding.

Conflicts of Interest

The authors declare no conflict of interest.

References

  1. Saeedi, P.; Petersohn, I.; Salpea, P.; Malanda, B.; Karuranga, S.; Unwin, N.; Colagiuri, S.; Guariguata, L.; Motala, A.A.; Ogurtsova, K.; et al. Global and Regional Diabetes Prevalence Estimates for 2019 and Projections for 2030 and 2045: Results from the International Diabetes Federation Diabetes Atlas, 9th ed.; Diabetes Research and Clinical Practice: Amsterdam, The Netherlands, 2019; Volume 157, p. 107843. Available online: https://www.sciencedirect.com/science/article/pii/S0168822719312306 (accessed on 17 September 2020).
  2. Shamah-Levy, T.; Cuevas-Nasu, L.; Rivera-Dommarco, J.; Hernández-Ávila, M. Encuesta Nacional de Salud y Nutrición de Medio Camino. 2016. Available online: http://transparencia.insp.mx/2017/auditorias-insp/12701_Resultados_Encuesta_ENSANUT_MC2016.pdf (accessed on 17 September 2020).
  3. Oviedo Mota, M.A.; Espinosa Larrañaga, F.; Reyes Morales, H.; Trejo y Pérez, J.A.; Gil Velázquez, E. Guía clínica para el diagnóstico y tratamiento de la diabetes mellitus tipo 2. Rev. Med. IMSS 2003, 41, 27–46. Available online: https://www.medigraphic.com/pdfs/imss/im-2003/ims031d.pdf (accessed on 17 September 2020).
  4. DOF. NORMA Oficial Mexicana NOM-015-SSA2-2018, Para la Prevención, Detección, Diagnóstico, Tratamiento y Control de la Diabetes Mellitus. Obtained from Diario Oficial de la Federación. April 2018. Available online: https://www.dof.gob.mx/nota_detalle.php?codigo=5521405&fecha=03/05/2018 (accessed on 17 September 2020).
  5. Morales-Rocha, V.; Fernández-Martínez, L.; Rodas OSillo, J.; Olmos Sánchez, K. Monitoreo Remoto de Pacientes con Diabetes Utilizando Tecnologías Móviles Inalámbricas. RevistaeSalud.com 2012, 8, 2–7. Available online: https://www.academia.edu/20556350/Monitoreo_Remoto_de_Pacientes_con_Diabetes_Utilizando_Tecnolog%C3%ADas_M%C3%B3viles_Inal%C3%A1mbricas (accessed on 17 September 2020).
  6. Coll-Clavero, J.I.; Angles-Barbastro, R.A.; Sierra-Callau, M.; Clemente, E.T.; Leris Oliva, J.M.; Romero Marco, D.; Ibáñez Castellar, L.; Castillón Loscertales, A. PITES: Telemedicine and e-Health Innovation Platform; Instituto de Salud Carlos III—Ministerio de economía y competitividad: Madrid, Spain, 2014; Chapter 1; pp. 9–38. [Google Scholar]
  7. PALANTE, un Proyecto Europeo—Servicio Andaluz de Salud. Juntadeandalucia.es. 2017. Available online: http://www.juntadeandalucia.es/servicioandaluzdesalud/principal/documentosacc.asp?pagina=pr_palante_1 (accessed on 22 November 2017).
  8. Cytron Medical. VITADAT®. (Version 2.0.1) [Mobile application]. Available online: https://play.google.com/store/apps/details?id=com.cytronmedical.vitadatdietas&hl=es_MX (accessed on 20 September 2020).
  9. SquareMed Software GmbH. Diabetes Connect. (Version 2.4.1) [Mobile application]. Available online: https://play.google.com/store/apps/details?id=com.squaremed.diabetesconnect.android&hl=es_MX (accessed on 20 September 2020).
  10. Klimaszewski Szymon. Diabetes—Diario. (Version 4.1.5) [Mobile application]. Available online: https://play.google.com/store/apps/details?id=com.szyk.diabetes&hl=es (accessed on 20 September 2020).
  11. Sirma Medical Systems. Diabetes:M. (Version 7.3.0) [Mobile application]. Available online: https://play.google.com/store/apps/details?id=com.mydiabetes&hl=es (accessed on 20 September 2020).
  12. mHealthAlert. myDiabeticAlert. (Version 4.12.0) [Mobile application]. Available online: https://play.google.com/store/apps/details?id=com.cystelcom.attcr.mydiabeticalert&hl=es (accessed on 20 September 2020).
  13. ySugr GmbH. mySugr. (Version 3.62.3) [Mobile application]. Available online: https://play.google.com/store/apps/details?id=com.mysugr.android.companion&hl=es (accessed on 21 September 2020).
  14. Patrón Modelo Vista Controlador| Marco de Desarrollo de la Junta Andalucía. Available online: http://www.juntadeandalucia.es/servicios/madeja/contenido/recurso/122 (accessed on 15 October 2018).
  15. Torrente Suárez, M.C. SIRIUS: Sistema de Evaluación de la Usabilidad Web Orientado al Usuario y Basado en la Determinación de Tareas Críticas. 2011. Available online: http://di002.edv.uniovi.es/~cueva/investigacion/tesis/Sirius.pdf (accessed on 5 September 2020).
  16. ISO-International Organization for Standardization ISO 25000. 2014. Available online: https://iso25000.com/index.php/en/iso-25000-standards/iso-25010 (accessed on 17 September 2020).
  17. Chin, P.J.; Diel, V.A.; Norman, L.K. Questionnaire for User Interface Satisfaction (QUIS) version 7, Hp Repository. 2012. Available online: http://webprisme.cfmu.eurocontrol.int/ehp (accessed on 15 January 2019).
  18. Sierra, G.J.C. Metodología de Evaluación de Usabilidad para Sistemas de Información basados en Web. 2016. Available online: https://repositorio.unal.edu.co/bitstream/handle/unal/57766/juliocesarsierragonzalez.2016.pdf?sequence=1&isAllowed=y (accessed on 20 September 2020).
  19. Domínguez Zárate, R.F. Aplicación de Métricas de Calidad en uso Utilizando la ISO 9126 Para Determinar el Grado de Satisfacción del Sistema Único de Matrícula, Chapter 4. 2016. Available online: https://cybertesis.unmsm.edu.pe/handle/20.500.12672/6704 (accessed on 20 September 2020).
  20. Mañas, B.C. Comunicación en Salud: Efectividad de las Aplicaciones Móviles de Salud en la Diabetes; Facultad de Ciencias de la Comunicación, Universidad Autónoma de Barcelona: Barcelona, Spain, 2016. [Google Scholar]
  21. Muñoz, G.O. USKAYSMS: Desarrollo y Evaluación de la Usabilidad de una Aplicación Informática de Envío y Recepción de Mensajes de Texto Para la Comunicación Entre Profesionales de Salud del Primer Nivel y Pacientes. Master’s Thesis, Universidad Peruana Cayetano Heredia, Lima, Perú, 2018. [Google Scholar]
  22. Aguirre, R.B. Evaluación de sistema de monitoreo remoto de pacientes con diabetes utilizando una guía de usabilidad. Revista Culcyt Tecnología 2013, 51, 105–113. [Google Scholar]
  23. Nielsen, J. Why You Only Need to Test with 5 Users, NN/g Nielsen Norman Group. 2000. Available online: https://www.nngroup.com/articles/why-you-only-need-to-test-with-5-users/ (accessed on 14 October 2020).
Figure 1. Patient care procedure.
Applsci 10 08036 g001
Figure 2. Telemonitoring system actors.
Applsci 10 08036 g002
Figure 3. Security use case (UC) diagram.
Applsci 10 08036 g003
Figure 4. General physician follow-up UC diagram.
Applsci 10 08036 g004
Figure 5. Nutrition UC diagram.
Applsci 10 08036 g005
Figure 6. Patient application UC diagram.
Applsci 10 08036 g006
Figure 7. Data model of the proposed system.
Applsci 10 08036 g007
Figure 8. Diagram of system components.
Applsci 10 08036 g008
Figure 9. Administrator user main interface: User administration module with options to add and update users.
Applsci 10 08036 g009
Figure 10. Administrator user interface: Service to add a user with a medical or nutritionist role.
Applsci 10 08036 g010
Figure 11. Administrator user interface: Service to add a user with the patient role.
Applsci 10 08036 g011
Figure 12. Administrator user interface: Service to add details and video links.
Applsci 10 08036 g012
Figure 13. Administrator user interface: Check videos integrated into the system.
Applsci 10 08036 g013
Figure 14. Physician application interface: Physician’s main menu with the list of assigned patients.
Applsci 10 08036 g014
Figure 15. Physician application interface: Clinical history sub-modules, glucose results, patient treatment progress, video report, and report or alert history.
Applsci 10 08036 g015
Figure 16. Physician application interface: Entry or update of personal data.
Applsci 10 08036 g016
Figure 17. Physician application interface: The personal history section divided into harmful habits and pathological personal background.
Applsci 10 08036 g017
Figure 18. Physician application interface: Glucose results.
Applsci 10 08036 g018
Figure 19. Physician application interface: Graph of the progress of the patient’s glucose levels.
Applsci 10 08036 g019
Figure 20. Physician application interface: Video consultation report for education and awareness of the disease.
Applsci 10 08036 g020
Figure 21. Physician application interface: Report of alerts generated by the system.
Applsci 10 08036 g021
Figure 22. Physician application interface: Laboratory results module.
Applsci 10 08036 g022
Figure 23. Physician application interface: The history of laboratory results of blood chemistry tests.
Applsci 10 08036 g023
Figure 24. Physician application interface: Detail of the laboratory results of a blood chemistry test.
Applsci 10 08036 g024
Figure 25. Physician application interface: Eating pattern assigned to the patient.
Applsci 10 08036 g025
Figure 26. Physician application interface: Eating pattern assigned to the patient.
Applsci 10 08036 g026
Figure 27. Physician application interface: Main menu of the nutritionist user.
Applsci 10 08036 g027
Figure 28. Nutritionist application interface: Anthropometry record.
Applsci 10 08036 g028
Figure 29. Nutritionist application interface: Menus and eating patterns assigned to the patient.
Applsci 10 08036 g029
Figure 30. Nutritionist application interface: Recommendations in the food field.
Applsci 10 08036 g030
Figure 31. Nutritionist application interface: The history of intake frequency.
Applsci 10 08036 g031
Figure 32. Nutritionist application interface: Module loading patterns and menus.
Applsci 10 08036 g032
Figure 33. Nutritionist application interface: Loading of the food standard.
Applsci 10 08036 g033
Figure 34. Nutritionist application interface: loading of food menus.
Applsci 10 08036 g034
Figure 35. Nutritionist application interface: The history of food menus.
Applsci 10 08036 g035
Figure 36. Patient application interface: Glucose record.
Applsci 10 08036 g036
Figure 37. Patient application interface: History of glucose records.
Applsci 10 08036 g037
Figure 38. Patient application interface: Health education module.
Applsci 10 08036 g038
Figure 39. Patient application interface: Laboratory result module and blood chemistry test sub-module.
Applsci 10 08036 g039
Figure 40. Patient application interface: Consultation of the assigned eating pattern.
Applsci 10 08036 g040
Figure 41. Patient application interface: List of food groups and suitable rations that can be consumed.
Applsci 10 08036 g041
Figure 42. Patient application interface: food menus assigned by the 7.
Applsci 10 08036 g042
Figure 43. Patient application interface: Intake frequency questionnaire.
Applsci 10 08036 g043
Figure 44. Patient application interface: Recommendations made by the nutritionist.
Applsci 10 08036 g044
Table 1. Format of the unit and integration tests.
ModuleName of the Tested ModuleUserThe User RoleTestTest Identifier
SubmoduleName of the Tested Submodule/Service
PurposeDescription of the service goal.
RequirementsPrevious steps for the service action
EntryInformation occupied to perform the test.
ActionDescription of the service actionResult: Indicates if the service works correctly
Table 2. Summary test of the services of the web application for health personnel. (EF) errors found, (ES) errors solved, (PE) pending errors, and (I) iterations.
ModuleSub-Module/ServicesEFESPEI
Authentication 0003
Select patient 0003
Medical historyPersonal data0003
Personal history0003
Glucose results0003
Patient progress0003
Video report1103
Alert History0003
Laboratory resultsBlood chemistry test1103
Complete blood count1103
General urine test0003
Liver function test0003
Thyroid profile test1103
NutritionMenu and pattern0003
Anthropometry,0003
Record1103
Recommendations0003
Load patterns and menusHistory of intake frequency0003
Pattern1103
Table 3. Test of the services of the web application for patients. (EF) errors found, (ES) errors solved, (PE) pending errors, and (I) iterations.
ModuleSub-Module/ServicesEFESPEI
Authentication 0003
Health Education 0003
NutritionPatterns0003
Menus0003
Intake frequency questionnaire0003
Feedback 1103
Glucose recordRecord0003
History 1103
Laboratory resultsBlood chemistry test1103
Complete blood count0003
General urine test0003
Liver function test0003
Thyroid profile test1103
Table 4. Results of efficacy and efficiency based on the analysis of the Instrument 1.
Type of UserAverage Effectiveness PercentageAverage
Efficiency Percentage
Physicians95.8%90.1%
Nutritionist94.1%83.0%
Patients92.4%63.4%
Table 5. Results of Instrument 2, physician profile.
PositionSectionAverage ScoreTotal Average Score
1Screen8.758.28
2Terminology and Information8.54
3System capabilities8.25
4Learning capacity8.17
5Usability and user interface8.15
6General reactions7.83
Table 6. Results of Instrument 2, nutritionist profile.
PositionSectionAverage ScoreTotal Average Score
1Terminology and Information8.427.56
2Screen8.25
3System capabilities7.6
4General reactions7.58
5Usability and user interface6.8
6Learning capacity6.75
Table 7. Results of Instrument 2, patient profile.
PositionSectionAverage ScoreTotal Average Score
1General reactions7.647.33
2Screen7.61
3Terminology and Information7.5
4Usability and user interface7.27
5System capabilities7.2
6Learning capacity6.76
Table 8. Results of Instrument 3, physician profile.
PositionAttributeAverage ScoreTotal Score
1Presentation4.924.74
2Content4.67
3Navigation4.64
Table 9. Results of Instrument 3, nutritionist profile.
PositionAttributeAverage ScoreTotal Score
1Content4.754.37
2Navigation4.21
3Presentation4.17
Table 10. Results of Instrument 3, physician profile.
PositionAttributeAverage ScoreTotal Score
1Presentation4.14.0
2Content4.0
3Navigation3.9
Table 11. Results of the SIRIUS heuristic evaluation
EvaluatorPercentages of Each Evaluated Profile
PhysicianNutritionistPatient
Evaluator 182.61%82.61%81.16%
Evaluator 285.90%85.90%85.07%
Evaluator 379.03%79.03%84.20%
Mean82.51%82.51%83.48%
Table 12. Telemonitoring system comparisons.
Related WorksPRCDCHAGLRNRH
MRPDUTMI [5]
Proyecto PITES T-YUDA [6]
PALANTE [7]
VITADAT [8]
Diabetes conect [9]
Diabetes diario [10]
Diabetes M [11]
MyDiabeticAlert [12]
MySugr [13]
Social Diabetes [20]
USKAYSMS [21]
S.M.R.P.D. [22]
Our proposed
Table 13. Related works in terms of usability assessment.
Related WorksFSUSHMEMIMUEEEIAE
Social Diabetes [20]
USKAYSMS [21]
S.M.R.P.D. [22]
Where FS: Usability assessment based on field study, US: Use of the ISO/IEC 25,000 usability standard, HM: Heuristic methods, EM: Empirical methods, IM: Inquiry methods, UE: User evaluated, EE: Evaluated by experts, IAE: Improvements after evaluation.
Publisher’s Note: MDPI stays neutral with regard to jurisdictional claims in published maps and institutional affiliations.

