Article

Evaluation of the Cultivated Mushroom Pleurotus ostreatus Basidiocarps Using Vibration Spectroscopy and Chemometrics

1
Department of Carbohydrates and Cereals, Faculty of Food and Biochemical Technology, University of Chemistry and Technology in Prague, Technická 5, 6 Dejvice, 166 28 Prague, Czech Republic
2
Nicolet CZ s. r. o., Klapálkova 2242/9, 11 Chodov, 149 00 Prague, Czech Republic
3
Department of Horticulture, Faculty of Agrobiology, Food and Natural Resources, Czech University of Life Sciences Prague, Kamýcká 129, 6 Suchdol, 165 00 Prague, Czech Republic
4
Department of Food Science, Faculty of Agrobiology, Food and Natural Resources, Czech University of Life Sciences Prague, Kamýcká 129, 6 Suchdol, 165 00 Prague, Czech Republic
*
Author to whom correspondence should be addressed.
Both authors contributed equally to the preparation of this article.
Appl. Sci. 2020, 10(22), 8156; https://doi.org/10.3390/app10228156
Submission received: 29 October 2020 / Revised: 12 November 2020 / Accepted: 16 November 2020 / Published: 18 November 2020
(This article belongs to the Special Issue Application of Spectroscopy in Food Analysis: Volume II)

Abstract

:
Fruiting bodies (basidiocarps) of the cultivated mushroom Pleurotus ostreatus (16 strains) were characterized by vibration spectroscopy and chemometrics. According to organic elemental analysis and Megazyme assay, the basidiocarps contained ~6.2–17.5% protein and ~18.8–58.2% total glucans. The neutral sugar analysis confirmed that glucose predominated in all the samples (~71.3–94.4 mol%). Fourier-transformed (FT) mid- and near-infrared (FT MIR, FT NIR) and FT Raman spectra of the basidiocarps were recorded, and the characteristic bands of proteins, glucans and chitin were assigned. The samples were discriminated based on principal component analysis (PCA) of the spectroscopic data in terms of biopolymeric composition. The partial least squares regression (PLSR) models based on first derivatives of the vibration spectra were obtained for the prediction of the macromolecular components, and the regression coefficients R2 and root mean square errors (RMSE) were calculated for the calibration (cal) of proteins (R2cal 0.981–0.994, RMSEcal ~0.3–0.5) and total glucans (R2cal 0.908–0.996, RMSEcal ~0.6–3.0). According to cross-validation (CV) diagnosis, the protein models were more precise and accurate (R2cv 0.901–0.970, RMSEcv ~0.6–1.1) than the corresponding total glucan models (R2cv 0.370–0.804, RMSEcv ~4.7–8.5) because of the wide structural diversity of these polysaccharides. Otherwise, the Raman band of phenylalanine ring breathing vibration at 1004 cm−1 was used for direct quantification of proteins in P. ostreatus basidiocarps (R ~0.953). This study showed that the combination of vibration spectroscopy with chemometrics is a powerful tool for the evaluation of culinary and medicinal mushrooms, and this approach can be proposed as an alternative to common analytical methods.

1. Introduction

Oyster mushrooms (genus Pleurotus) are among the most cultivated and consumed mushrooms in the world [1,2]. Their fruiting bodies (basidiocarps) are low in calories, fats and essential fatty acids, but contain large amounts of proteins with almost all of the essential amino acids, polysaccharides including soluble and insoluble glucans, dietary fibers, vitamins and minerals [3,4,5]. Basidiocarps and compounds derived from them have demonstrated evident medicinal impacts [6]. Polysaccharides, especially β-d-glucans, have positive effects on human health [7,8]. Various polysaccharides, mainly mannogalactans and glucans, have been isolated from Pleurotus mushrooms and characterized as biologically active compounds [9,10,11,12,13,14].
The specie Pleurotus ostreatus is the most common among all oyster mushrooms [15]. Basidiocarps of this mushroom had hypocholesterolemic effects in animal models and patients [16,17] as well as potent antinociceptive effect in rats fed with it [18]. Antioxidant and anti-inflammatory activities of these basidiocarps were also reported [19,20]. A water-insoluble (1–3)-β-d-glucan, named “pleuran”, obtained from P. ostreatus was the most studied polysaccharide of oyster mushrooms [21]. This glucan, as well as other polysaccharides isolated from this source, demonstrated many medicinal activities including immunomodulating [13,22], antitumor [23], antioxidant [10] and prebiotic [14] effects. Various strains of P. ostreatus with specific biopolymer compositions have been obtained for cultivation on various substrates [24].
Screening of crude basidiocarps originating from different strains of P. ostreatus is essential to evaluate the nutritional quality and prospects of these mushrooms for culinary use or as the source for preparation of food supplements. Methods of vibration spectroscopy have proved to be very useful in this respect [25]. These methods themselves and together with multivariate analyses have been applied to detect proteins, polysaccharides, proteins, sterols and aromatic compounds in fractions derived from basidiocarps of oyster mushrooms [14,26,27,28,29]. In addition, the combination of FTIR spectroscopy and multivariate analysis has been used for the discrimination of fungal samples of various origin, location and treatment [29,30,31].
The main purpose of this work was to evaluate the methods of vibration spectroscopy in the screening analysis of edible and medicinal mushrooms, primarily to characterize the biopolymer composition of fruiting bodies. The subject of the study was 16 samples of basidiocarp of various P. ostreatus strains promising for cultivation and gastronomic use. Sample discrimination was performed using principal component analysis (PCA) of spectroscopic data obtained by Fourier-transformed mid- and near-infrared (FT MIR, FT NIR) and FT Raman spectroscopic measurements. Partial least squares regression (PLSR) models were created to predict protein and total glucan contents based on the mentioned spectroscopic data.

2. Materials and Methods

2.1. Basidiocarps of Chosen Strains

Basidiocarps of the cultivated mushrooms P. ostreatus (16 strains) were obtained from mushroom grower in accordance with the Convention on Biological Diversity and the Convention on the Trade in Endangered Species of Wild Fauna and Flora that was confirmed by the Ethics Committee of the Czech University of Life Sciences Prague, the Czech Republic. All fungal material used in this study was cultivated based on the agreement by local grower within research project no. QK1910209 funded by the Ministry of Agriculture of the Czech Republic. The basidiocarp samples are specified in Table 1. Basidiocarps were mechanically cleaned, lyophilized and homogenized. To remove small molecules (mono- and oligosaccharides, lipids, phenolic compounds, etc.), the dry powdered samples were washed with 0.2 mol L−1 hydrochloric acid in 80% aq. ethanol, then neutralized by washing with 80% and 96% aq. ethanol and dried in air. The purified powdered samples of basidiocarps were used for analyses. All procedures performed within the framework of research projects no. QK1910209 and 21-SVV/2020 (Specific University Research, UCT Prague) and presented in this article followed the Code of Ethics of the University of Chemistry and Technology, Prague, as confirmed by Ethics Committee of this university.

2.2. Elemental Analysis And Determination of Proteins

Organic elemental analysis (C, H, N and S) was made on an Elementar vario EL III (Elementar, Germany). The accuracy of the method is determined for simultaneous analysis of 5 mg of 4-amino-benzene sulfonic acid in the CHNS module to <0.1% for each element. The results include all combustible sulfur, both organic and inorganic, as well as all combustible carbon, organically and inorganically bound. The hydrogen content is affected by the moisture of the sample. The amount of proteins (% w/w) in the basidiocarps was calculated from the elemental nitrogen by multiplying by the factor of 3.99. This factor was offered by Fujihara et al. [32] for protein determination in mushrooms to avoid overestimation caused by the presence of interfered non-protein compounds such as urea, nucleic acids, free amino acids and chitin [33].

2.3. Determination of Glucans

The analytical set “MUSHROOM and YEAST β-GLUCAN” K-YBGL 07/11 (Megazyme International, Ireland) was used for the determination of total, α- and β-glucans [5]. The assay is based on the difference between glucose contents after the total acidic hydrolysis of glucans and specific enzymatic hydrolysis of starch-like α-glucans. The polysaccharide fractions were solubilized in concentrated (37%; 10N) hydrochloric acid and then hydrolyzed by 1.3 mol L−1 hydrochloric acid at 100 °C for 2 h; total hydrolysis was completed by incubation with a mixture of exo-(1–3)-β-glucanase and β-glucosidase. The starch-like α-glucans were solubilized in 2 mol L−1 potassium hydroxide, and the mixture was neutralized with an excess of 1.2 mol L−1 sodium acetate buffer (pH 3.8); dissolved α-glucans were then hydrolyzed by amyloglucosidase. The content of β-glucans (or non-starch) glucans was calculated as the difference between glucose contents after total acidic hydrolysis of glucans and specific enzymatic hydrolysis of α-glucans. All these measurements were made in triplicate.

2.4. Analysis of Neutral Sugars Composition

Monosaccharide composition (neutral sugars) of the purified milled basidiocarps was determined by gas chromatography. The samples (1–2 mg) were hydrolyzed in 72% sulfuric acid and the released sugars were analyzed as alditol acetates by gas chromatography with flame-ionization detection (GC-FID) using a Shimadzu GC2010 (Shimadzu, Japan) equipped with a 30 m capillary column DB−225 with internal diameter of 0.25 mm and film thickness of 0.15 μm. The temperatures of injector and detector were, respectively, 220 °C and 230 °C. The oven temperature program was as follows: 200 °C for 1 min, then rose to 220 °C (40 °C min−1), held at 220 °C for 7 min, then rose to 230 °C (20 °C min−1), final temperature of 230 °C held for 1 min; total time 9 min. The hydrolysis of all samples was performed in duplicate.

2.5. Vibration Spectroscopy

Powdered basidiocarps were pressed into a pellet using hand press (Pike Technologies, Fitchburg, WI, USA). Attenuated total reflectance (ATR) FT MIR spectra (five spectra per sample, 4000–650 cm−1, 64 scans each, resolution 2 cm−1) of the pellets were recorded on a Nicolet 6700 FTIR spectrometer (Thermo Fisher Scientific, Waltham, MA, USA) with a KBr beam splitter and Smart MIRacle (single-reflection horizontal ATR) holder. The spectra were ATR-corrected prior to further processing. Diffuse reflectance FT NIR spectra (five spectra per sample, 10,000–4000 cm−1, 100 scans each, resolution 2 cm−1) of powdered dried basidiocarps were recorded on the same equipment using a CaF2 splitter and diffuse reflectance NIR smart holder. FT Raman spectra of the powder samples (three spectra per sample, 4000–150 cm−1, 500 scans each, resolution 4 cm−1) were recorded on a Nicolet iS50 FTIR spectrometer using a CaF2 splitter and FT Raman module (Thermo Fisher Scientific, Waltham, MA, USA). All the spectra were baseline-corrected, smoothed and normalized by scale using Omnic 8.0 software (Thermo Fisher Scientific, Waltham, MA, USA). The corrected spectra were exported in ASCII format to Origin 6.0 (OriginLab, Northampton, MA, USA) software for preparation of graphs.

2.6. Statistical Methods

Variance in analytical values obtained for the individual basidiocarp samples was evaluated by Tukey’s honestly significant difference (HSD) test using the STATISTICA 12.0 software (StatSoft Europe, Hamburg, Germany); p values of less than 0.05 were considered to indicate statistical significance. Multivariate statistical evaluation of the obtained spectroscopic data was made using TQ Analyst software (Thermo Fisher Scientific, Waltham, MA, USA) including PCA and PLSR models for two analytical values, i.e., protein and total glucan contents. The graphical outputs of both analyses included component score and calibration/cross-validation graphs. The PLSR models were created based on the first derivatives of the corrected FT MIR, FT NIR and FT Raman spectra and analytical values obtained by other analytical methods, i.e., organic elemental analysis for proteins and photometry for total glucans. The spectral regions used to calibrate a particular component were automatically selected using the TQ Analyst algorithm or were slightly modified to improve the models. Cross-validation (CV) and predicted residual error sum of squares (PRESS) diagnostics were used for evaluation of the calibration models. The former is one of the main indicators of the quality of a given model. CV diagnostics quantify each calibration standard as if it is a validation and calculate several parameters describing the calibration model. PRESS diagnostics show how the value of PRESS varies with the number of factors used to calibrate the components of the active model, so values given are thus an indicator of the calibration error of the PLSR models, and the optimal number of factors was chosen based on PRESS diagnostics.

3. Results and Discussion

3.1. Composition of Basidiocarps

The organic elemental composition of purified dried basidiocarps is summarized in Table 2. The carbon and hydrogen contents varied in the ranges of ~39.7–41.7% and ~6.7–6.8%, respectively. Nitrogen (~1.6–4.4%) as well as sulfur (~0.1–0.2%) found in basidiocarps originated mainly from proteins, and nitrogen, to a lesser extent, also from chitin. The chitin–β-d-glucan complex forms the fibrillar base of fungal cell walls, and in the case of P. ostreatus basidiocarps, chitin makes up about 11.5% of the alkali-insoluble part of cell walls [29]. The protein contents calculated from elemental nitrogen were in the range of ~6.2–17.5%. Among the samples of basidiocarps, there are two groups of low and high protein contents; i.e., samples hk35, kryos, p80, fotios and po5 were ~6.2–9.9% protein, and samples 3009, 3029, po4 and spoppo were ~14.8–17.5% protein; the rest could be assigned as medium protein content (~11.2–13.95%) samples.
The neutral sugars composition of and glucan contents in purified dried basidiocarps are represented in Table 3 and Table 4, respectively. Glucose predominated in all the samples and comprised ~71.3–94.4 mol% of all neutral sugars. It means that glucans of various structures should be the main polysaccharides of P. ostreatus basidiocarps. In samples 3009, 3253, p80 and spoppo, galactose, xylose, mannose and/or rhamnose were found in moderate quantities up to ~5.3–12.6 mol% that markedly decreased the contribution of glucose to 71.3–87.5 mol%. These sugars originate from glycoproteins, galactans, mannogalactans or other heteropolysaccharides. In all samples, arabinose and fucose were present in much lower or even trace amounts.
The contents of total glucans in the samples varied in the range of ~18.8–58.2%; the contents of α-glucans digestible by amylolytic enzymes was low (~2.5–16.7%) in comparison with the rest of the glucans (~15.9–51.5%), assigned as β-glucans. The estimation of β-glucans by this test is complicated by the presence of (1–3)-α-d-glucan in basidiocarps of P. ostreatus [14]. Enzymatic assay definitively gives the content of starch-like (1–4)(1–6)-α-d-glucans, but (1–3)-α-d-glucan, which makes up a significant part of the cell walls, is likely not cleaved by amylolytic enzymes and is therefore defined as part of the β-d-glucans. Two samples, namely kryos and po1, differed from the others in that they contained much lower total (18.8% and 30.4%, respectively) and β-glucans (15.9% and 27.2%, respectively). By contrast, samples po5, p80, po2 and 3009 contained maximal amounts of both total (~55.3–58.2%) and β-glucans (~46.7–55.4%). However, as mentioned above, only two of them, po2 and po5, contained relatively few other sugars besides glucose.

3.2. Vibration Spectroscopy
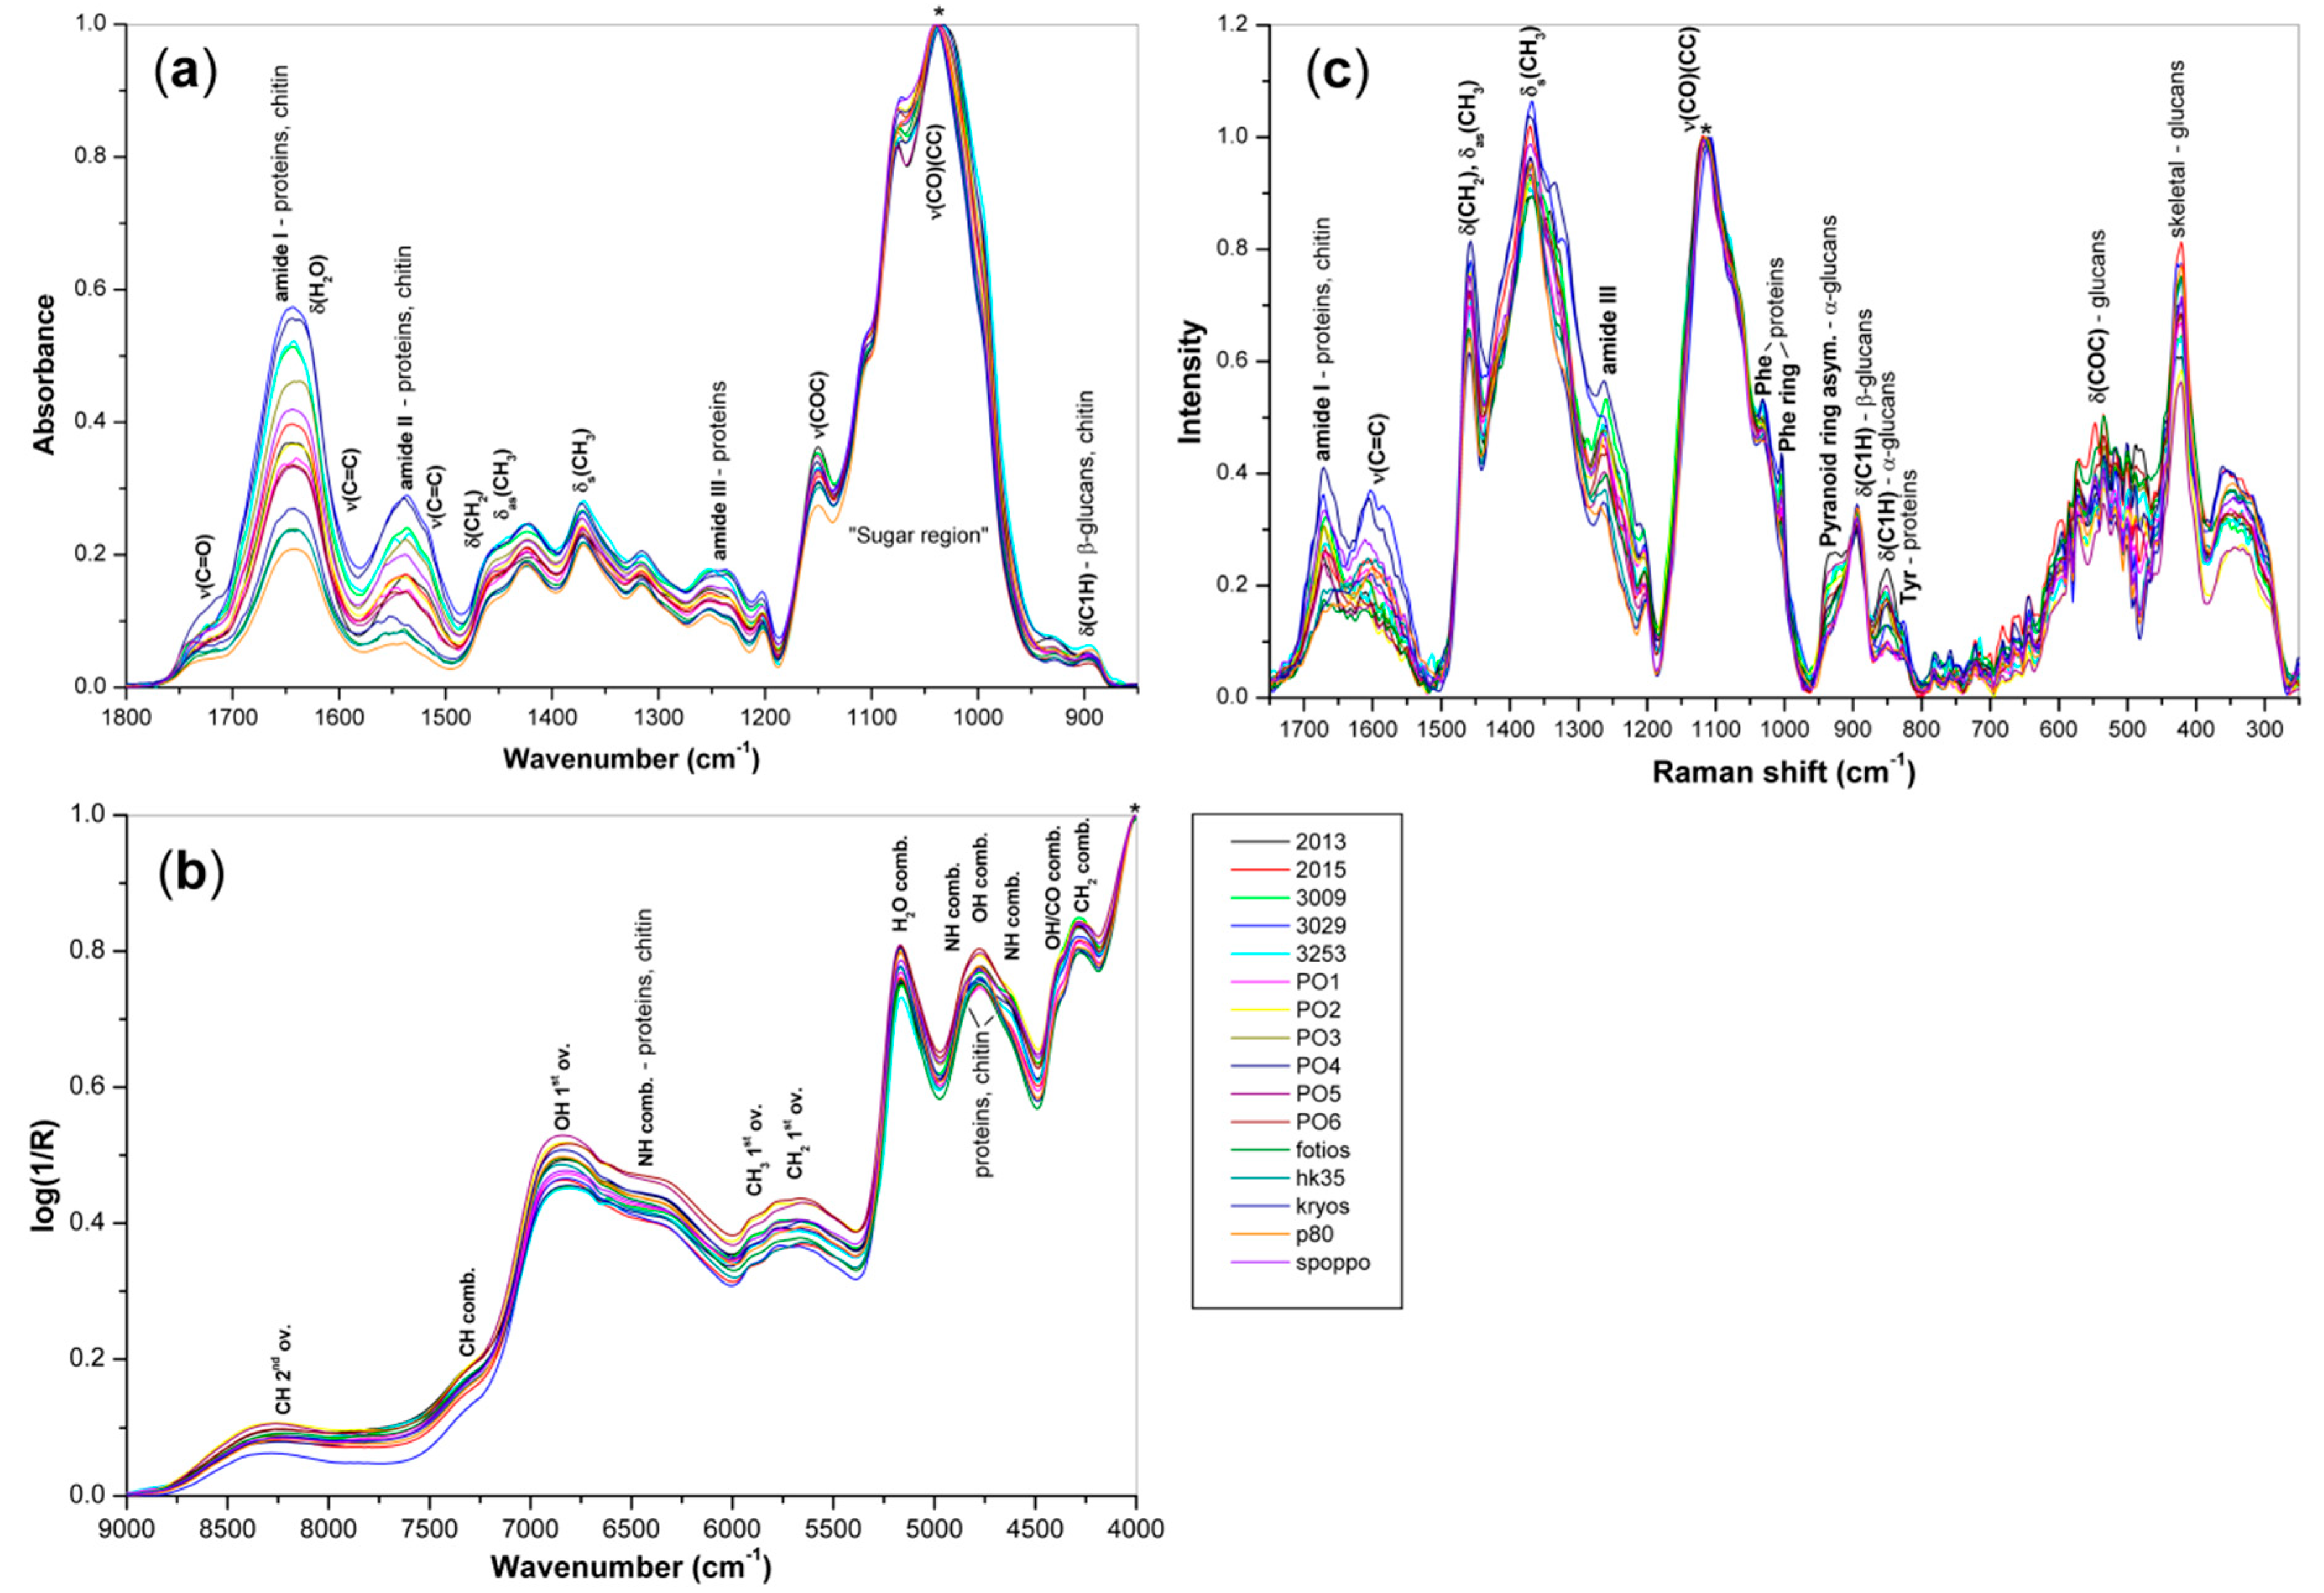
3.2.1. FT MIR

The average normalized FT MIR spectra of purified basidiocarps are represented in Figure 1a. The intense highly overlapped bands at 1200–950 cm−1, which were assigned mainly to C–C and C–O stretching vibrations in pyranoid rings, are characteristic for polysaccharides [34]. Among these bands, the band near 1150 cm−1 was found for all samples and assigned to the C–O–C stretching vibration of glycosidic bonds. The envelope shape of this region is characteristic for the mixture of fungal cell wall polysaccharides, mainly branched (1–3)(1–6)-β-d-glucan, linear (1–3)-α-d-glucan and chitin; the IR bands or shoulders near 1375, 1316, 1253, 1202, 1150, 1071–1076 and 1033–1040 cm−1 found for all samples are characteristic for fungal β-d-glucans [5,14,26]. In addition, the broad and weak IR band near 897 cm−1 arose from C1H bending in β-anomeric sugar units of chitin and β-d-glucan [14,35,36]. By contrast, the weak bands at 930 and 847–853 cm−1 indicated the presence of α-d-glucans [36,37,38]. Liu et al. [39] identified individual glucans in basidiocarps of Boletus mushrooms by characteristic IR bands at 1155, 1025, 930 and 850 cm−1 (α-glucans) and at 1160, 1078, 1041 and 890 cm−1 (β-glucans).
Two IR bands at 1632–1650 cm−1 (amide I) and 1554–1535 cm−1 (amide II) were assigned to amide vibrations of chitin and proteins [40,41]. The former band is overlapped by that of water in-plane deformation near 1640 cm−1. For high-protein samples (po4, 3029), the amide II band was found near 1535 cm−1, while in the case of some samples containing less protein (kryos, hk35 and p80), there was another band near 1550–1554 cm−1 attributed to α-chitin. Intensities of these amide bands highly varied for the samples and increased with the protein content. Similarly, the intensity of another band near 1236 cm−1 was more pronounced for samples rich in protein (po4, 3009 and 3029), but was only a shoulder of the band at 1253 cm−1 for the low-protein samples (kryos, hk35 and p80). Therefore, the band near 1236 cm−1 was assigned to the amide III vibration of proteins [41]. All the spectra also showed a shoulder at 1726 cm−1 assigned to the C=O stretching vibrations of carboxylic groups [42].

3.2.2. FT NIR

The average normalized FT NIR spectra of purified basidiocarps are represented in Figure 1b. The spectra of protein-rich samples demonstrated two shoulders at 4860 cm−1 (amide A/II) and 4610 cm−1 (amide B/II) assigned to the combinations of NH stretching and bending modes characteristic for proteins [43,44,45]. Other protein bands were found near 6600 cm−1 (amide A + 1st overtone of amide I), 6471 cm−1 (1st overtone of amide A) and 6330 cm−1 (amide A + 1st overtone of amide II). The bands of polysaccharide vibrations were found near 4300 cm−1 (CH2 stretch/bend combination), 4400 cm−1 (OH/CO stretch combination), 4770–4790 cm−1 (OH stretch/bend combination), 6310 cm−1 (CH stretch 1st overtone) and 6980 cm−1 (OH stretch 1st overtone) [46,47]. Polysaccharides and proteins contributed to the regions of 4400–5000 cm−1 (CH, OH and NH stretch/bend combinations) and 5400–6000 cm−1 (CH2 and CH3 stretch 1st overtones) in a different manner.

3.2.3. FT Raman

The average normalized FT Raman spectra of purified basidiocarps are represented in Figure 1c. Bands at 1455–1461 and 1367–1374 cm−1 were assigned to bending vibrations of CH2 and CH3 groups in proteins and polysaccharides [34,48]. Intense bands at 1106–1120 cm−1 arose mainly from the C–O and C–C stretching vibrations of polysaccharides. The sharp band at 894 cm−1 indicated the β-anomeric configuration of monosaccharide units in β-d-glucans and chitin, while bands near 930 and 850 cm−1 were characteristic for α-anomeric configuration in α-d-glucans [14,26]. However, the tyrosine doublet bands near 830 and 850 cm−1 overlapped the latter band of α-glucans [48,49]. The band at 420–428 cm−1 was assigned to skeletal vibrations of polysaccharides, so it could be used as non-specific marker of glucans [49]. The bands near 1670 cm−1 (amide I) and at 1260–1267 cm−1 (amide III) indicated the presence of proteins [48]. In addition, two bands near 1130 and 1004 cm−1 were assigned to vibrations of phenylalanine moieties; the latter band is often used as a reference for proteins. The broad band centered near 1604 cm−1 (C=C stretching) indicated unsaturated and aromatic compounds, which were still present in some samples.

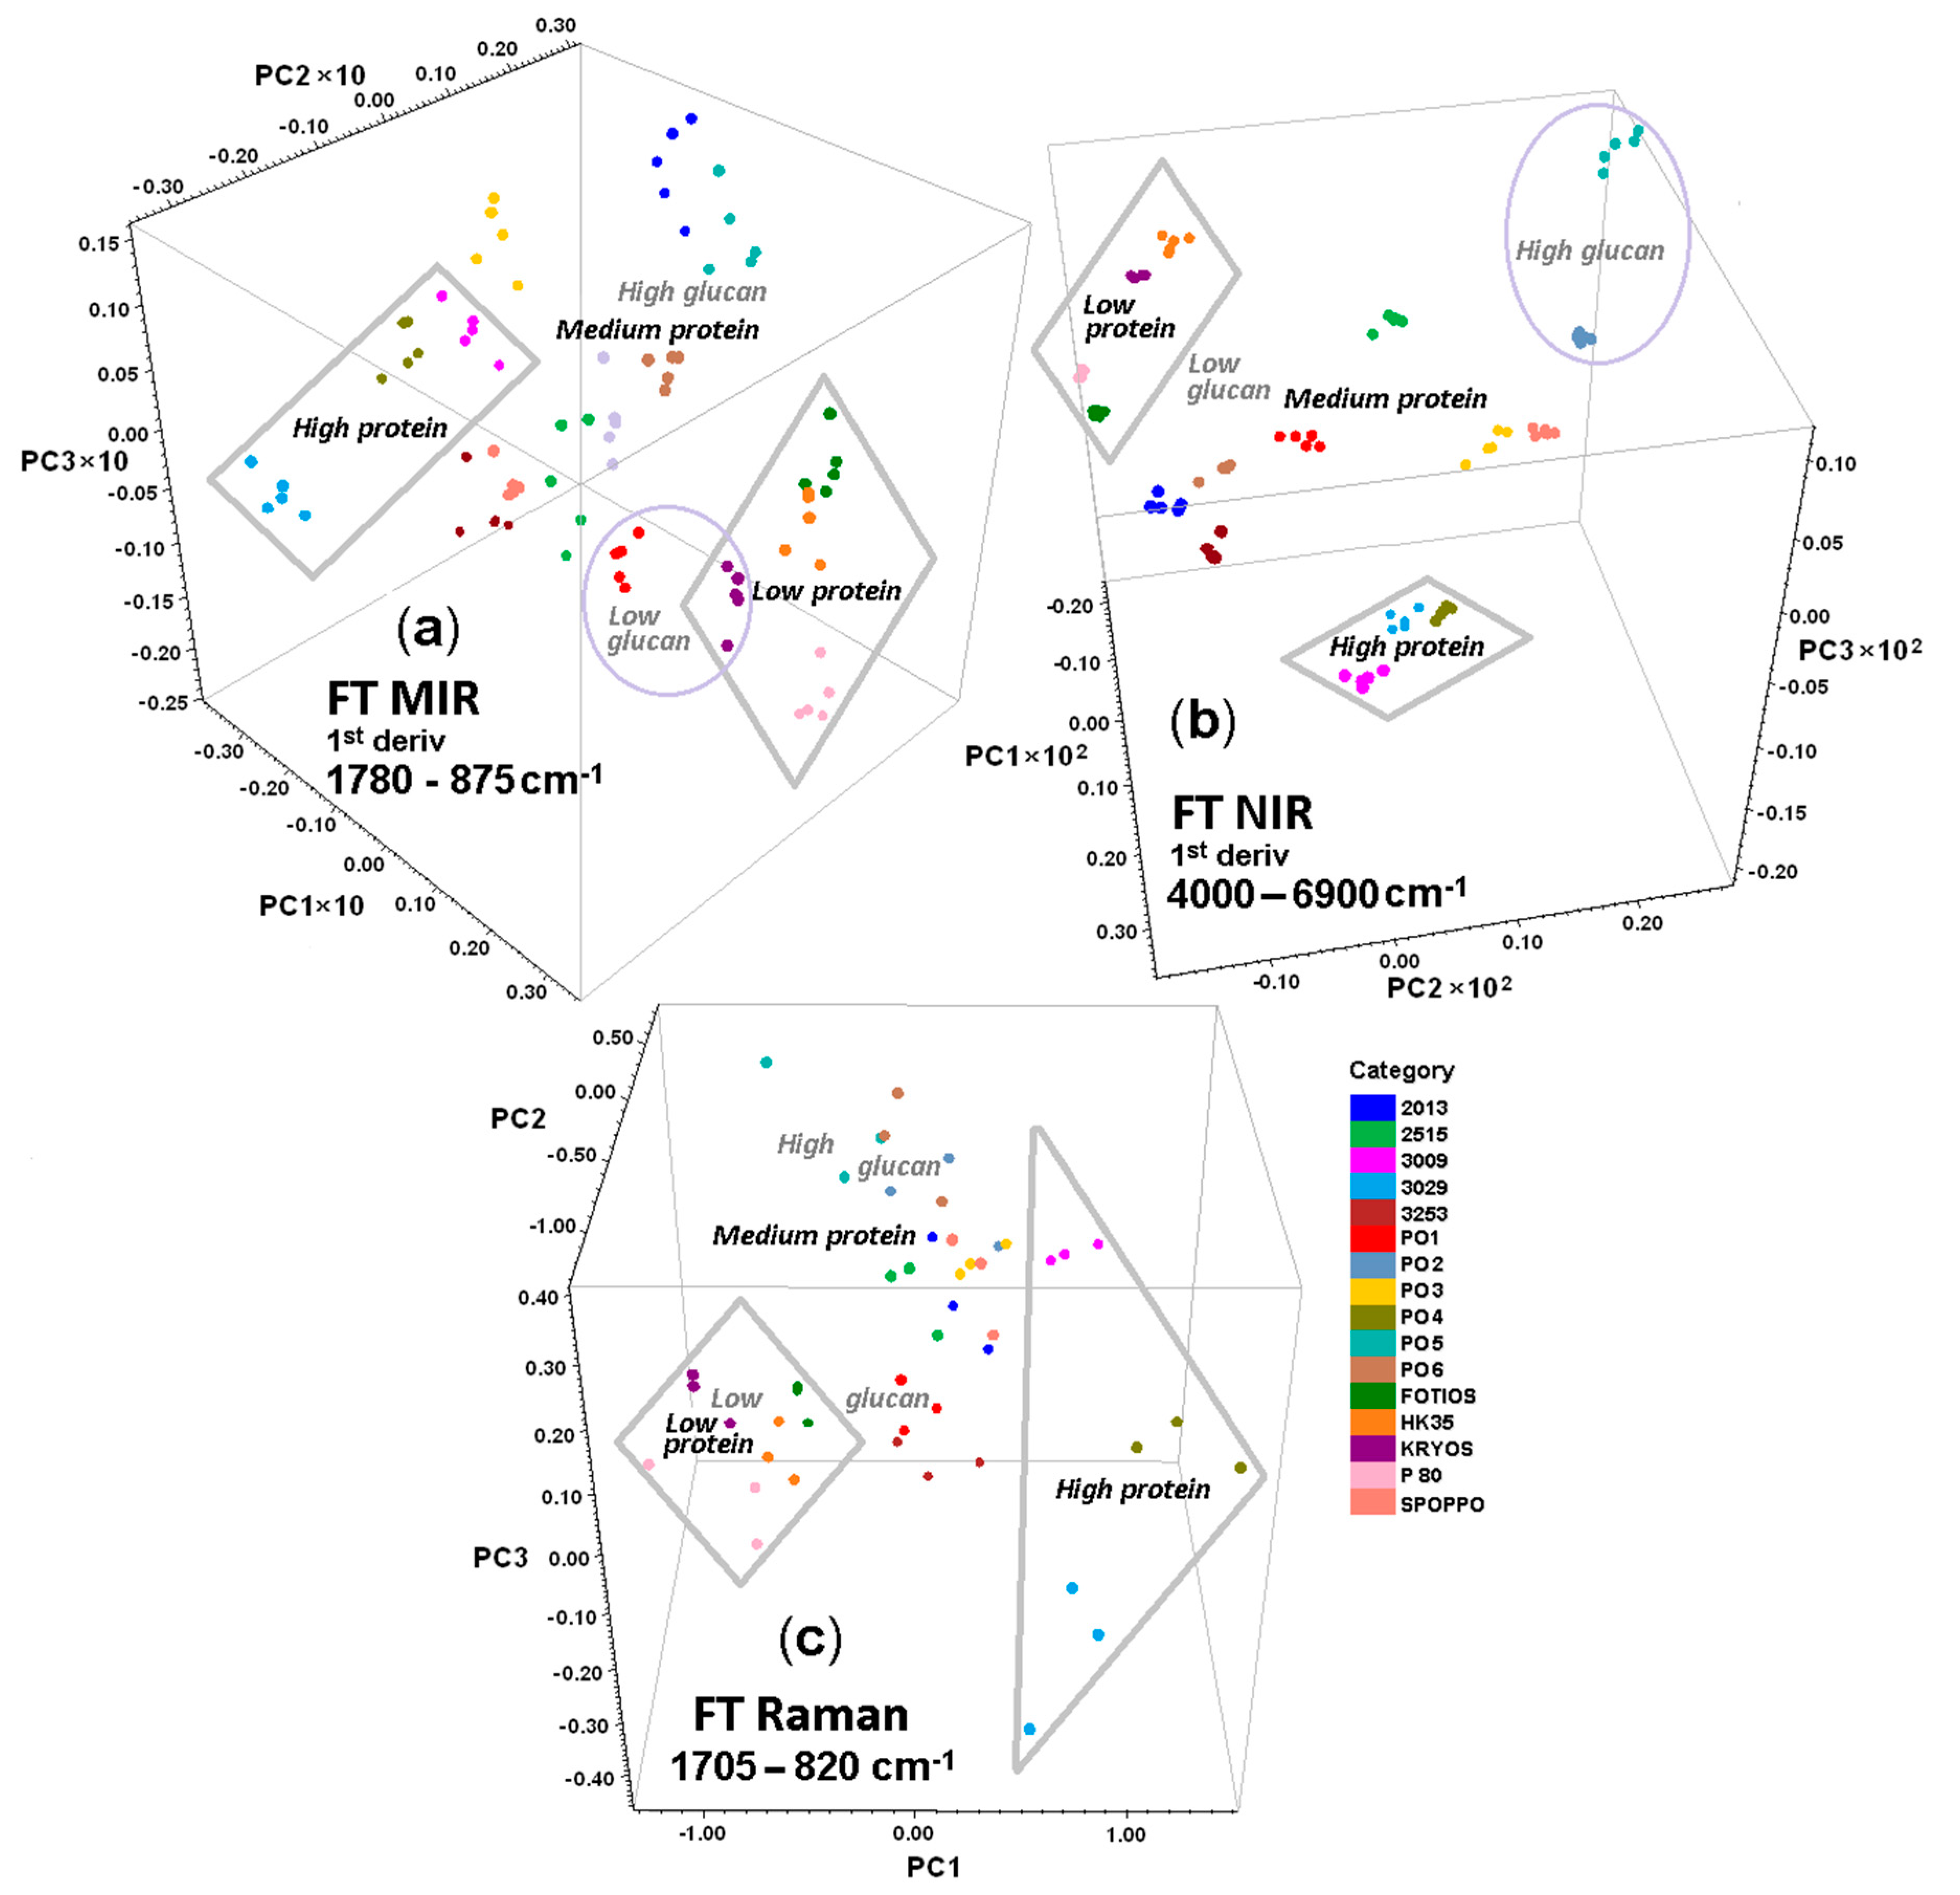
3.3. PCA of Spectroscopic Data
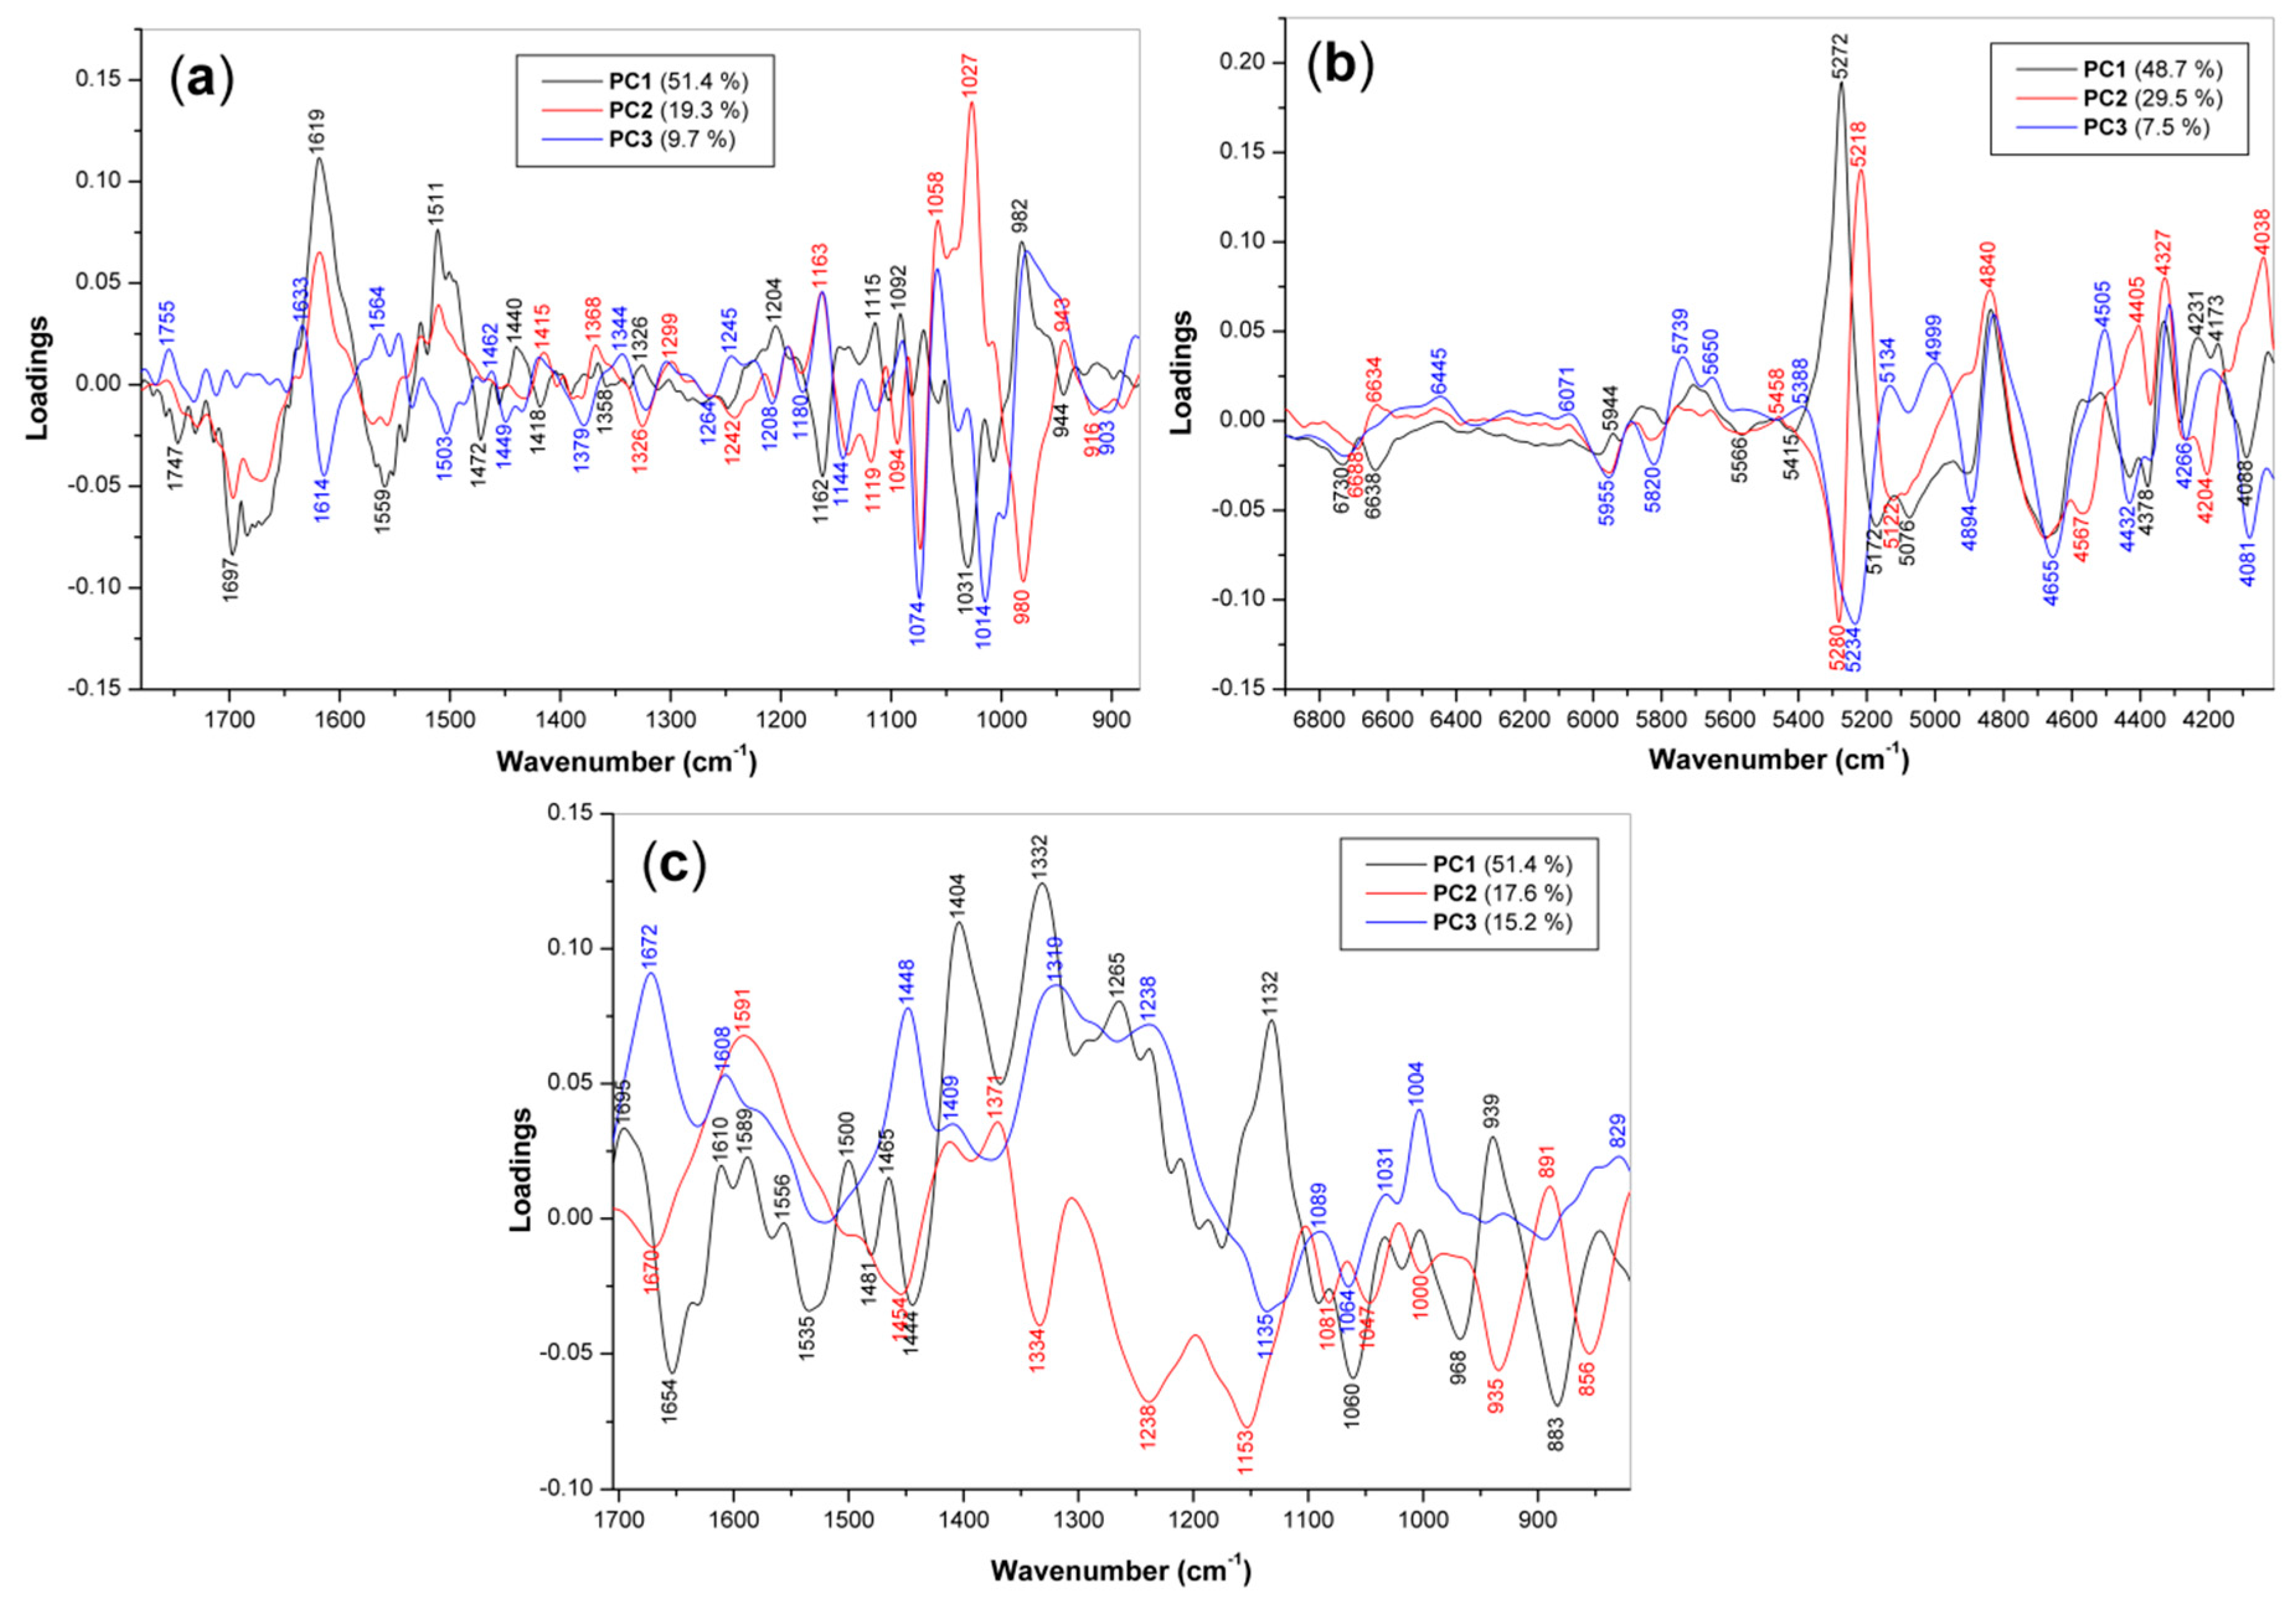
The PCA was performed on the FT MIR, FT NIR and FT Raman spectra of the P. ostreatus basidiocarps to detect clusters according to the protein and total glucan contents. Three main principal components, PC1, PC2 and PC3, explaining ~70–86% of the variance (~49–51% for PC1, ~19–30% for PC2 and ~8–15% for PC3) were used for the discrimination of basidiocarp samples. Unfortunately, none of these principal components or their pairs gave an unambiguous separation of the samples in accordance with their composition. So, we had to use all three components together in 3D to visualize the discrimination of the samples. In the case of FT MIR, and especially FT NIR, the use of the first derivative gave better discrimination results in comparison with the spectra themselves that could be explained by the leveling out of the background effects.

3.3.1. PCA Loadings

The PCA loadings of first three PCs for the FT MIR, FT NIR and FT Raman methods are represented in Figure 2; the band assignment is summarized in Table 5. In the case of FT MIR (Figure 2a), PC1 and PC2 showed two similar intense negative-to-positive couplets at 1697–1619 cm−1 and 1559–1511 cm−1 and a negative peak at 1246–1242 cm−1 corresponding to the amide I, amide II and amide III vibrations, respectively [40,41]. By contrast, PC3 showed two negative-to-positive couplets in this region at 1633–1614 cm−1 and 1564–1503 cm−1. These PCs also showed several intense peaks in the region of carbohydrate vibrations of 1204–943 cm−1, so they are sensitive to the amount and composition of polysaccharides [34].
In the case of PCA loadings for FT NIR (Figure 2b), the most intense peaks were found at 5300–5200 cm−1 assigned to the combination of OH stretching and bend vibrations of polysaccharides [46,47]. Two negative peaks at 4432 and 4378 cm−1 (PC1, PC3) and a positive peak at 4405 cm−1 (PC2) originated from the OH/CO stretch combination of polysaccharides. The negative-to-positive couplets (at 4894–4840 cm−1 and 4675–4505 cm−1 were found in PC1 and PC3 loadings. In the case of PC2, four peaks were found in these regions: two positive ones at 4900 and 4840 cm−1 and two negative ones at 4675 and 4567 cm−1. All these peaks originated from amide combination bands of proteins [43,44,45]. In addition, for all three PCs, weak peaks at 6730–6445 cm−1 also arose from protein vibrations. Finally, the intense negative and positive peaks in the CH combinations and overtones at 6000–5600 cm−1 and 4300–4000 cm−1 had contributions from both proteins and polysaccharides.
The assignment of the PC1–3 loadings for FT Raman spectra (Figure 2c) is difficult because many peaks originated from the C–H and C–C vibrations of both proteins and glucans [34,48]. However, it is evident for PC1 and PC2 that the positive and negative peaks at 970–850 cm−1 arose from anomeric sensitive vibrations of chitin, α- and β-d-glucans [14,26], so these PCs could be useful for distinguishing of basidiocarps based on polysaccharide composition. On the other hand, PC3 loadings demonstrate several positive peaks at 1672 cm−1 (amide I), 1608 and 1409 cm−1 (COO- stretching in Asp and Glu), 1238 cm−1 (amide III), 1031 and 1004 cm−1 (Phe ring vibrations) and 850 and 829 cm−1 (Tyr doublet); all of them are characteristic for proteins [48,49].

3.3.2. 3D Component Score

The 3D component score graphs of PC1 versus PC2 versus PC3 for the 1st derivations of FT MIR spectra (1780–875 cm−1), 1st derivations of FT NIR spectra (6900–4000 cm−1) and normalized FT Raman spectra (1705–825 cm−1) are represented in Figure 3. These graphs illustrate discrimination of the basidiocarp samples originating from sixteen P. ostreatus strains. The samples were assigned according to the amount of proteins and glucans, i.e., with low, medium and high contents of these components. It is evident from all these graphs that the samples po4, 3009 and 3029 with high protein contents (~16.6–17.5%) as well as kryos, hk35, p80 and fotios with low protein contents (~6.2–8.5%) were more or less separated from the rest. Samples spoppo and po3, which contained ~14.8 and ~13.9% proteins, respectively, were located in close proximity to the clusters of high- and medium-protein samples. Unfortunately, there was no discrimination of the basidiocarp samples based on the content of total glucans, although in some cases it was possible to localize samples with a high content (po5 and po2) or, on the contrary, a low content (kryos and po1) of these polysaccharides.
Difficulties in distinguishing basidiocarp samples based on total glucan content can be explained by the fact that the amount of total glucans determined by the enzymatic set includes polysaccharides, which, along with the difference between α- and β-anomeric polymers, also differ in glycosidic bond configuration and branching [14,26,50]. Oyster mushrooms contain a number of water-soluble homo- and heterogalactans, first of all branched mannogalactans that contribute to polysaccharide vibration bands [51]. For example, in a 3D score plot for FT Raman spectra (Figure 3c), the points of sample 3009, which contained a significant proportion of mannose and galactose in the monosaccharide composition, were displaced from the clusters of the other two high-protein samples, 3029 and po4, that may be associated not only with the higher glucan content, but also with the contribution of mannogalactan. The effect of fungal chitin, which is structurally similar to fungal β-d-glucans, should also be taken into account [29]. Moreover, the presence of chitin in the basidiocarp also influences the sample discrimination by protein content using PCA of vibration spectroscopic data, since both biopolymers contain amide groups that contribute to the spectra in a similar way.

3.4. PLSR Models for Protein and Total Glucan Contents

The PLSR models based on the FT MIR, FT NIR and FT Raman data were developed for the prediction of the protein and total glucan contents in the basidiocarps of P. ostreatus mushrooms. The obtained correlation and cross-validation plots are represented in Figure 4. The parameters of all calibration models, including number of factors and spectral regions, are summarized in Table 6. The regression coefficients R2 and the root mean square errors (RMSE) for the calibration (R2cal, RMSEcal) were in the range of 0.908–0.996 and 0.269–2.98, respectively.
Among the vibration spectroscopic methods used, the FT NIR regression models for both protein and total glucans gave the best calibration and cross-validation parameters. Unfortunately, in all cases, the cross-validation of PLSR models for total glucans showed worse results than for proteins, and no suitable RMSE models separately for α- and β-glucans were obtained at all. Indeed, for proteins, the cross-validation parameters R2cv and RMSEcal were in the range of 0.901–0.970 and 0.608–1.11, respectively. These values are acceptable for PLSR models. By contrast, the corresponding values for total glucans significantly differed and were in the range of 0.370–0.804 and 4.66–8.50.
Suitable PLSR models based on mean normalized FT MIR ATR spectra have already been successfully developed to predict total and β-glucans in oyster mushroom basidiocarps [27], but in this case, a larger set of 72 samples was used, including seven for external validation. Perhaps increasing the number of samples could improve the determination of glucans by vibration spectroscopic methods, and another way to normalize the spectra could also help. By normalizing the working spectral regions by the most intense peak, which in all cases had a large contribution from the vibrations of glucans and polysaccharides in general, it was possible to clearly distinguish the spectral differences associated with the amount of proteins, while the difference in the glucan content was leveled. This may have led to deterioration in predicting total glucans compared to proteins.

3.5. Estimation of Proteins By Raman Band at 1004 cm−1

As it was mentioned above, the Raman band of Phe ring vibration at 1004 cm−1 is characteristic for proteins. The relative height of this narrow band was used for quantification of proteins in P. ostreatus basidiocarps. The baseline at 1025–990 cm−1 was used for the estimation of the height (Figure 5a). The strong correlation between this height and protein content was found (Figure 5b), so this value can be used for quantification of proteins in P. ostreatus basidiocarps. On the other hand, if we take into account that the selected band refers exclusively to the specific vibration of proteins, then this strong correlation also confirms that the nitrogen content is indeed suitable for determining the protein, and the presence of chitin does not significantly affect this assessment.

4. Conclusions

Analytical results confirmed significant differences in the biopolymer composition of oyster mushroom basidiocarps. In the vibrational spectra of basidiocarp samples, characteristic bands of proteins and polysaccharides were found that make it possible to evaluate individual strains by their biopolymer composition, and therefore can be used to assess the quality of mushrooms as culinary ingredients and also as the source for preparation of food supplements.
The combination of vibrational spectroscopy and chemometrics proved to be successful in discriminating basidiocarp samples based on protein contribution and, to a lesser extent, total glucans. The results obtained can be considered as an example of screening of individual oyster mushroom strains, the criterion of which is the choice of forms for the purpose of their selective cultivation and further use. Obviously, high protein content is preferable for culinary purposes, while the presence of β-d-glucans can have dietary and even medicinal significance.
A combination of the above methods has also been proposed to predict the biopolymer contents of basidiocarps. Again, the models for predicting proteins were found to be more precise and accurate than the corresponding models for total glucan. Thus, despite the high content of polysaccharides in basidiocarps compared to proteins, multivariate analysis of vibrational spectra was more effective in relation to proteins than total glucans. The difficulties associated with spectroscopic assessment and quantification of the total amount of glucans in basidiocarp can be explained by the wide structural diversity of these polysaccharides in oyster mushrooms. In addition, the spectral contribution of other polysaccharides, namely mannogalactan and chitin, may be responsible for the poorer results for total glucans. Further research is required to better evaluate and distinguish the basidiocarps of different strains in terms of their polysaccharide composition.
Despite these difficulties, the result of this study shows that the combination of vibration spectroscopy with multivariate statistical methods can serve as a powerful potential tool for assessing the content of not only proteins, but also polysaccharides in oyster mushrooms, which have culinary and medicinal value. Quantification of proteins and glucans is especially important for the characterization of fungi, as it allows determination of the efficiency of cultivation and the most appropriate time for harvesting. In addition, it is known that different parts of the basidiocarp (stems, caps and spores) can differ significantly in biopolymer composition. The universal character of vibration spectroscopy allows these methods to be applied in the analysis of other types of edible mushrooms, of course, taking into account the peculiarities of their composition. Nevertheless, this approach can be proposed as an alternative to the widely used expensive and time-consuming analytical methods.

Author Contributions

Conceptualization, A.S. and P.K.; methodology, E.B. and R.B.; software, M.S. and I.Š.; validation, M.S. and I.Š.; formal analysis, E.B., R.B. and L.S.; investigation, E.B., R.B. and A.S.; resources, I.J.; data curation, E.B. and L.S.; writing—original draft preparation, E.B. and R.B.; writing—review and editing, E.B., R.B. and A.S.; supervision, A.S. and J.Č.; project administration, J.Č. and A.S.; funding acquisition, P.K., I.J. and A.S. All authors have read and agreed to the published version of the manuscript.

Funding

This research was funded by the Ministry of Agriculture of the Czech Republic, project number QK1910209, and by Specific University Research of UCT Prague, project number 21-SVV/2020.

Acknowledgments

The authors are grateful to Ing. Rudolf Ryzner for the supply of grown oyster mushrooms (basidiocarps) used for experiments. The authors also thank Ekaterina Lavrova, Kristina Panušková and Aneta Machalíková for technical support in sample preparation and analysis.

Conflicts of Interest

The authors declare no conflict of interest.

References

  1. de Carvalho, C.S.M.; Sales-Campos, C.; de Andrade, M.C.N. Mushrooms of the Pleurotus genus: A review of cultivation techniques. Interciencia 2010, 35, 177–182. [Google Scholar]
  2. Corrêa, R.C.G.; Brugnari, T.; Bracht, A.; Peralta, R.M.; Ferreira, I.C. Biotechnological, nutritional and therapeutic uses of Pleurotus spp. (Oyster mushroom) related with its chemical composition: A review on the past decade findings. Trends Food Sci. Technol. 2016, 50, 103–117. [Google Scholar] [CrossRef] [Green Version]
  3. Carrasco-González, J.A.; Serna-Saldívar, S.O.; Gutiérrez-Uribe, J.A. Nutritional composition and nutraceutical properties of the Pleurotus fruiting bodies: Potential use as food ingredient. J. Food Compos. Anal. 2017, 58, 69–81. [Google Scholar] [CrossRef]
  4. Kalač, P. A review of chemical composition and nutritional value of wild-growing and cultivated mushrooms. J. Sci. Food Agric. 2013, 93, 209–218. [Google Scholar] [CrossRef] [PubMed]
  5. Synytsya, A.; Míčková, K.; Jablonský, I.; Sluková, M.; Čopíková, J. Mushrooms of genus Pleurotus as a source of dietary fibres and glucans for food supplements. Czech J. Food Sci. 2009, 26, 441–446. [Google Scholar] [CrossRef] [Green Version]
  6. Patel, Y.; Naraian, R.; Singh, V.K. Medicinal properties of Pleurotus species (Oyster mushroom): A review. World J. Fungal Plant Biol. 2012, 3, 1–12. [Google Scholar]
  7. Zhu, F.; Du, B.; Bian, Z.; Xu, B. β-Glucans from edible and medicinal mushrooms: Characteristics, physicochemical and biological activities. J. Food Compos. Anal. 2015, 41, 165–173. [Google Scholar] [CrossRef]
  8. Rop, O.; Mlcek, J.; Jurikova, T. β-Glucans in higher fungi and their health effects. Nutr. Rev. 2009, 67, 624–631. [Google Scholar] [CrossRef]
  9. Ma, G.; Yang, W.; Mariga, A.M.; Fang, Y.; Ma, N.; Pei, F.; Hu, Q. Purification, characterization and antitumor activity of polysaccharides from Pleurotus eryngii residue. Carbohydr. Polym. 2014, 114, 297–305. [Google Scholar] [CrossRef]
  10. Zhang, Y.; Dai, L.; Kong, X.; Chen, L. Characterization and in vitro antioxidant activities of polysaccharides from Pleurotus ostreatus. Int. J. Biol. Macromol. 2012, 51, 259–265. [Google Scholar] [CrossRef]
  11. Zhang, Y.; Hu, T.; Zhou, H.; Jin, G.; Yang, Y. Antidiabetic effect of polysaccharides from Pleurotus ostreatus in streptozotocin-induced diabetic rats. Int. J. Biol. Macromol. 2016, 83, 126–132. [Google Scholar] [CrossRef] [PubMed]
  12. Smiderle, F.; Olsen, L.; Carbonero, E.; Marcon, R.; Baggio, C.; Freitas, C.; Santos, A.; Torri, G.; Gorin, P.; Iacomini, M. A 3-O-methylated mannogalactan from Pleurotus pulmonarius: Structure and antinociceptive effect. Phytochemistry 2008, 69, 2731–2736. [Google Scholar] [CrossRef] [PubMed]
  13. Sun, Y.-X.; Liu, J. Purification, structure and immunobiological activity of a water-soluble polysaccharide from the fruiting body of Pleurotus ostreatus. Bioresour. Technol. 2009, 100, 983–986. [Google Scholar] [CrossRef] [PubMed]
  14. Synytsya, A.; Míčková, K.; Synytsya, A.; Jablonský, I.; Spěváček, J.; Erban, V.; Kováříková, E.; Čopíková, J. Glucans from fruit bodies of cultivated mushrooms Pleurotus ostreatus and Pleurotus eryngii: Structure and potential prebiotic activity. Carbohydr. Polym. 2009, 76, 548–556. [Google Scholar] [CrossRef]
  15. Deepalakshmi, K.; Sankaran, M. Pleurotus ostreatus: An oyster mushroom with nutritional and medicinal properties. J. Biochem. Technol. 2014, 5, 718–726. [Google Scholar]
  16. Alam, N.; Yoon, K.N.; Lee, T.S.; Lee, U.Y. Hypolipidemic Activities of Dietary Pleurotus ostreatus in Hypercholesterolemic Rats. Mycobiology 2011, 39, 45–51. [Google Scholar] [CrossRef] [PubMed]
  17. Schneider, I.; Kressel, G.; Meyer, A.; Krings, U.; Berger, R.G.; Hahn, A. Lipid lowering effects of oyster mushroom (Pleurotus ostreatus) in humans. J. Funct. Foods 2011, 3, 17–24. [Google Scholar] [CrossRef]
  18. Vasudewa, N.; Abeytunga, D.; Ratnasooriya, W. Antinociceptive Activity of Pleurotus ostreatus, an Edible Mushroom, in Rats. Pharm. Biol. 2007, 45, 533–540. [Google Scholar] [CrossRef]
  19. Jayakumar, T.; Ramesh, E.; Geraldine, P. Antioxidant activity of the oyster mushroom, Pleurotus ostreatus, on CCl4-induced liver injury in rats. Food Chem. Toxicol. 2006, 44, 1989–1996. [Google Scholar] [CrossRef]
  20. Jedinak, A.; Dudhgaonkar, S.; Wu, Q.; Simon, J.E.; Sliva, D. Anti-inflammatory activity of edible oyster mushroom is mediated through the inhibition of NF-κB and AP-1 signaling. Nutr. J. 2011, 10, 52. [Google Scholar] [CrossRef] [Green Version]
  21. Karácsonyi, S.; Kuniak, L. Polysaccharides of Pleurotus ostreatus: Isolation and structure of pleuran, an alkali-insoluble β-d-glucan. Carbohydr. Polym. 1994, 24, 107–111. [Google Scholar] [CrossRef]
  22. Jesenak, M.; Majtan, J.; Rennerova, Z.; Kyselovic, J.; Banovcin, P.; Hrubisko, M. Immunomodulatory effect of pleuran (β-glucan from Pleurotus ostreatus) in children with recurrent respiratory tract infections. Int. Immunopharmacol. 2013, 15, 395–399. [Google Scholar] [CrossRef]
  23. Tong, H.; Xia, F.; Feng, K.; Sun, G.; Gao, X.; Sun, L.; Jiang, R.; Tian, D.; Sun, X. Structural characterization and in vitro antitumor activity of a novel polysaccharide isolated from the fruiting bodies of Pleurotus ostreatus. Bioresour. Technol. 2009, 100, 1682–1686. [Google Scholar] [CrossRef] [PubMed]
  24. Curvetto, N.; Figlas, D.; Devalis, R.; Delmastro, S. Growth and productivity of different Pleurotus ostreatus strains on sunflower seed hulls supplemented with N–NH4+ and/or Mn(II). Bioresour. Technol. 2002, 84, 171–176. [Google Scholar] [CrossRef]
  25. Meenu, M.; Xu, B. Application of vibrational spectroscopy for classification, authentication and quality analysis of mushroom: A concise review. Food Chem. 2019, 289, 545–557. [Google Scholar] [CrossRef]
  26. Baeva, E.; Bleha, R.; Lavrova, E.; Sushytskyi, L.; Čopíková, J.; Jablonsky, I.; Klouček, P.; Synytsya, A. Polysaccharides from Basidiocarps of Cultivating Mushroom Pleurotus ostreatus: Isolation and Structural Characterization. Molecules 2019, 24, 2740. [Google Scholar] [CrossRef] [Green Version]
  27. Bekiaris, G.; Tagkouli, D.; Koutrotsios, G.; Kalogeropoulos, N.; Zervakis, G.I. Pleurotus Mushrooms Content in Glucans and Ergosterol Assessed by ATR-FTIR Spectroscopy and Multivariate Analysis. Foods 2020, 9, 535. [Google Scholar] [CrossRef]
  28. Mikola, E.; Geösel, A.; Stefanovits-Bányai, É.; Fodor, M. Quantitative determination of macro components and classification of some cultivated mushrooms using near-infrared spectroscopy. J. Food Process. Preserv. 2020, 44, 14540. [Google Scholar] [CrossRef]
  29. Gomba, G.K.; Synytsya, A.; Švecová, P.; Čopíková, J.; Coimbra, M. Distinction of fungal polysaccharides by N/C ratio and mid infrared spectroscopy. Int. J. Biol. Macromol. 2015, 80, 271–281. [Google Scholar] [CrossRef] [PubMed]
  30. Oberle, J.; Dighton, J.; Arbuckle-Keil, G.A. Comparison of methodologies for separation of fungal isolates using Fourier transform infrared (FTIR) spectroscopy and Fourier transform infrared-attenuated total reflectance (FTIR-ATR) microspectroscopy. Fungal Biol. 2015, 119, 1100–1114. [Google Scholar] [CrossRef] [PubMed]
  31. Qi, L.-M.; Zhang, J.; Liu, H.-G.; Li, T.; Wang, Y. Fourier transform mid-infrared spectroscopy and chemometrics to identify and discriminate Boletus edulis and Boletus tomentipes mushrooms. Int. J. Food Prop. 2017, 20, S56–S68. [Google Scholar] [CrossRef] [Green Version]
  32. Fujihara, S.; Kasuga, A.; Aoyagi, Y.; Sugahara, T. Nitrogen-to-Protein Conversion Factors for Some Common Edible Mushrooms. J. Food Sci. 1995, 60, 1045–1047. [Google Scholar] [CrossRef]
  33. Braaksma, A.; Schaap, D. Protein analysis of the common mushroom Agaricus bisporus. Postharvest Biol. Technol. 1996, 7, 119–127. [Google Scholar] [CrossRef]
  34. Wiercigroch, E.; Szafraniec, E.; Czamara, K.; Pacia, M.Z.; Majzner, K.; Kochan, K.; Kaczor, A.; Barańska, M.; Malek, K. Raman and infrared spectroscopy of carbohydrates: A review. Spectrochim. Acta Part A Mol. Biomol. Spectrosc. 2017, 185, 317–335. [Google Scholar] [CrossRef] [PubMed]
  35. Gutiérrez, A.; Prieto, A.; Martínez, M.J. Structural characterization of extracellular polysaccharides produced by fungi from the genus Pleurotus. Carbohydr. Res. 1996, 281, 143–154. [Google Scholar] [CrossRef]
  36. Šandula, J.; Kogan, G.; Kačuráková, M.; Machová, E. Microbial (1→3)-β-d-glucans, their preparation, physico-chemical characterization and immunomodulatory activity. Carbohydr. Polym. 1999, 38, 247–253. [Google Scholar] [CrossRef]
  37. Unursaikhan, S.; Xu, X.; Zeng, F.; Zhang, L. Antitumor activities of O-sulphonated derivatives of (1→3)-glucans from different Lentinus edodes. Biosci. Biotechnol. Biochem. 2006, 70, 38–46. [Google Scholar] [CrossRef] [PubMed]
  38. Wang, T.; Deng, L.; Li, S.; Tan, T. Structural characterization of a water insoluble α-(1→3)-d-glucan isolated from the Penicillium chrysogenum. Carbohydr. Polym. 2007, 67, 133–137. [Google Scholar] [CrossRef]
  39. Liu, G.; Song, D.; Zhao, D.; Liu, J.-H.; Zhou, Y.; Ou, J.; Sun, S. A study of the mushrooms of boletes by Fourier transform infrared spectroscopy. In Proceedings of the ICO20: Biomedical Optics, Changchun, China, 2 February 2006; Volume 6026. [Google Scholar] [CrossRef]
  40. Cárdenas, G.; Cabrera, G.; Taboada, E.; Miranda, S.P. Chitin characterization by SEM, FTIR, XRD, and13C cross polarization/mass angle spinning NMR. J. Appl. Polym. Sci. 2004, 93, 1876–1885. [Google Scholar] [CrossRef]
  41. Kong, J.; Yu, S. Fourier Transform Infrared Spectroscopic Analysis of Protein Secondary Structures. Acta Biochim. Biophys. Sin. 2007, 39, 549–559. [Google Scholar] [CrossRef] [Green Version]
  42. Ibrahim, M.; Nada, A.; Kamal, D.E. Density functional theory and FTIR spectroscopic study of carboxyl group. Ind. J. Pure Appl. Phys. 2005, 43, 911–917. [Google Scholar]
  43. Miyazawa, M.; Sonoyama, M. Second Derivative near Infrared Studies on the Structural Characterisation of Proteins. J. Near Infrared Spectrosc. 1998, 6, A253–A257. [Google Scholar] [CrossRef]
  44. Wang, J.; Sowa, M.G.; Ahmed, M.K.; Mantsch, H.H. Photoacoustic Near-Infrared Investigation of Homo-Polypeptides. J. Phys. Chem. 1994, 98, 4748–4755. [Google Scholar] [CrossRef]
  45. Workmanjr, J. Interpretive Spectroscopy for Near-Infrared. Appl. Spectrosc. Rev. 1996, 31, 251–320. [Google Scholar] [CrossRef]
  46. López, M.G.; García-González, A.S.; Franco-Robles, E. Carbohydrate Analysis by NIRS-Chemometrics. In Developments in Near-Infrared Spectroscopy; IN TECH: München, Germany, 2017; Volume 10, p. 67208. [Google Scholar] [CrossRef] [Green Version]
  47. Ma, Y.; He, H.; Wu, J.; Wang, C.; Chao, K.; Huang, Q. Assessment of Polysaccharides from Mycelia of genus Ganoderma by Mid-Infrared and Near-Infrared Spectroscopy. Sci. Rep. 2018, 8, 1–10. [Google Scholar] [CrossRef]
  48. Rygula, A.; Majzner, K.; Marzec, K.M.; Kaczor, A.; Pilarczyk, M.; Baranska, M. Raman spectroscopy of proteins: A review. J. Raman Spectrosc. 2013, 44, 1061–1076. [Google Scholar] [CrossRef]
  49. Noothalapati, H.; Sasaki, T.; Kaino, T.; Kawamukai, M.; Ando, M.; Hamaguchi, H.-O.; Yamamoto, T. Label-free Chemical Imaging of Fungal Spore Walls by Raman Microscopy and Multivariate Curve Resolution Analysis. Sci. Rep. 2016, 6, 27789. [Google Scholar] [CrossRef] [Green Version]
  50. Synytsya, A.; Novák, M. Structural diversity of fungal glucans. Carbohydr. Polym. 2013, 92, 792–809. [Google Scholar] [CrossRef]
  51. Ruthes, A.C.; Smiderle, F.R.; Iacomini, M. Mushroom heteropolysaccharides: A review on their sources, structure and biological effects. Carbohydr. Polym. 2016, 136, 358–375. [Google Scholar] [CrossRef]
Figure 1. Average normalized spectra of sixteen P. ostreatus basidiocarp samples: (a) Fourier-transformed (FT) mid-infrared (FT MIR), (b) FT near-infrared (NIR) and (c) FT Raman. The asterisk indicates the peak used to normalize the spectra.
Applsci 10 08156 g001
Figure 2. PCA loadings of the first three PCs for the spectroscopic data: (a) FT MIR, (b) FT NIR and (c) FT Raman.
Applsci 10 08156 g002
Figure 3. The 3D score plots of PC1 versus PC2 versus PC3 for the PCA of spectroscopic data: (a) FT MIR, (b) FT NIR and (c) FT Raman.
Applsci 10 08156 g003
Figure 4. The PLSR models for the protein and total glucan contents in P. ostreatus basidiocarps.
Applsci 10 08156 g004
Figure 5. Using the Raman band of the Phe ring breathing vibration at 1004 cm−1 for determination of proteins in P. ostreatus basidiocarps: (a) measuring of the height; (b) correlation between this height and protein content (% w/w).
Applsci 10 08156 g005
Table 1. Specification of the P. ostreatus basidiocarp samples.
SampleStrainSupplier
20132013Mycelia nv (Deinze, Belgium)
25152515Mycelia nv (Deinze, Belgium)
30093009Sylvan Inc. (Kittanning, PA, USA)
30293029Sylvan Inc. (Kittanning, PA, USA)
32533253Sylvan Inc. (Kittanning, PA, USA)
fotiosfotiosSylvan Inc. (Kittanning, PA, USA)
hk35HK35Sylvan Inc. (Kittanning, PA, USA)
kryosKRYOSSylvan Inc. (Kittanning, PA, USA)
spoppoSPOPPOSylvan Inc. (Kittanning, PA, USA)
po1PO1Unknown
po2PO2Unknown
po3PO3Unknown
po4PO4Unknown
po5PO5Unknown
po6PO6Unknown
p80P80Hollander Spawn BV (Horst, Holland)
Table 2. Composition of basidiocarps: organic elements and proteins (mean ± SD) 1.
SampleOrganic Elements (% w/w)Proteins 2
(% w/w)
NCHS
20133.05 ± 0.3040.55 ± 0.376.69 ± 0.090.14 ± 0.0212.17 ± 1.20 bcdef
25152.90 ± 0.1440.33 ± 0.566.78 ± 0.050.14 ± 0.0211.57 ± 0.56 abcde
30094.09 ± 0.3841.14 ± 0.316.73 ± 0.070.19 ± 0.0416.32 ± 1.52 ef
30294.17 ± 0.1641.03 ± 0.446.79 ± 0.090.22 ± 0.0116.64 ± 0.64 ef
32533.27 ± 0.3640.83 ± 0.446.75 ± 0.040.14 ± 0.0213.05 ± 1.44 cdef
fotios2.13 ± 0.2240.85 ± 0.356.79 ± 0.110.11 ± 0.018.50 ± 0.88 abc
hk351.55 ± 0.1939.93 ± 0.286.75 ± 0.090.09 ± 0.026.18 ± 0.76 a
kryos1.56 ± 0.2039.73 ± 0.366.74 ± 0.100.08 ± 0.016.22 ± 0.80 a
spoppo3.70 ± 0.2340.81 ± 0.286.80 ± 0.050.11 ± 0.0214.76 ± 0.92 def
po13.09 ± 0.3240.56 ± 0.356.80 ± 0.050.14 ± 0.0112.33 ± 1.28 bcdef
po23.27 ± 0.2540.94 ± 0.416.77 ± 0.050.17 ± 0.0213.05 ± 1.00 cdef
po33.47 ± 0.2141.06 ± 0.396.78 ± 0.070.16 ± 0.0313.85 ± 0.84 cdef
po44.38 ± 0.3341.73 ± 0.406.78 ± 0.060.22 ± 0.0317.48 ± 1.32 f
po52.48 ± 0.1940.50 ± 0.136.79 ± 0.080.12 ± 0.029.90 ± 0.76 abcd
po62.81 ± 0.2940.88 ± 0.366.77 ± 0.100.13 ± 0.0211.21 ± 1.16 abcde
p801.73 ± 0.1740.23 ± 0.236.81 ± 0.070.09 ± 0.016.90 ± 0.68 ab
1 The statistical significance between mean values was calculated using ANOVA with Tukey HSD test (p < 0.05); a–f are in sequence in accordance with statistically significant differences between samples. 2 N × 3.99.
Table 3. Neutral sugars composition of purified basidiocarps (mean ± SD).
SampleNeutral Sugars (mol %)
FucoseArabinoseMannoseGlucoseGalactoseRhamnoseXylose
2013trace0.14 ± 0.0102.10 ± 0.4492.99 ± 1.101.46 ± 0.190.31 ± 0.113.00 ± 0.84
25150.14 ± 0.090.16 ± 0.121.96 ± 0.00491.20 ± 4.271.18 ± 0.030.27 ± 0.045.09 ± 2.20
3009trace0.45 ± 0.0128.70 ± 0.2571.26 ± 1.3012.63 ± 0.430.17 ± 0.0086.78 ± 1.98
30290.09 ± 0.030.24 ± 0.082.21 ± 0.0293.39 ± 1.211.49 ± 0.030.24 ± 0.052.34 ± 0.32
3253trace0.07 ± 0.071.95 ± 0.0587.54 ± 1.301.55 ± 0.240.16 ± 0.0228.71 ± 0.12
fotios0.08 ± 0.030.20 ± 0.111.64 ± 0.1091.20 ± 1.270.87 ± 0.0164.00 ± 0.052.01 ± 0.28
hk350.29 ± 0.220.18 ± 0.092.14 ± 0.0389.94 ± 1.260.56 ± 0.041.44 ± 1.285.44 ± 0.35
kryostrace0.61 ± 0.251.85 ± 0.0791.31 ± 1.610.50 ± 0.0152.75 ± 2.382.94 ± 0.94
spoppo0.67 ± 0.190.49 ± 0.091.84 ± 0.1187.19 ± 1.061.84 ± 0.093.08 ± 0.194.89 ± 0.40
po10.09 ± 0.012trace2.56 ± 0.0794.41 ± 1.211.08 ± 0.0100.16 ± 0.0031.68 ± 0.14
po20.18 ± 0.160.13 ± 0.052.15 ± 0.1394.27 ± 1.760.84 ± 0.070.34 ± 0.0052.10 ± 1.06
po30.07 ± 0.0080.24 ± 0.091.69 ± 0.0292.52 ± 2.301.14 ± 0.030.17 ± 0.034.17 ± 0.04
po40.06 ± 0.050.11 ± 0.042.10 ± 0.01091.00 ± 1.741.39 ± 0.0070.93 ± 0.764.40 ± 0.06
po5trace0.18 ± 0.181.16 ± 0.0392.76 ± 1.620.67 ± 0.090.19 ± 0.0125.02 ± 0.32
po60.07 ± 0.0120.28 ± 0.0042.08 ± 0.0490.54 ± 1.541.19 ± 0.350.21 ± 0.0105.62 ± 1.91
p800.35 ± 0.150.09 ± 0.0191.46 ± 0.01786.07 ± 2.130.74 ± 0.0195.29 ± 0.936.01 ± 1.57
Table 4. Composition of basidiocarps: total, α- and β-glucans (mean ± SD).
SampleGlucans (% w/w) 1
Totalα-Glucansβ-Glucans
201348.44 ± 2.01 c8.98 ± 0.27 cd39.46 ± 1.61 bcde
251545.99 ± 1.13 c13.85 ± 0.14 e32.14 ± 0.82 bc
300955.31 ± 1.56 c8.66 ± 0.17 c46.65 ± 1.35 def
302943.54 ± 2.80 bc4.89 ± 0.52 ab38.79 ± 1.97 bcde
325352.51 ± 1.44 c11.42 ± 0.30 cde41.10 ± 3.06 cdef
fotios45.45 ± 2.30 bc5.45 ± 0.43 b40.03 ± 1.96 bcde
hk3549.22 ± 2.55 c5.22 ± 0.61 ab44.00 ± 1.75 cdef
kryos18.79 ± 3.39 a2.94 ± 0.46 ab15.85 ± 2.51 a
spoppo50.58 ± 2.85 c11.76 ± 0.93 de38.86 ± 2.29 bcde
po130.39 ± 2.95 ab3.15 ± 0.25 ab27.23 ± 2.25 ab
po256.17 ± 2.79 c4.63 ± 0.81 ab51.54 ± 1.80 ef
po348.32 ± 3.22 c9.03 ± 0.14 cd39.29 ± 2.77 bcde
po445.98 ± 2.08 c12.43 ± 0.30 e33.56 ± 1.57 bcd
po558.17 ± 3.14 c9.55 ± 0.68 cd48.62 ± 1.80 ef
po650.84 ± 3.39 c16.72 ± 0.48 f34.12 ± 2.37 bcd
p8057.89 ± 2.60 c2.52 ± 0.19 a55.36 ± 2.33 f
1 The statistical significance between mean values was calculated using ANOVA with Tukey HSD test (p < 0.05); a–f are in sequence in accordance with statistically significant differences between samples.
Table 5. Assignments of loading bands (cm−1) for principal components (PC) 1–3.
MethodWavenumber (cm−1)Origin 1
LoadingsSpectra
PC1PC2PC3
FT MIR↓1697/↑1619↓1697/↑1619↑1633/↓16141642amide I—proteins, chitin
↓1559/↑1511↓1556/↑1511↑1564/↓15031536amide II—proteins, chitin
↓1472/↑1440 ↑1462/↓14491455shδ(CH2), δas(CH3)
↓1418↑1415↑14181421δ(CHO)(COH)—glucans
↓1382/↑1368↓13791375δs(CH3)—proteins, chitin
↑1326↓1326/↑1299↓1324/↑13001316amide III—chitin
↓1246↓1242↑12451236amide III—proteins
↑1204↓1206↓12081202β-d-glucans
↓1162/↑1144↑1163/↓1142↑1163/↓11441150ν(COC)—glucans, chitin
↑1115↓1119↓11141100ν(CO)(CC)—glucans, chitin
↑1070↓1074/↑1058↓1074/↑10581075ν(CO)(CC)—glucans, chitin
↓1031/↑982↑1027/↓980↓1014/↑9801040ν(CO)(CC)—glucans, chitin
↓944↑943↑946930α-d-glucans
FT NIR↓6730, ↓6638↓6688/↑6634↓67006600shNH comb.—proteins, chitin
↑64456470shNH 1st ov.—proteins, chitin
↓5955, ↓5820↓5955, ↓5820 CH, CH2, CH3 1st ov.
↑5739, ↑5850 CH, CH2, CH3 1st ov.
↑5272/↓5172↓5280/↑5218↓52345165OH comb.–glucans, chitin
↓5076↓5122↓5134, ↓4999 OH comb.–glucans, chitin
↓4894/↑4840↑4900, ↑4840↓4894/↑4840 amide A/II comb.–proteins
↓4675/↑4515↓4675, ↓4567↓4655/↑4505 amide B/II comb.–proteins
↓4432, ↓4378↑4405↓4432 OH/CO comb.–glucans, chitin
↑4231↑4327/↓4266↑4335/↓42664285CH, CH2, CH3 comb.
↑4173/↓4088↓4204/4038↑4150/↓4081 CH, CH2, CH3 comb.
FT Raman↓1654↓1670↑16721670amide I–proteins, chitin
↑1610, ↑1589↑1591↑16081604νas(COO-)–proteins
↓1535 ν(C=C)–phenolic compounds
↓1444↓1454↑14481457δ(CH2), δas(CH3)
↑1404↑1409↑1409 νs(COO-)–proteins
↑1371 δs(CH3)–proteins, chitin
↑1332↓1334↑13101335δ(CH), δ(OH)
↑1265↓1238↑12381263amide III–proteins
↑1132↓1153↓11351116ν(CO)(CC)–glucans, chitin
↓1060↓1081, 1047↓1064 ν(CO)(CC)–glucans, chitin
↓1000↑10311033Phe ring–proteins
↑10041004Phe ring–proteins
↓968, ↑939↓935 α-d-glucans
↓883↑891 894δ(C1H)–β-d-glucans, chitin
↓856 δ(C1H)–α-d-glucans
↑845, ↑829 Tyr ring–proteins
1 comb., combination; ov., overtone.
Table 6. Parameters of the partial least squares regression (PLSR) models.
ParametersProteinsTotal Glucans
FT MIRFT NIRFT RamanFT MIRFT NIRFT Raman
Spectroscopic data1st deriv.1st deriv.spectra1st deriv.1st deriv.spectra
Region (cm−1)1800–8456800–6550
5150–4000
1735–2201800–8456800–6550
5150–4000
1555–380
Number of factors 110557128
R2cal0.9940.9940.9810.9080.9960.984
R2cv0.9100.9700.9010.3700.8040.599
RMSEcal0.2690.2750.4852.980.6121.24
RMSEcv1.080.6081.118.504.666.61
1 According to predicted residual error sum of squares (PRESS) diagnosis.
Publisher’s Note: MDPI stays neutral with regard to jurisdictional claims in published maps and institutional affiliations.

