1. Introduction
Prestressed concrete beams are widely used for constructing large load-bearing structures and bridging long spans. The prestressing force on the concrete is transferred via shear stresses over a certain length referred to as the transmission length. The Hoyer effect, due to the dilation of the strands after release, contributes to the transfer of the prestressing force. Splitting forces due to the local introduction of prestressing forces in the end zones occur, resulting in a complex three dimensional stress field. Splitting, spalling, and bursting cracks can occur in the end zones, which are undesirable. Modelling the end zones of a pretensioned girder creates challenges when applying analytical formulae [
1,
2,
3] or strut-and-tie models [
4,
5,
6,
7,
8] in particular when the 3D behavior is considered. In this situation, finite element modelling (FEM) becomes beneficial, because it can manage these complexities more effectively. FEM has also been used by other researchers to study the stress distribution in end zones.
Kannel et al. [
9] model a pretensioned beam considering the strands as truss elements. In this application, the radial expansion due to the Poisson effect is not taken into account. As a result, the model is developed as a linear elastic model, such that the actual nonlinear behavior of the interface between the strands and the surrounding concrete is not accurately simulated. Ayoub and Filippou [
10] define the pretensioning process in two stages: (1) the tendon tensioning at time t
0 and (2) the transfer of prestress to concrete at time t
1. As a result, the accuracy of the model increases. In their model, local friction between the prestress element and the concrete is introduced. The disadvantage of this approach is that it neglects the concrete tensile strength at the interface between the two materials. The elastic loss in prestressing force is also neglected. Arab et al. [
11] examine the stresses along a strand using a simple model with a seven-wire strand in the center of the beam. Two models are developed. In the first one, the strand is modelled as a linear element embedded in concrete. In the second one, the strand consists of a solid cylinder with an eight seed meshing. The friction is defined as a surface-to-surface contact, and the behavior in the normal direction is defined as hard contact. To increase the accuracy of the calculation, the augmented Lagrange multiplier and finite sliding are used. For the friction coefficient, values of 0.70 to 1.40 are taken into account. Oliva and Okumus [
12] and Okumus et al. [
13] designed a 3D non-linear FEM model to study end zones. The Concrete Damaged Plasticity (CDP) model is applied to account for the non-linear concrete properties. The compression behavior is defined according to the guidelines of both the fib Model Code 2010 [
14] and AASHTO LRFD Bridge Design Specifications [
15] while the tensile behavior is solely defined by the fib Model Code 2010. The model does not contain strands. Instead, the prestress is modelled by leaving gaps at the strand locations and applying tangential forces on the gap’s inner surface. Although the Hoyer effect is not included in this model the results are in strong agreement with experimental data. Ronanki et al. [
16] built further on this approach, focusing on BT-78 girders, and proposed recommendations for strand debonding and strand draping. Finally, Kizilarslan et al. [
17] also use this approach to study the effects of debonding in 72 W Wisconsin bulb-tee girders, and propose a simplified approach for Y-crack tensile strains although the correlation is limited.
Abdelatif et al. [
18] study the prestress force combining three adaptations to the previously mentioned works. (1) The strands are modelled such that they exhibit radial deformations due to the Hoyer effect. Since these deformations produce large radial stresses, it is beneficial to implement them into the model. The circumferential stresses due to the Hoyer effect can quickly exceed the tensile strength of concrete at the end zones. (2) The CDP model has been applied, allowing for nonlinear concrete behavior. (3) The strands are modelled as cylindrical elements. These three factors which ensure the transfer of the prestress to the concrete cover a combination of adhesion between the steel and the concrete, mechanical resistance, and friction between the two elements. Although limited to simple geometries, the authors’ method is very promising. Yapar et al. [
19] examine the behavior of a beam under load. A pretensioned I-beam is modelled and subjected to a four-point bending test. The authors use a similar interaction as Abdelatif et al. However, the strands in the model are simplified to rectangular cross-sections. This method of modelling affects the stresses and the transmission lengths such that the model becomes irrelevant. Steensels et al. [
20] propose a new method of designing anchorage zones. Essentially, the strands are modelled in greater detail in terms of interaction between these elements and the concrete, with a focus on the pitch and lack-of-fit effects of the strands. However, since these two effects do not significantly impact the results, they may be neglected. Van Meirvenne et al. [
21] elaborated further on the concept of Abdelatif et al. and verified their 3D non-linear friction-based model by comparison with mechanical strain measurements on a full-scale girder with two different types of end blocks. At the same time, a parametric study was executed to examine the sensitivity of various input parameters. The results indicated that an accurate determination of the concrete properties at the time of release is very important, and that the Hoyer effect influences the force transfer of adjacent strands, an effect not considered by Steensels et al.
In this paper, the verified 3D nonlinear friction based finite element model is confronted with strain measurements on a full-scale girder in a precast plant during normal production. This girder was instrumented with eight strain gauges every 20 cm on three different strands, aiming at the verification of the shear stress transfer model. Furthermore, strain gauges were also attached on vertical reinforcement bars in the end zone, aiming at the verification of the effectiveness of the rebar in countering the splitting tensile forces. Finally, also DEMEC mechanical strain gauge measurements were carried out on the end block’s lateral faces, for verification of the prestress build-up in the concrete. In addition, the paper focusses on the circumference vs area incompatibility when modelling multi wire strands as cylinders, and the influence of early age tensile strength. In contrast to the works of Oliva and Okumus [
12], Okumus et al. [
13], Ronanki et al. [
16], Kizilarslan et al. [
17] where the model does not contain strands, and the prestress is modelled by leaving gaps at the strand locations and applying tangential forces on the gap’s inner surface the prestress, this paper numerically introduces the prestress based on a radial expansion and friction based technique. This technique was first introduced by Abdelatif et al. [
18]. for simple geometries without experimental verification, and further developed by the authors. It avoids the difficult assessment of the transfer length and the arbitrary choice of a transfer function for the tangential forces. Only a friction coefficient remains as variable parameter, and its assessment, based on a comparison of nonlinear 3D FEM results with measurements on a full-scale beam is the primary subject of this paper.
3. Numerical Model
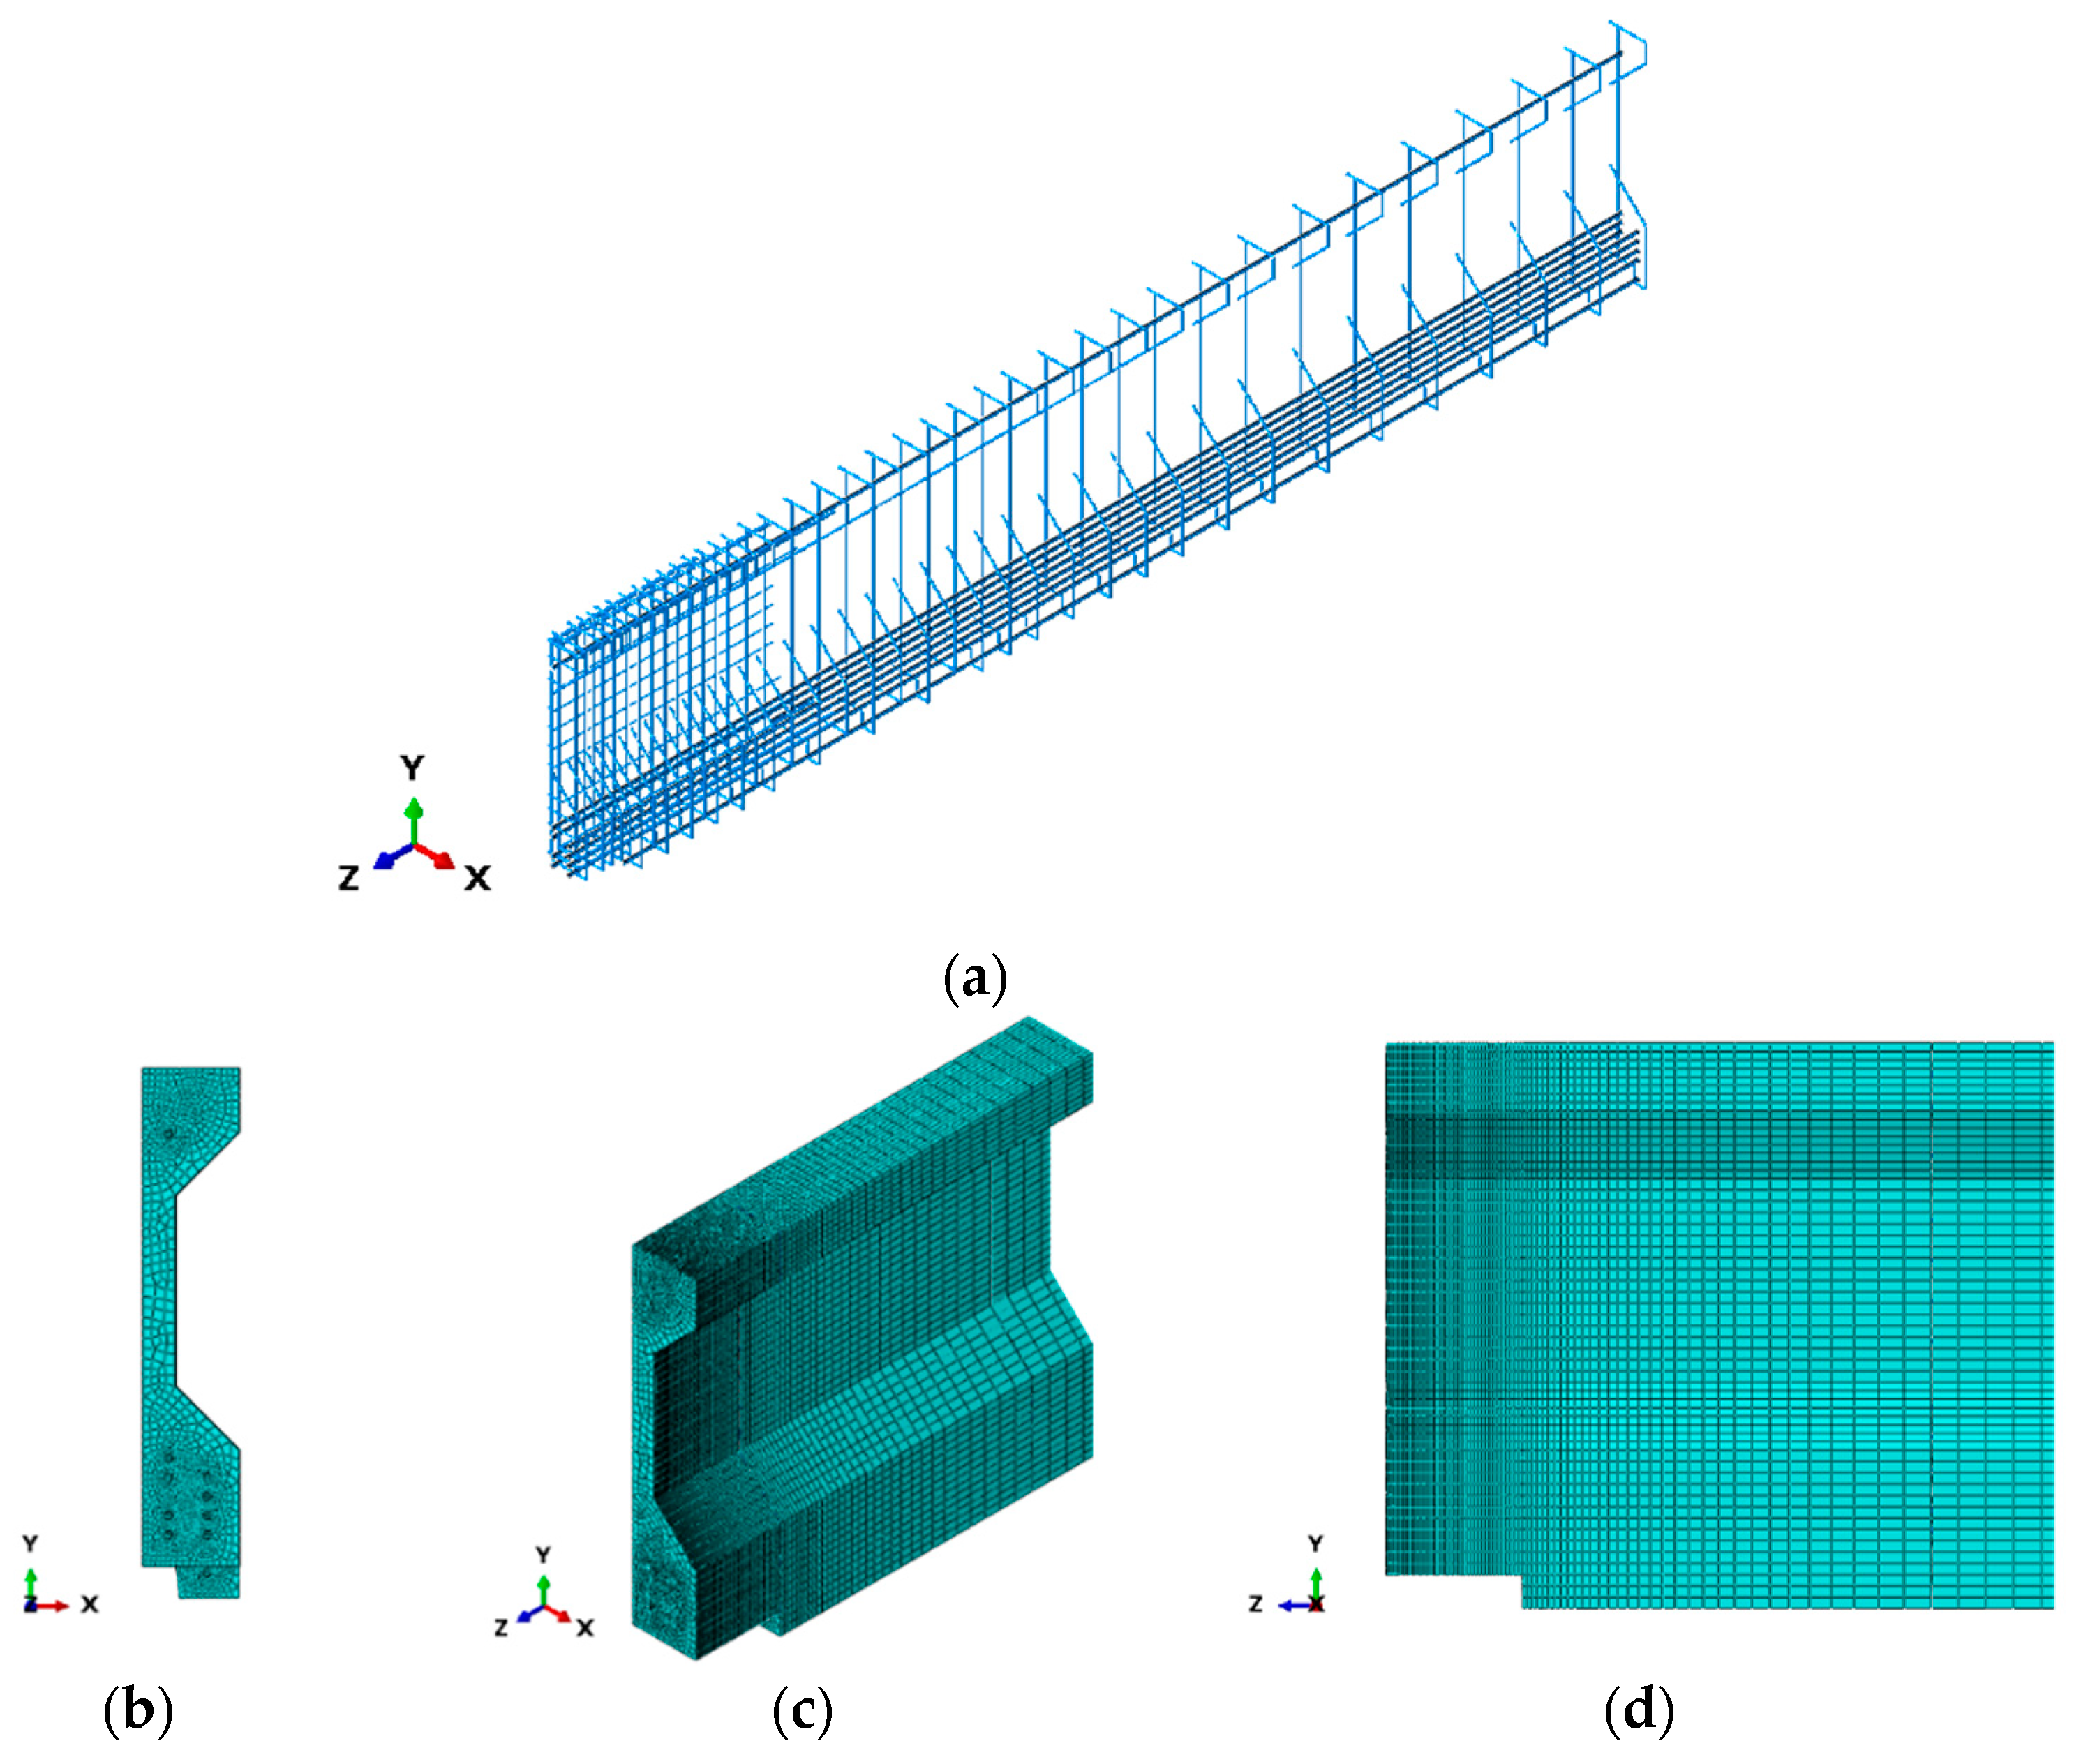
The girder from
Figure 1 is modelled and examined using the Abaqus FE software. Similar to the procedure described in Van Meirvenne et al. [
21] only one quarter of the girder is modelled and adequate symmetry and boundary conditions are added (See
Figure 3). Detailed information about the concrete damaged plasticity model (CDP) as used in pretensioned beams, can be found in Van Meirvenne et al. [
21].
In a first step to create the geometric model in Abaqus, the geometry of the girder was implemented as mentioned in
Section 2. It should be noted that at the precast plant, the positions of the vertical rebars were measured to make sure that the actual geometry is used in the FE model. At the positions of the strands, gaps are provided in the concrete girder, where in the assembly module the strands will be positioned as solid elements.
An addition to the work of Van Meirvenne et al. [
21] is the use of hollow strand elements. In the FEM model presented in this paper, the seven-wire strands are simplified as a hollow, cylindrical element. This allows both the strand area (139 mm
2) as well as the outer diameter (15.24 mm) to be correctly implemented in the model. This avoids choosing either a correct area representation, and as such a correct longitudinal stress representation, or a correct outer surface representation, and as such a correct representation of the friction surface. When using the hollow strand element, the friction surface will be larger and smaller friction coefficients will be in agreement with the experimental results, compared to previous work, e.g., Abdelatif et al. [
18] and Van Meirvenne et al. [
21]. Finally, the small but not negligible area reduction due to the 8 seed meshing is also taken into account by means of the adaptation of the diameter of the inner circle around the hollow part. The reinforcement bars are embedded in the concrete as beam elements and the cross-sectional area of each rebar is defined in the software.
In general, the mesh is chosen so that the computation time is not too high. Since cracks might predominantly occur at the end zones, a finer mesh is applied there. Hexahedron elements are used to increase the accuracy and automatic mesh generation is avoided. For the specific mesh generation, reference is made to Van Meirvenne et al. [
21].
The interaction between the strands and the surrounding concrete is defined as a surface-to-surface contact. As only a small slip occurs in the interface between the two surfaces, the “small sliding” option is used. Different values are used for the Coulomb friction coefficient, ranging from 0.5 to 0.9 in increments of 0.2. A hard contact has been defined, and Augmented Lagrange is used as the solver. This method uses the same approach to stiffness along the strand as the Penalty Method but allows more iterations to improve accuracy. In the tangential direction, the Penalty Method is used. The advantage is that elastic slip is also taken into account.
In the initial step, the prestress is applied to the strands, using the predefined field function. The problem is then solved through a static analysis (Static, General), in which the prestress is applied in two stages (Initial and Step 1), see Abaqus Manual [
22]. In terms of the solution method, the direct solver is applied. Compared to the iterative solver, the direct solver requires more computation time but is preferable when addressing non-linear problems. Full Newton is used as the solving technique.
5. Concrete Sampling and Relation to the FE Material Model
In Van Meirvenne et al. [
21] it was demonstrated that the concrete material properties at the moment of release are important for the outcome of the finite element models. Therefore, additional attention is paid to these properties during the full-scale experimental test. Several concrete compressive and tensile tests were carried out. For this purpose, a total of 12 cubes of 150 × 150 × 150 mm
3 were cast. Three test specimens were preserved in the area next to the girder, whereas the other test specimens were stored under water at a temperature of 20 °C.
Six compressive tests were carried out at 7 days, three at 14 days and three tests at 28 days. For each series of cubes, an average is calculated (f
ccubm), and the concrete compressive cylinder strength (f
cm) is calculated as f
cm = 0.79 f
ccubm [
14] The results of these compression tests are summarized in
Table 2. In the FE material model, the grey colored values will be used. This because, the compressive strength at time of the release (7 days) determined on cubes preserved next to the girder seems to be the most reliable value. In addition, a second material model is developed where the value obtained from the cube tests at 28 days is used, as is done most frequently in practice.
Furthermore, the flexural and splitting tensile strengths are measured on several test specimens. The flexural tests are conducted according to EN12390-5 [
23] and for the tensile splitting tests the EN12390-6 standard is used [
24]. Fourteen prisms of 150 mm × 150 mm × 600 mm are cast, of which eight were tested at the time of release (7 days), three at 14 days and three at 28 days. The flexural strength is measured by conducting a three-point bending test.
From this test, the flexural strength [N/mm
2] can then be calculated from:
with
Fmax the maximum load (N),
l the distance between the hinge supports (mm),
b the width of the prism [mm] and
h the height of the prism (mm).
According to EN 1992-1-1 [
25] the relation between the flexural tensile strength from a three point bending test and the axial tensile strength can be written as:
Subsequently, the two remaining halves of the prism were used to perform the tensile splitting tests according to EN12390-6 [
24].
The splitting strength of a prismatic specimen can be calculated using the formula:
with
Fmax the maximum load (N) and
d and
l the dimensions of the fracture cross-section (mm).
The axial tensile strength can then be calculated by using EN 1992-1-1 (2005):
On overview of the test results and the converted values for the axial tensile strength are shown in
Table 3.
For the development of the FE material model the grey indicated values in
Table 2 and
Table 3 are used. Regarding the converted tensile strength it is unclear whether the flexural or splitting tensile test results should be used. This leads to a MIN and a MAX material model.
6. Comparison of Experimental and FE Based Strain Values
Six different FE models have been run. As mentioned in the previous paragraph, two material models (MIN and MAX tensile strength) are applied, and for each material model three different coefficients of friction are used, namely 0.5, 0.7 and 0.9, leading to a total of six FEM models. In this section, the results of every FE model are compared with the experimental results.
6.1. Demec Mechanical Strain Gauge Measurements on the Concrete Surface
The comparison between the six FE models and the experimental results from the mechanical strain gauges mentioned in
Section 4.3 are shown in
Figure 10 for the measurements at 200 mm from the bottom and in
Figure 11 for these at 245 mm from the bottom of the girder. Due to convergence issues, the FE results MAX–0.9 are omitted from
Figure 10 and
Figure 11. It is clear that there is a good fit between the experimental and numerical results of the horizontal strain in the end zone, more specifically for the FE models with a coefficient of friction of 0.7. In the transmission zone (i.e., the ascending branch), the differences are limited, while beyond the transfer length, a larger scatter of the DEMEC measurements is noticeable. The fact that on average 10 to 15% larger strains than predicted are found in the horizontal branch (i.e., beyond the transmission zone) can be attributed to an incorrect value of the concrete stiffness used in the FEA. This results from the strict relation between concrete stiffness and strength as implemented in all codes and normative documents, which does not allow a numerical adjustment of the modulus of elasticity only. An analysis with only an adjustment of the concrete stiffness (modulus of elasticity −10% to +10% of coded value simulated) was performed in Van Meirvenne et al. [
21], indicating that the simulated horizontal strains on the concrete surface are practically a linear function of the modulus of elasticity. Should a smaller modulus of elasticity have been adopted in the analyses shown in
Figure 10 and
Figure 11, the FEA curves would have been shifted slightly to larger strain values, and a coefficient of friction of 0.5 to 0.7 can be proposed.
From the FE results it may also be observed that the transmission length is smaller with a higher coefficient of friction and higher early age compressive and tensile strengths, which is in agreement with earlier findings from Van Meirvenne et al. [
21].
6.2. Strain Measurements on the Rebars
As already mentioned in
Section 4.2, several strain gauges were attached on vertical rebars in the end zone. In order to render the results in a clear way, the strain gauges are labelled as shown in
Figure 12 (see also
Table 1), which also shows the calculated axial stresses (in a local coordinate system) in the rebars.
During the release process of the strands, the strain gauges are measured. These strains are multiplied with the modulus of elasticity of steel (E = 200,000 N/mm
2) to obtain the stresses. The results of the stresses at different positions during the release process are shown in
Figure 13. It should be noted that gauges A3 and A4 did not show a reliable output and are not shown on the graphs.
Figure 13 demonstrates that although the release procedure is gradual, sudden data peaks can occur, possibly due to a release of friction forces along the pretensioning bed. In addition, the stress buildup does not follow the same path for different locations along a single rebar. Analyzing the results, it is difficult to pick just one instantaneous value. Therefore, a mean value of the last three min is taken.
In
Figure 14 the stresses along the rebars resulting from the FE models are plotted from the bottom to the top of the rebar. The results of the stresses in the rebars in the web are displayed, and those in the rebars in the bottom flange are shown in
Figure 15. pinpointed, as the measurements do not correspond to one coefficient value only.
In each of these figures two experimental values are indicated. The experimental results are generally located in the range of curves corresponding to a coefficient of friction between 0.5 and 0.9, but despite the level of accuracy in the measurements and calculations no exact coefficient of friction can be From the FE results it may also be observed that the influence of the values of early age compressive and tensile strengths is smaller than for the stress build-up in the strands (
Figure 10 and
Figure 11). Indeed, the Min-Max curves in
Figure 14 are almost identical, while they are not in
Figure 11 and certainly not in
Figure 10.
6.3. Strain Measurements on the Strands
The strains were measured on three strands as indicated in
Figure 7. In the diagrams, the strands are designated as A, B and C, whereas A stands for the left strand in the lower row (number 7 in
Figure 6), B for the right strand in the lower row (number 8 in
Figure 6), C for the right strand in the second row from the bottom (number 6 in
Figure 6).
In order to be able to compare the numerical prestress transfer with the experimental results, the measured strains are converted to stresses and subtracted from the initial stress (200 kN/139 mm
2 = 1439 MPa). At every strand, a total of eight strain gauges were attached every 200 mm. The pretensioned girder is produced by first fabricating the reinforcement, then pulling the strands through the reinforcement cage and finally stressing the strands. Consequently, the strain gauges have to be attached when the reinforcement is already present. For this reason, it was difficult to install the strain gauges at the first point at 200 mm from the end face because of the lack of space between the end zone reinforcement and the strand. Unfortunately, the first strain gauges at 200 mm were not properly measured. The second strain gauge at strand A (400 mm) was also not easy to attach. When analyzing the results, probably this value is also not reliable, although it is included in the results (
Figure 16). Despite the unfortunate error in strain A and the inability to install gauges at 200 mm from the end face, the measurements confirm the position dependence of the stress build-up and the transmission length [
21].
Comparisons between numerical and experimental results are shown in
Figure 17. It can be observed that there is a good fit between the numerical and experimental results, especially after the transmission zone, the agreement between the measured and calculated values is much better than in
Figure 10, indicating that direct measurement on the strands provide a more reliable result compared to mechanical strain gauge measurements at the concrete surface.
Again, coefficients of friction between 0.5 and 0.9 can be recommended, with 0.7 as an acceptable value, although no exact value, giving a good fit with all measurements, can be pinpointed.
7. Conclusions
In this paper, a comparison between strain measurements and FE calculations, carried out on a full-scale girder in a precast plant during normal production, is presented. The girder was instrumented with strain gauges on three different strands and on vertical reinforcement bars in the end zone. Moreover, also DEMEC mechanical strain measurements were carried out on the end zones lateral faces. These experimental results are compared with 3D nonlinear FE models. In these models, the material properties were based on concrete specimens from the corresponding batch and stored next to the girder. When analyzing these results, a good fit between these experimental tests and the numerical results is noticed, proving the validity of the FE model.
The previously numerically encountered effect where prestress transfer is influenced by the location of the strands and whether the strand is surrounded by other strands is experimentally demonstrated.
From the test data, a friction coefficient of 0.5–0.9 can be recommended. However, it should be noted that compared to other relevant literature a different way of strand modelling, i.e., a hollow and not a solid cylinder, is used, and as a result the proposed coefficients should be interpreted in this way. The authors nevertheless believe that this way of modelling is more consistent with reality, and is preferable.
It can be concluded that the FE model is validated by experimental results and can further be used to optimize the reinforcement in the anchorage zones of pretensioned girders. This is an important step into the optimization of anchorage zones of pretensioned concrete members.


