Customer-Oriented Quality of Service Management Method for the Future Intent-Based Networking

 ,
,  ,
,
Abstract
:1. Introduction
2. Related Work
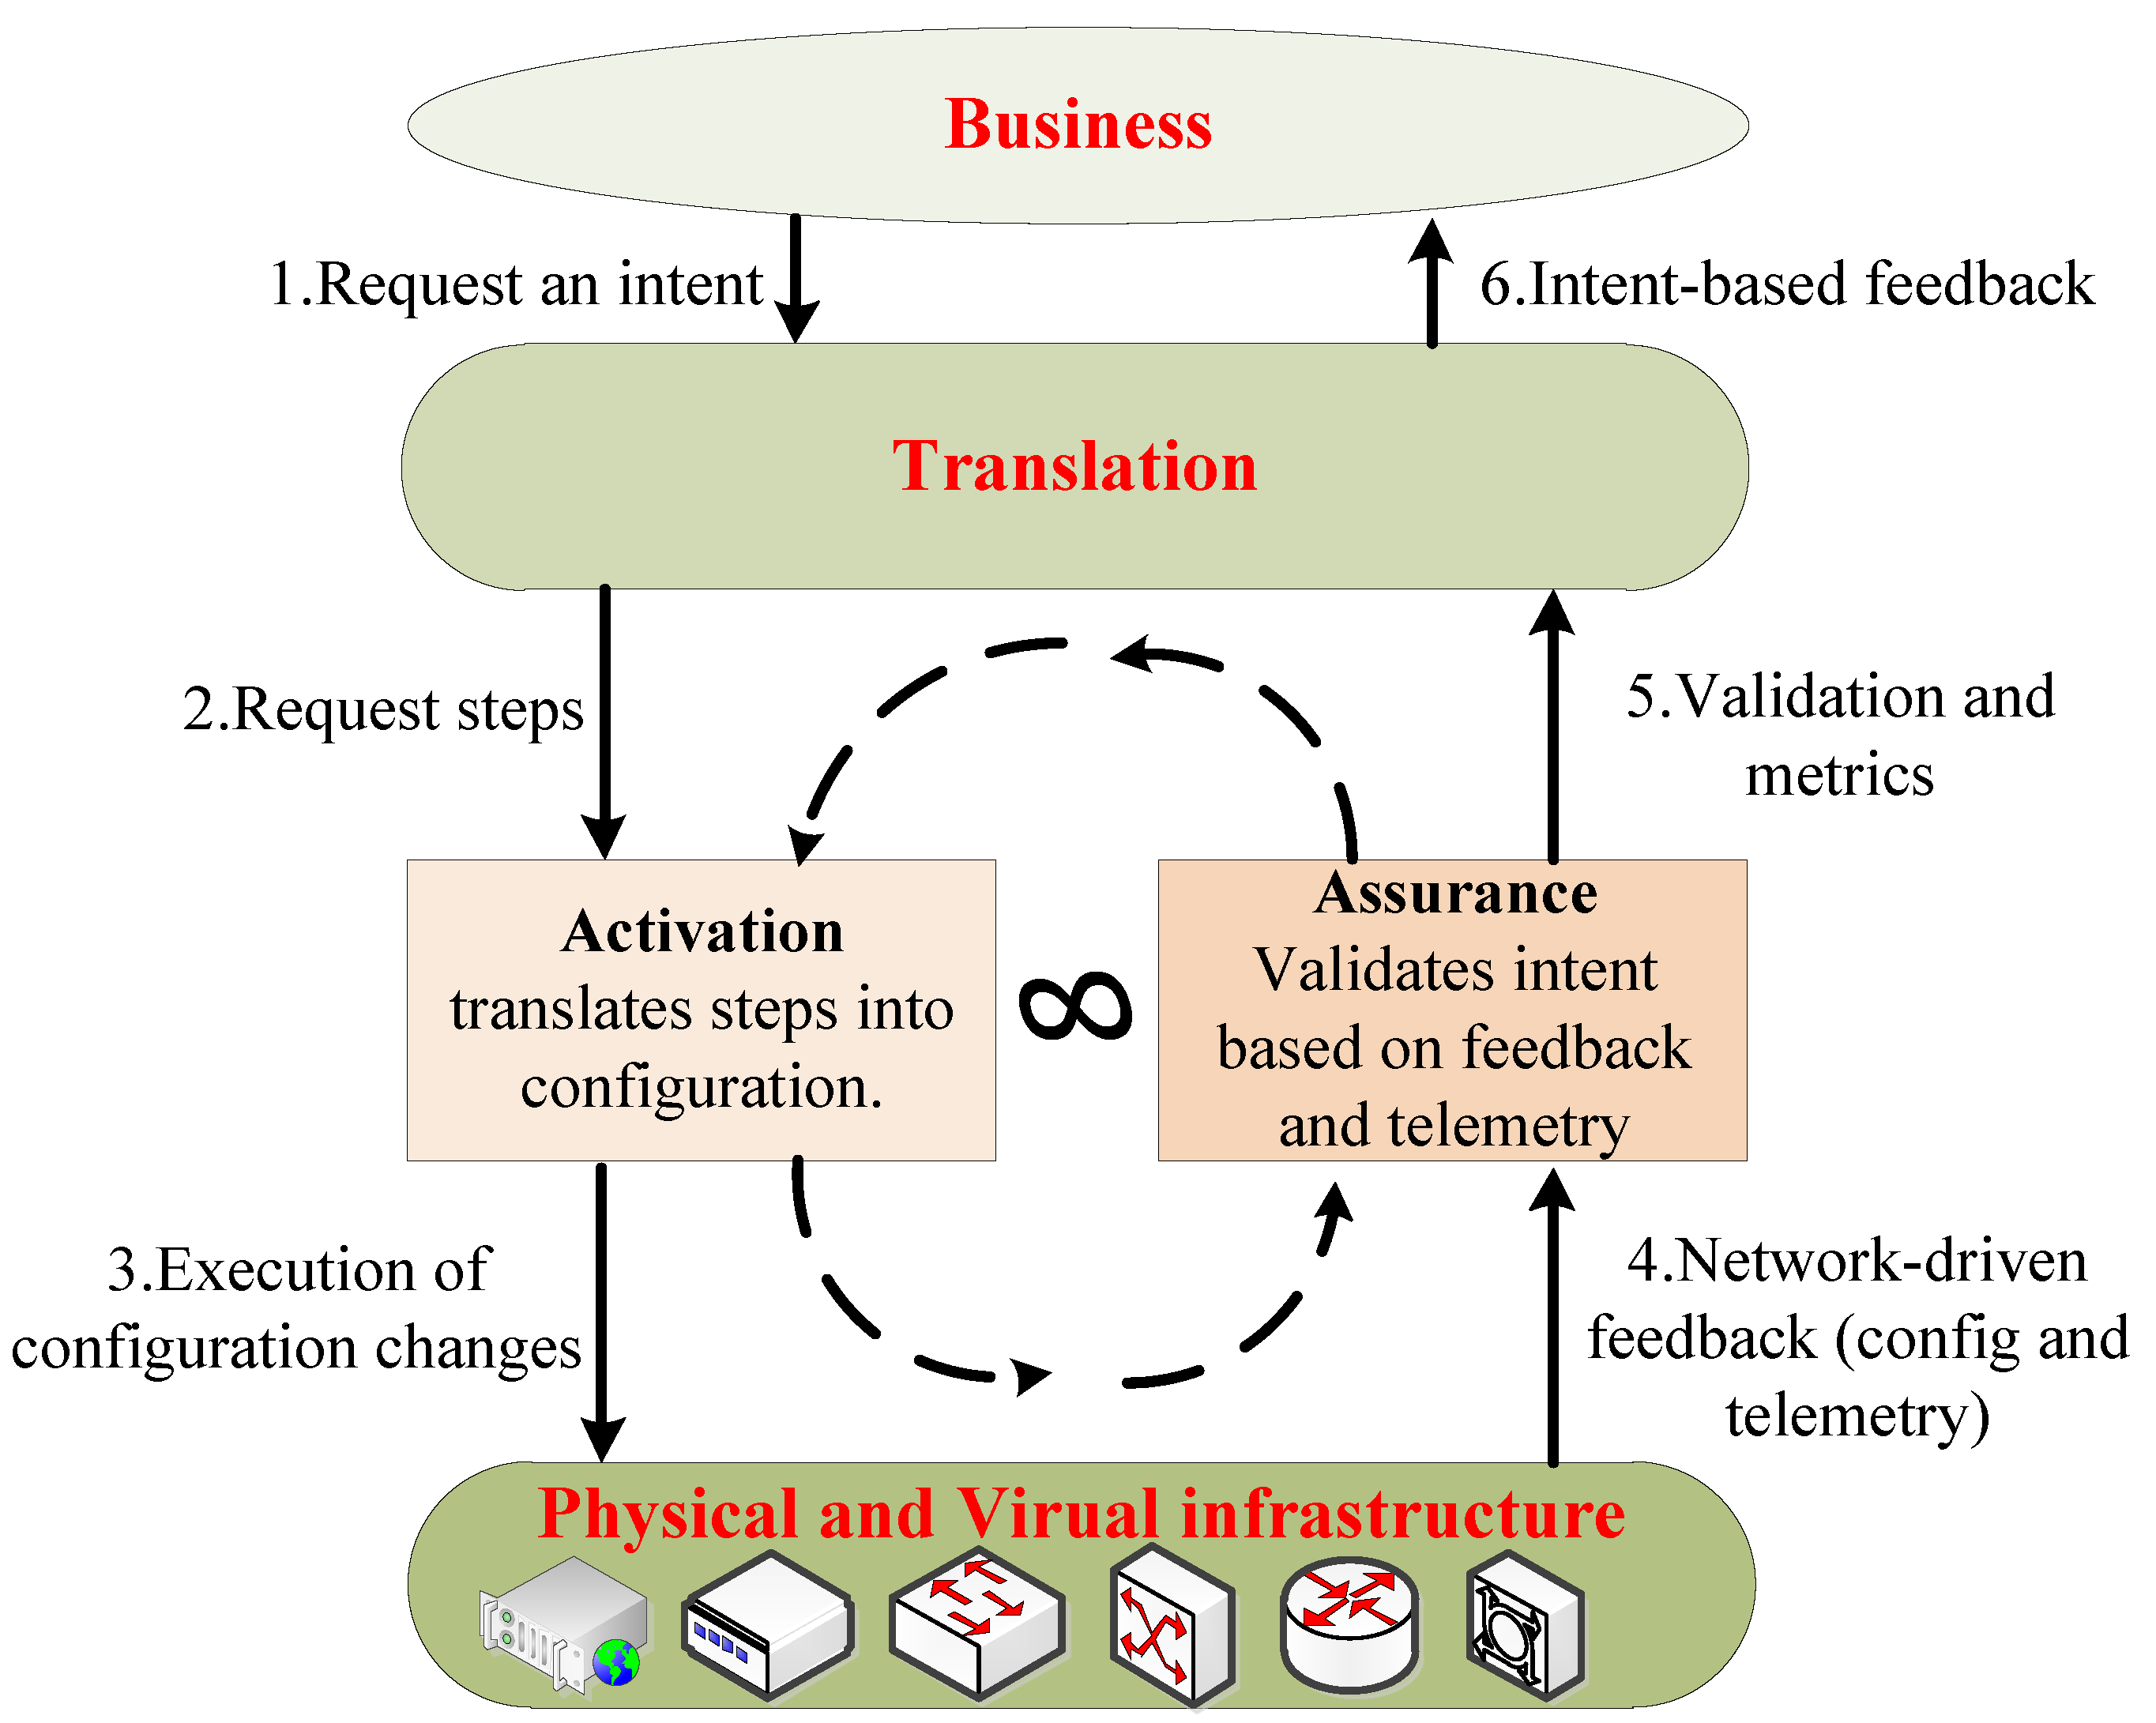
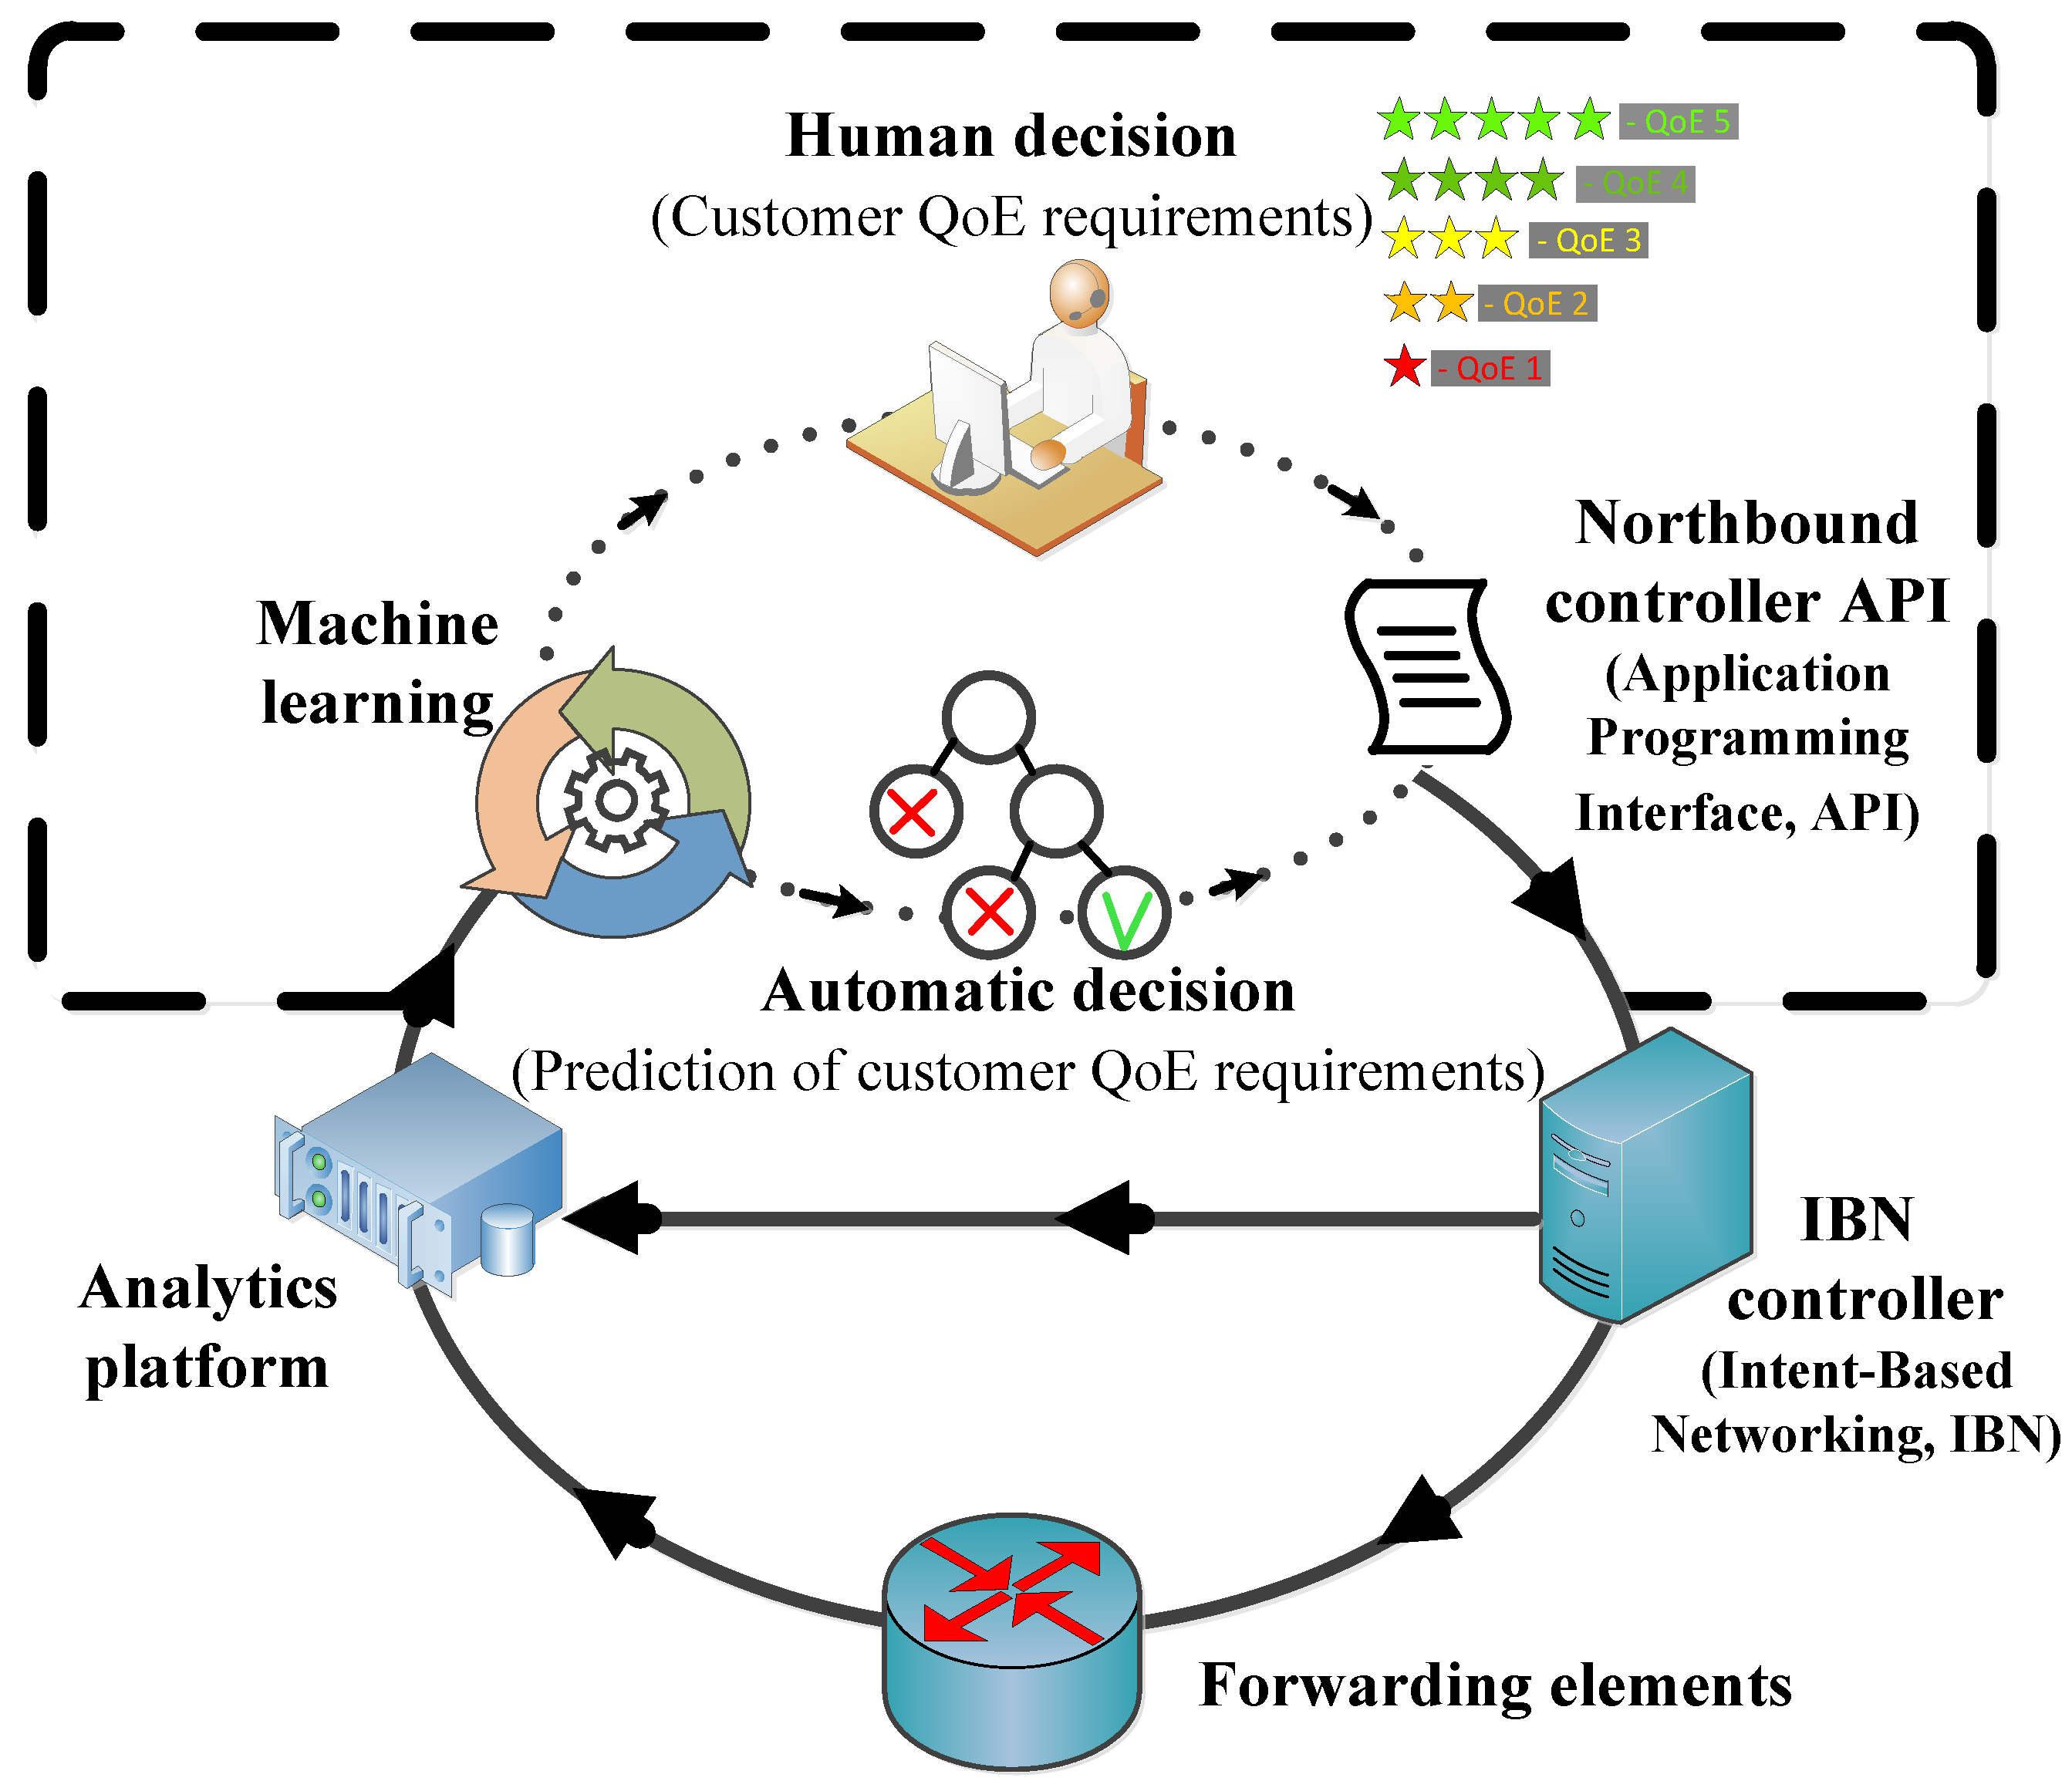
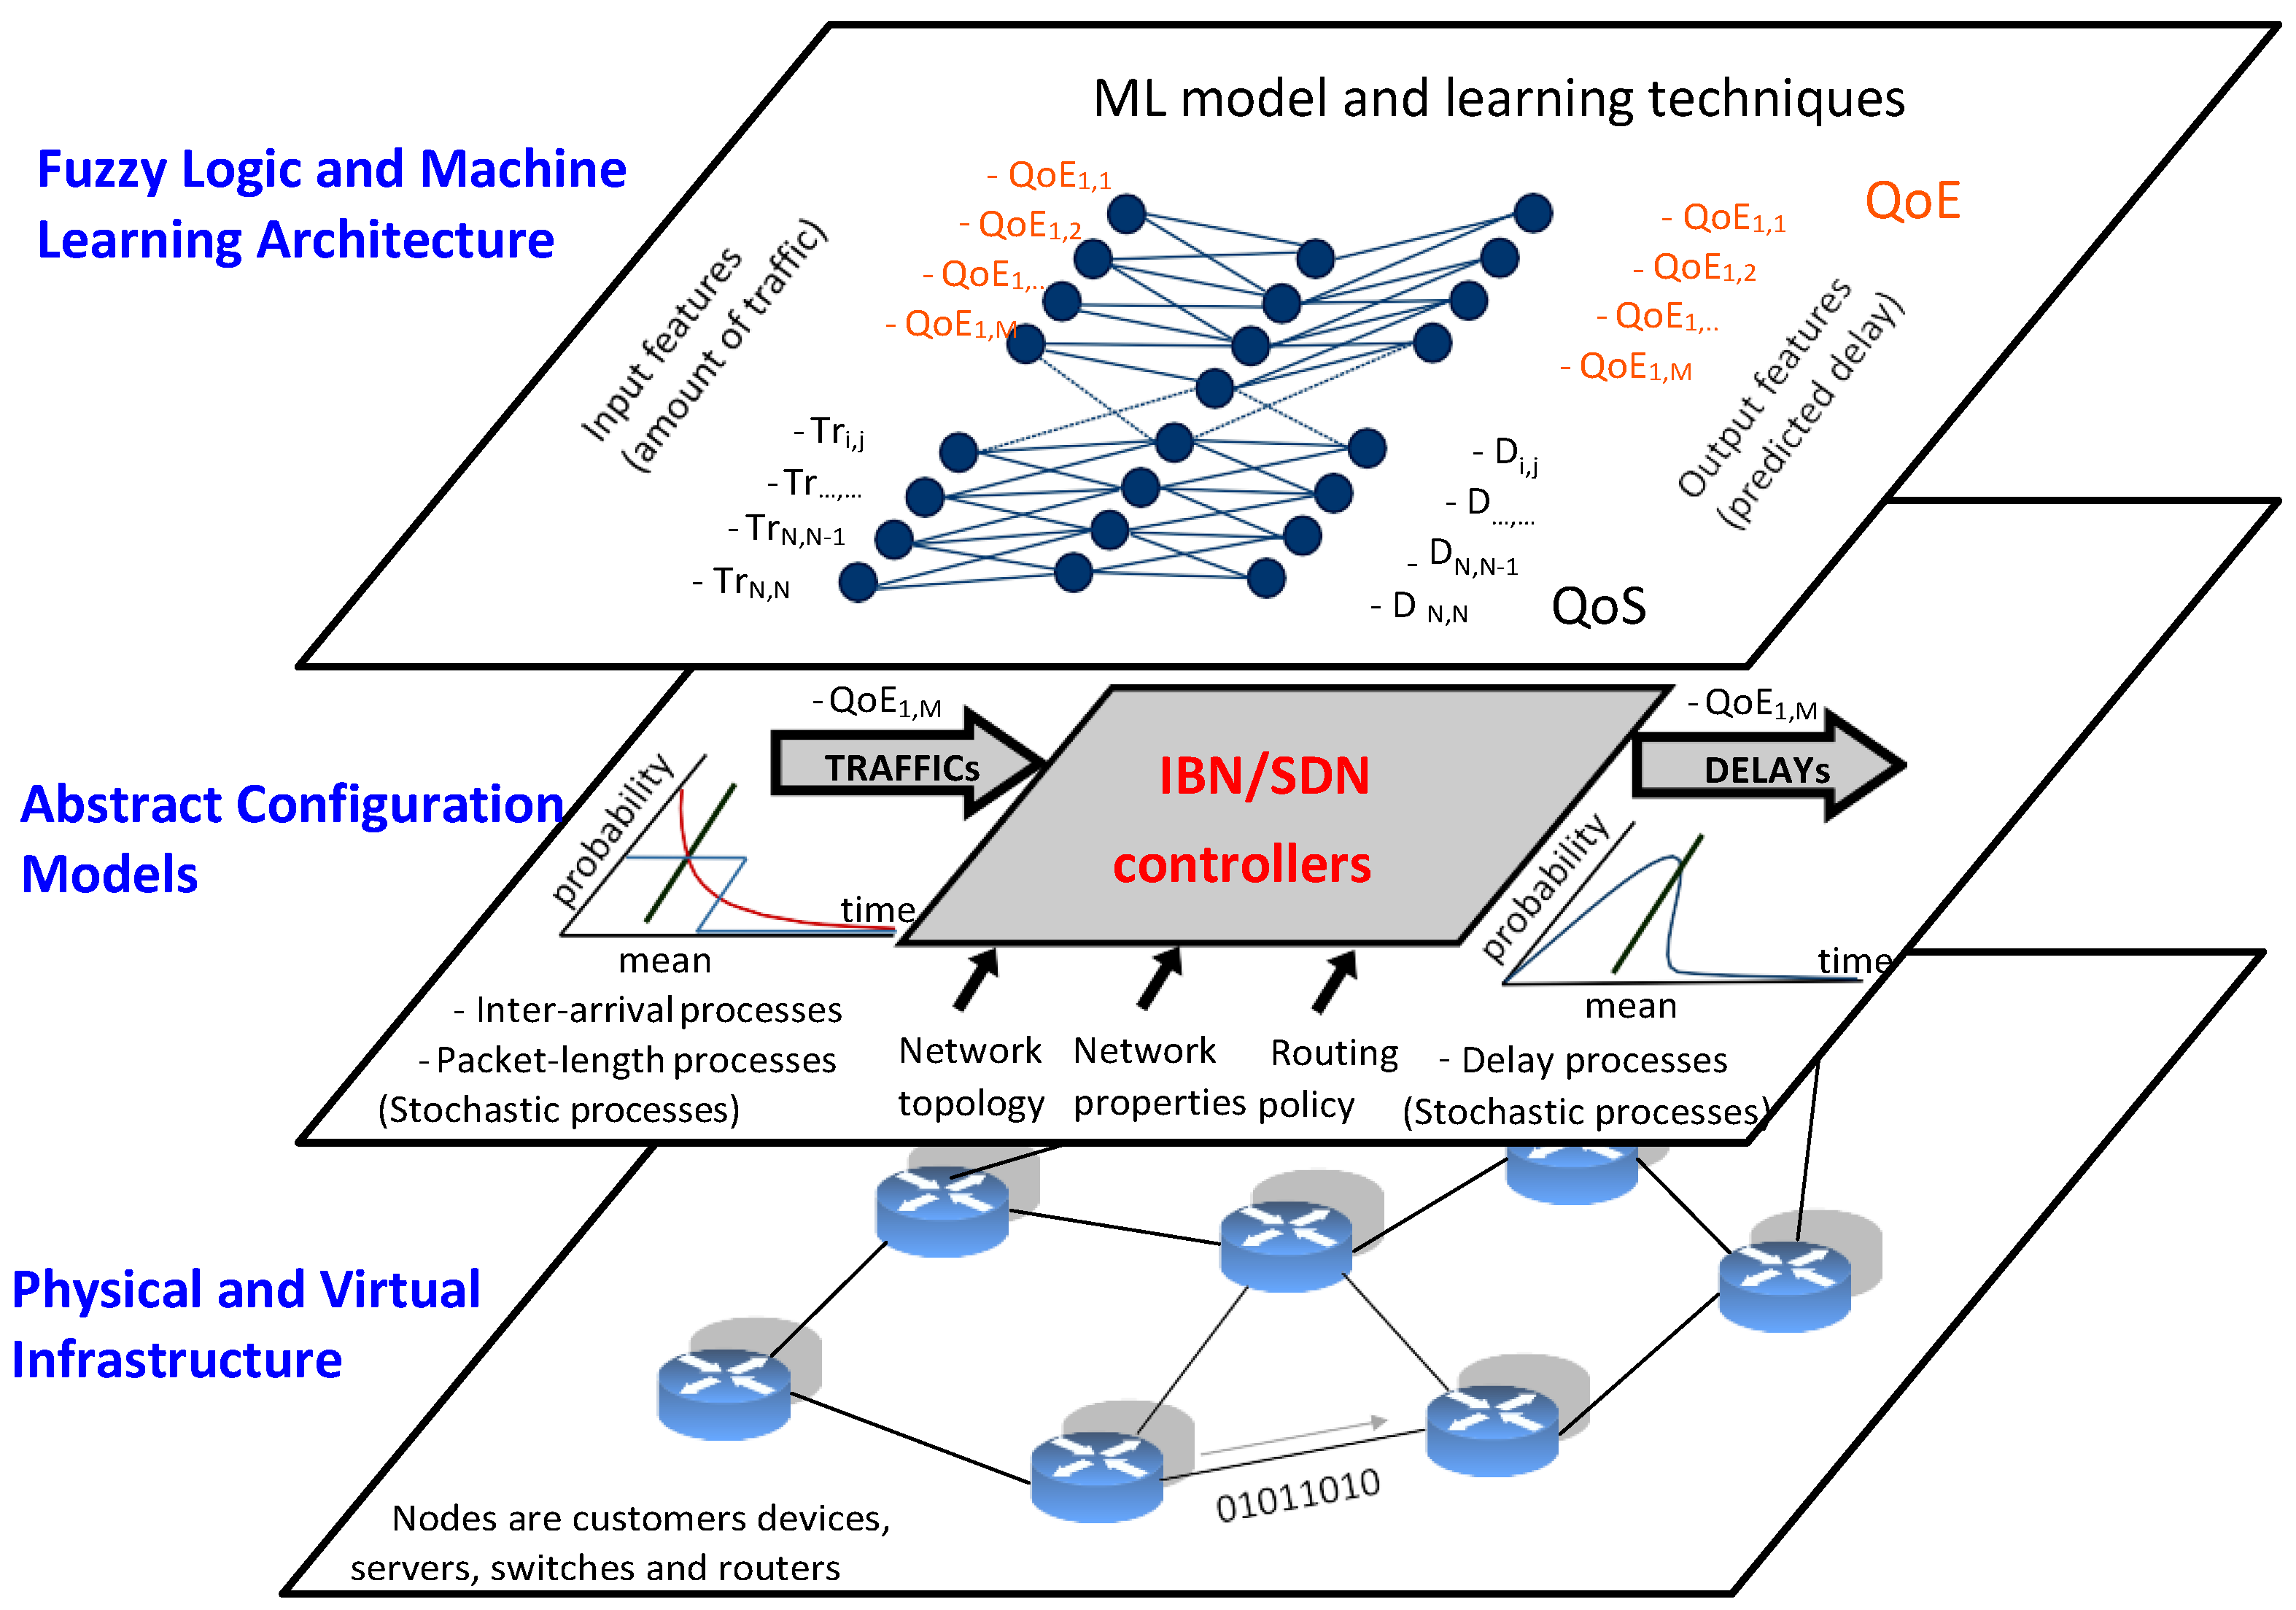
3. A Description of the Proposed Customer-Oriented Quality of Service Management Method for IBN
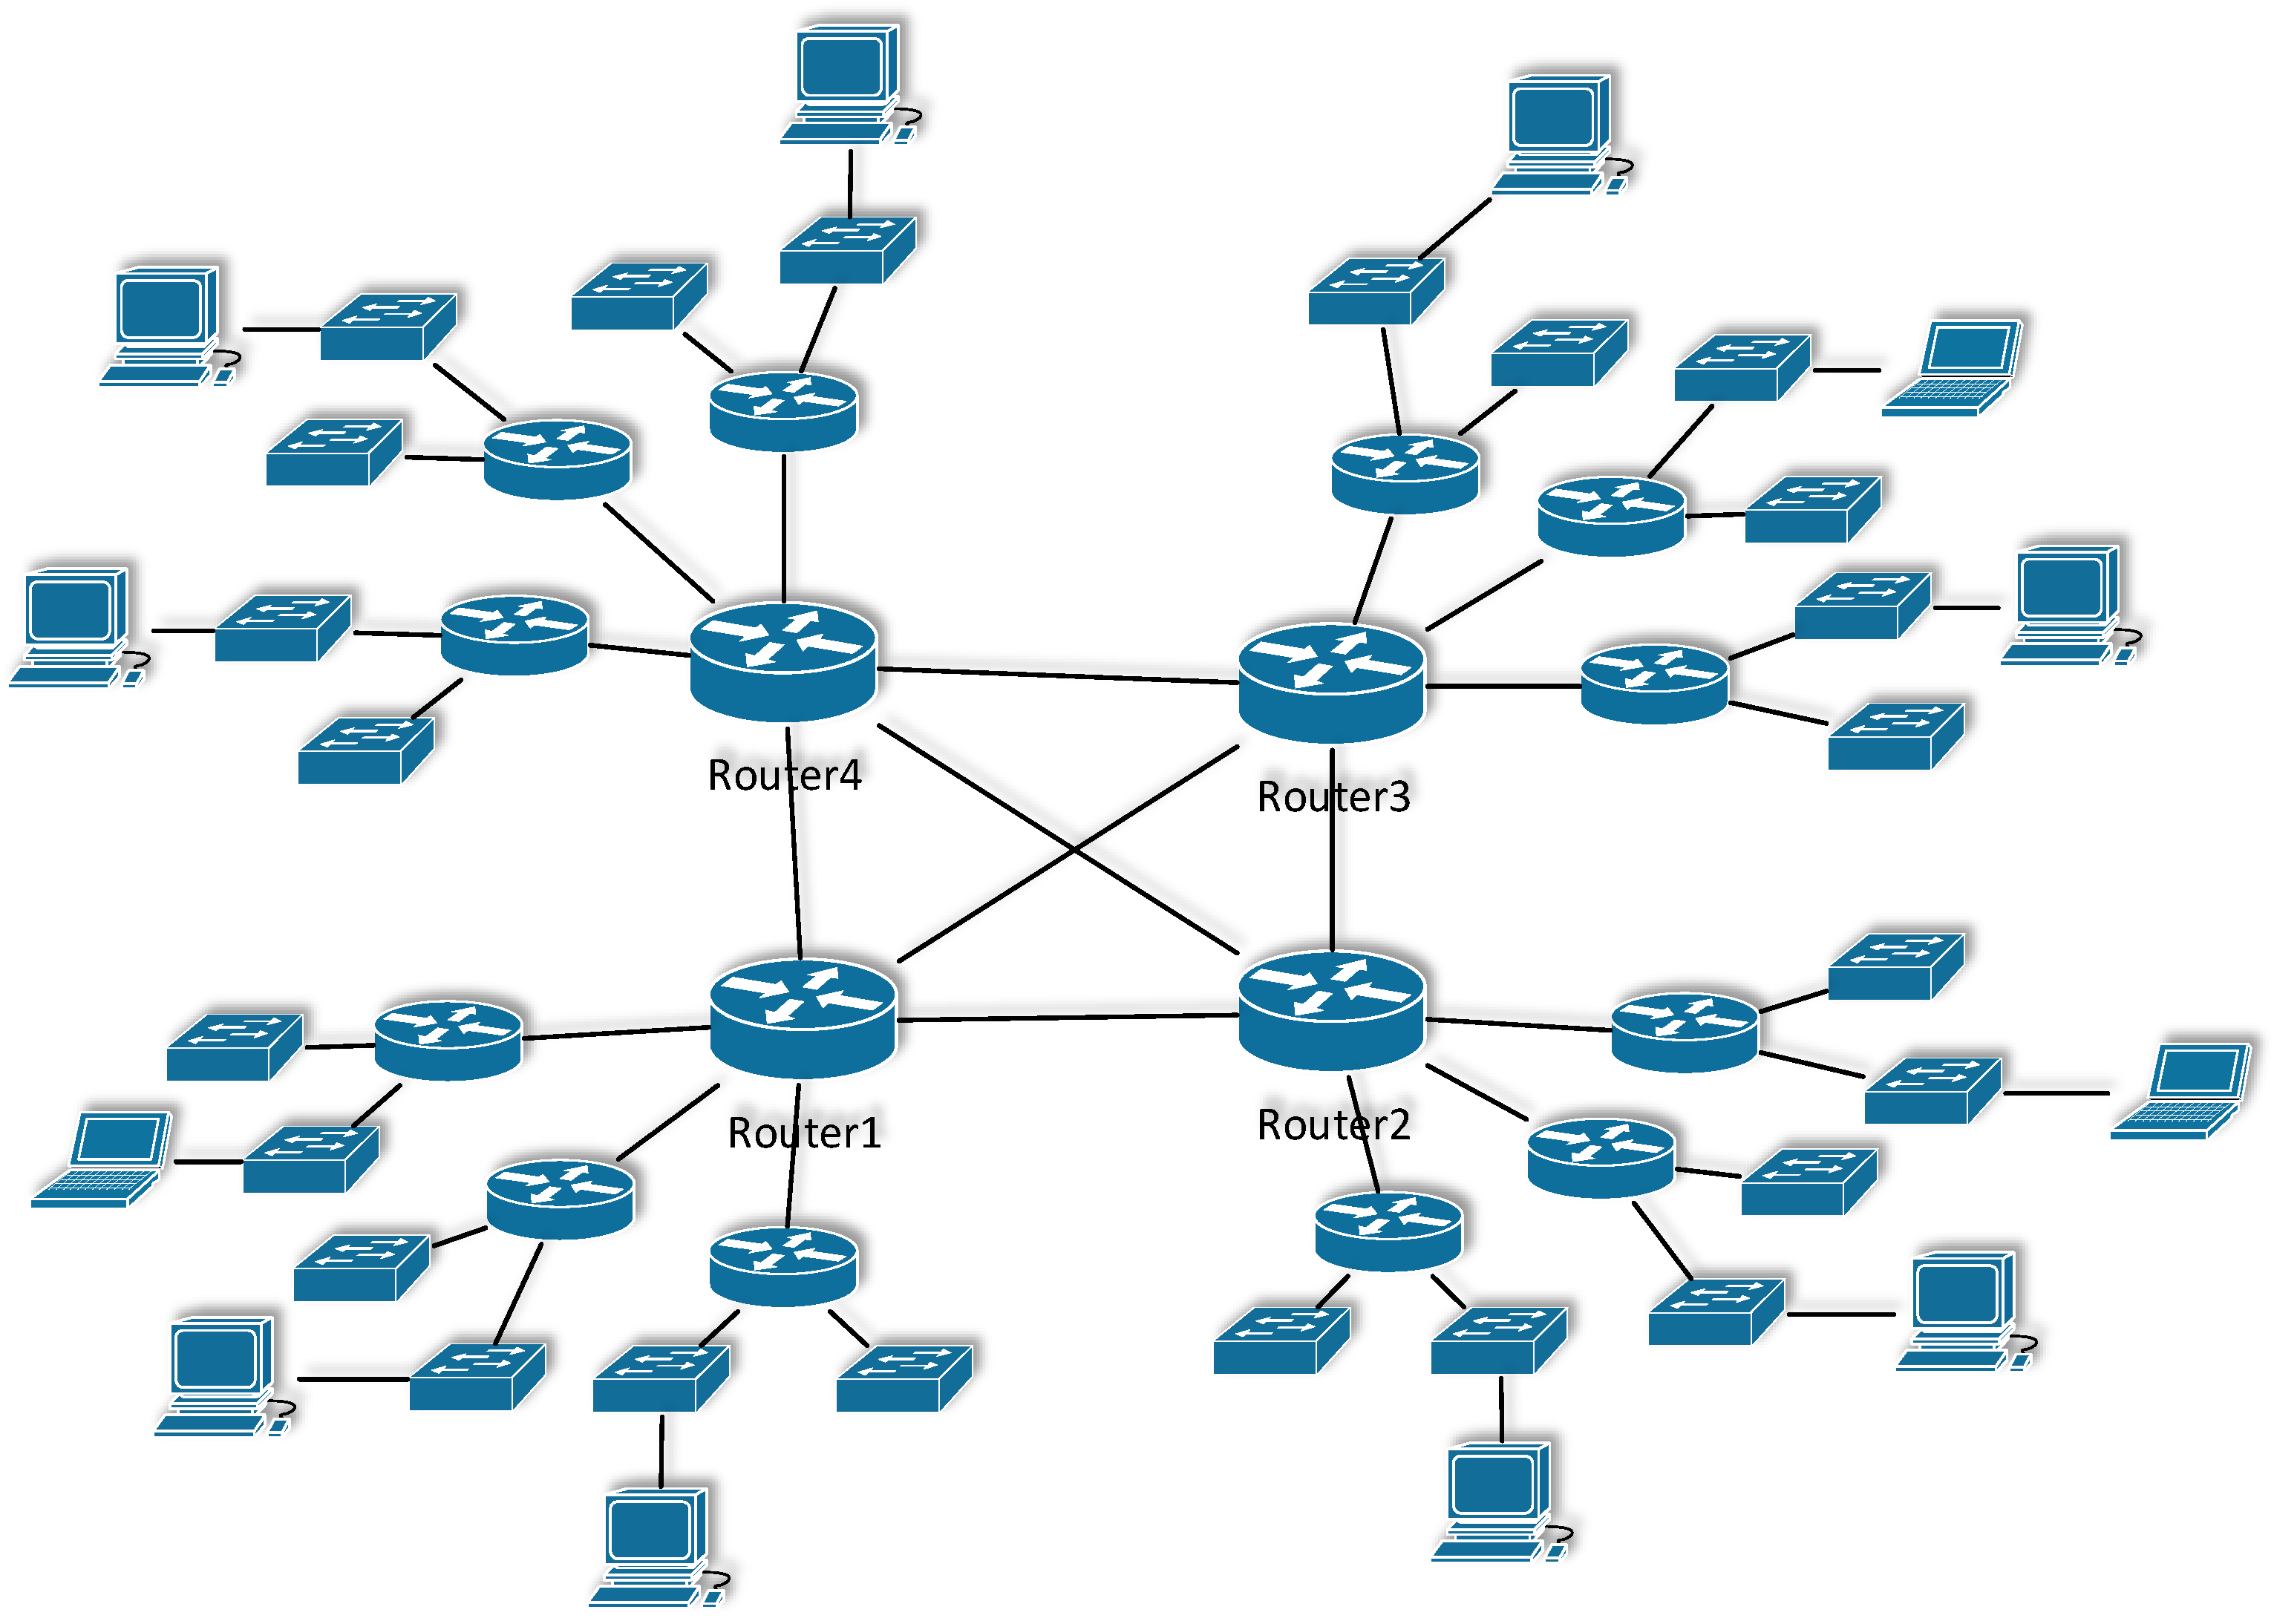
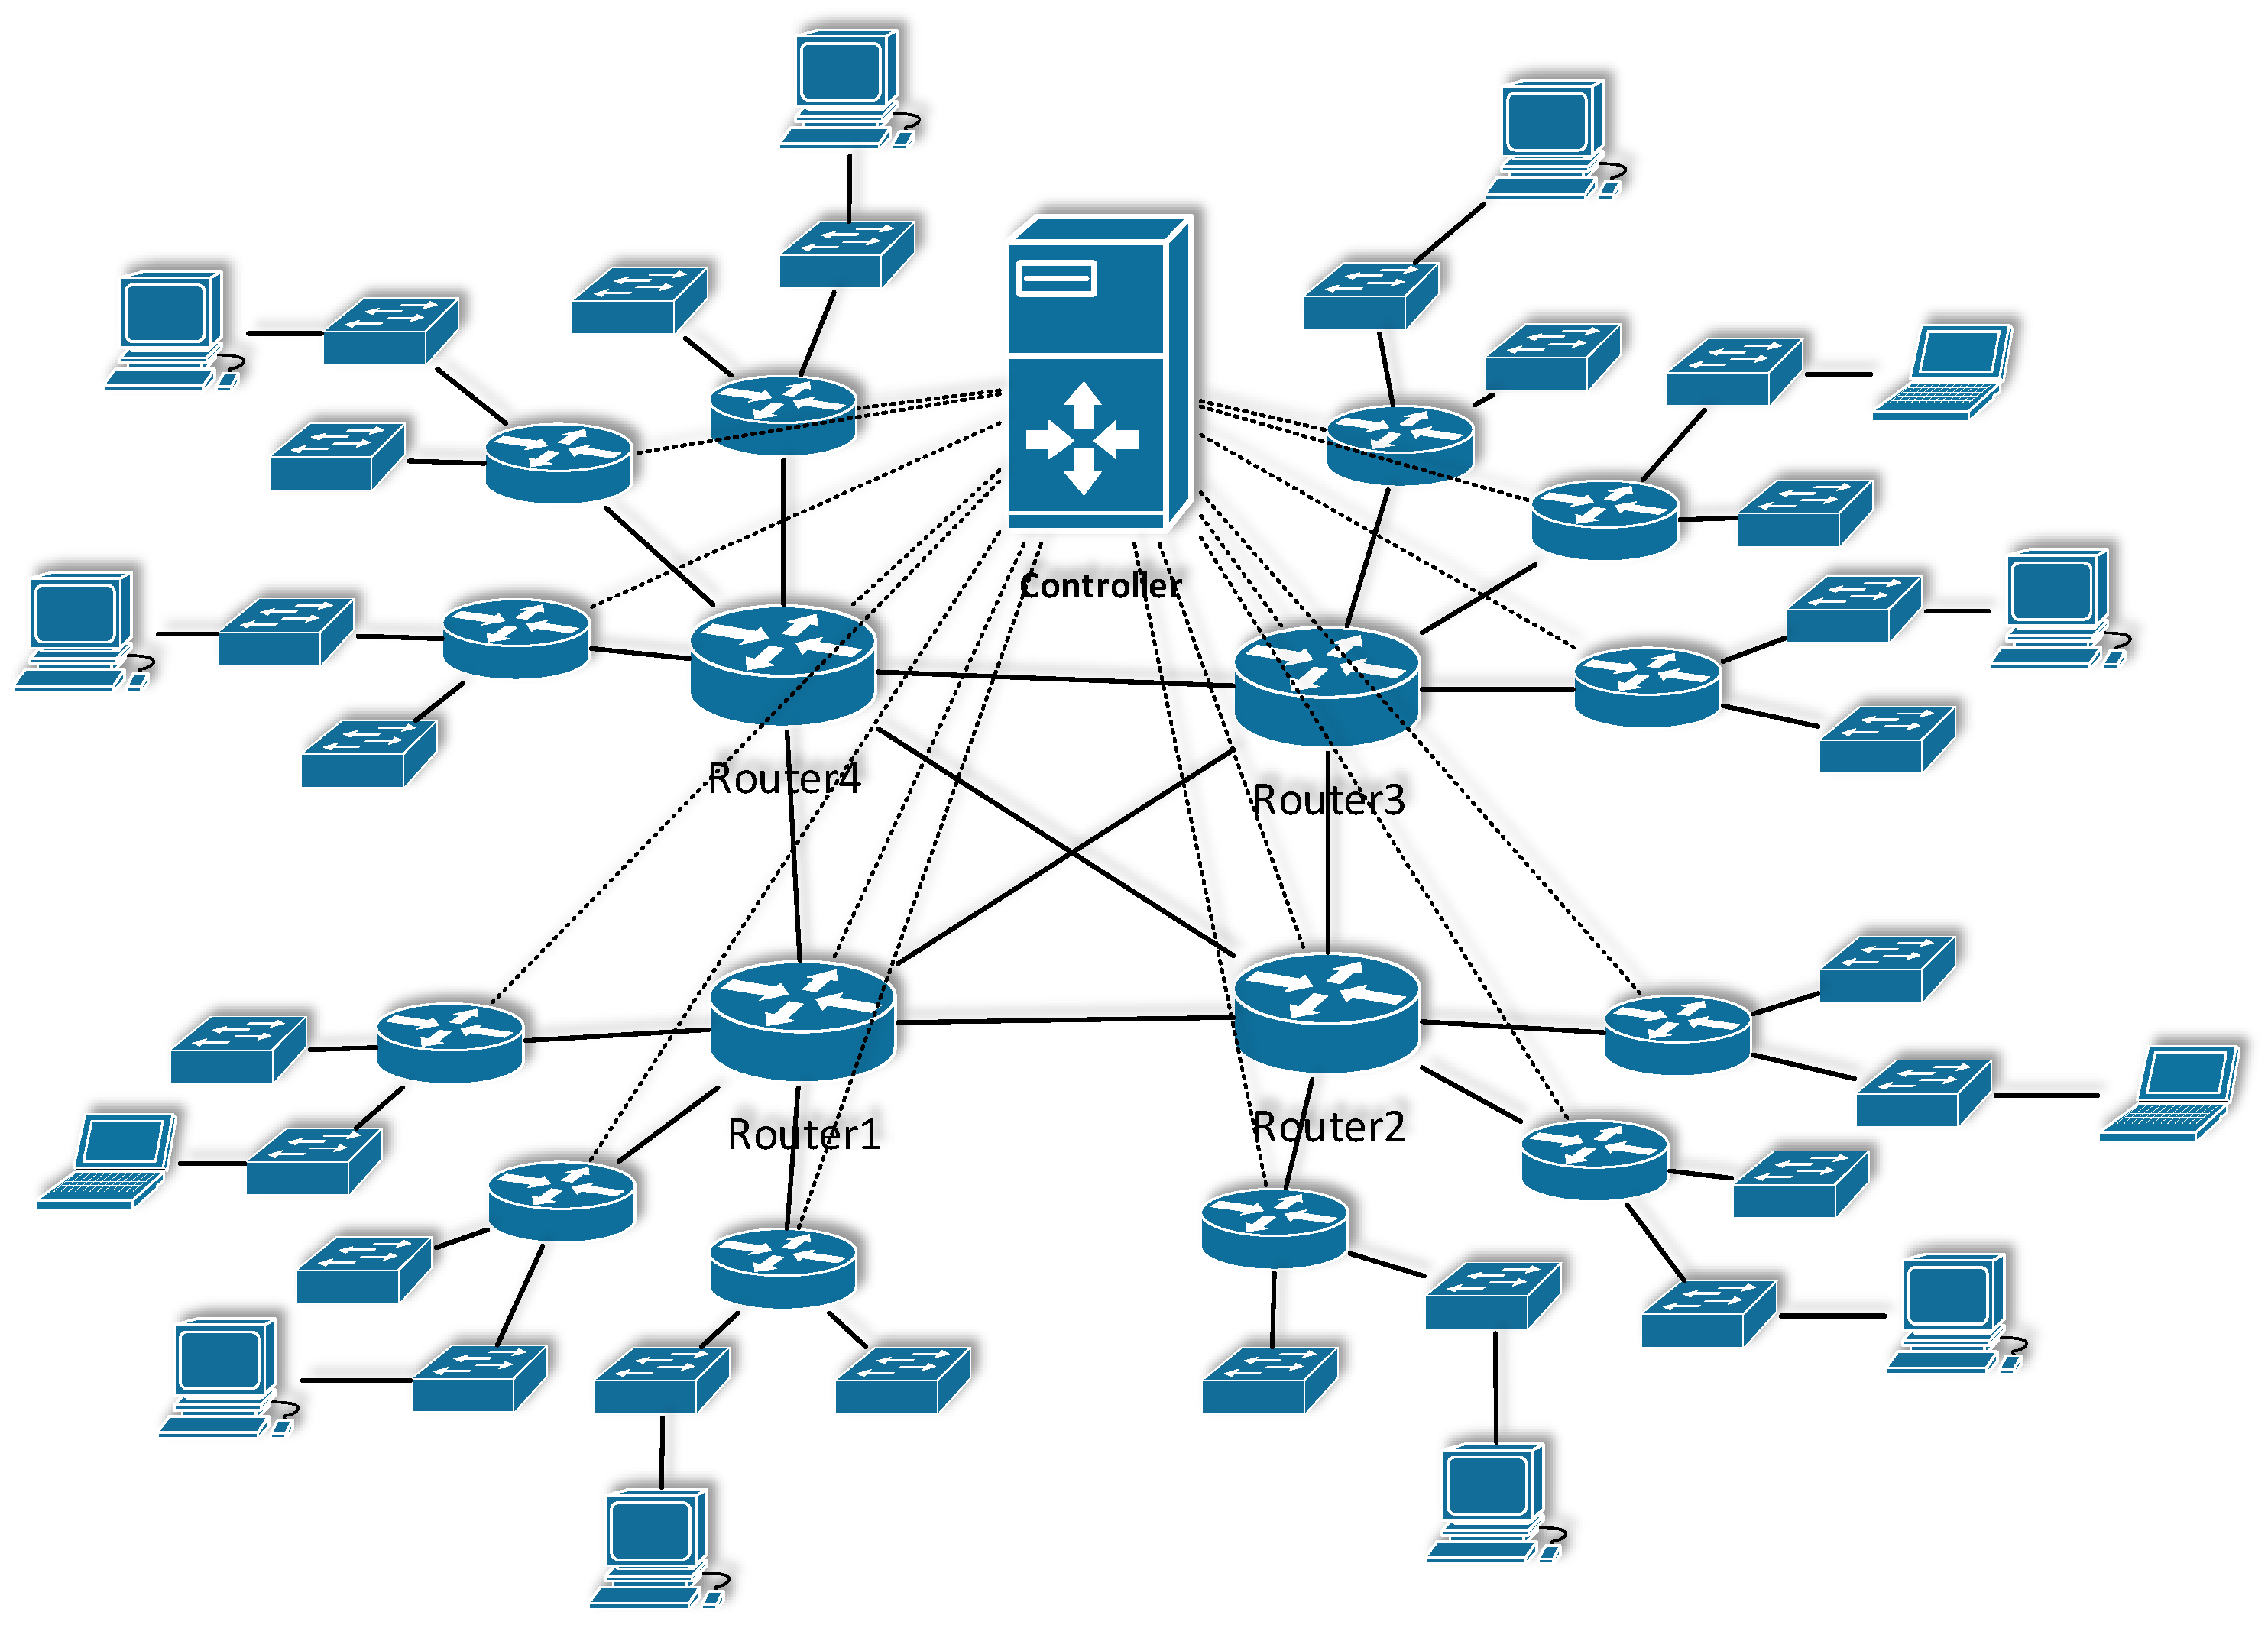
3.1. Development of a Simulation Model of Intent-Based Networking
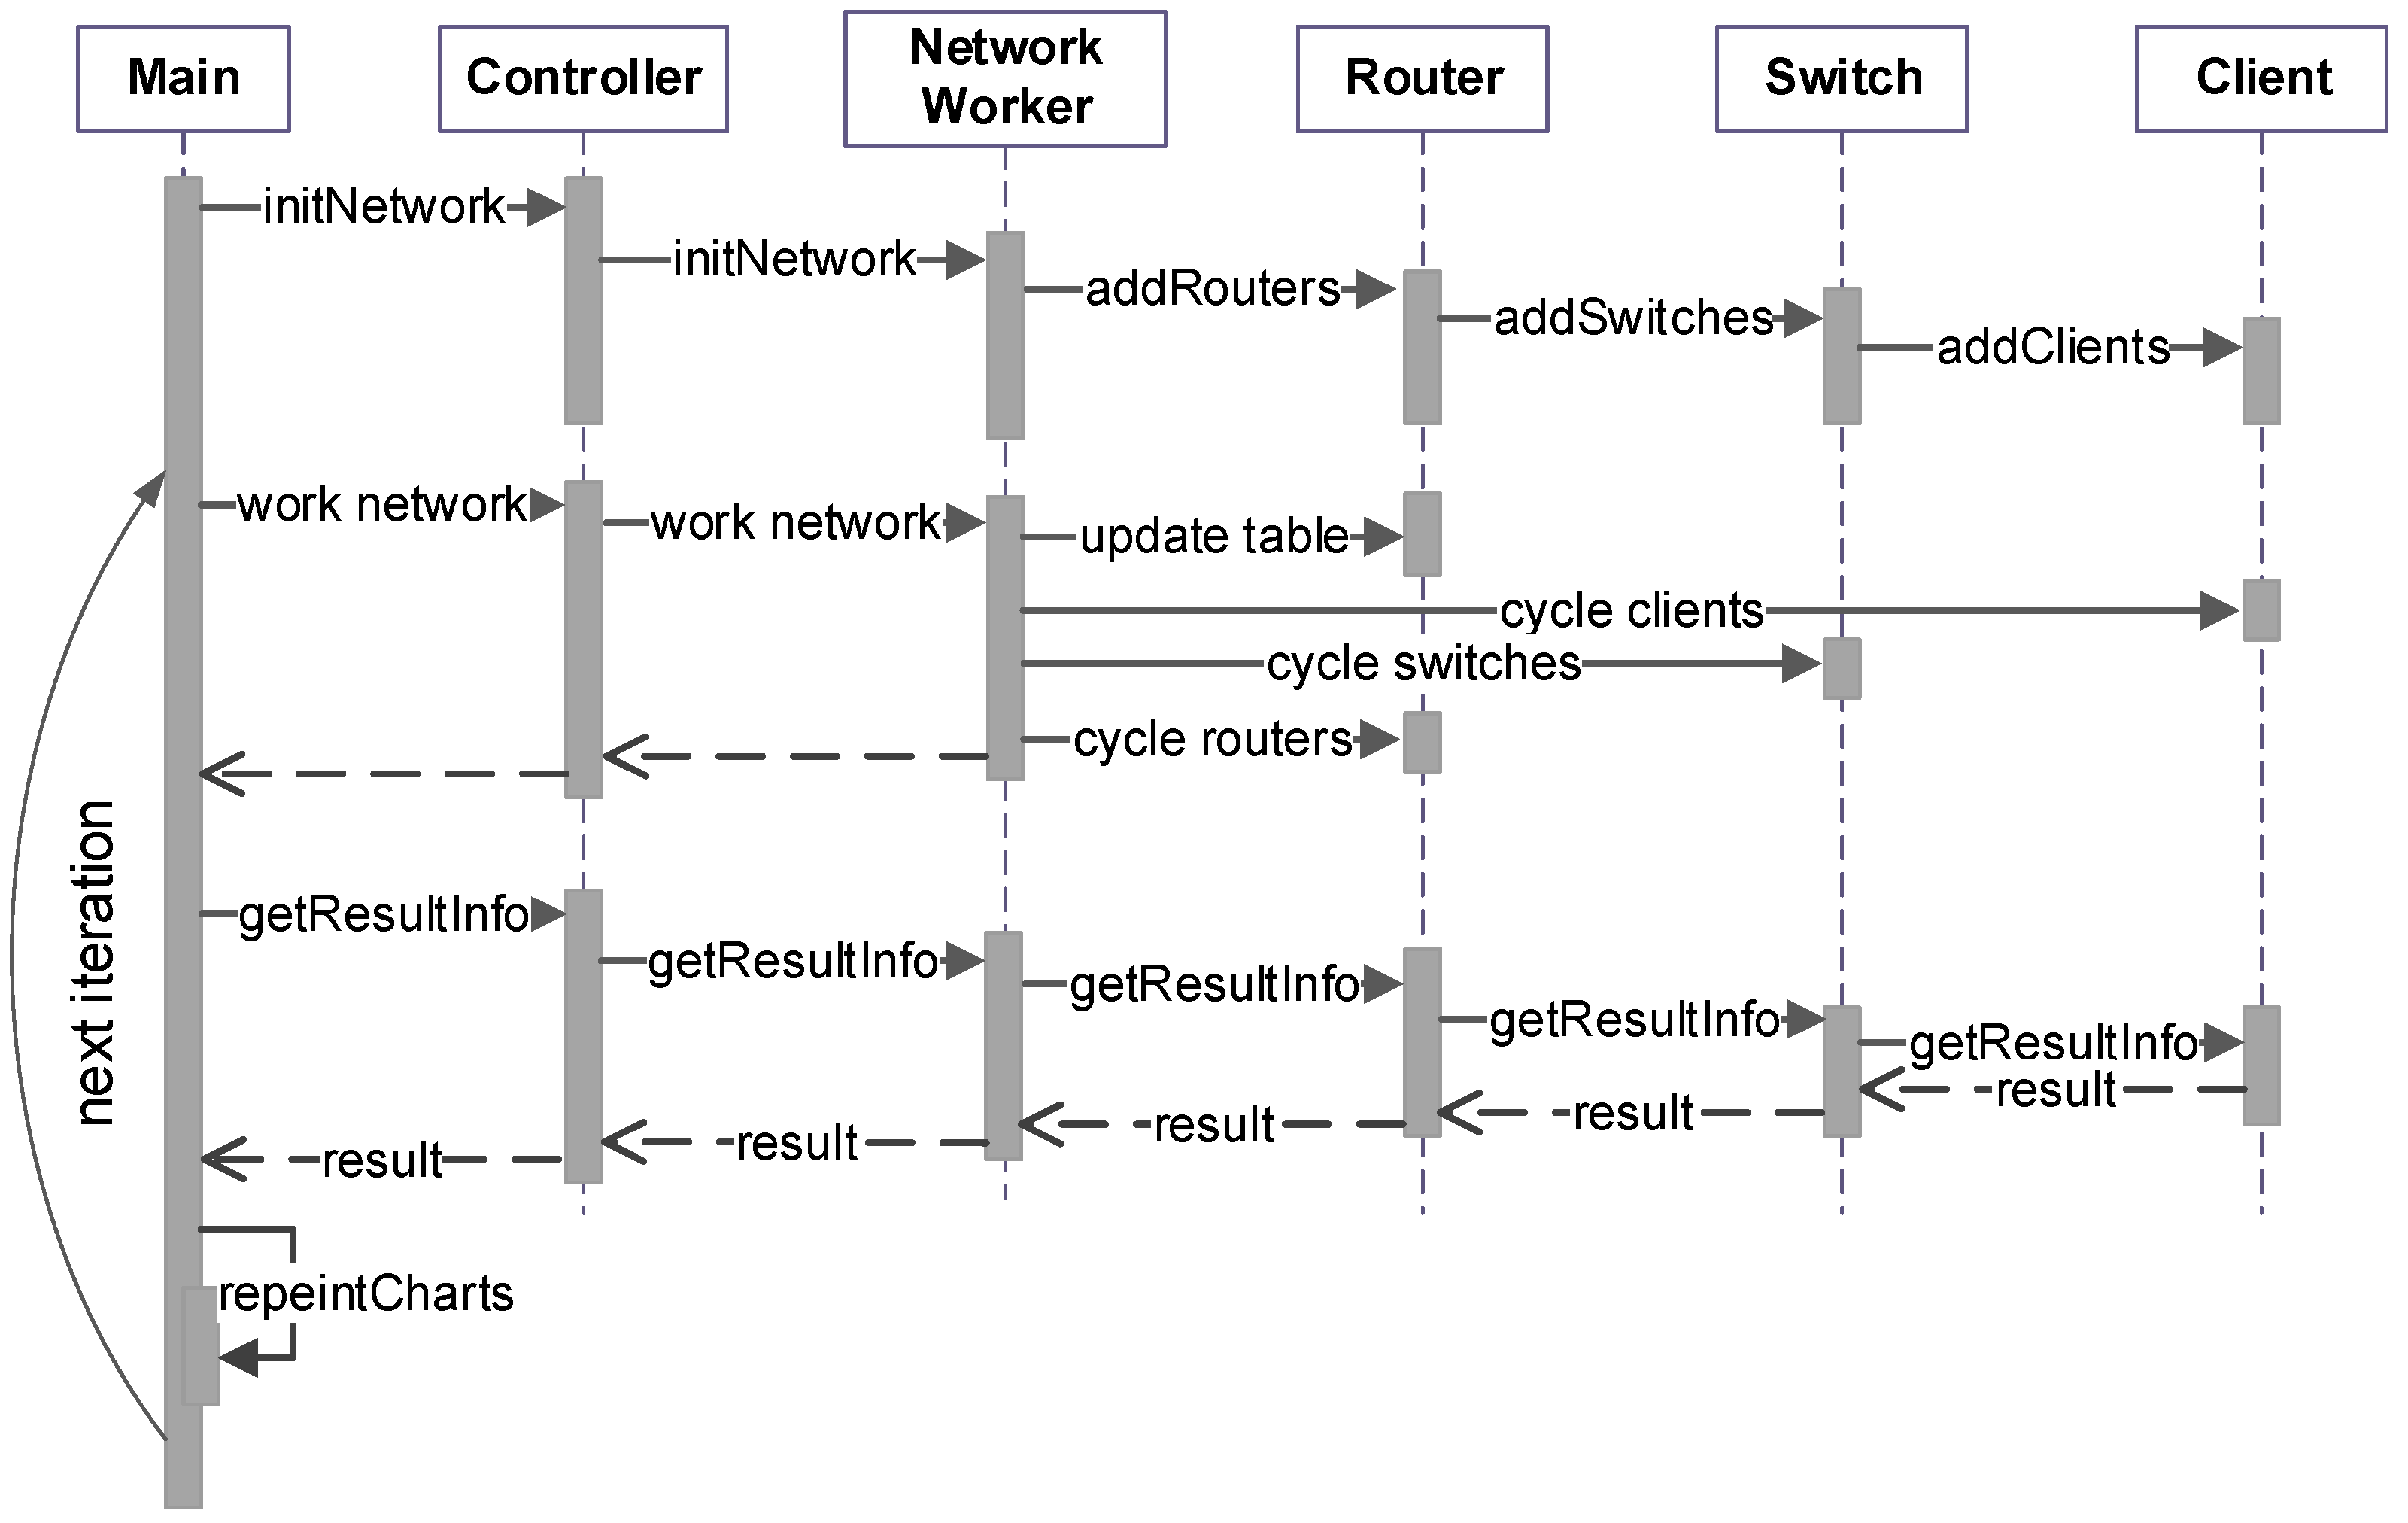
3.1.1. General Stages of Network Simulation
- Standard network without modifications;
- Standard network with modified routing (changed service order and the possibility of choosing a service’s QoE score) with a controller;
- Combined network: routers that will be served by the controller will be added to the standard network;
- New network IBN (all nodes are serviced by the controller).
- Network model scheme
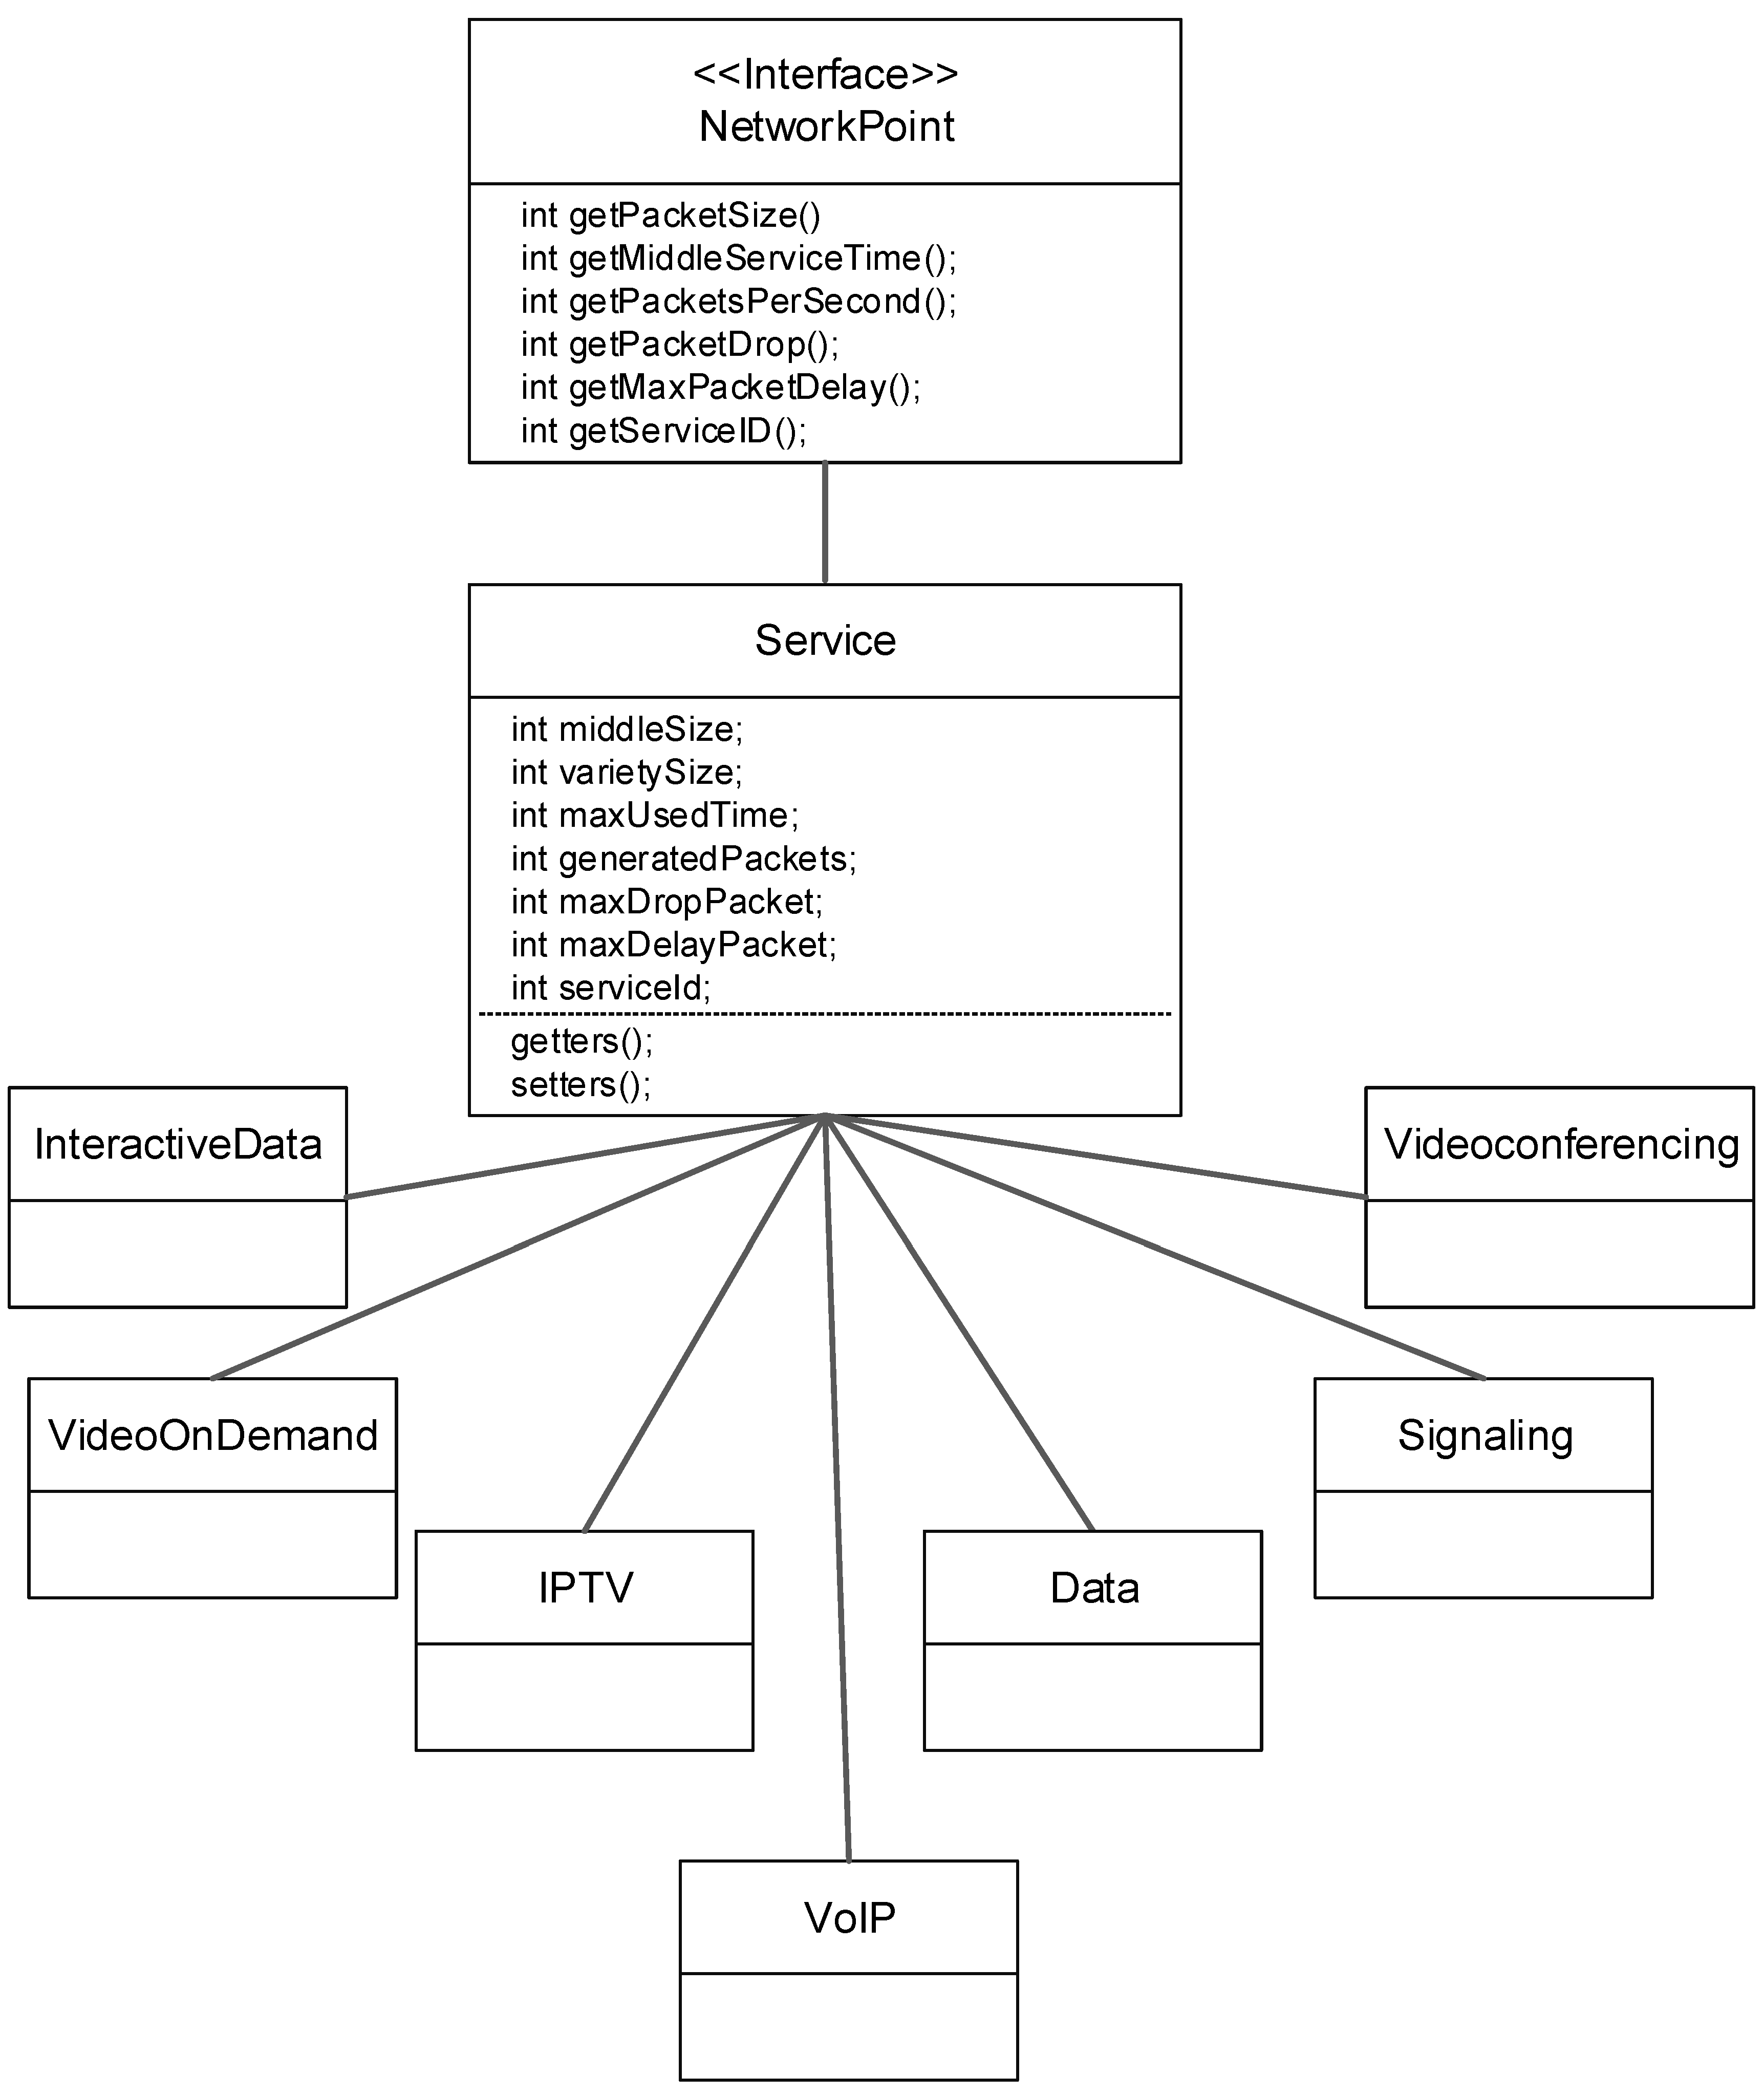
- Packets generation by customer devices
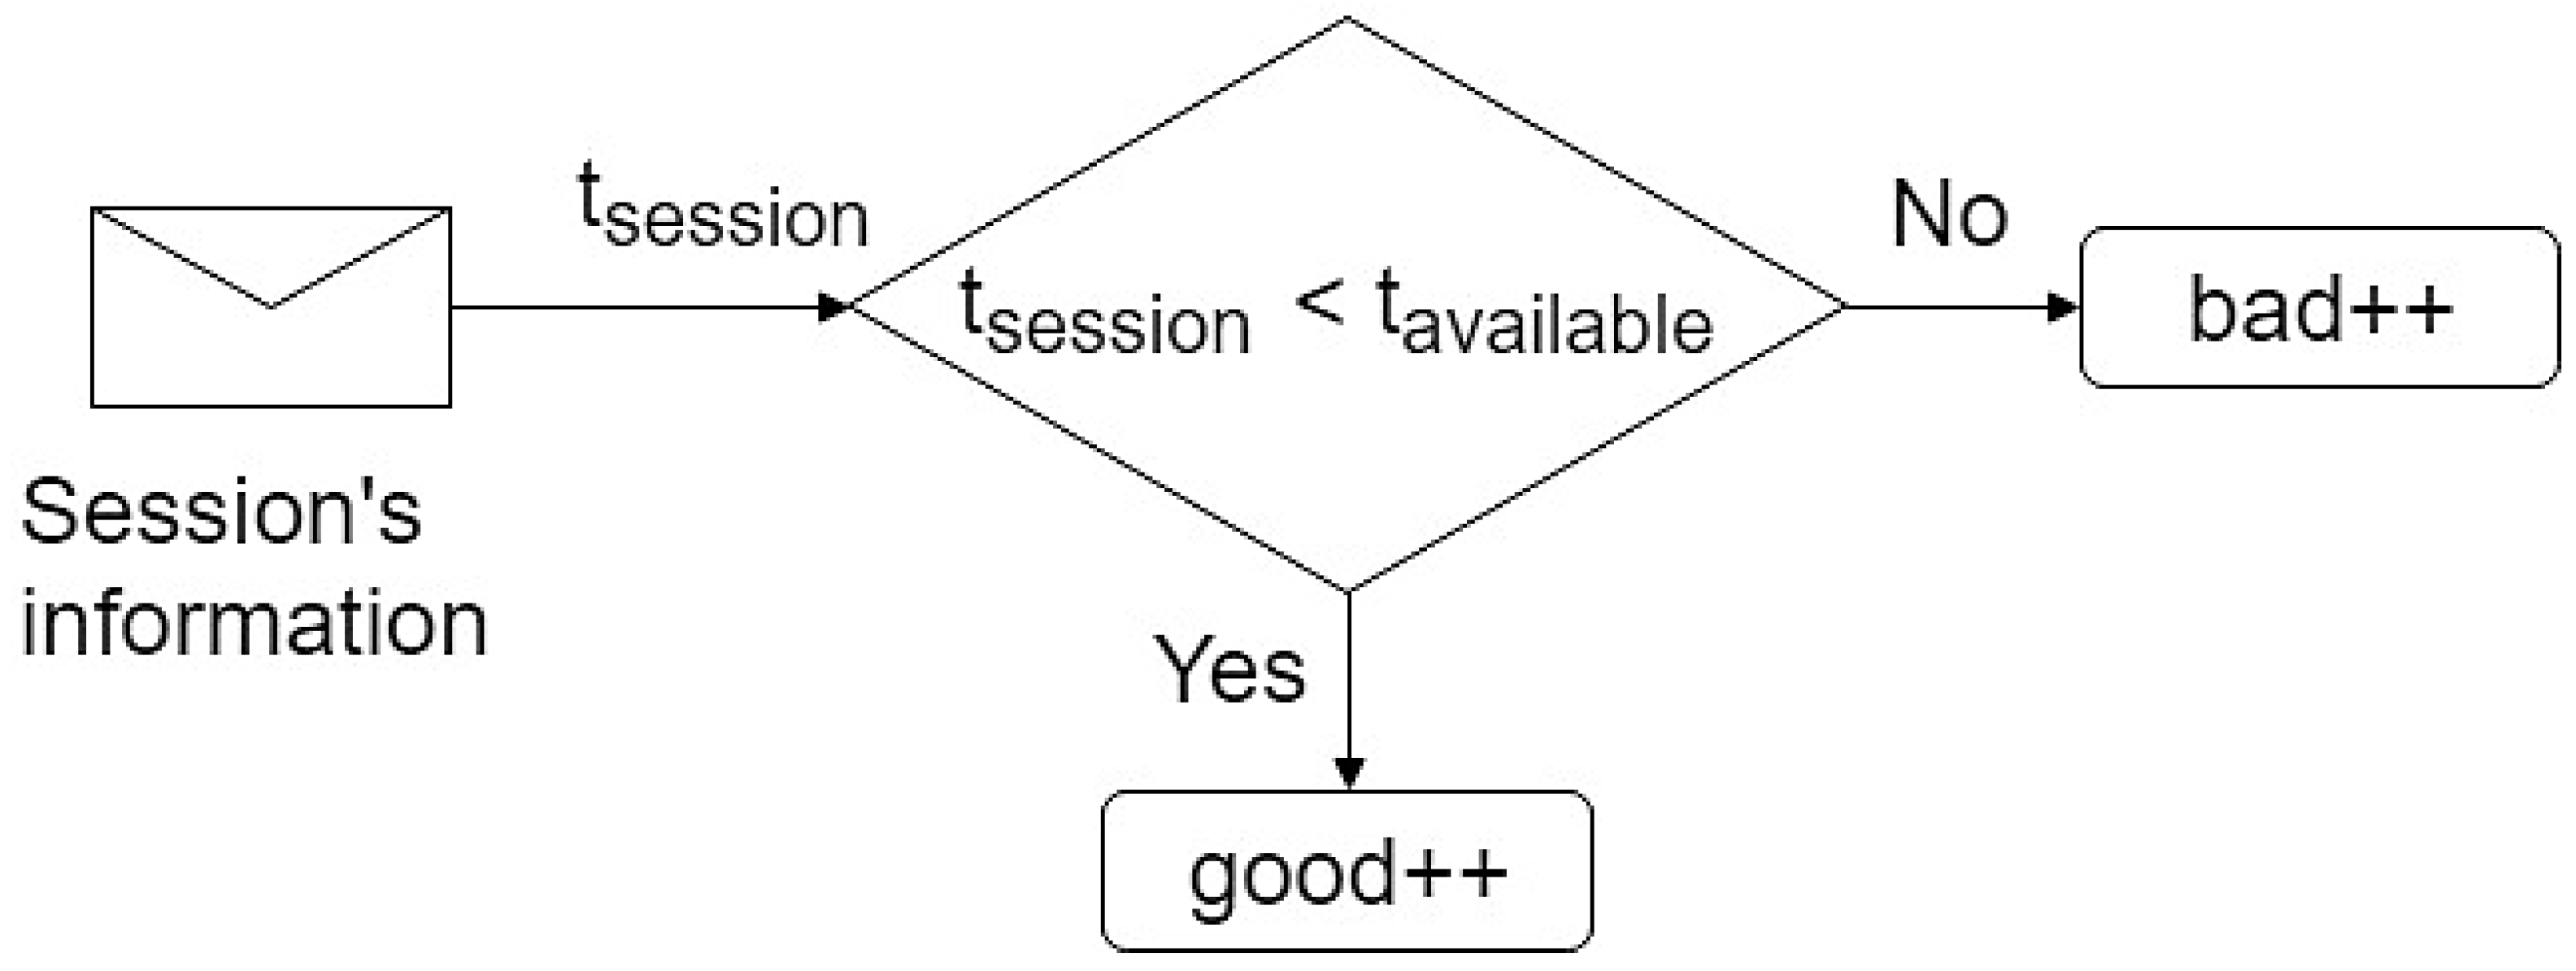
- We generate a session and select its parameters such as session usage time, service type, desired QoE score, and destination node;
- Generate packets for the session until it is completed;
- Upon completion, we generate a new session with new parameters.
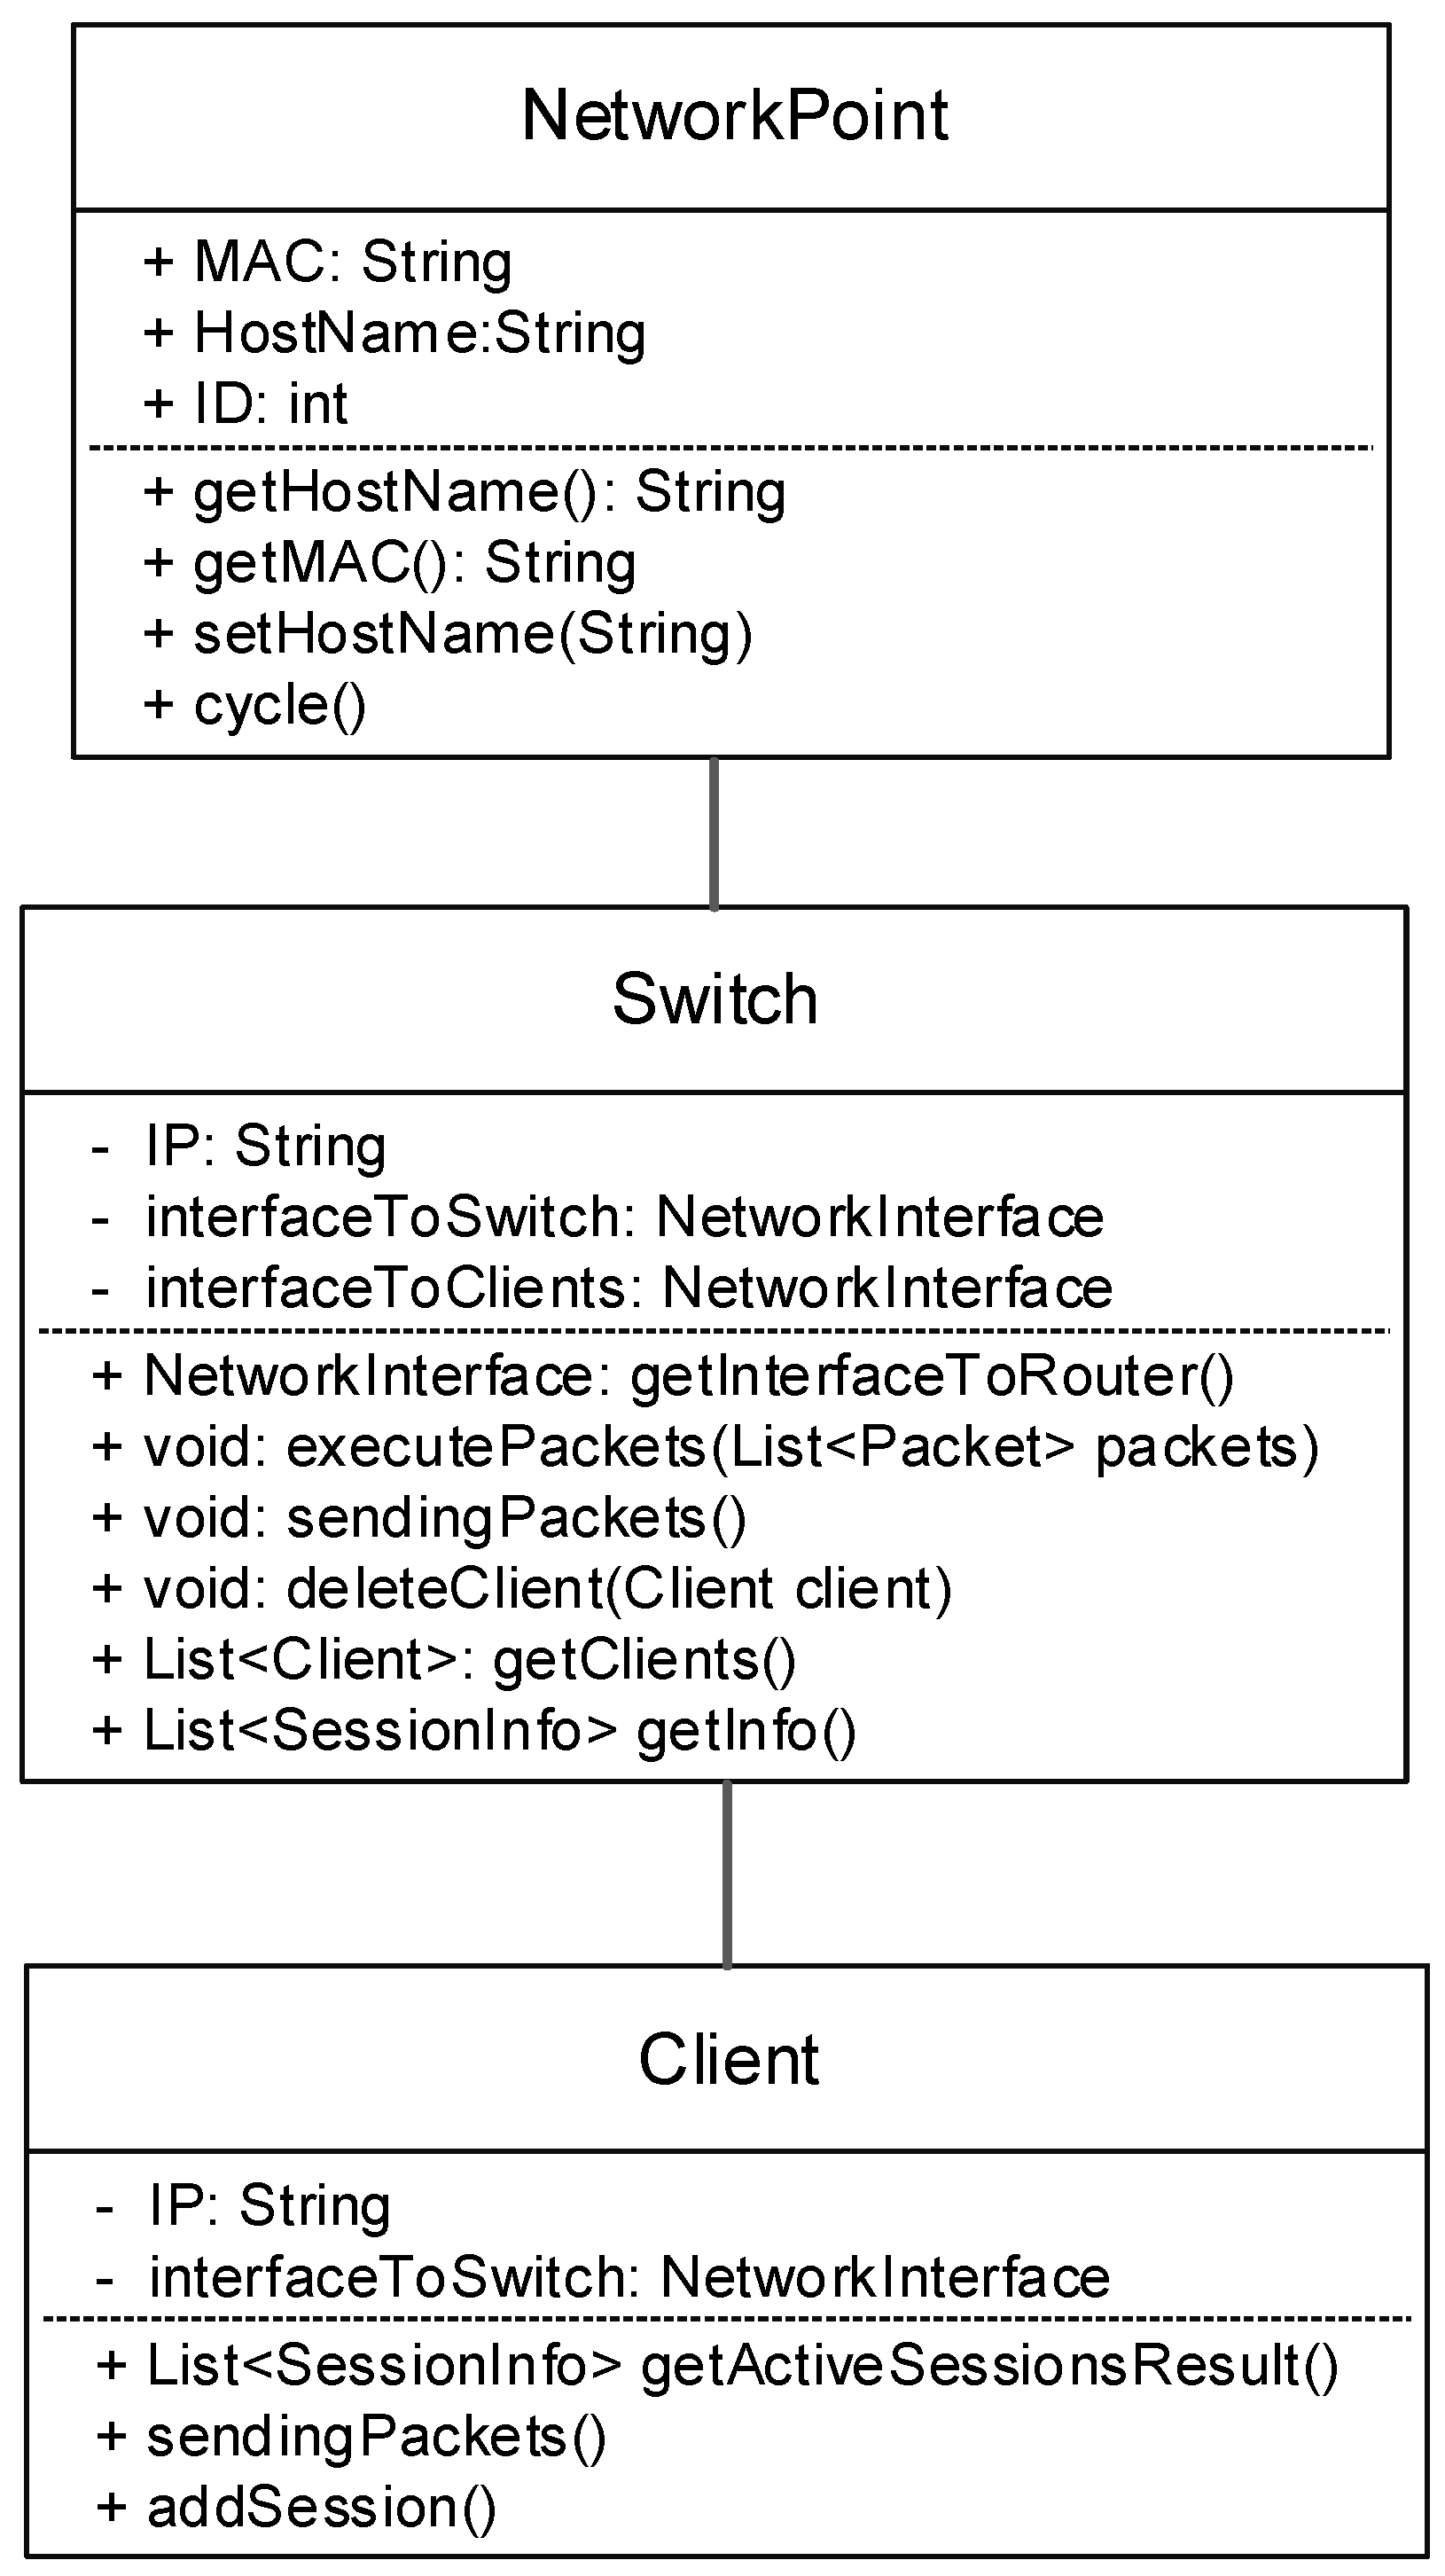
- Packet processing by switch
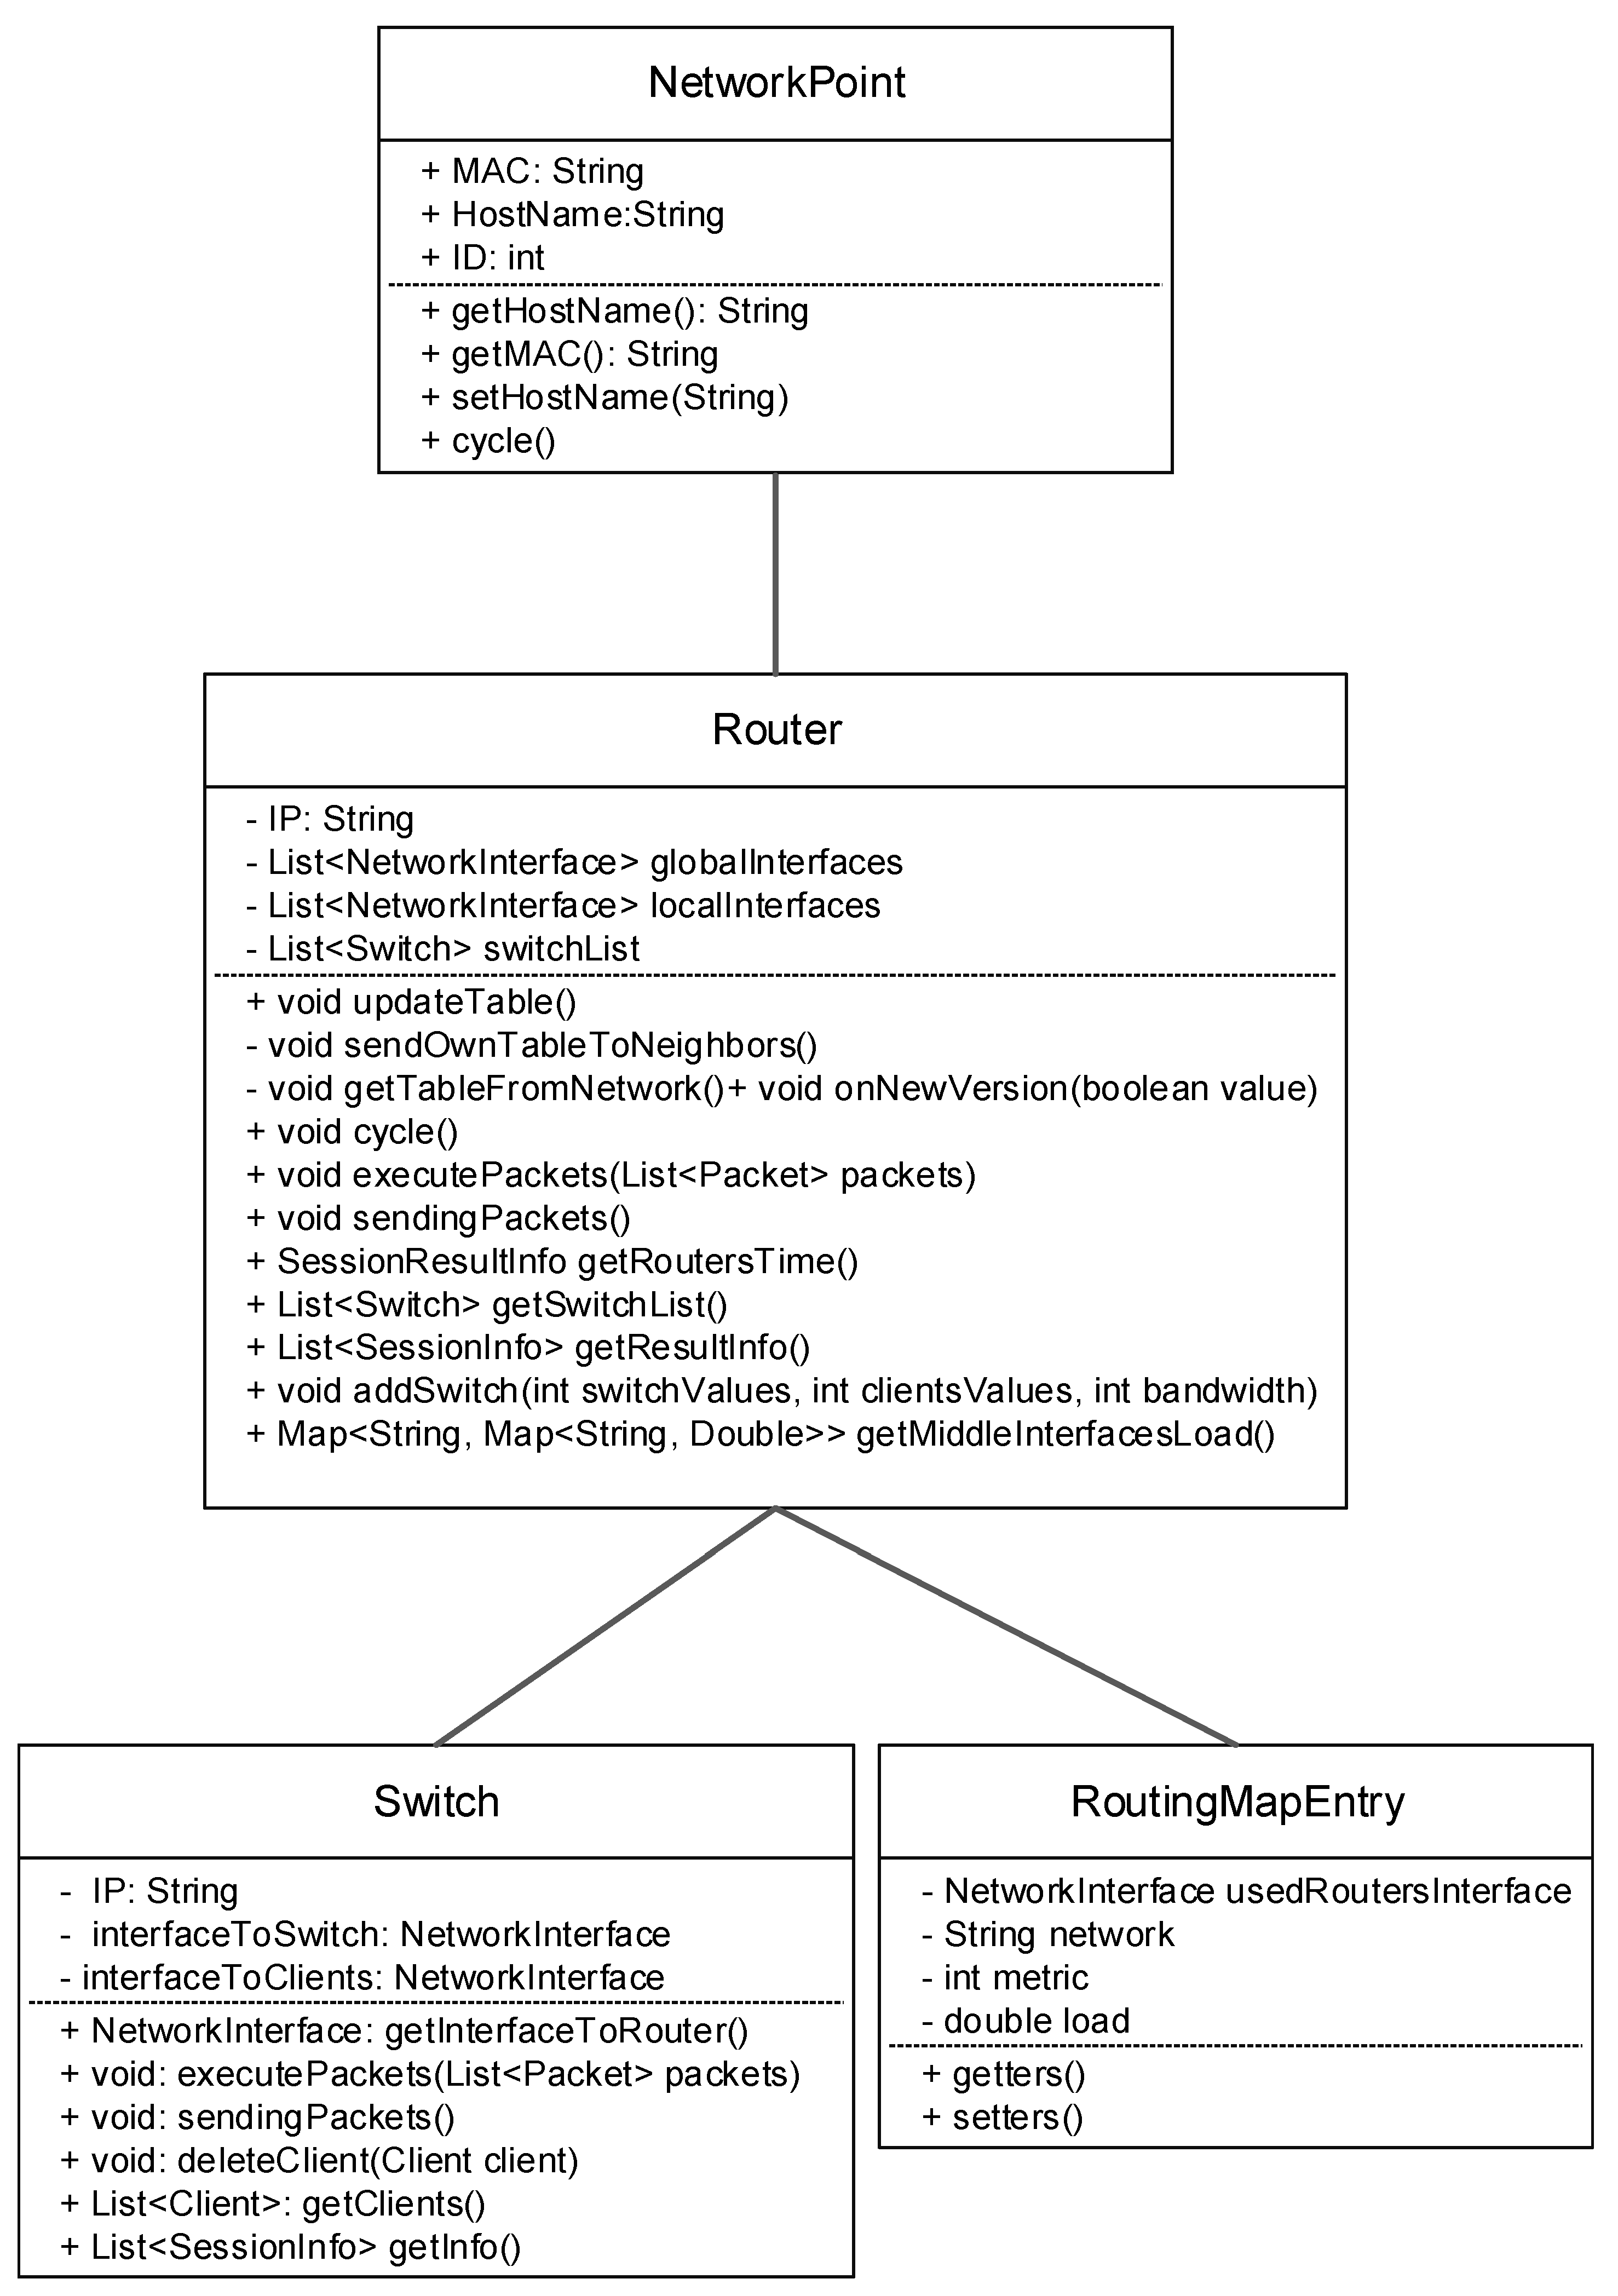
- Packet processing by router
- Sending packets from customers to switches
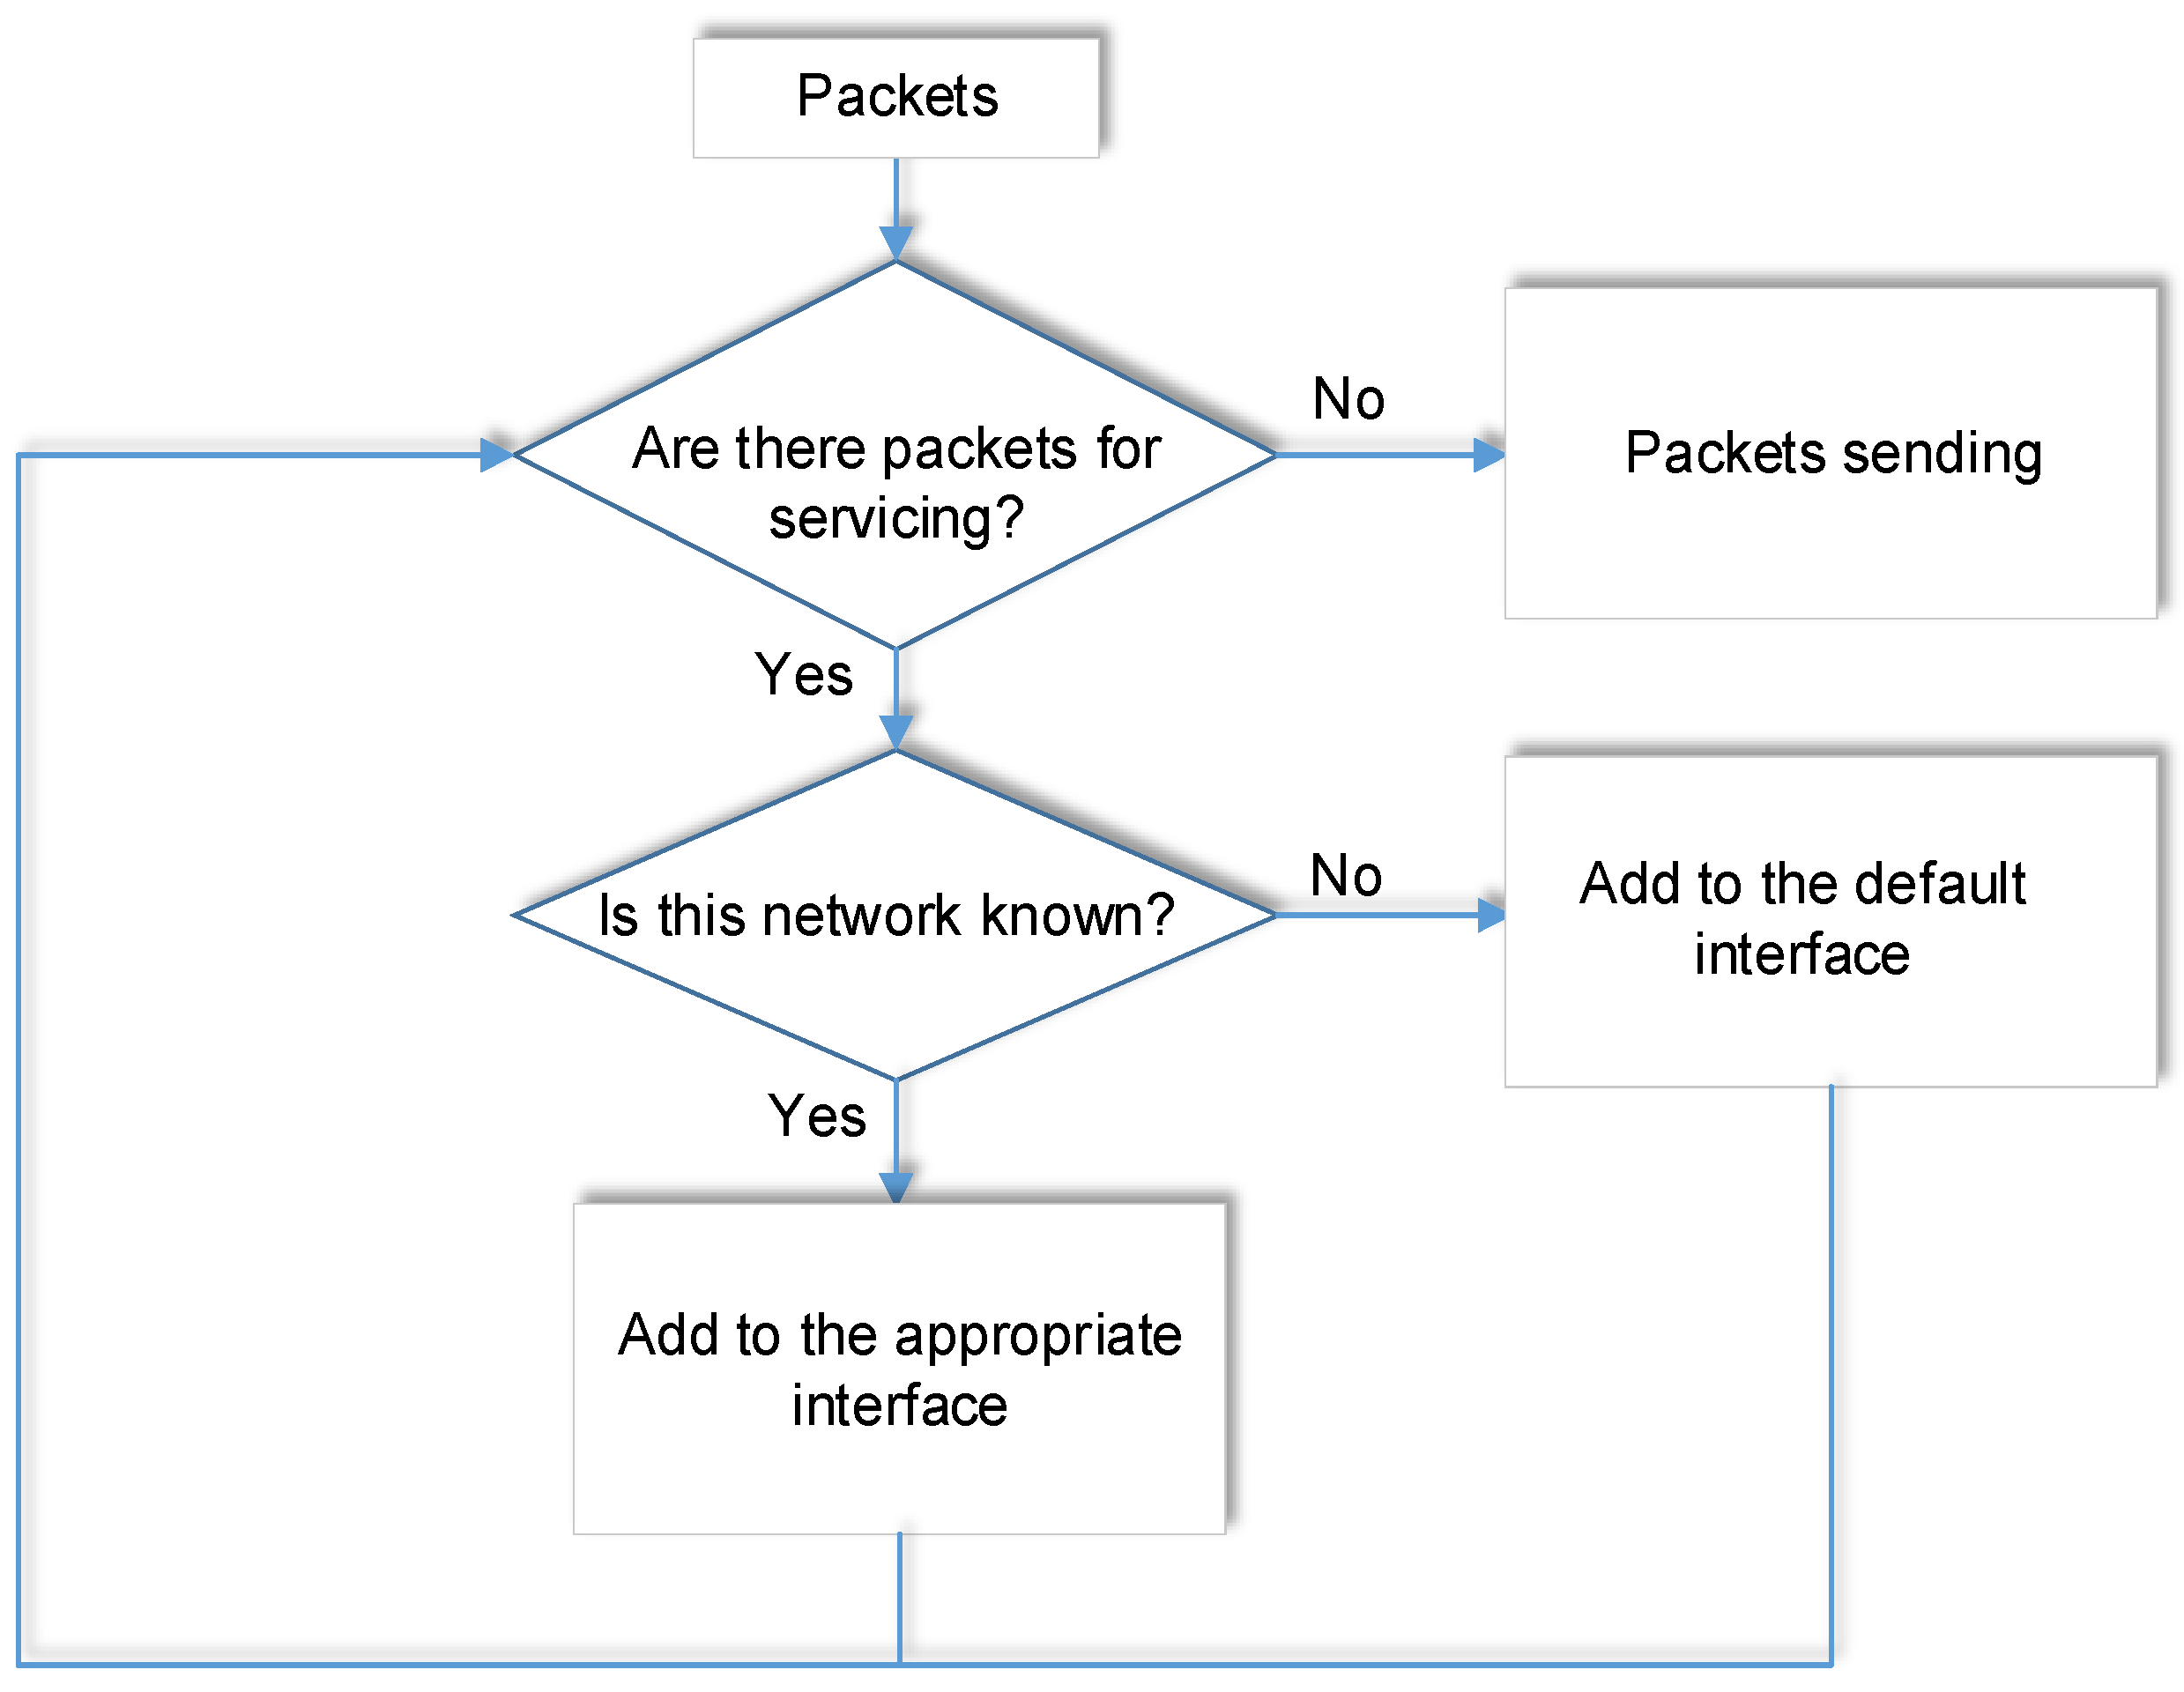
- Packets sending by switches and routers
- Update routing tables
- Network analytics
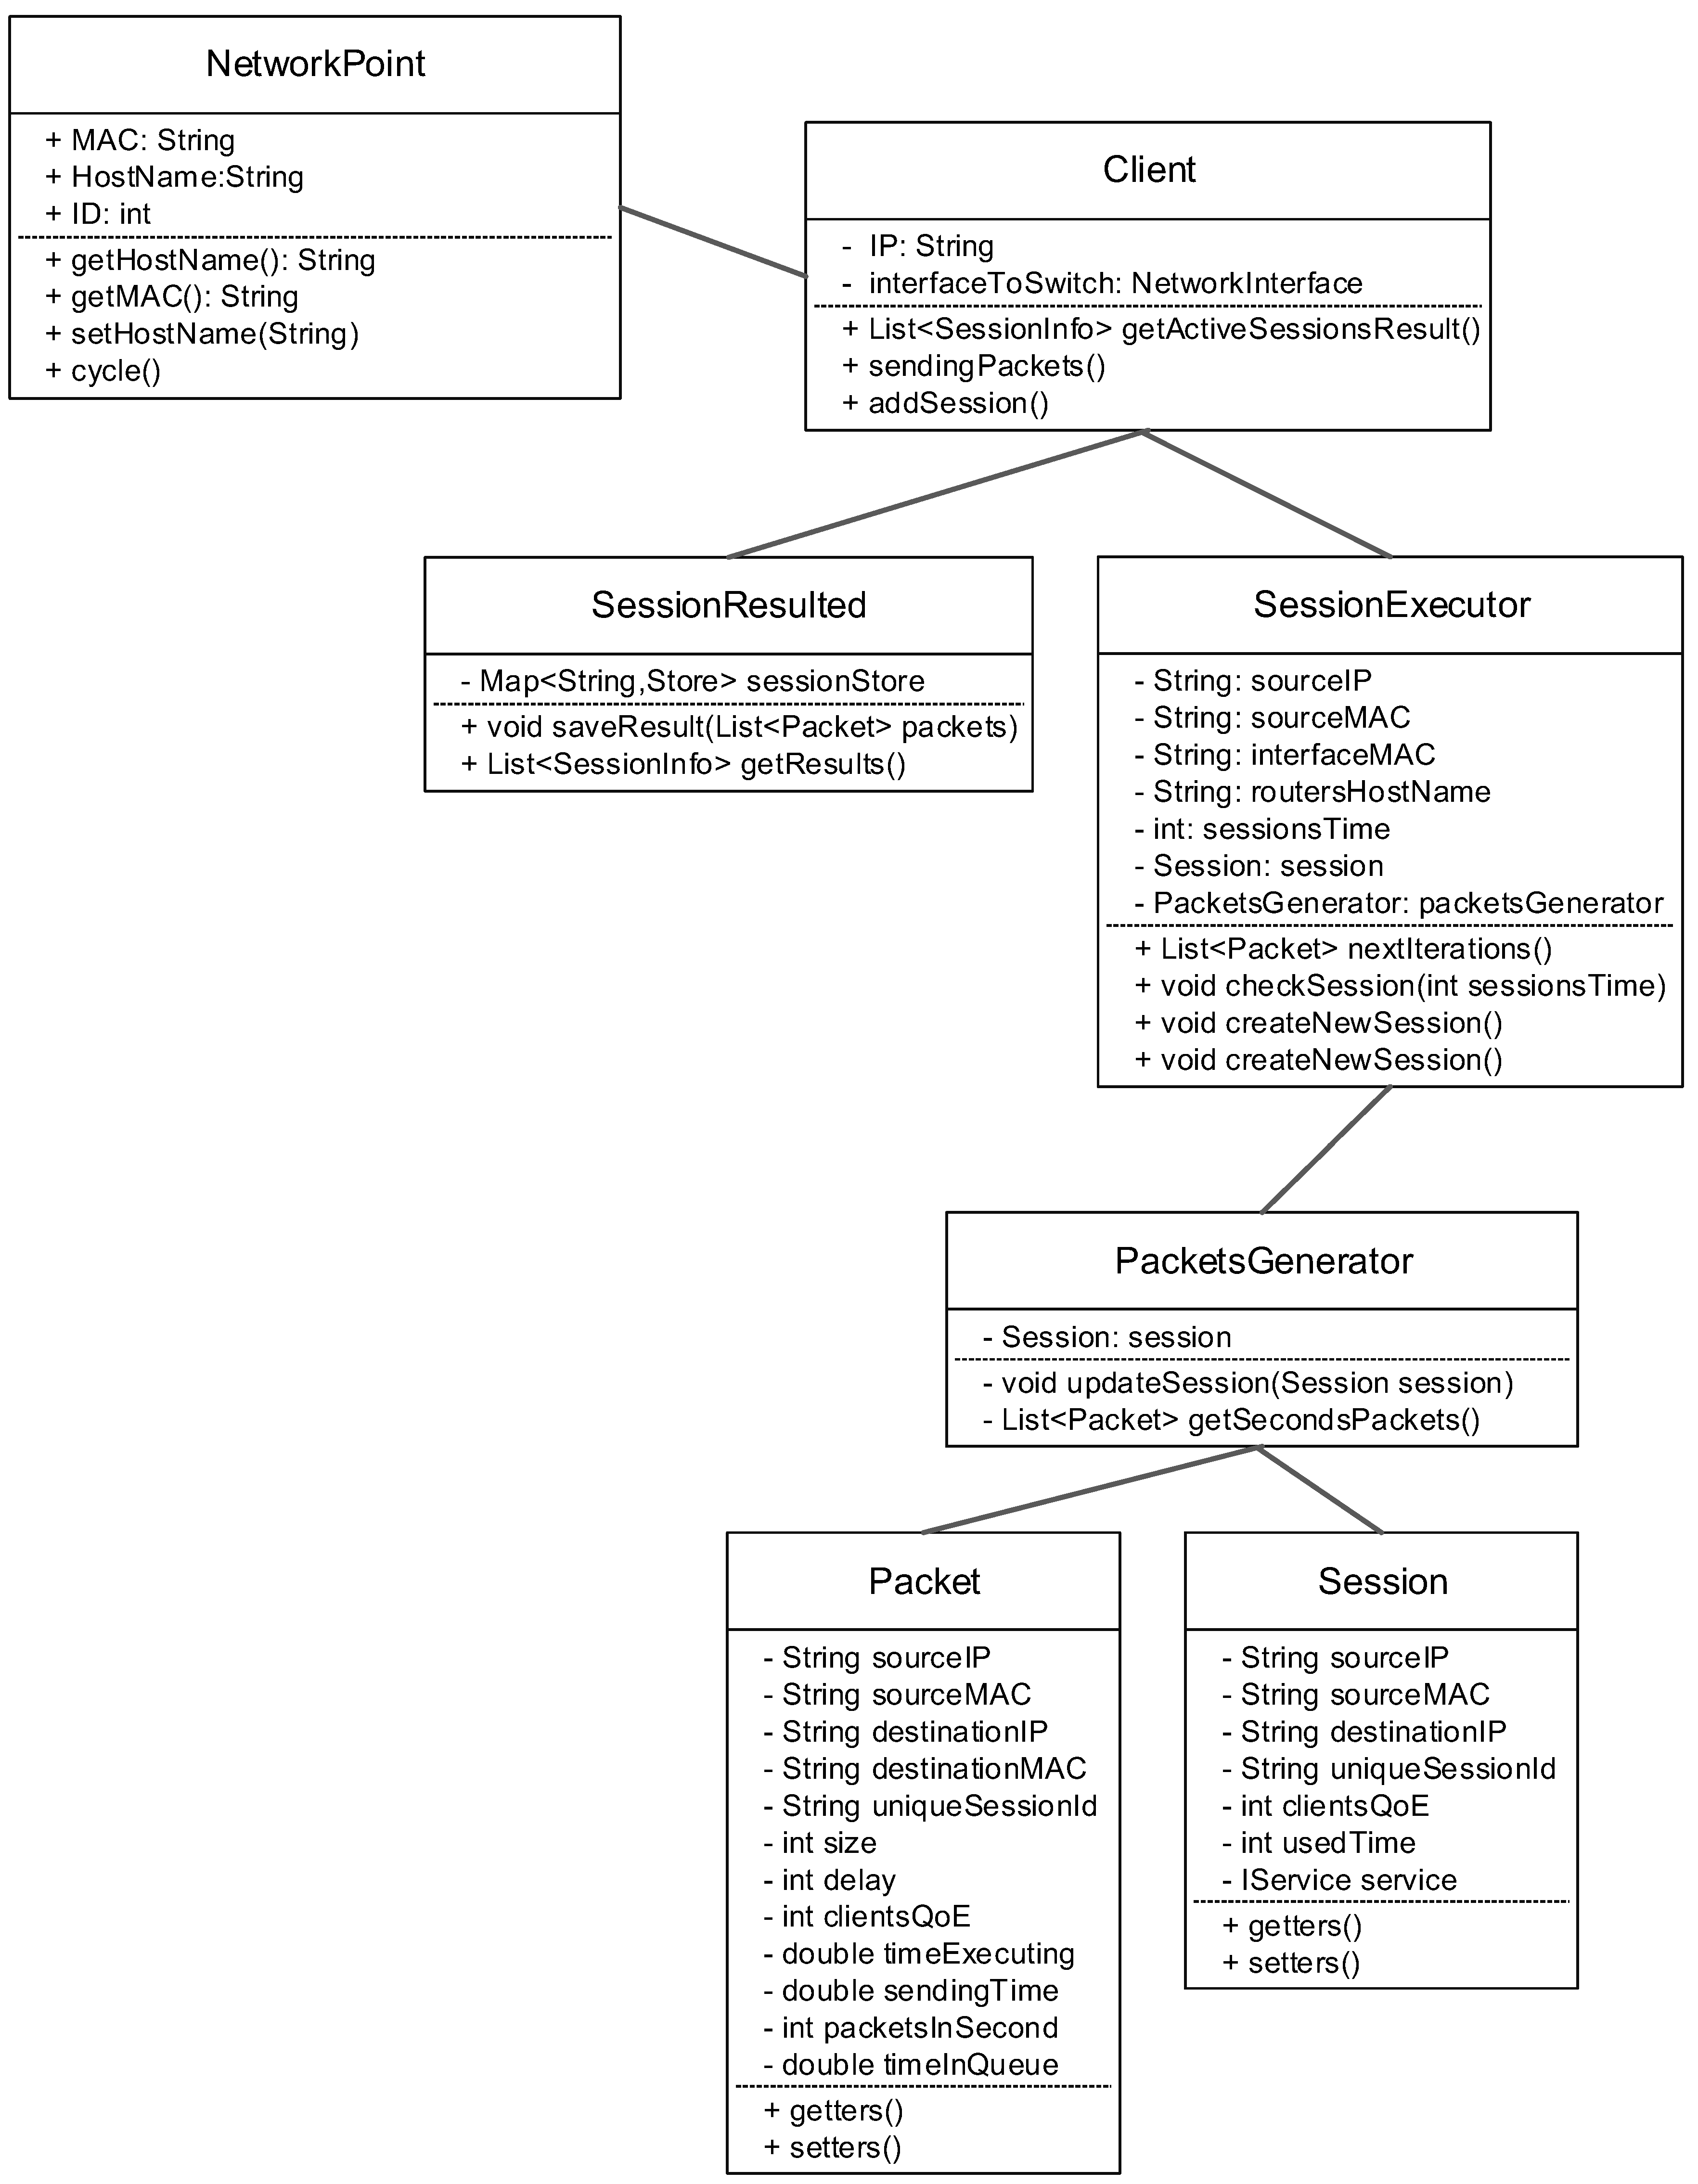
3.1.2. Detailed Consideration of the Structure and Connections of the Network Simulation Program Written Using the Java Programming Language
- Realization of customers (clients) work
- Realization of switches
- Realization of routers
- Route tables and methods for sending and updating;
- A method for switching the used algorithm (traditional or proposed);
- A method for collecting load information of all its ports, both local and global;
- A method for collecting information from subordinate switches;
- A method for obtaining a collection of subordinate switches;
- A methods for adding and removing switches;
- Other auxiliary methods.
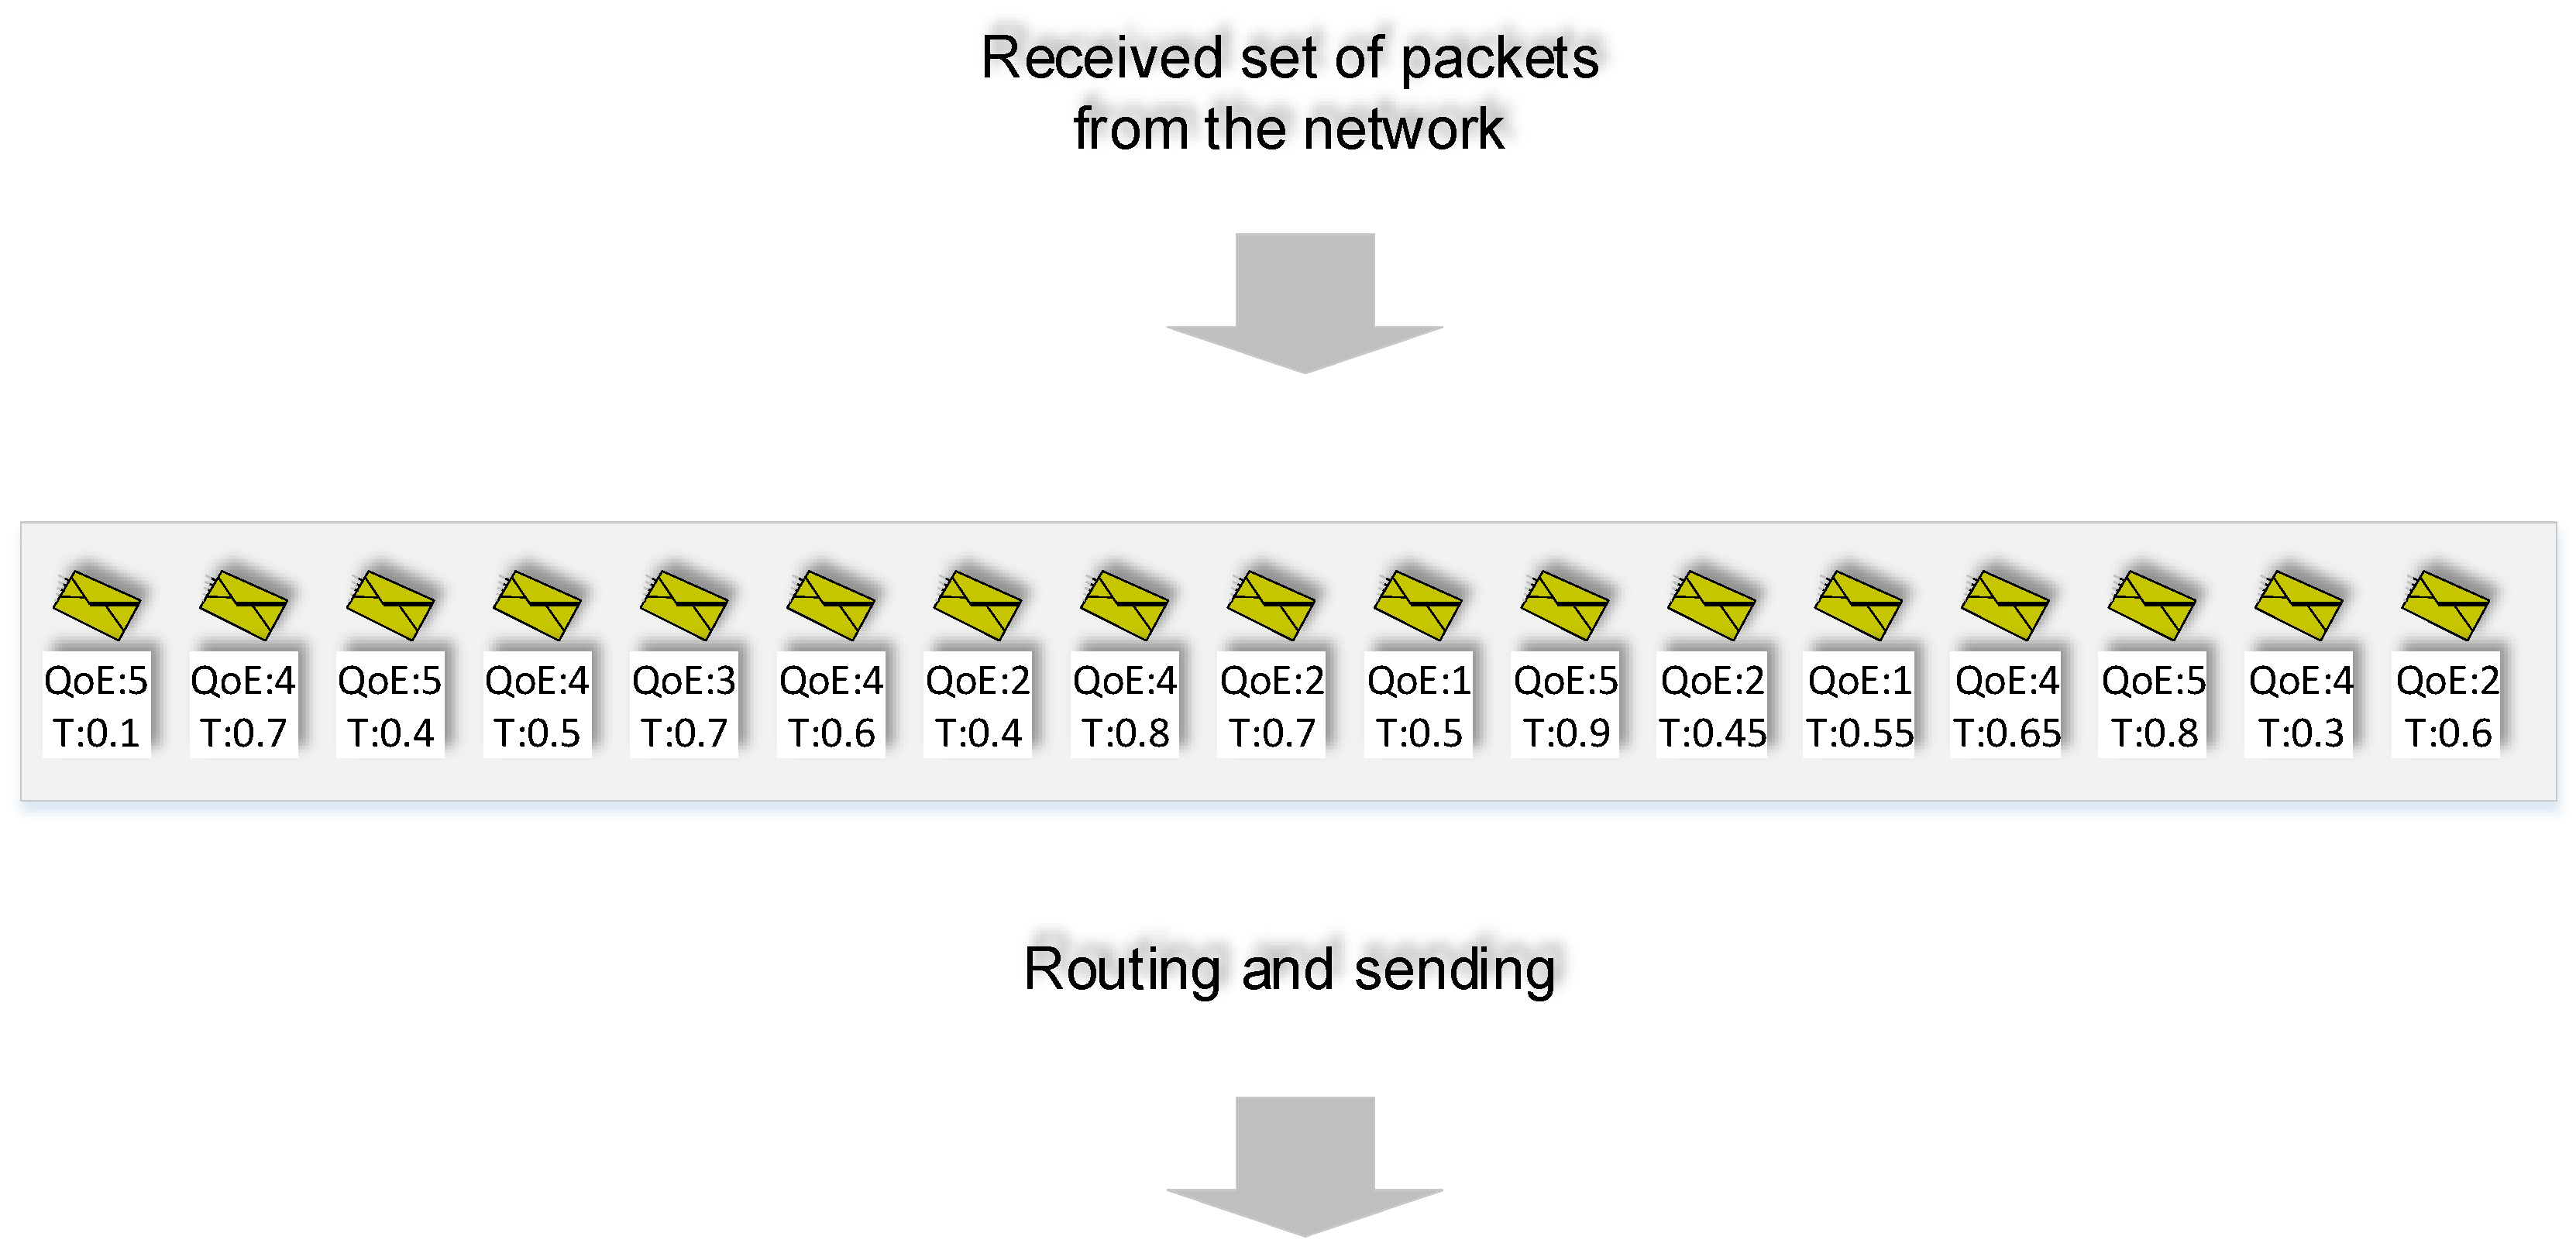
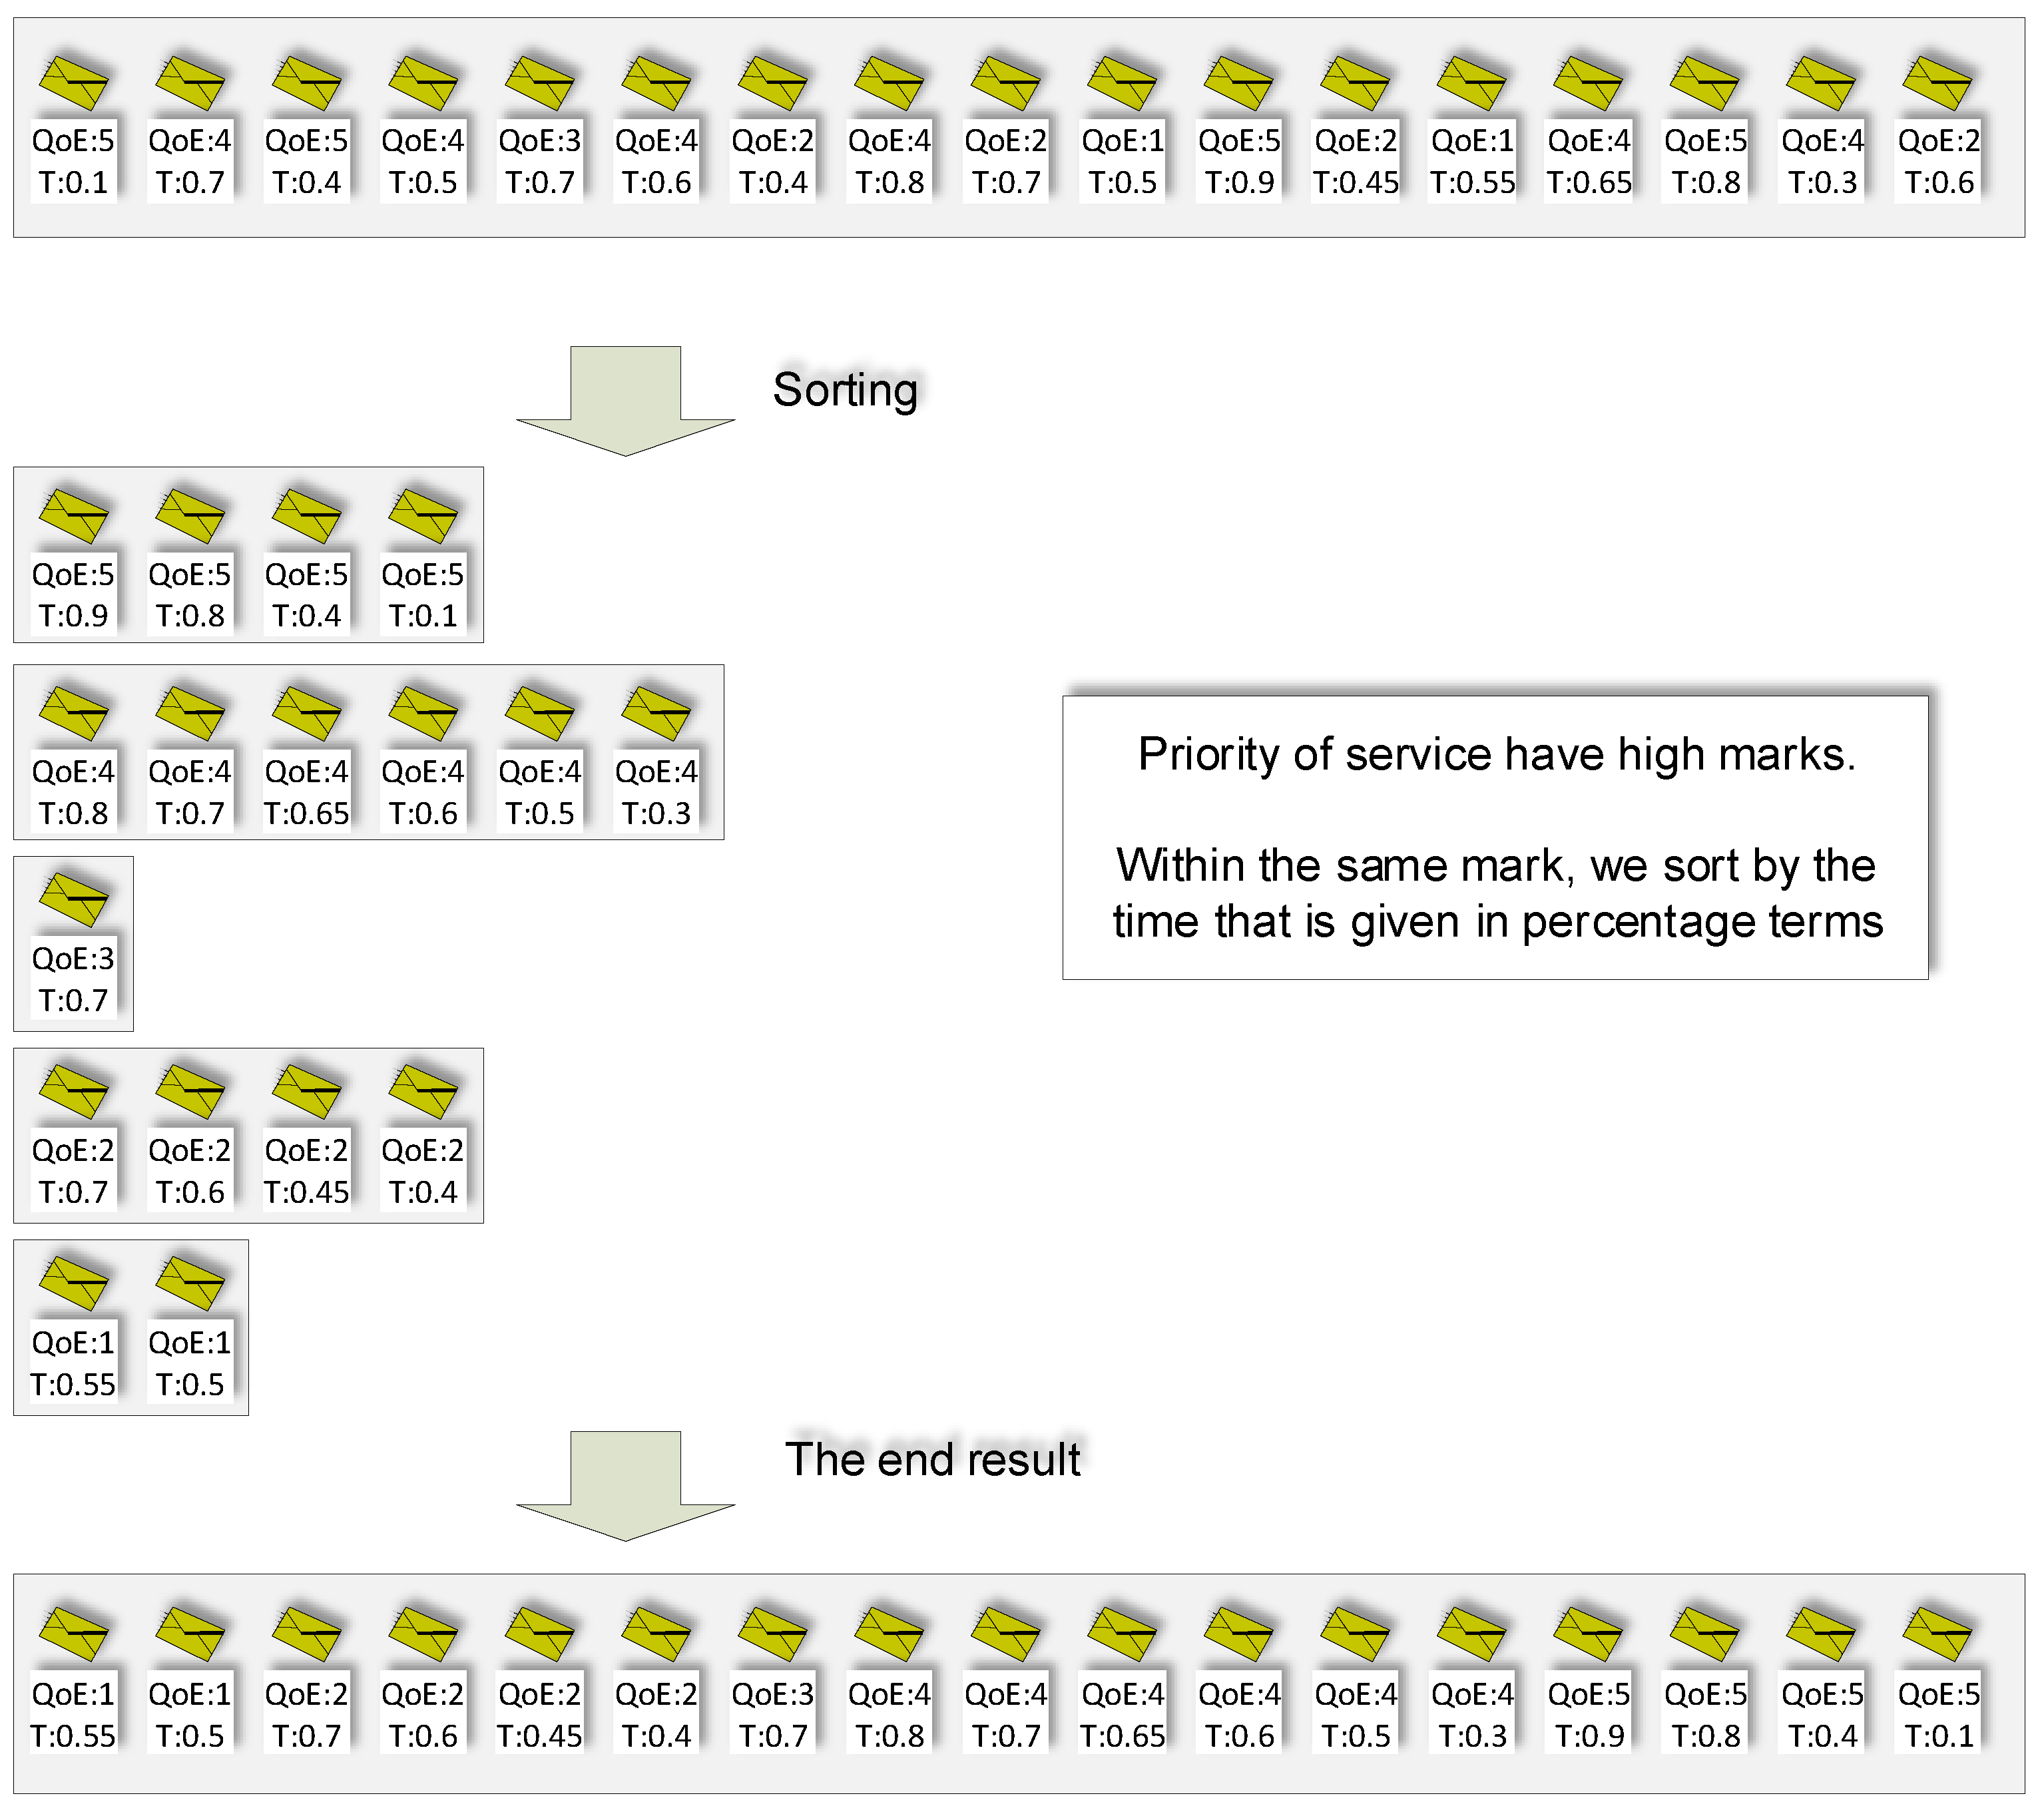
3.2. Billing System for the Proposed Quality of Service Management Method
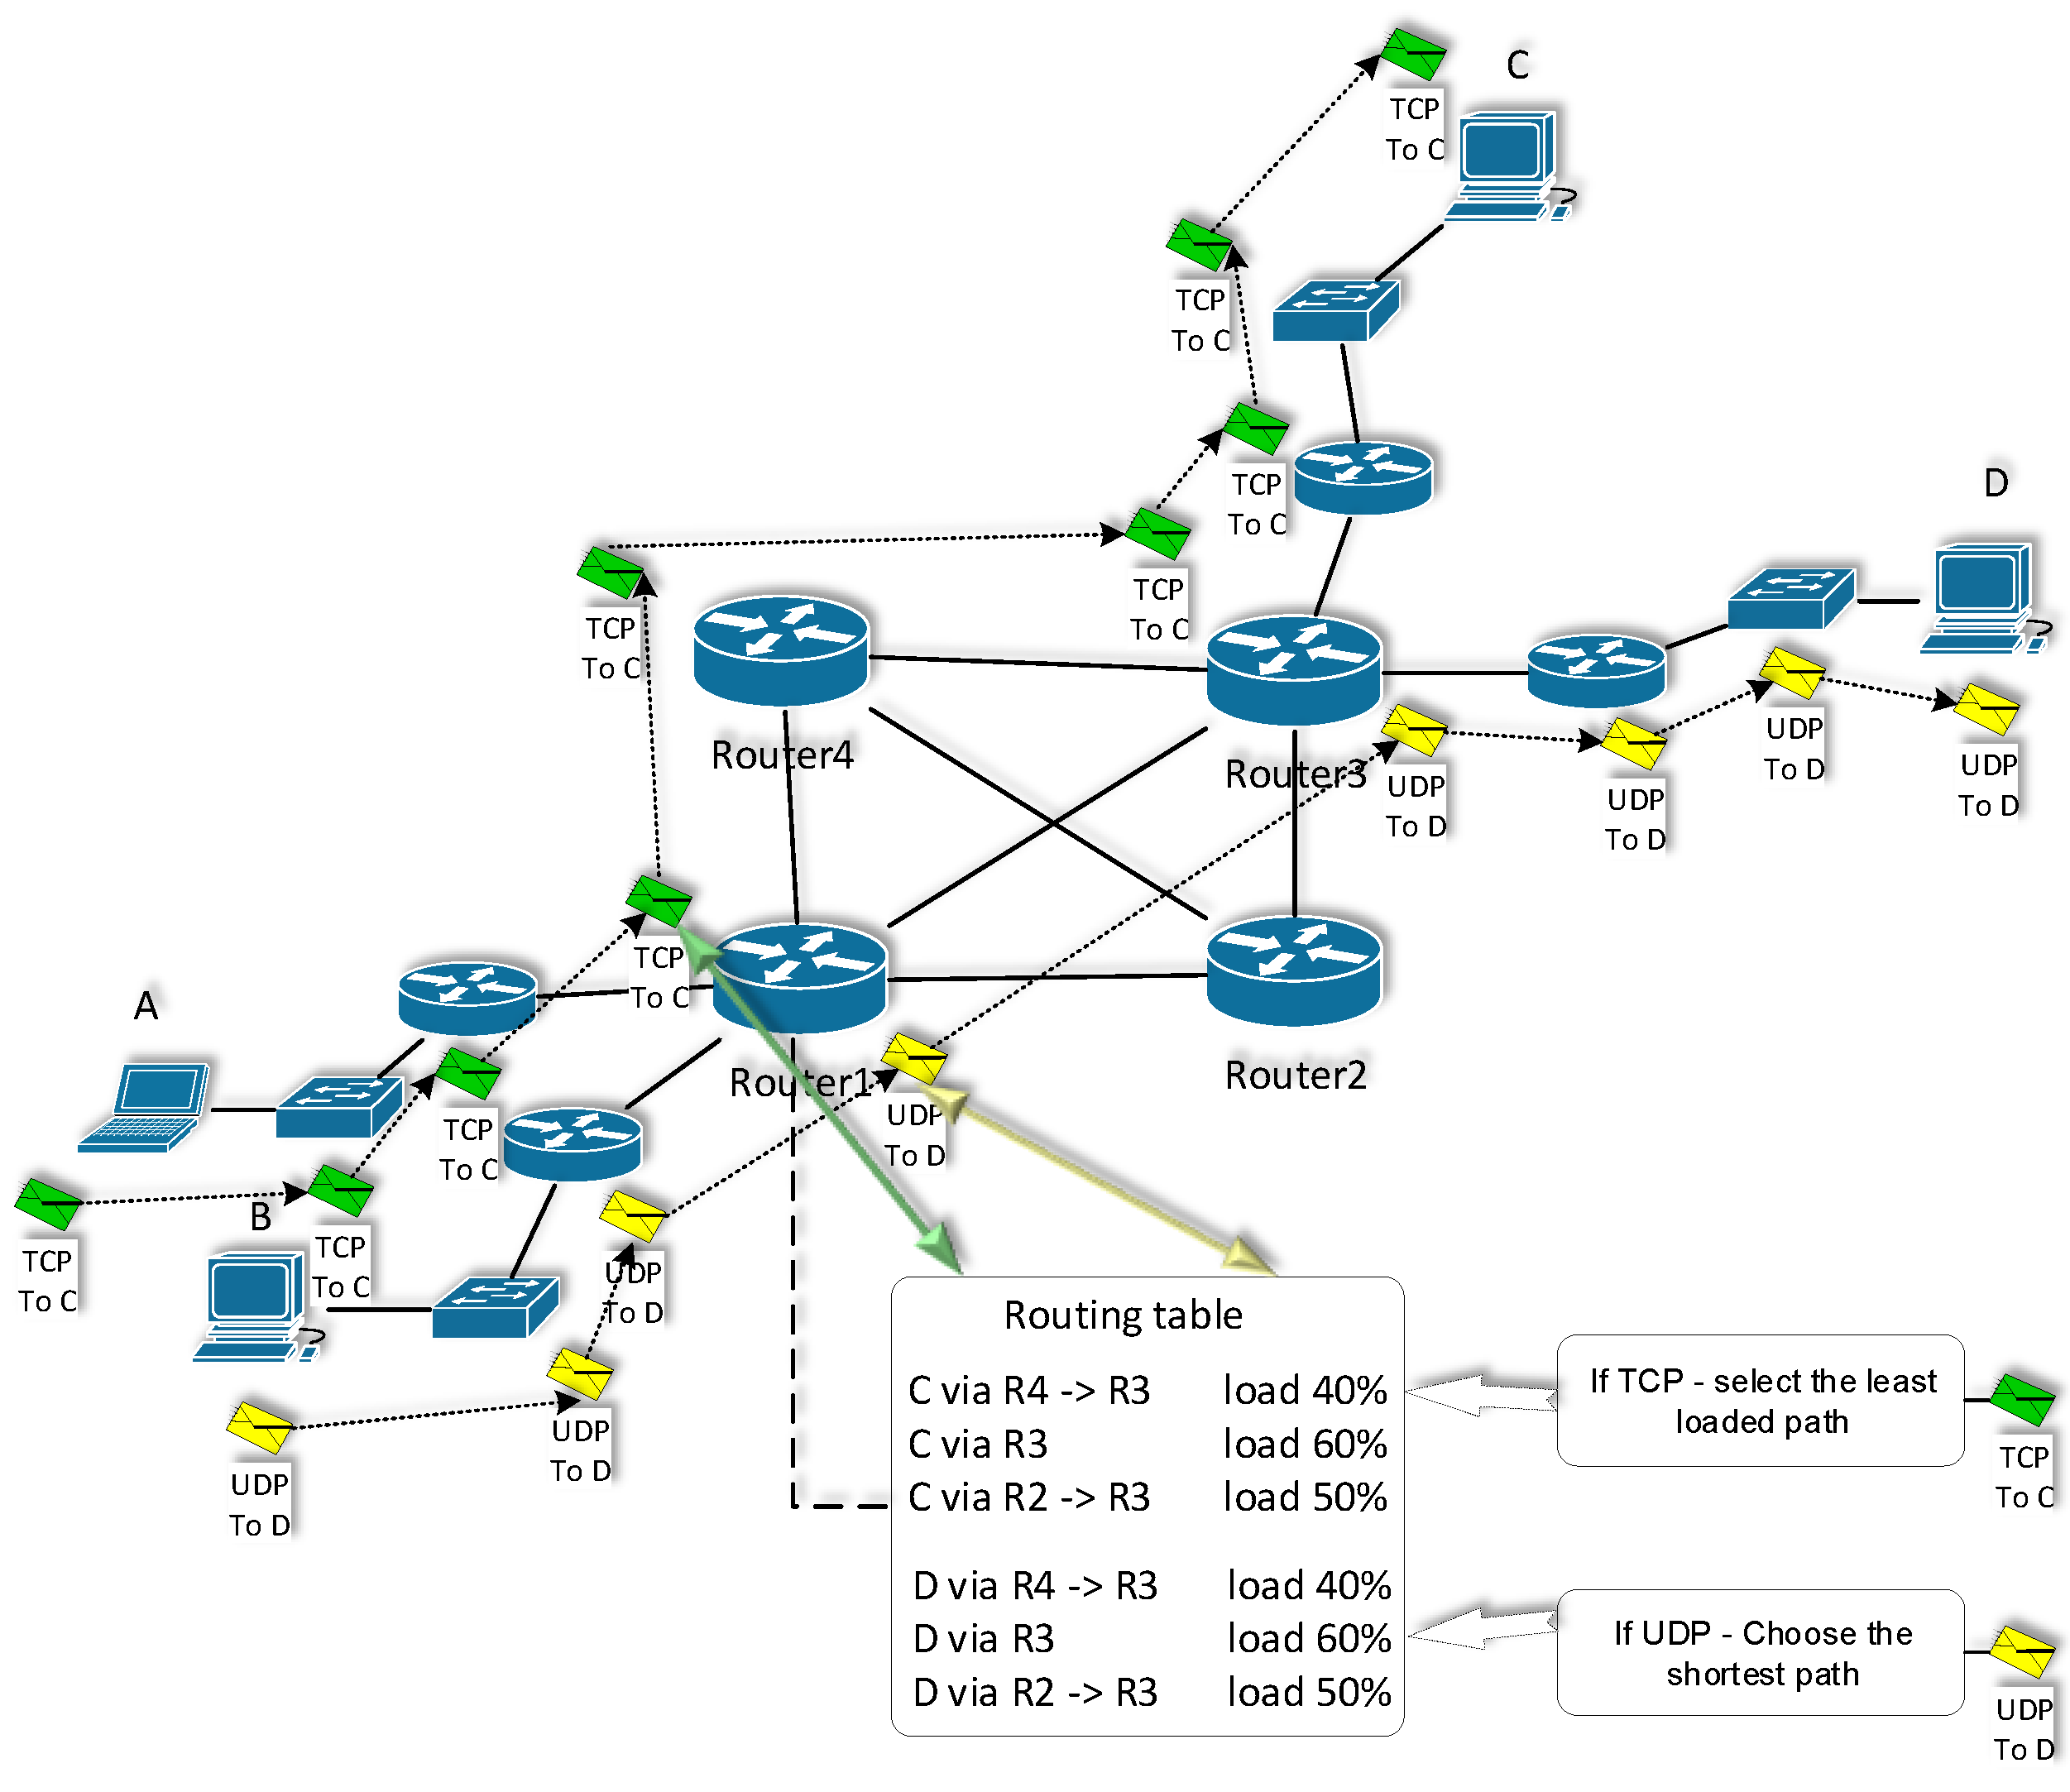
3.3. Flow Routing Techniques with Load Balancing for Future IBN
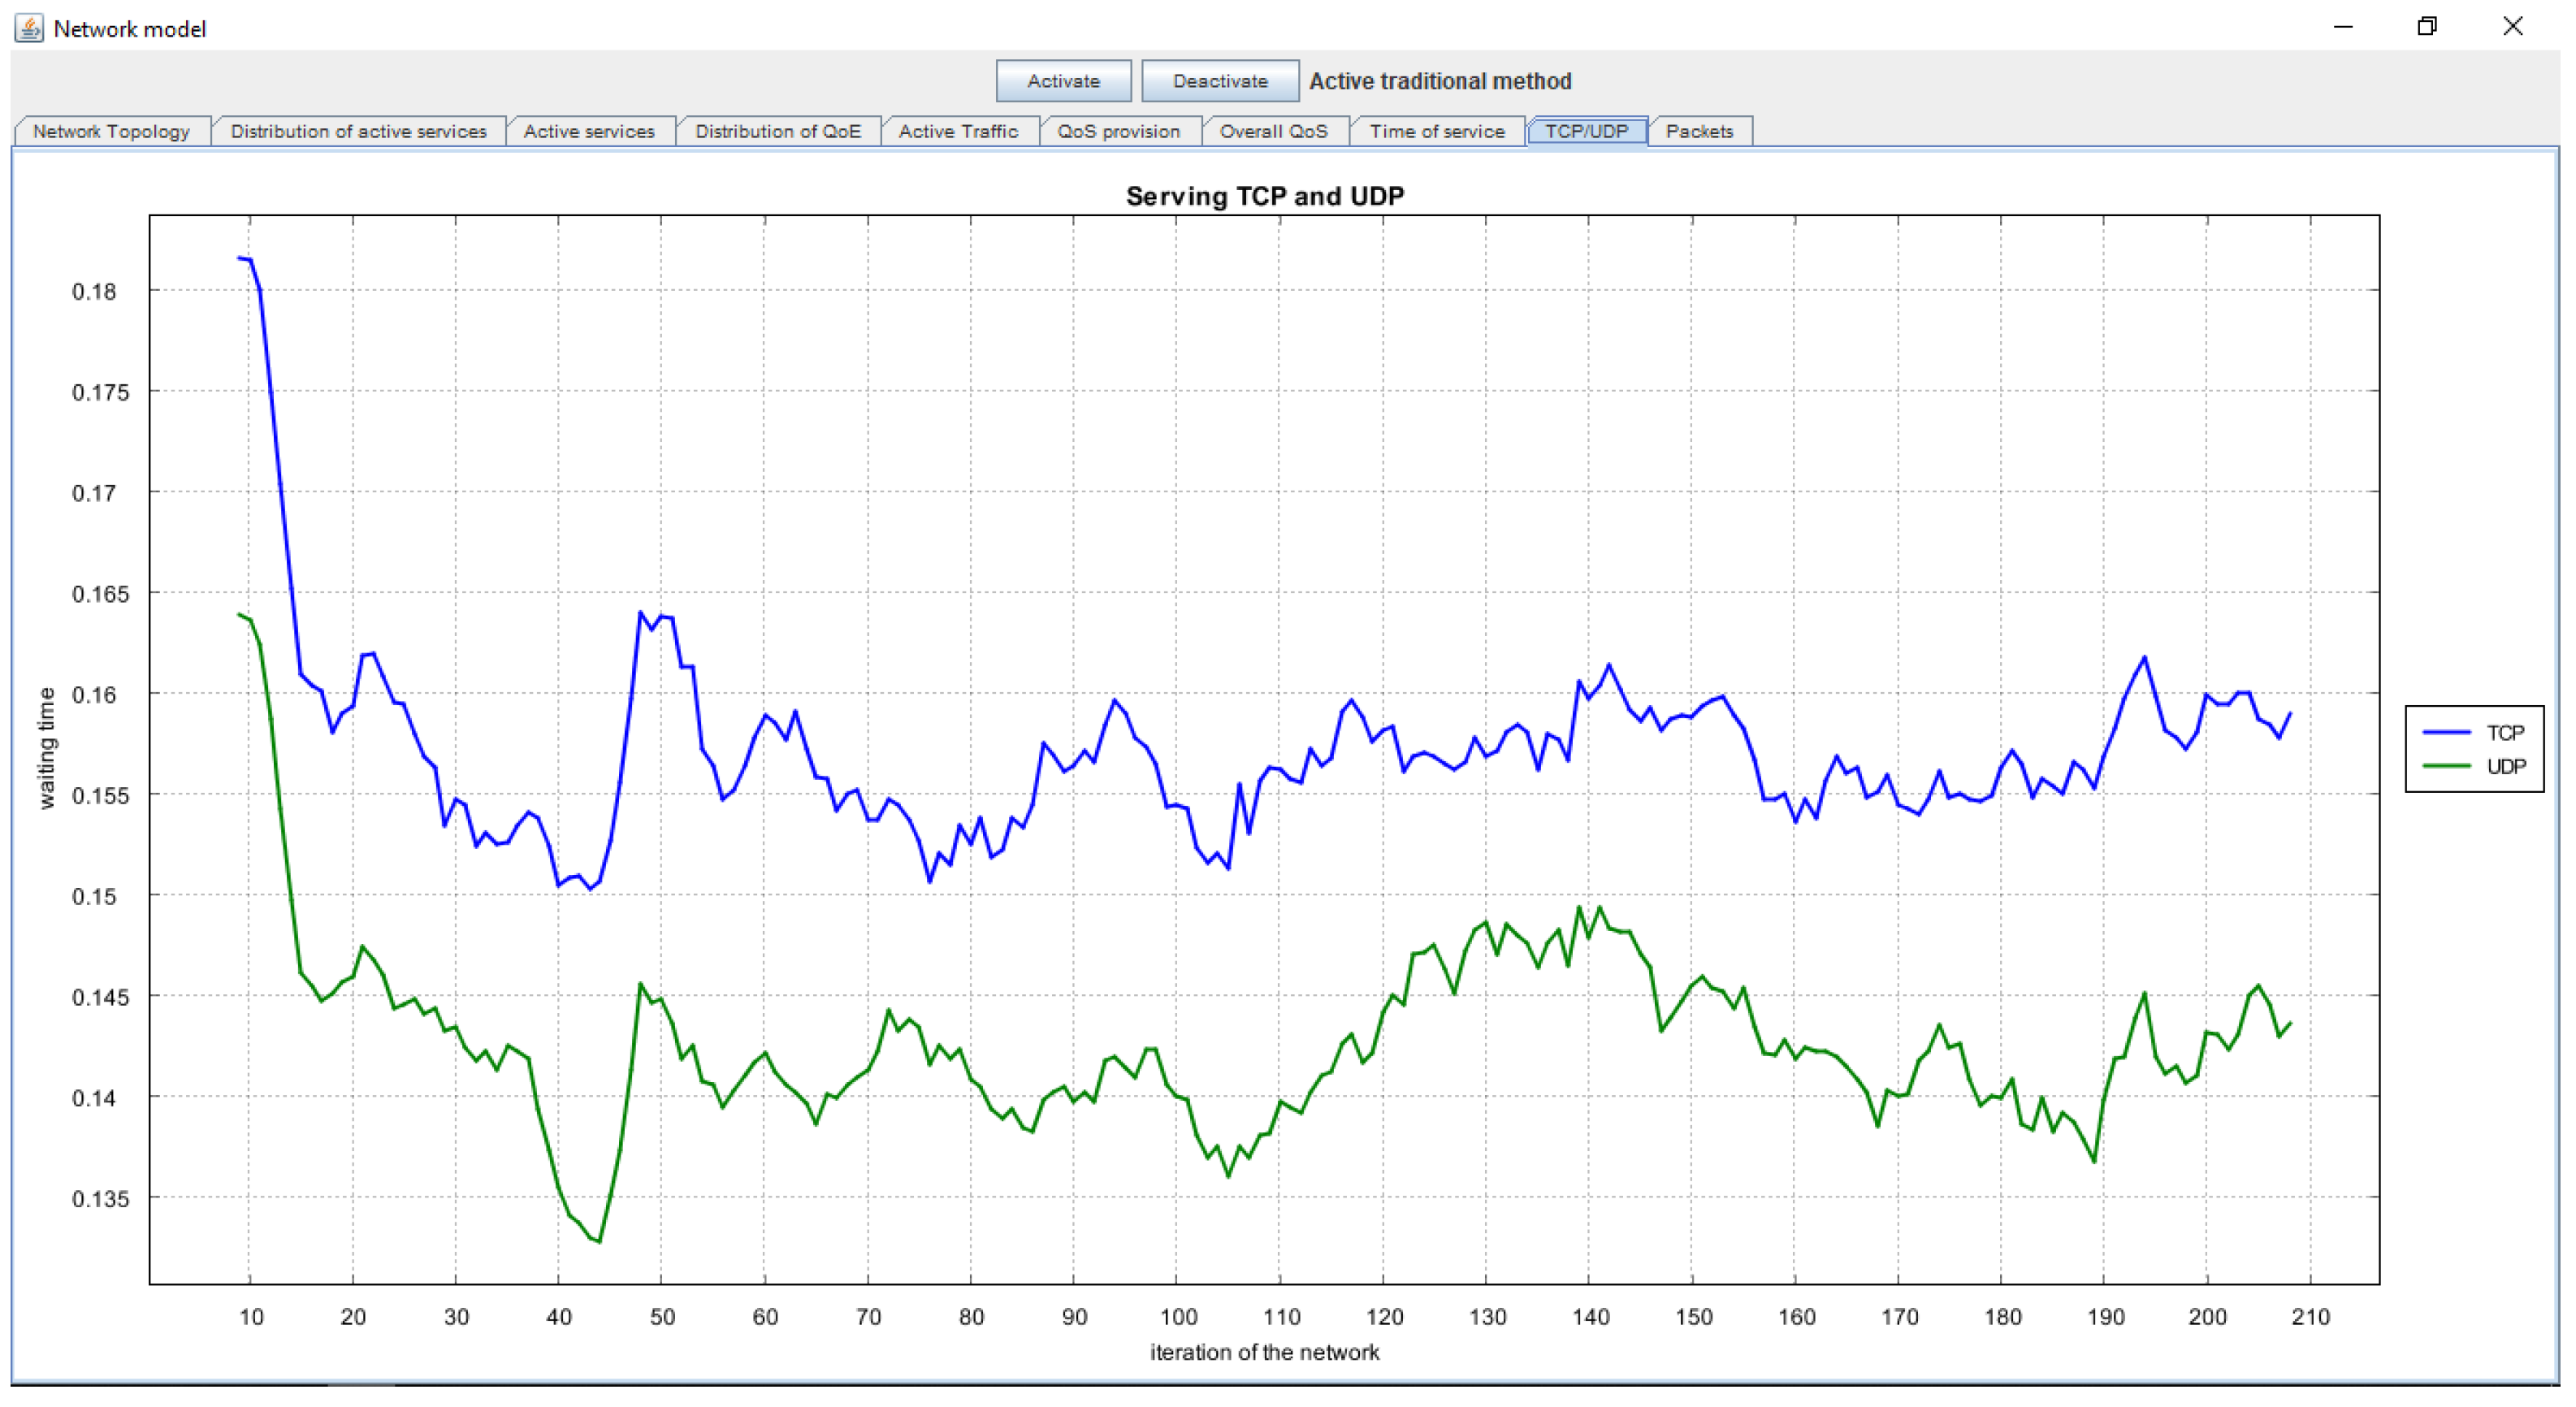
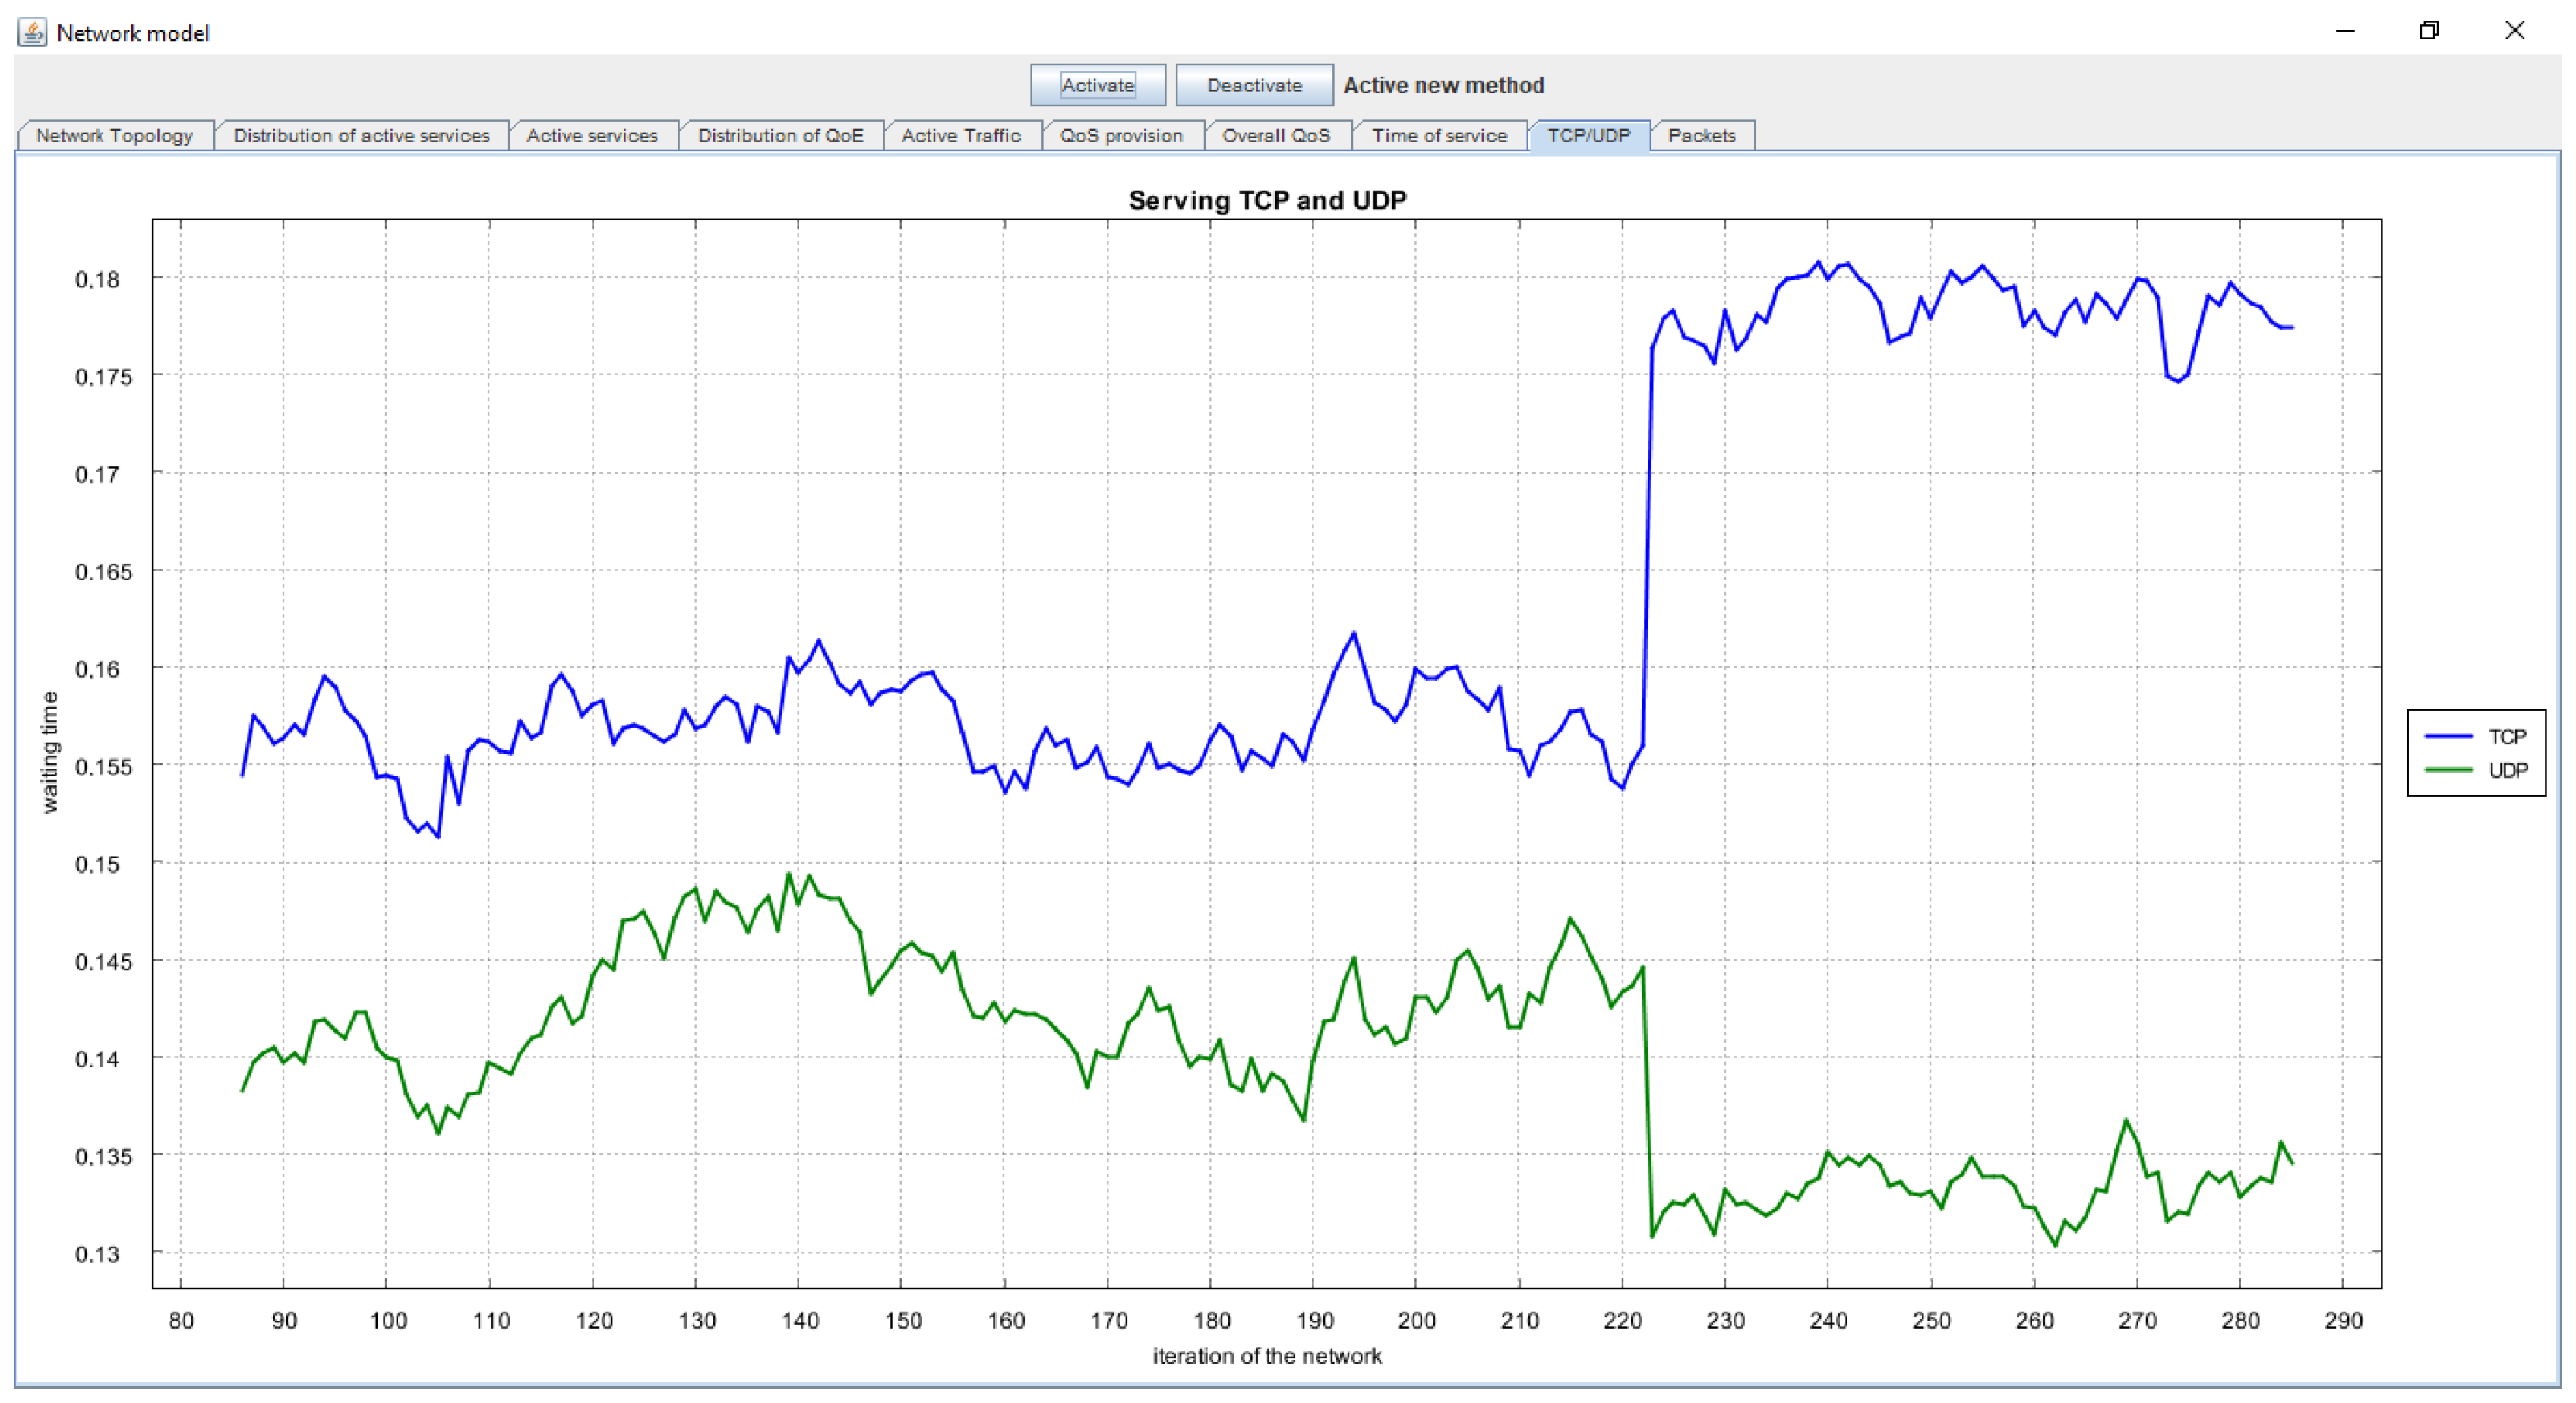
3.4. Working Principle of the New Customer-Oriented Quality Management Method in Traditional and IBN Networks
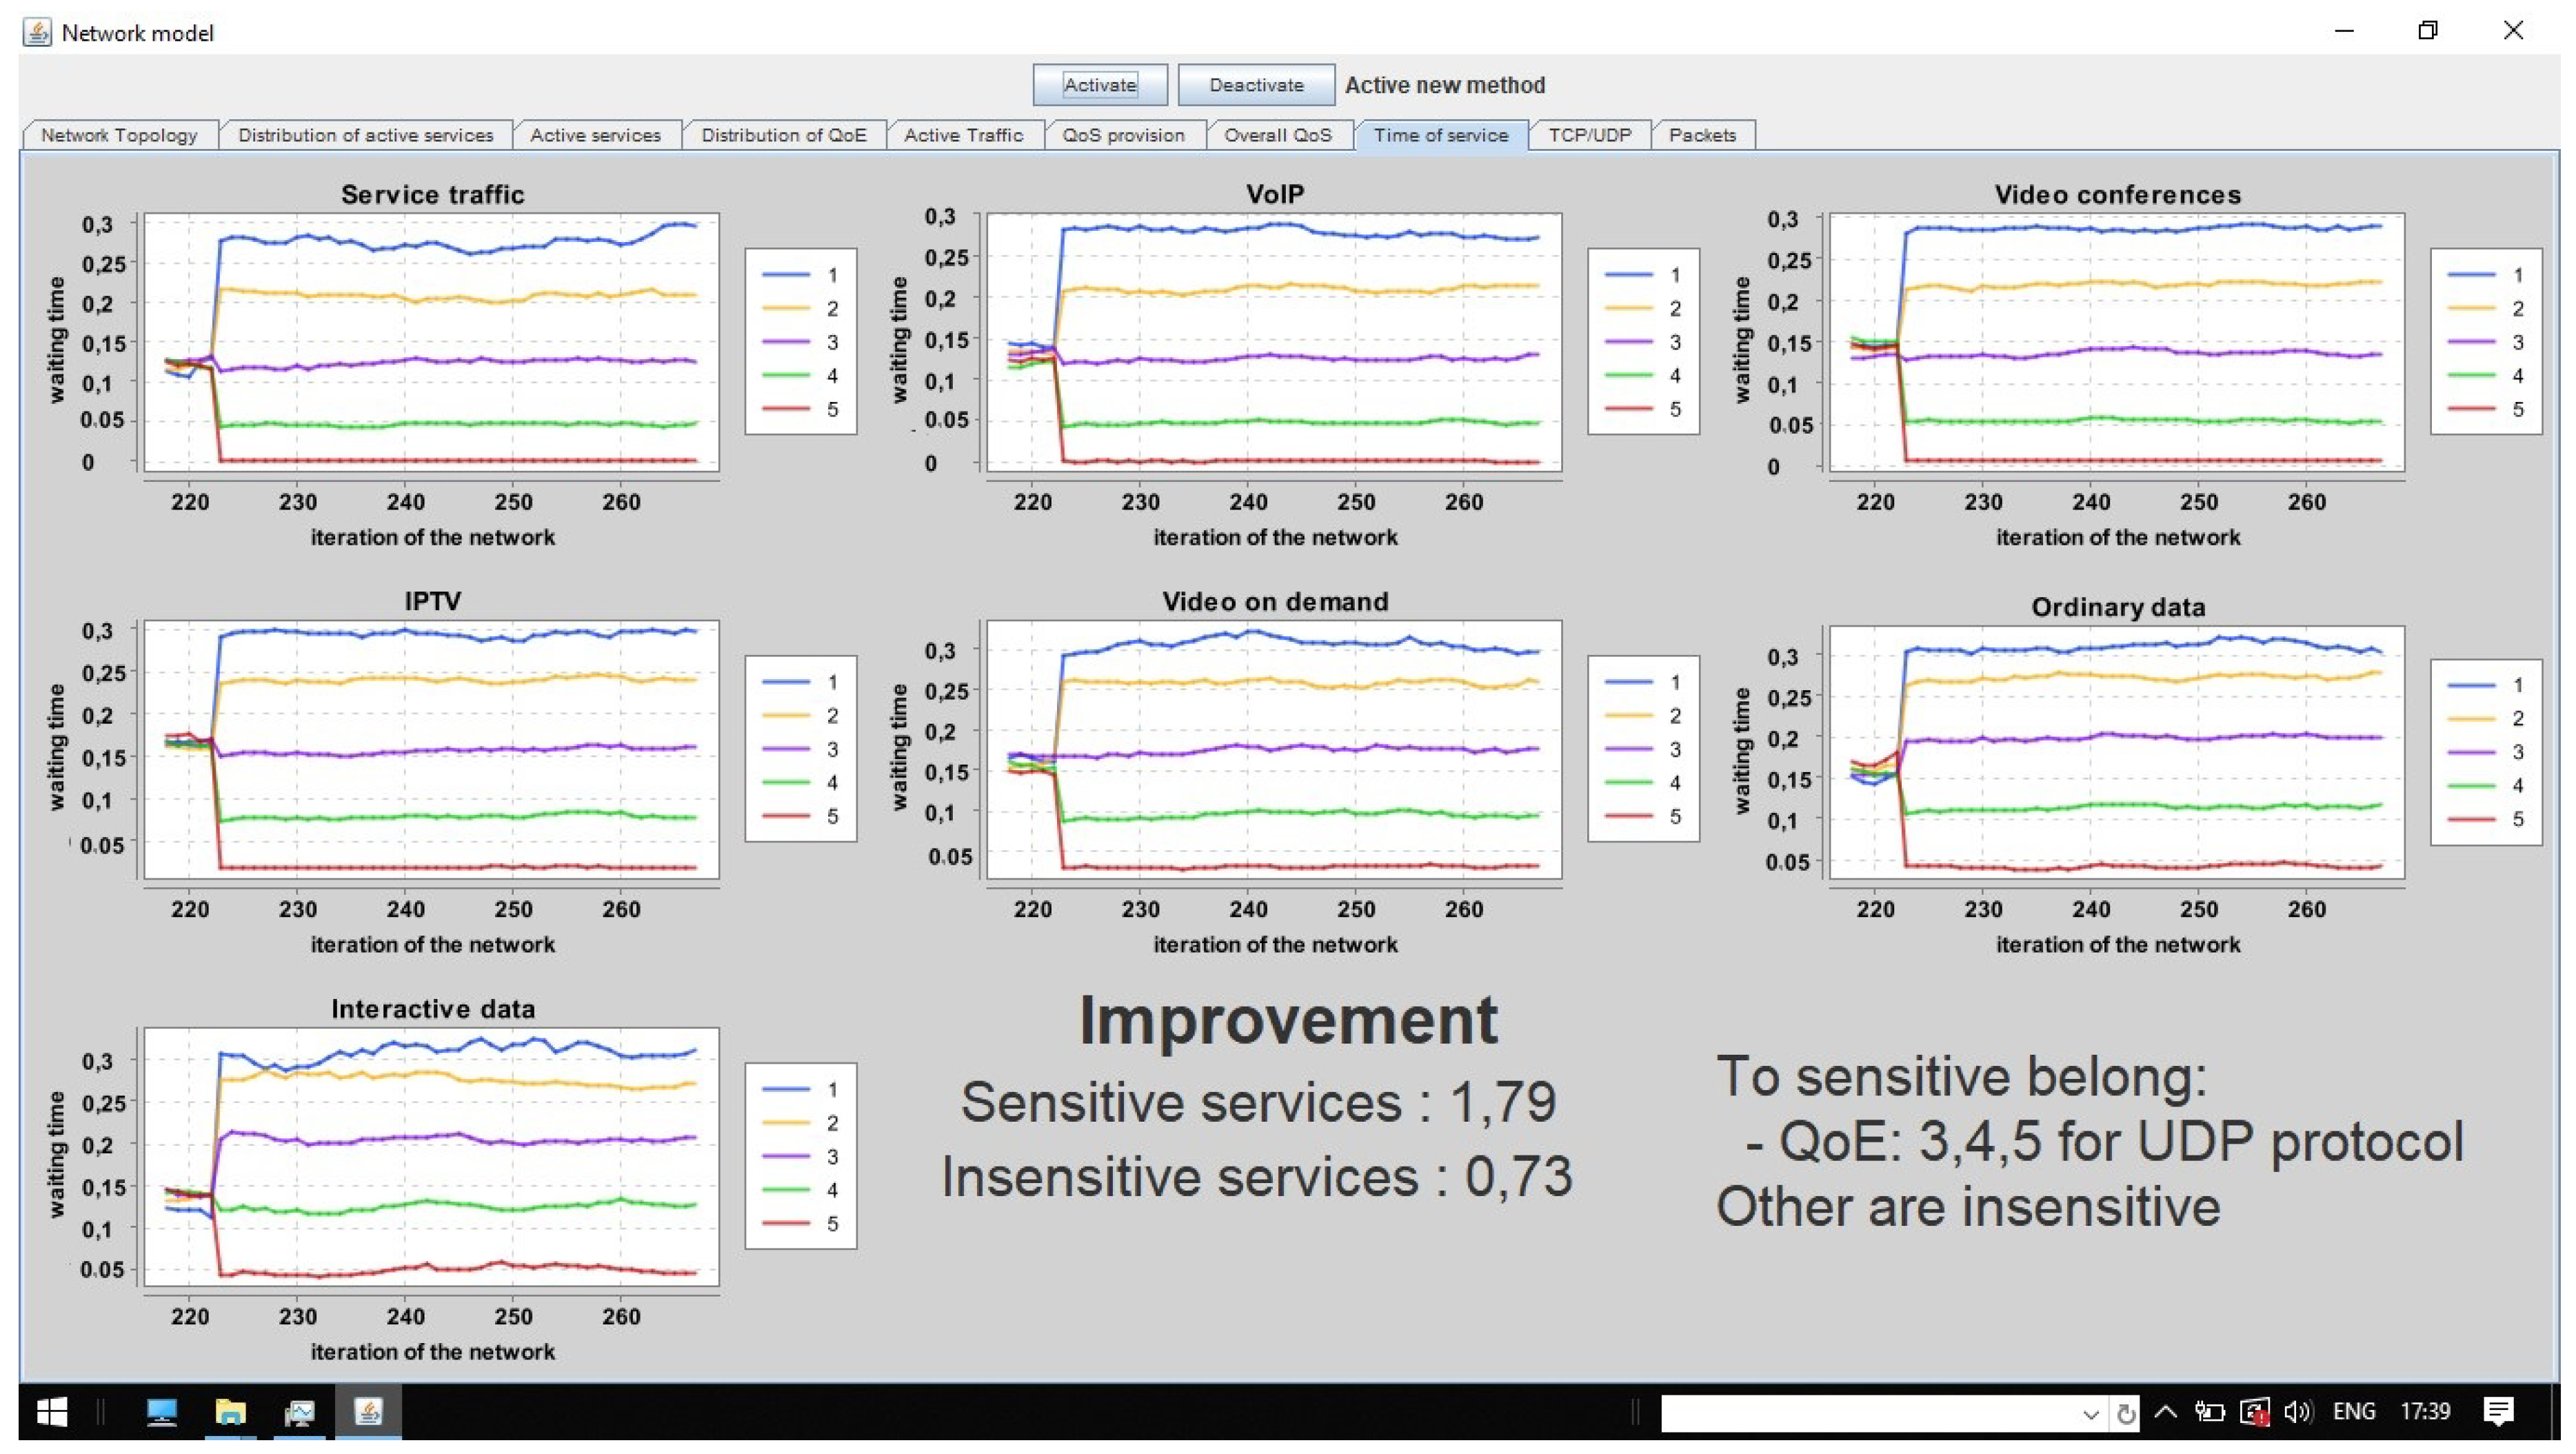
3.5. QoS Improving with IBN Controller
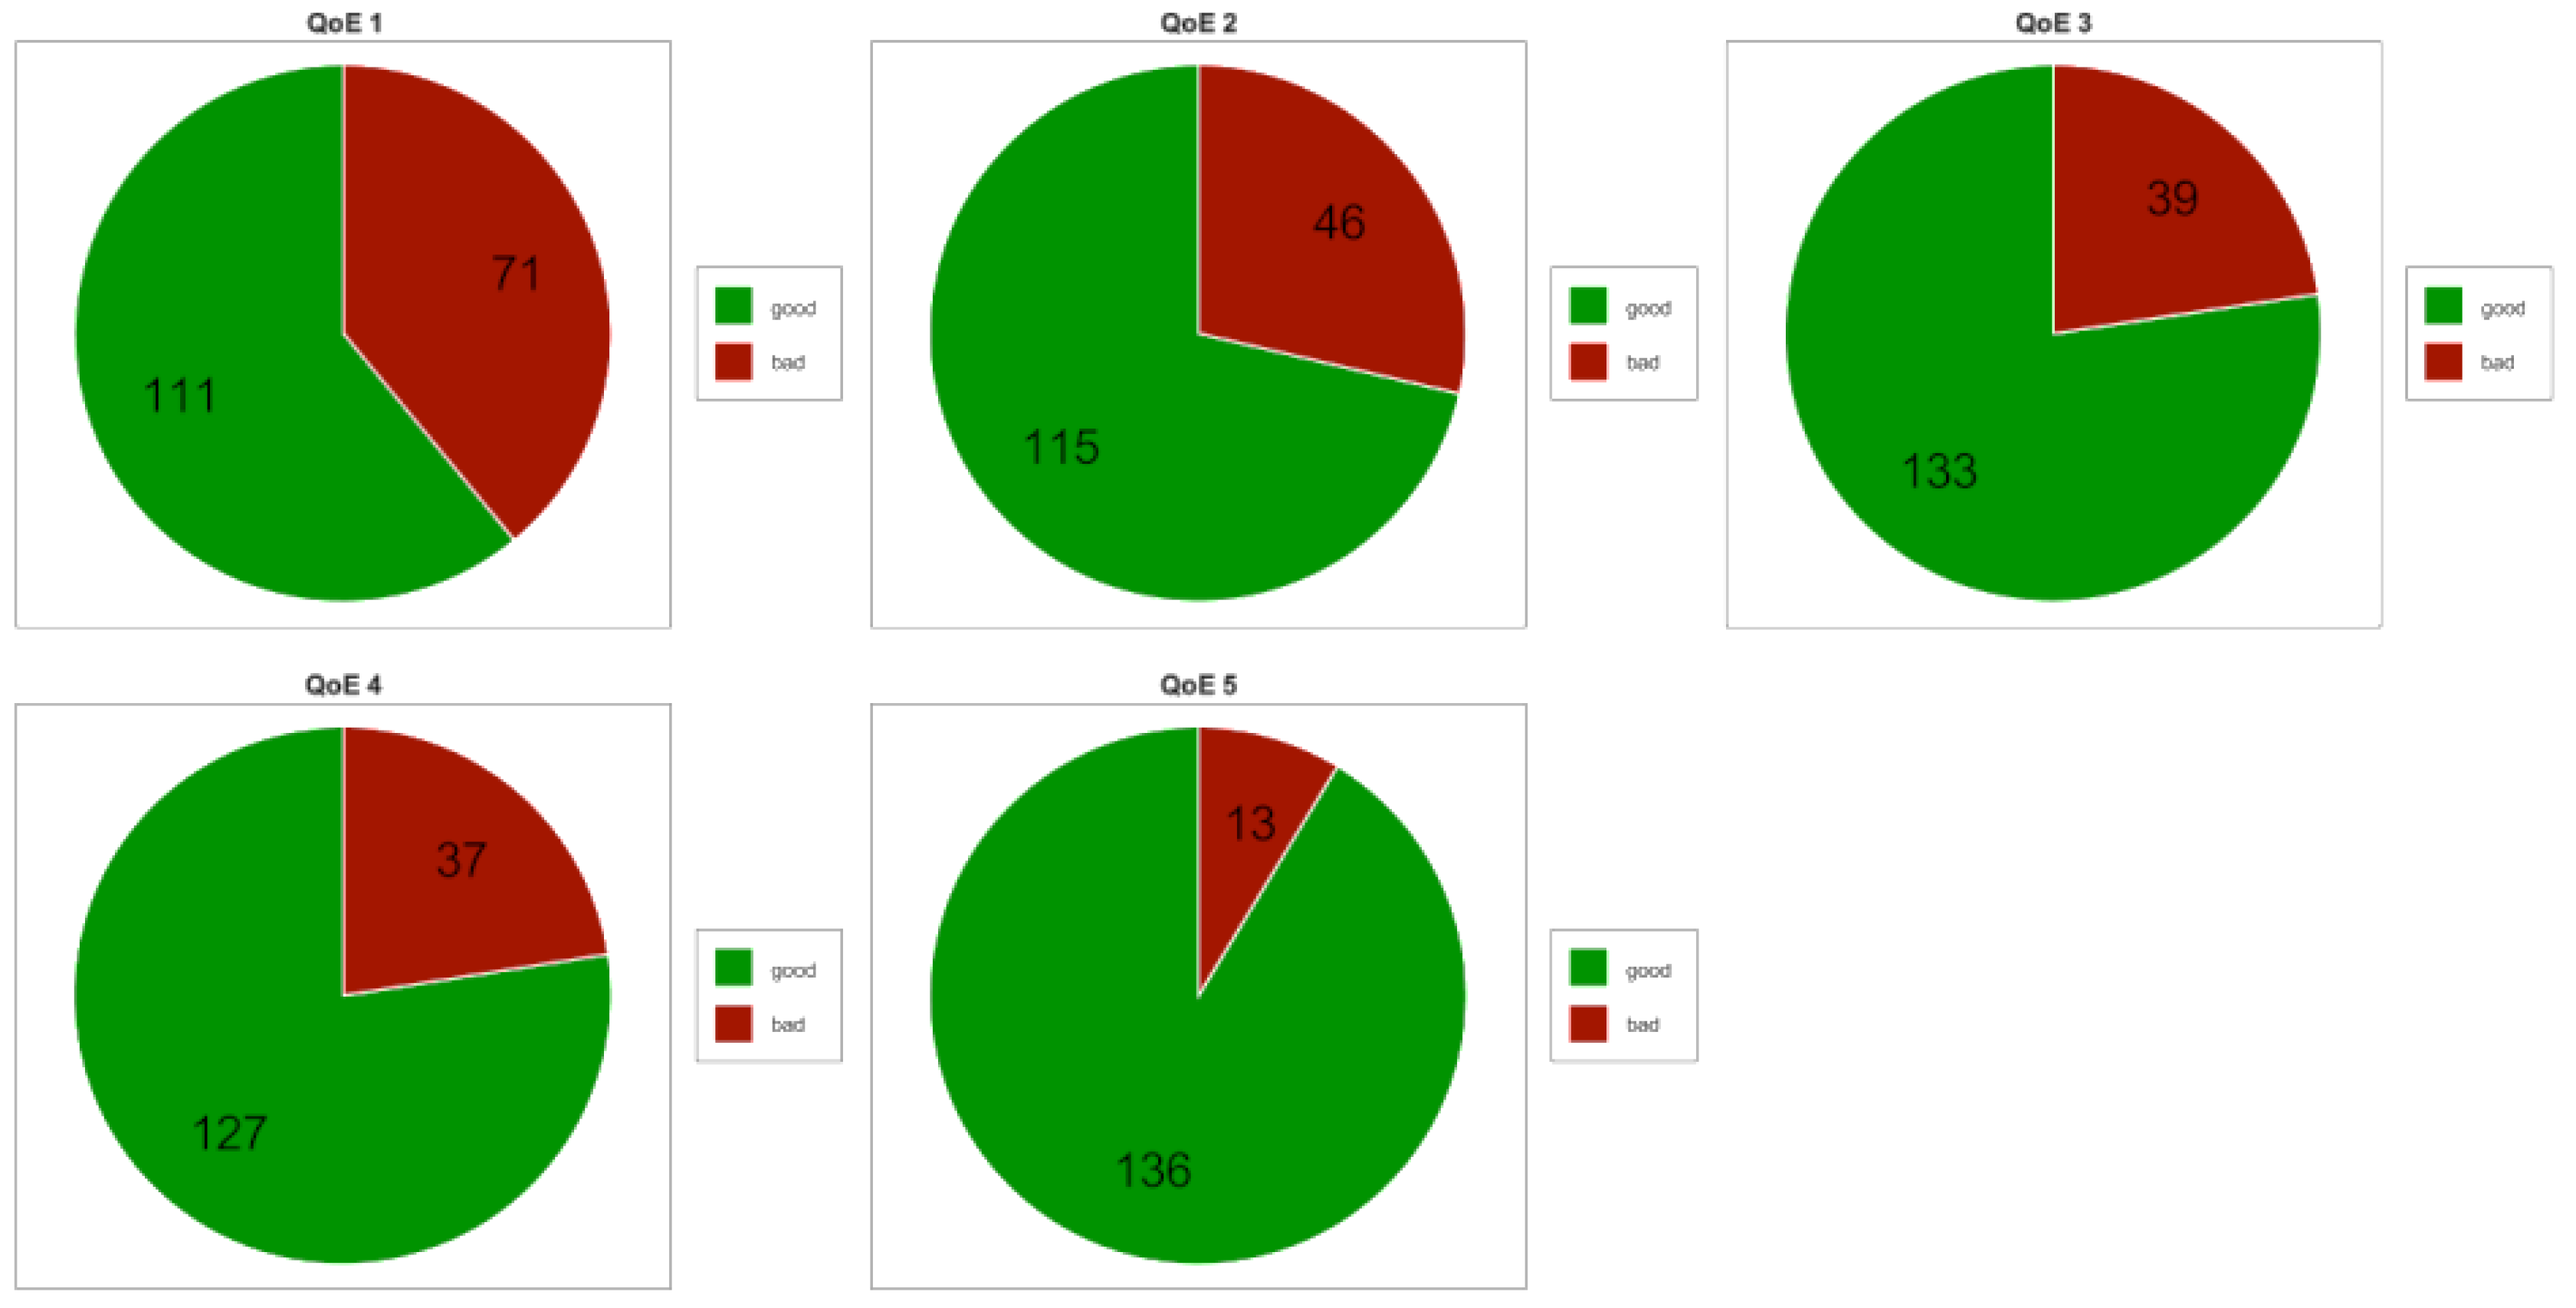
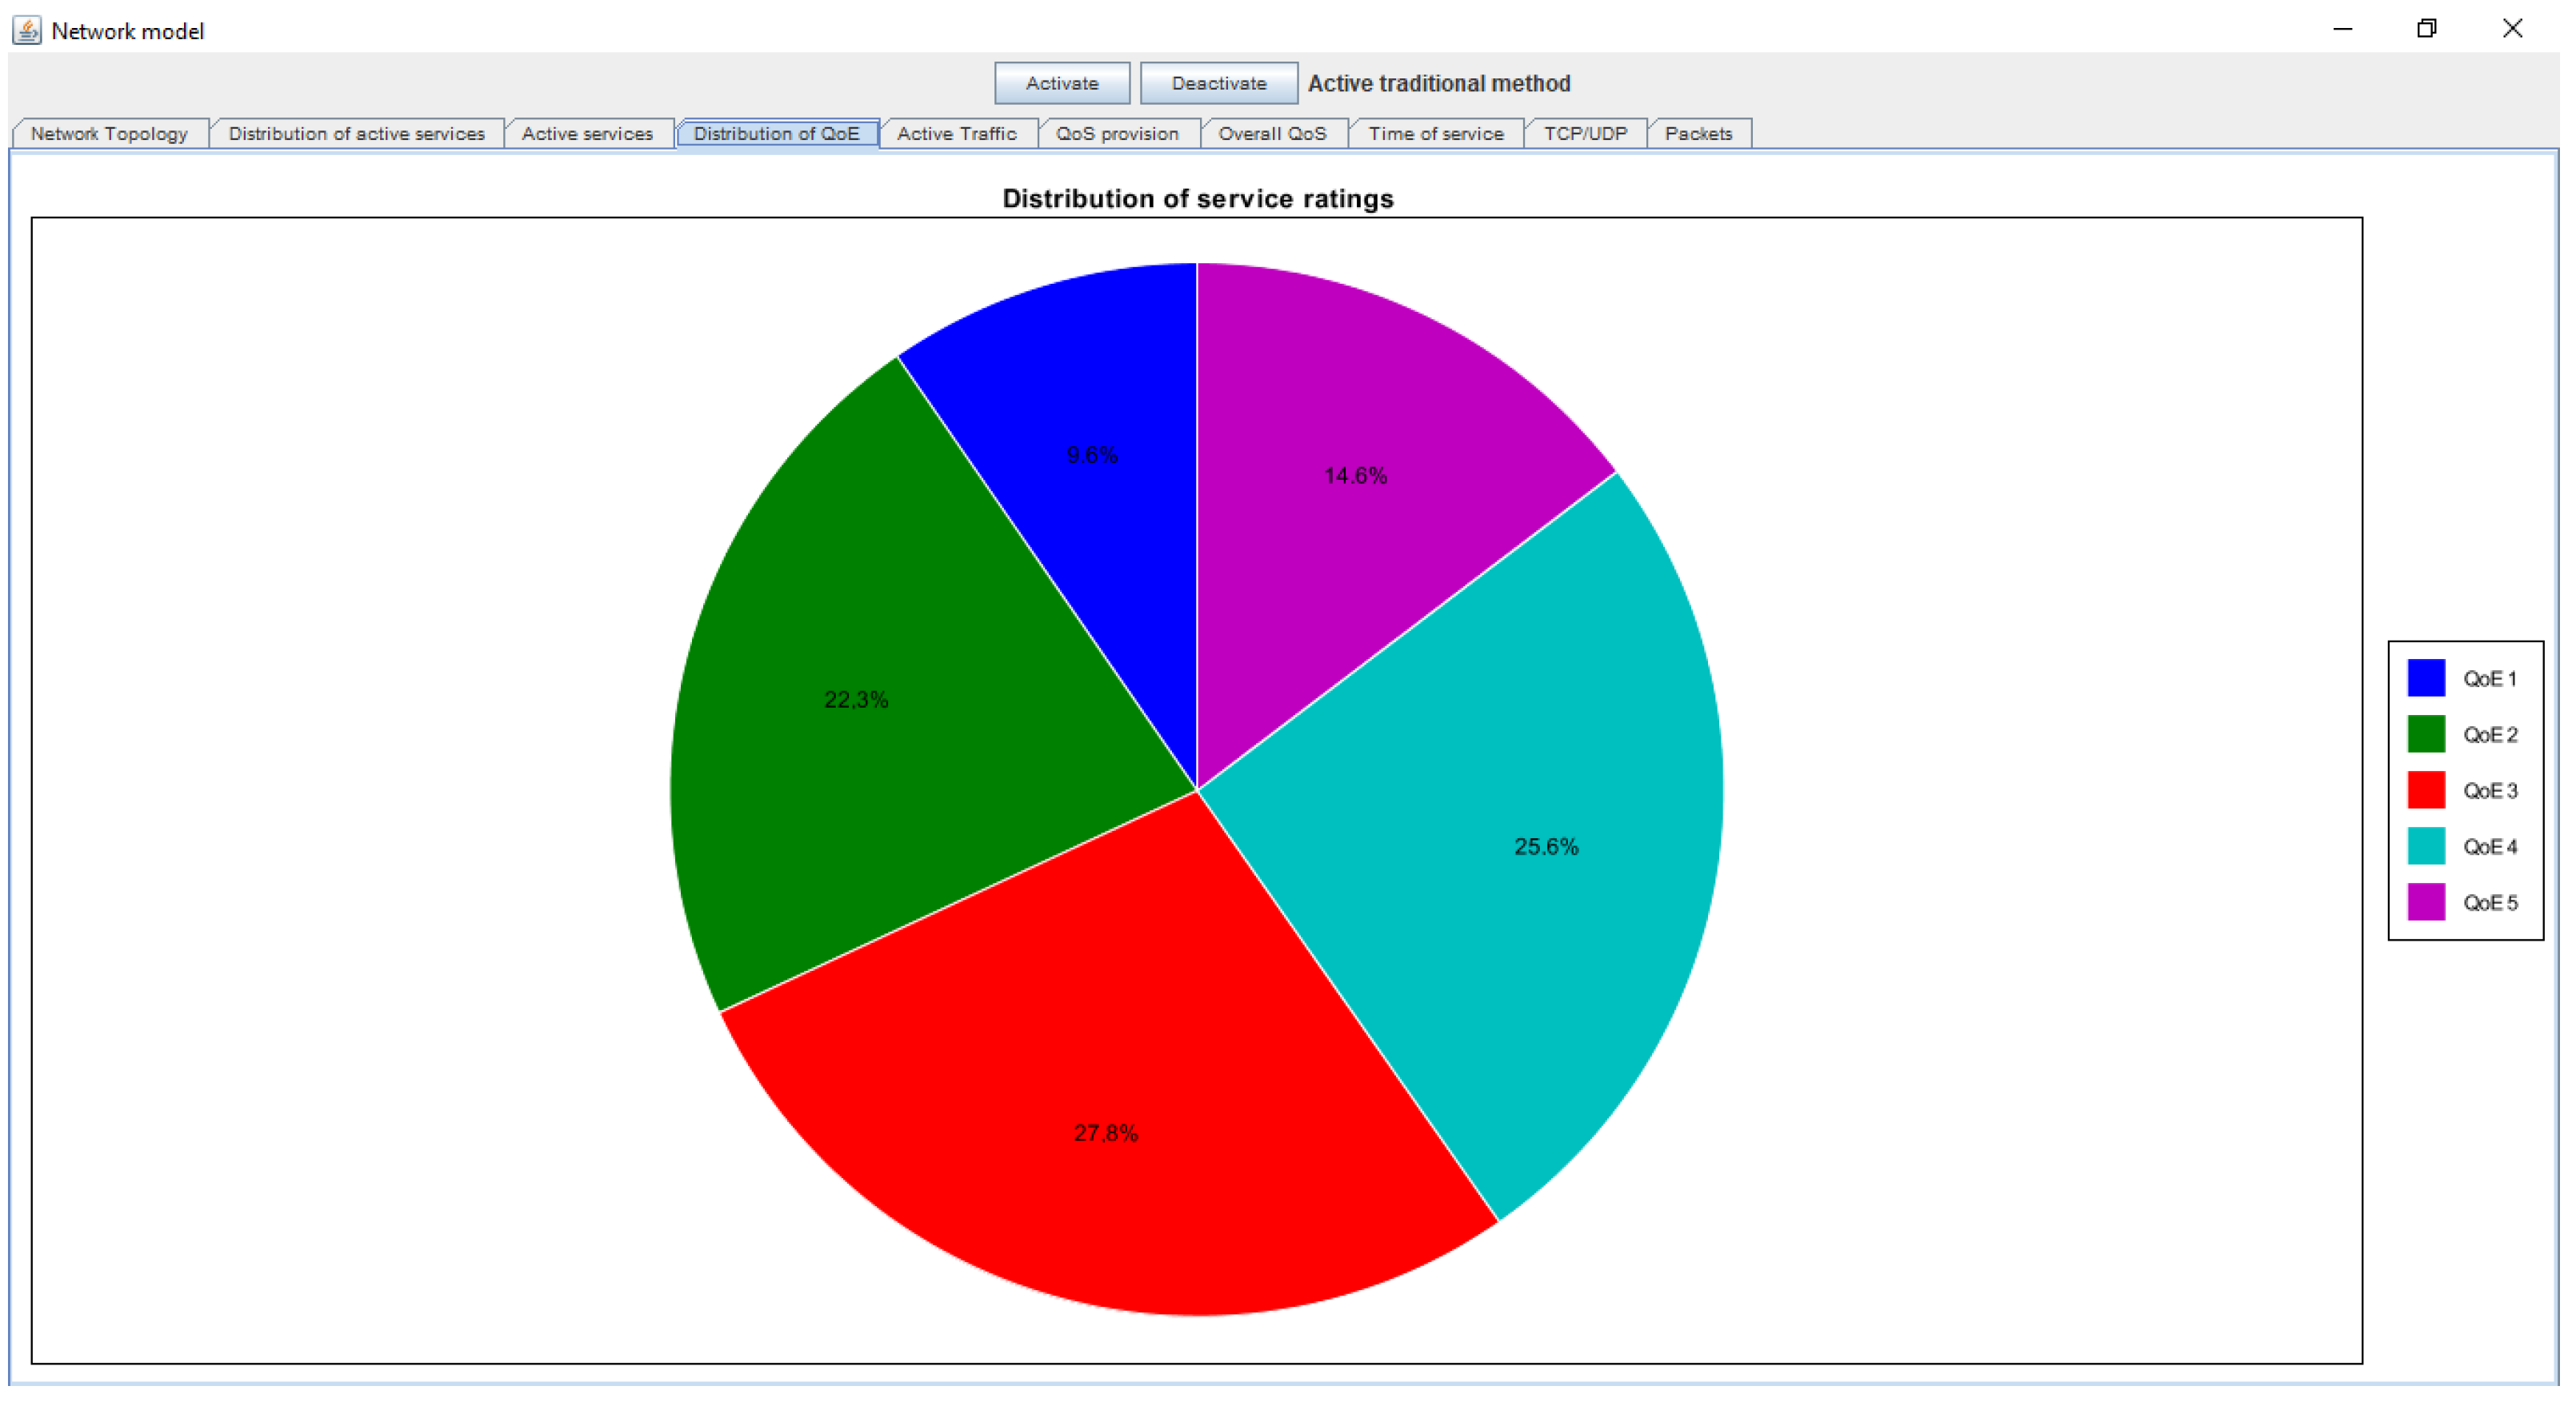
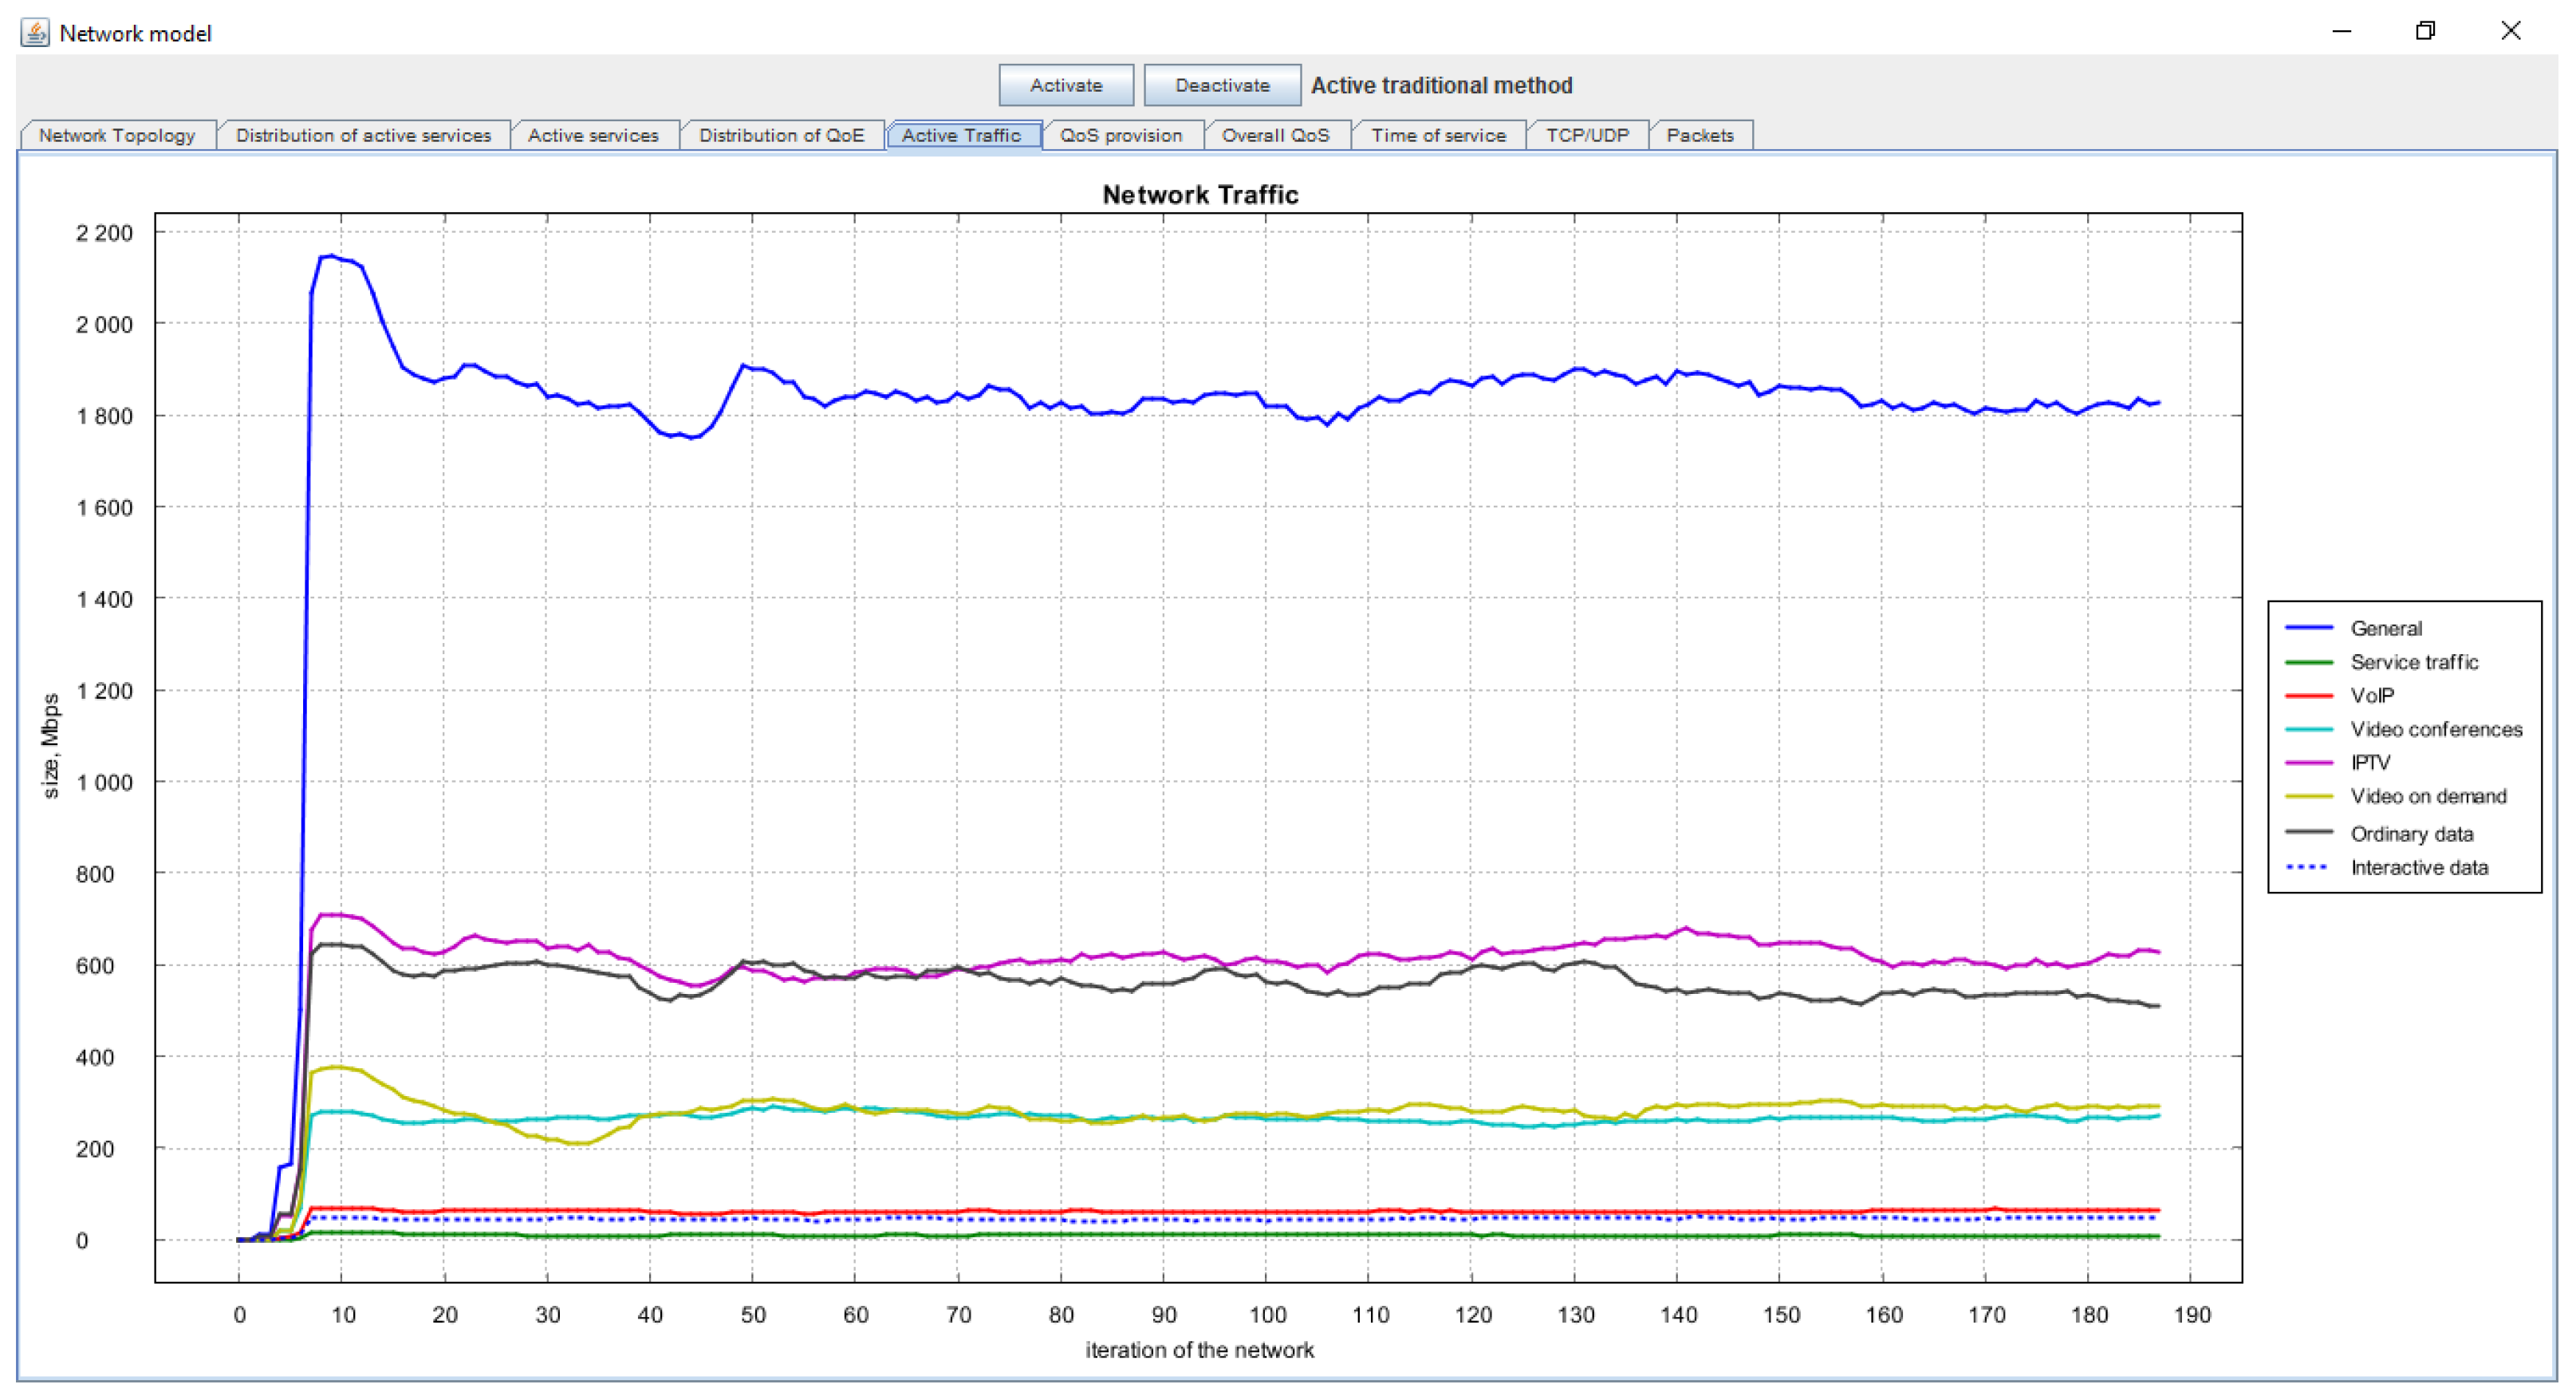
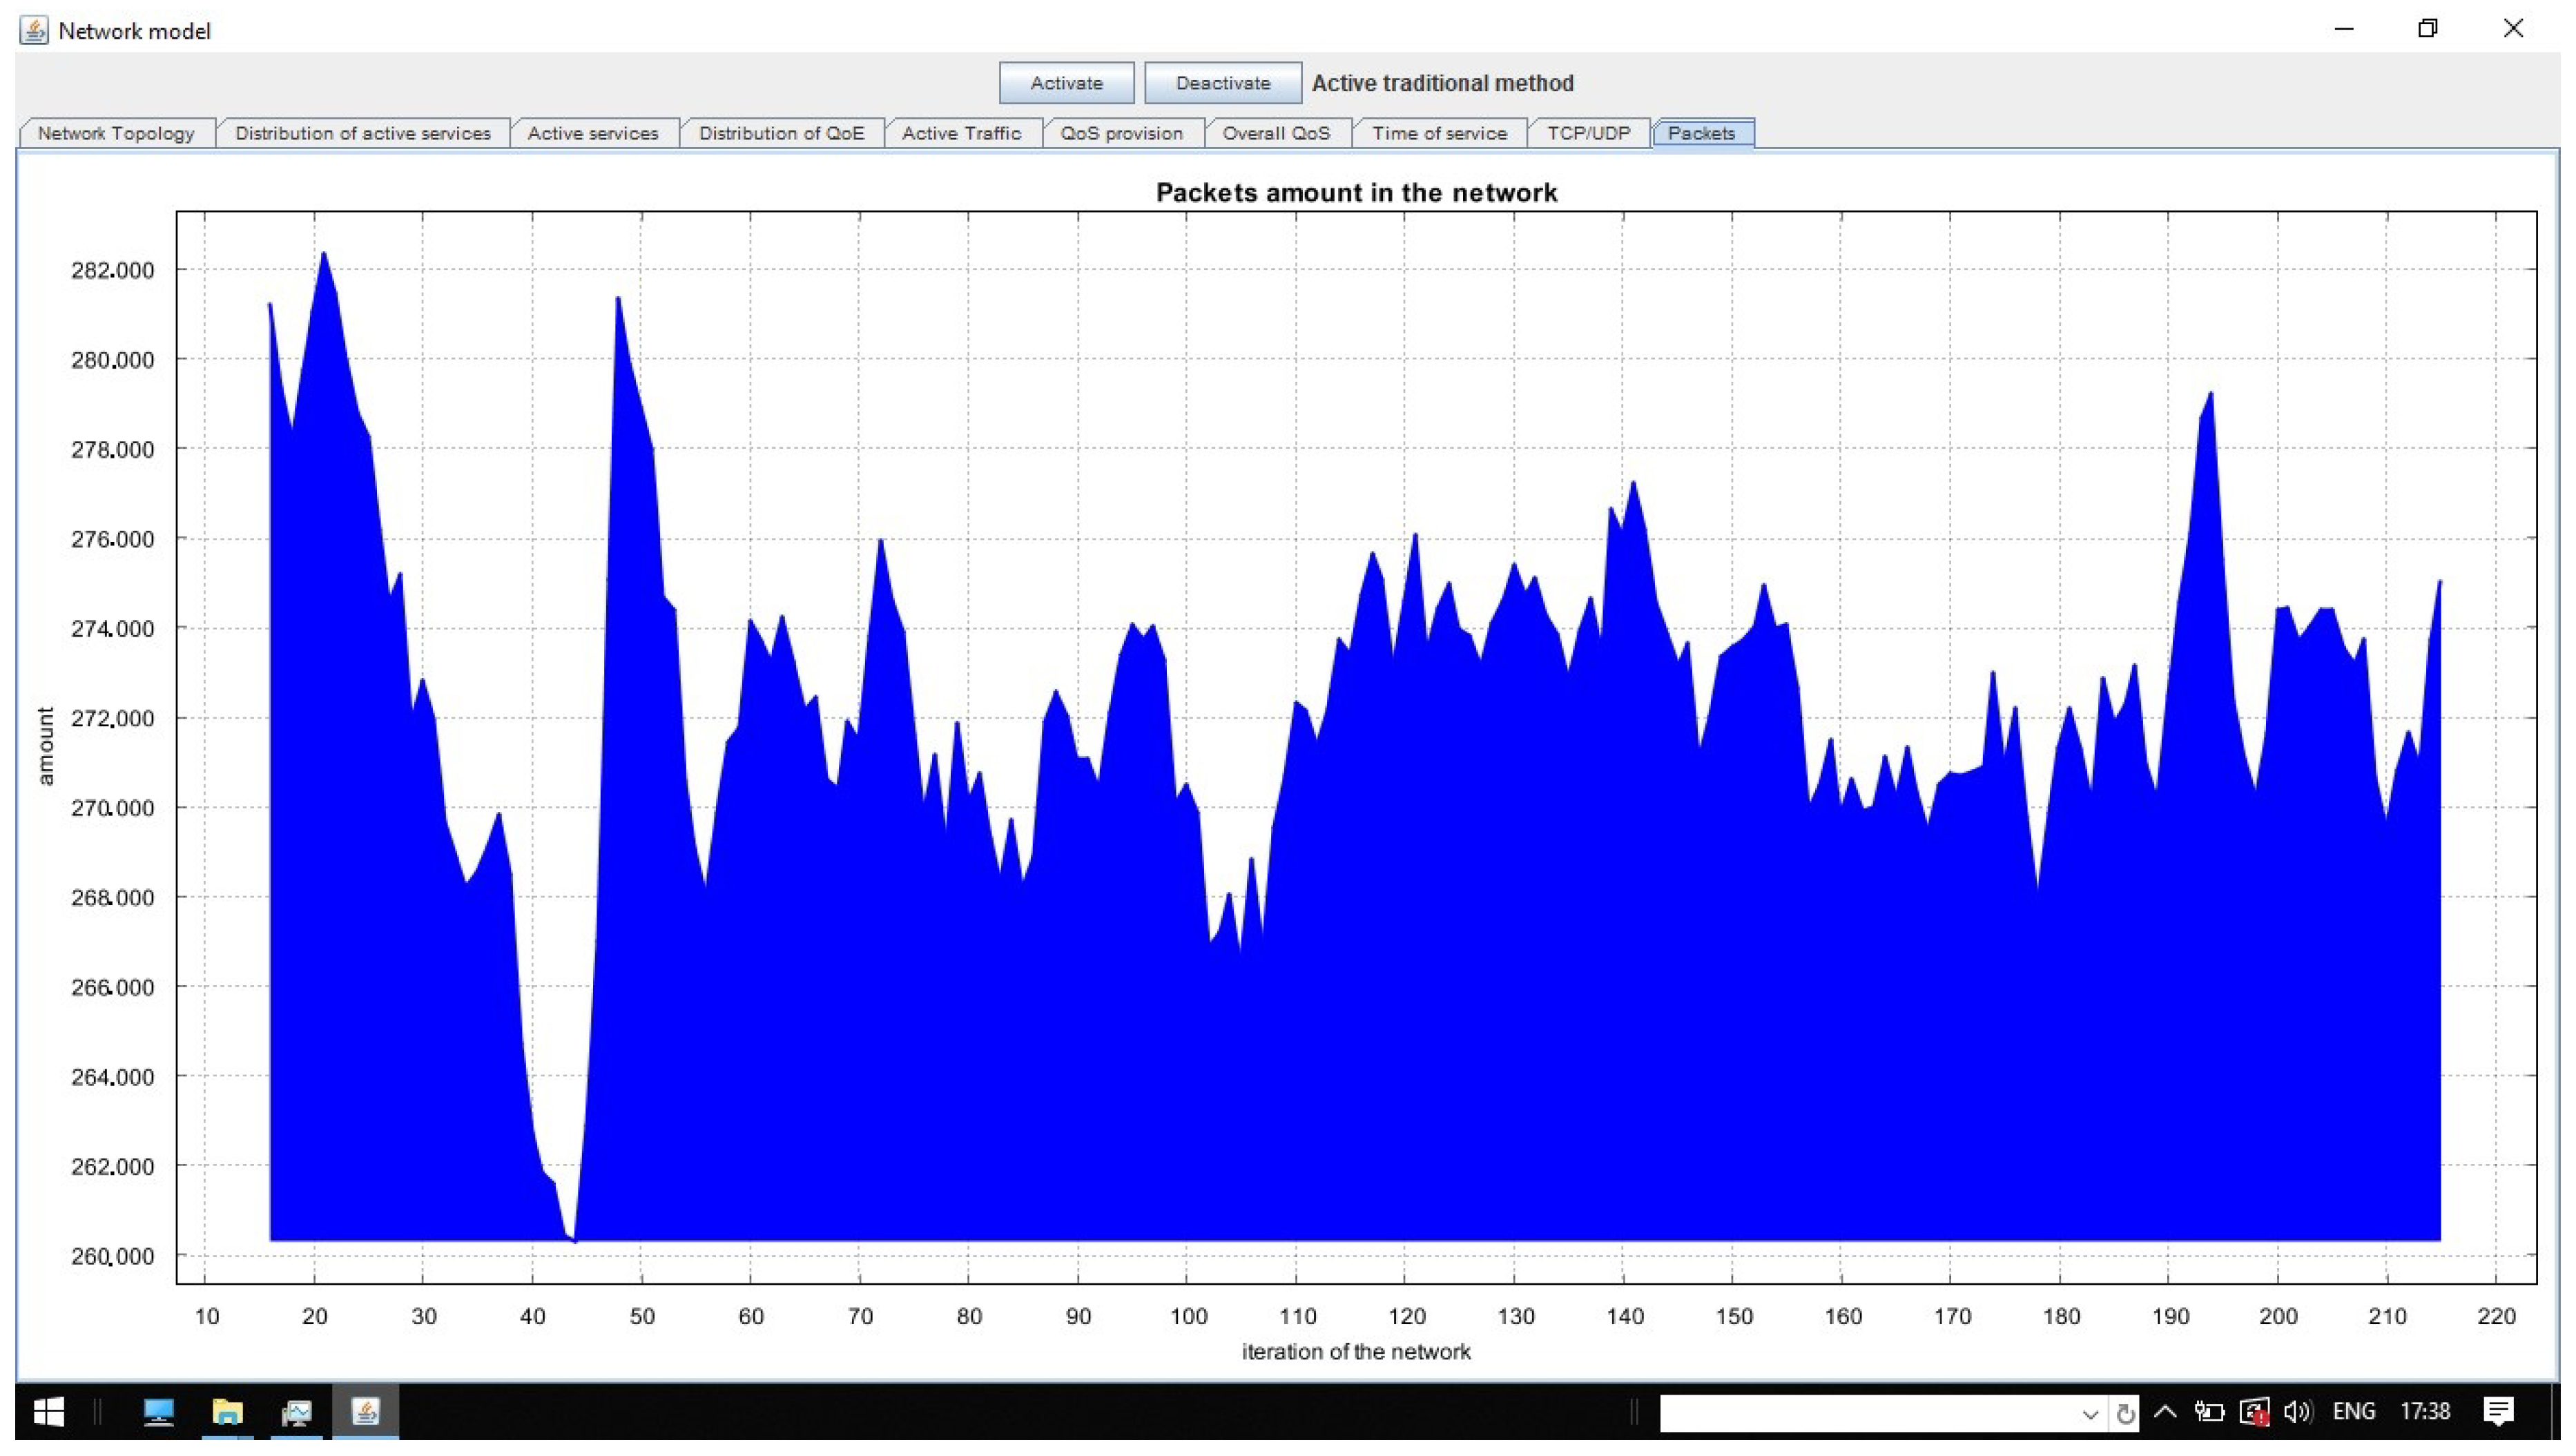
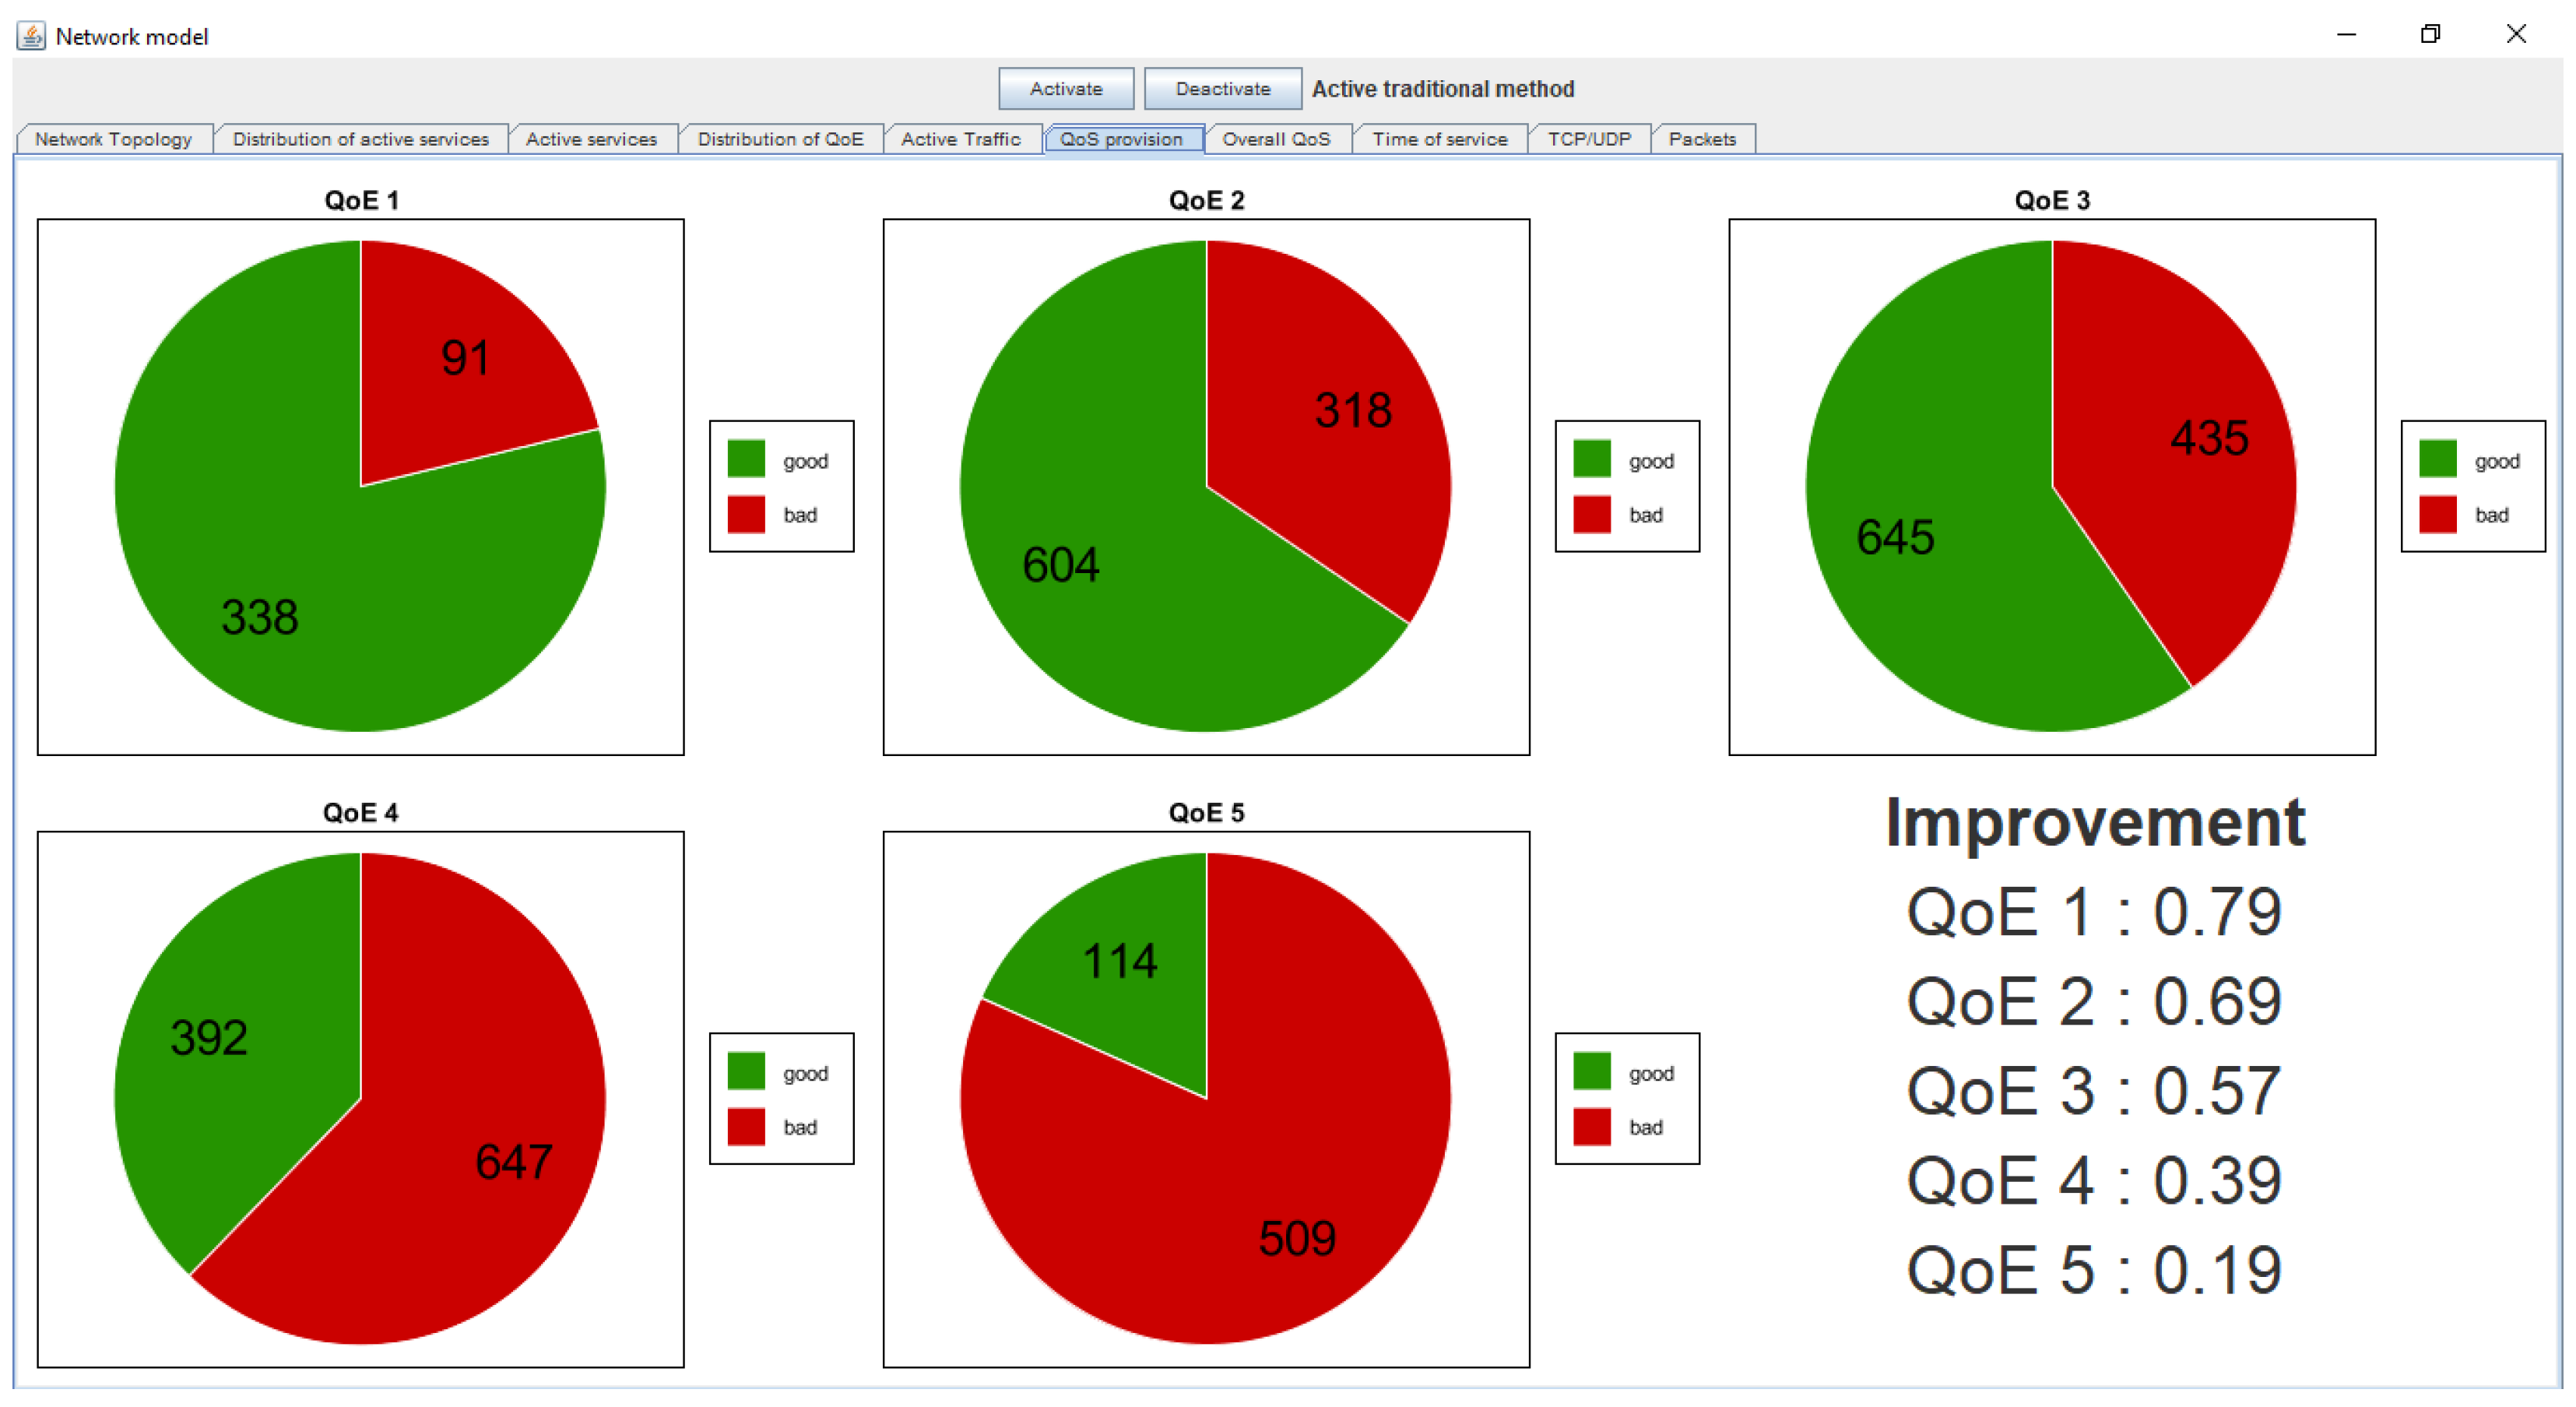
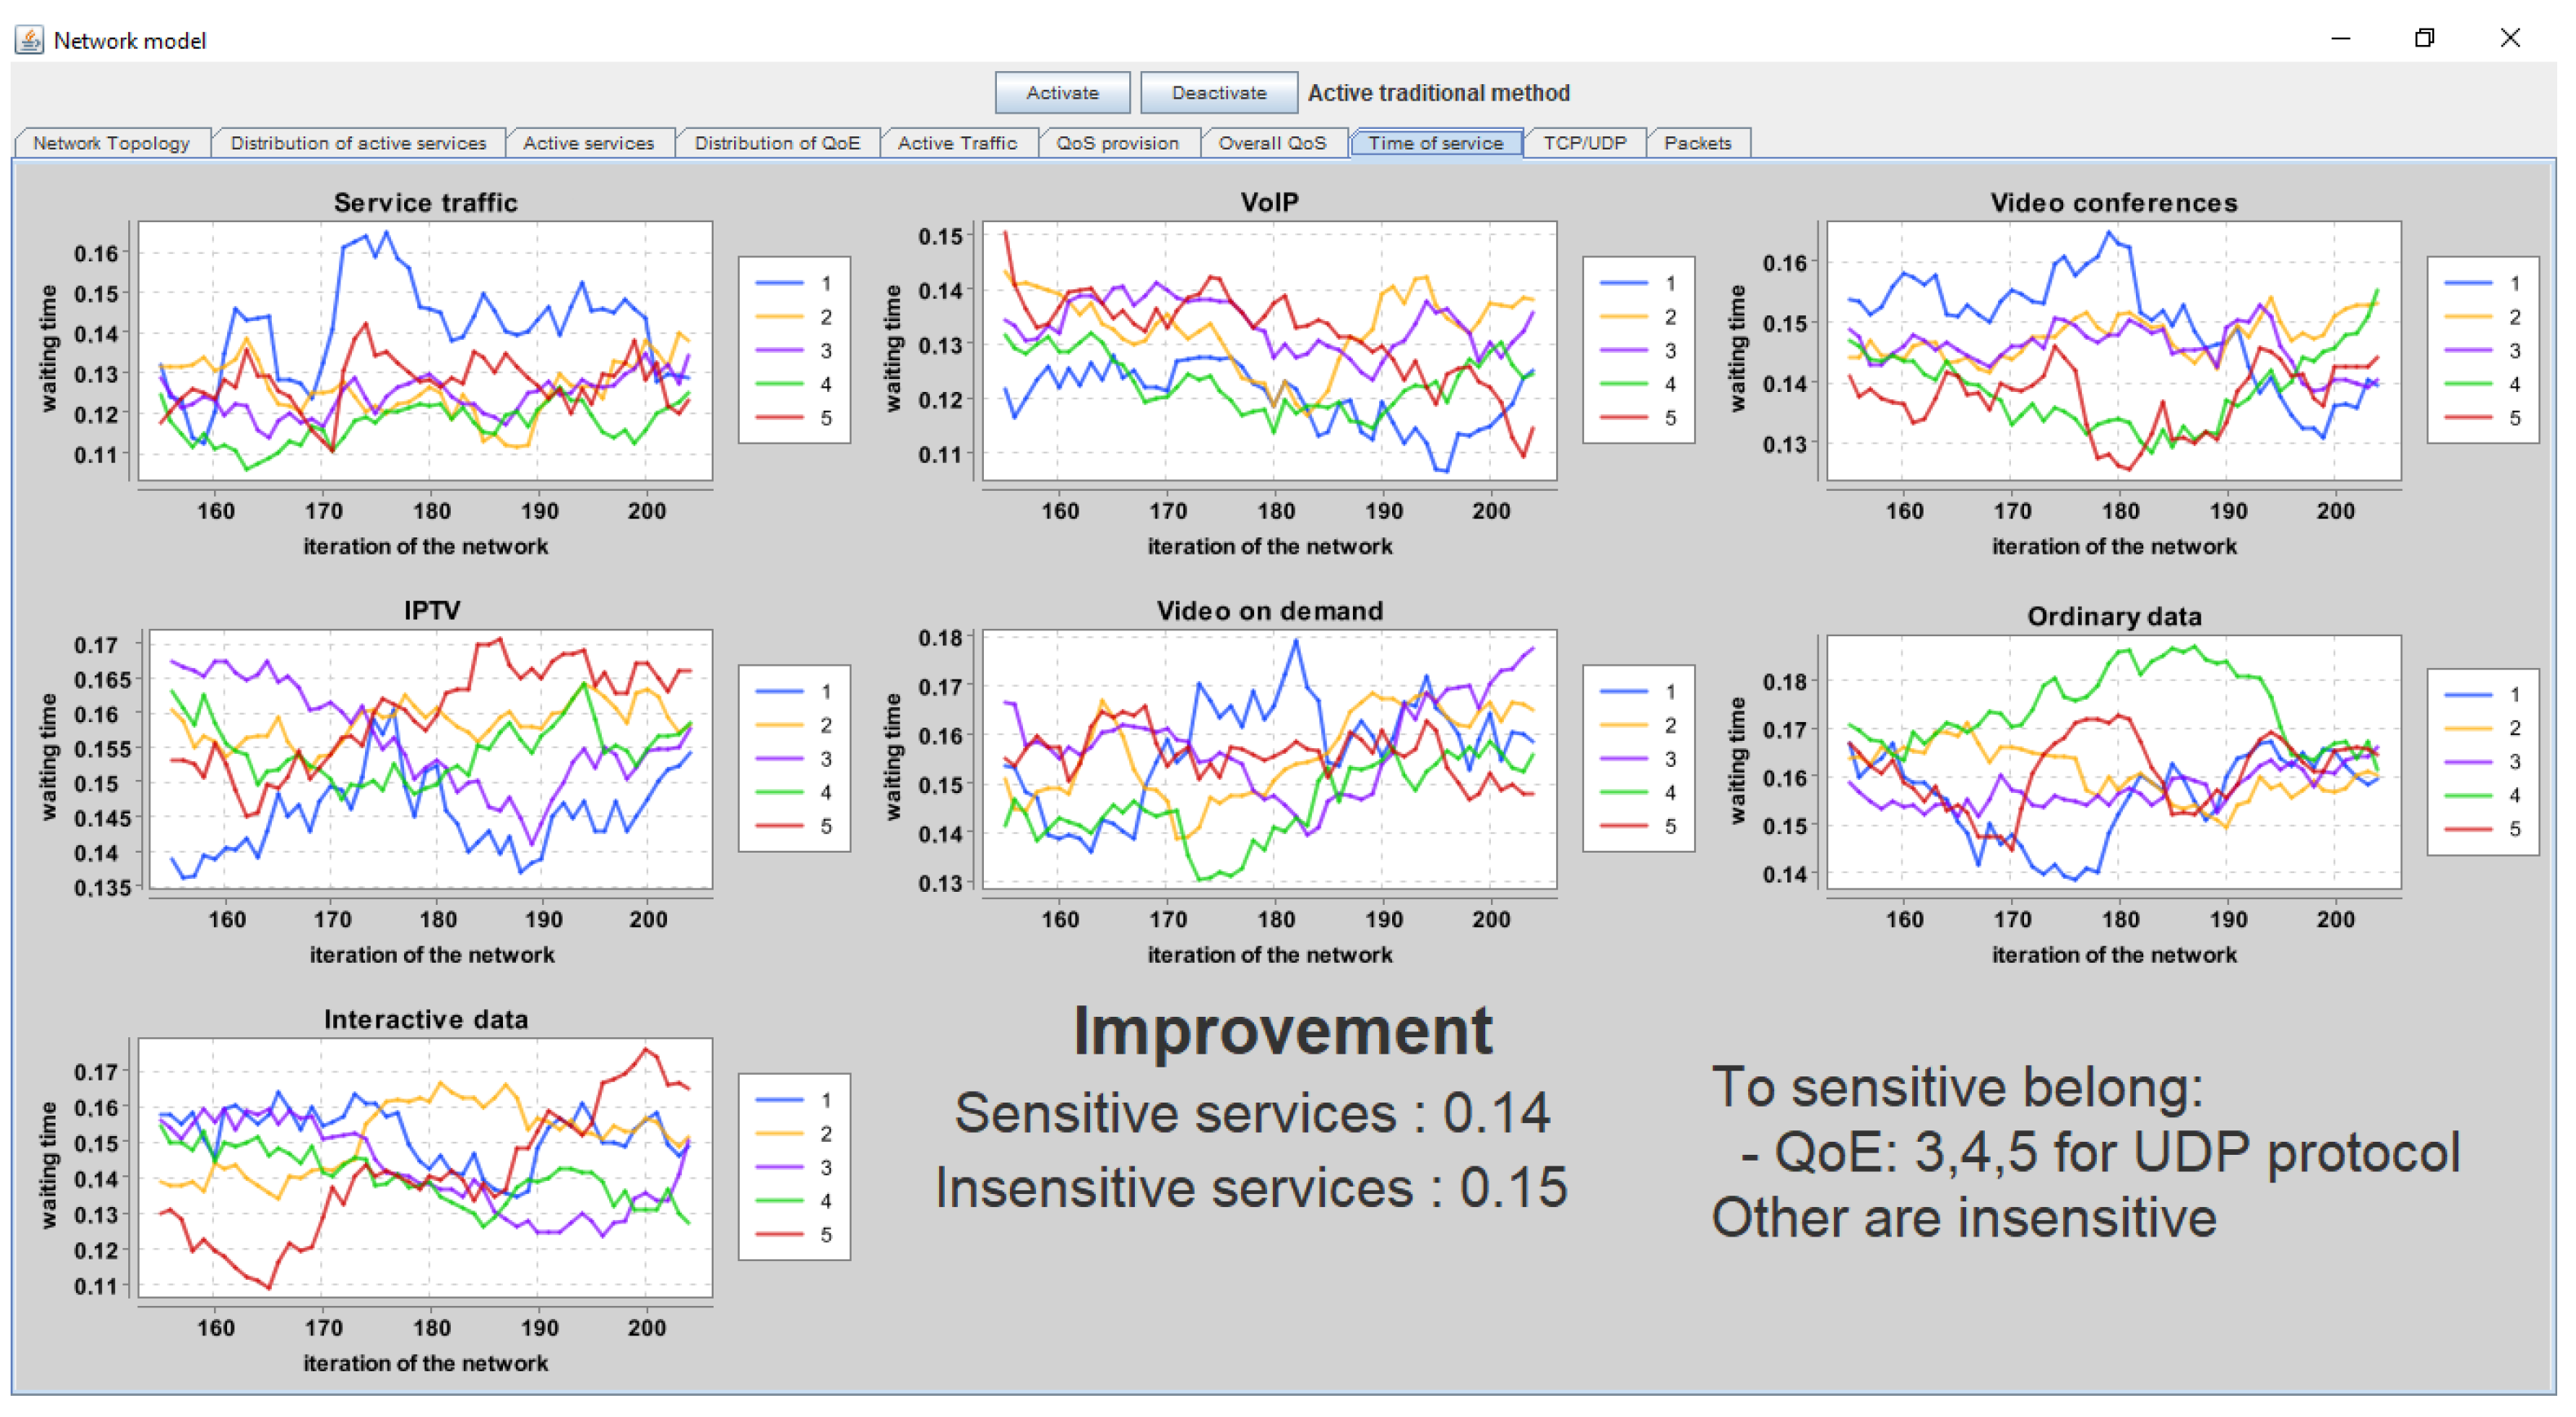
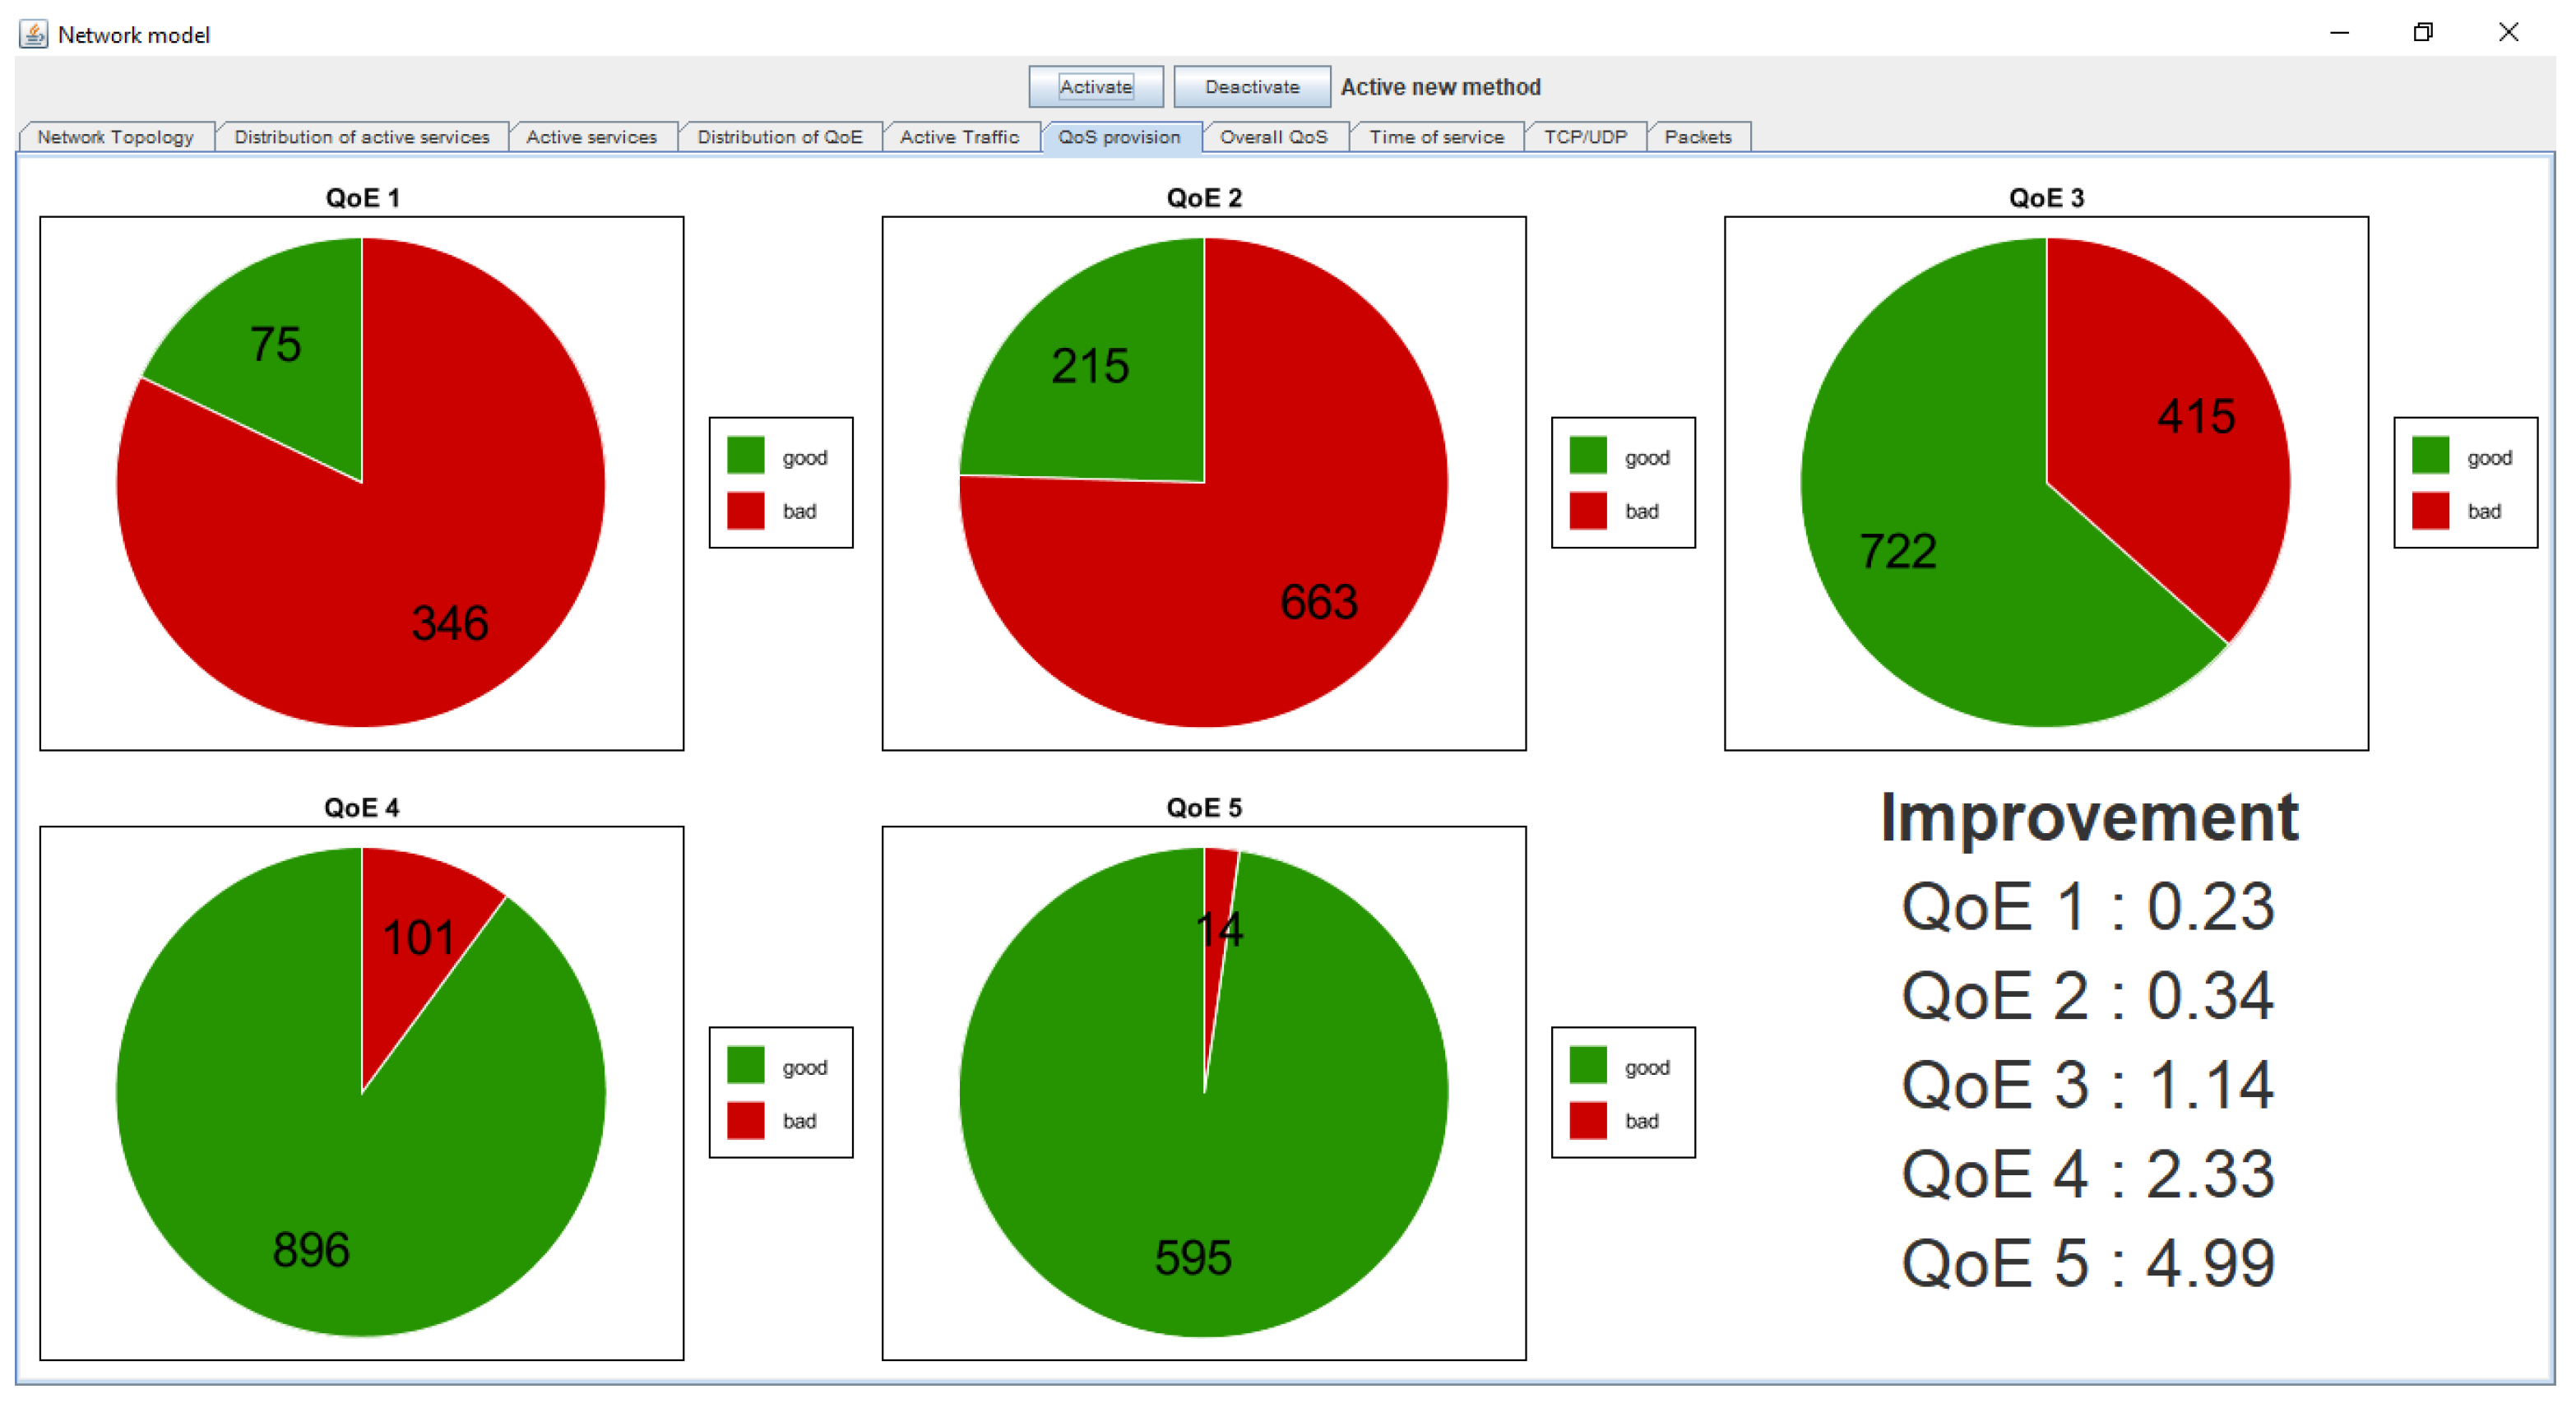
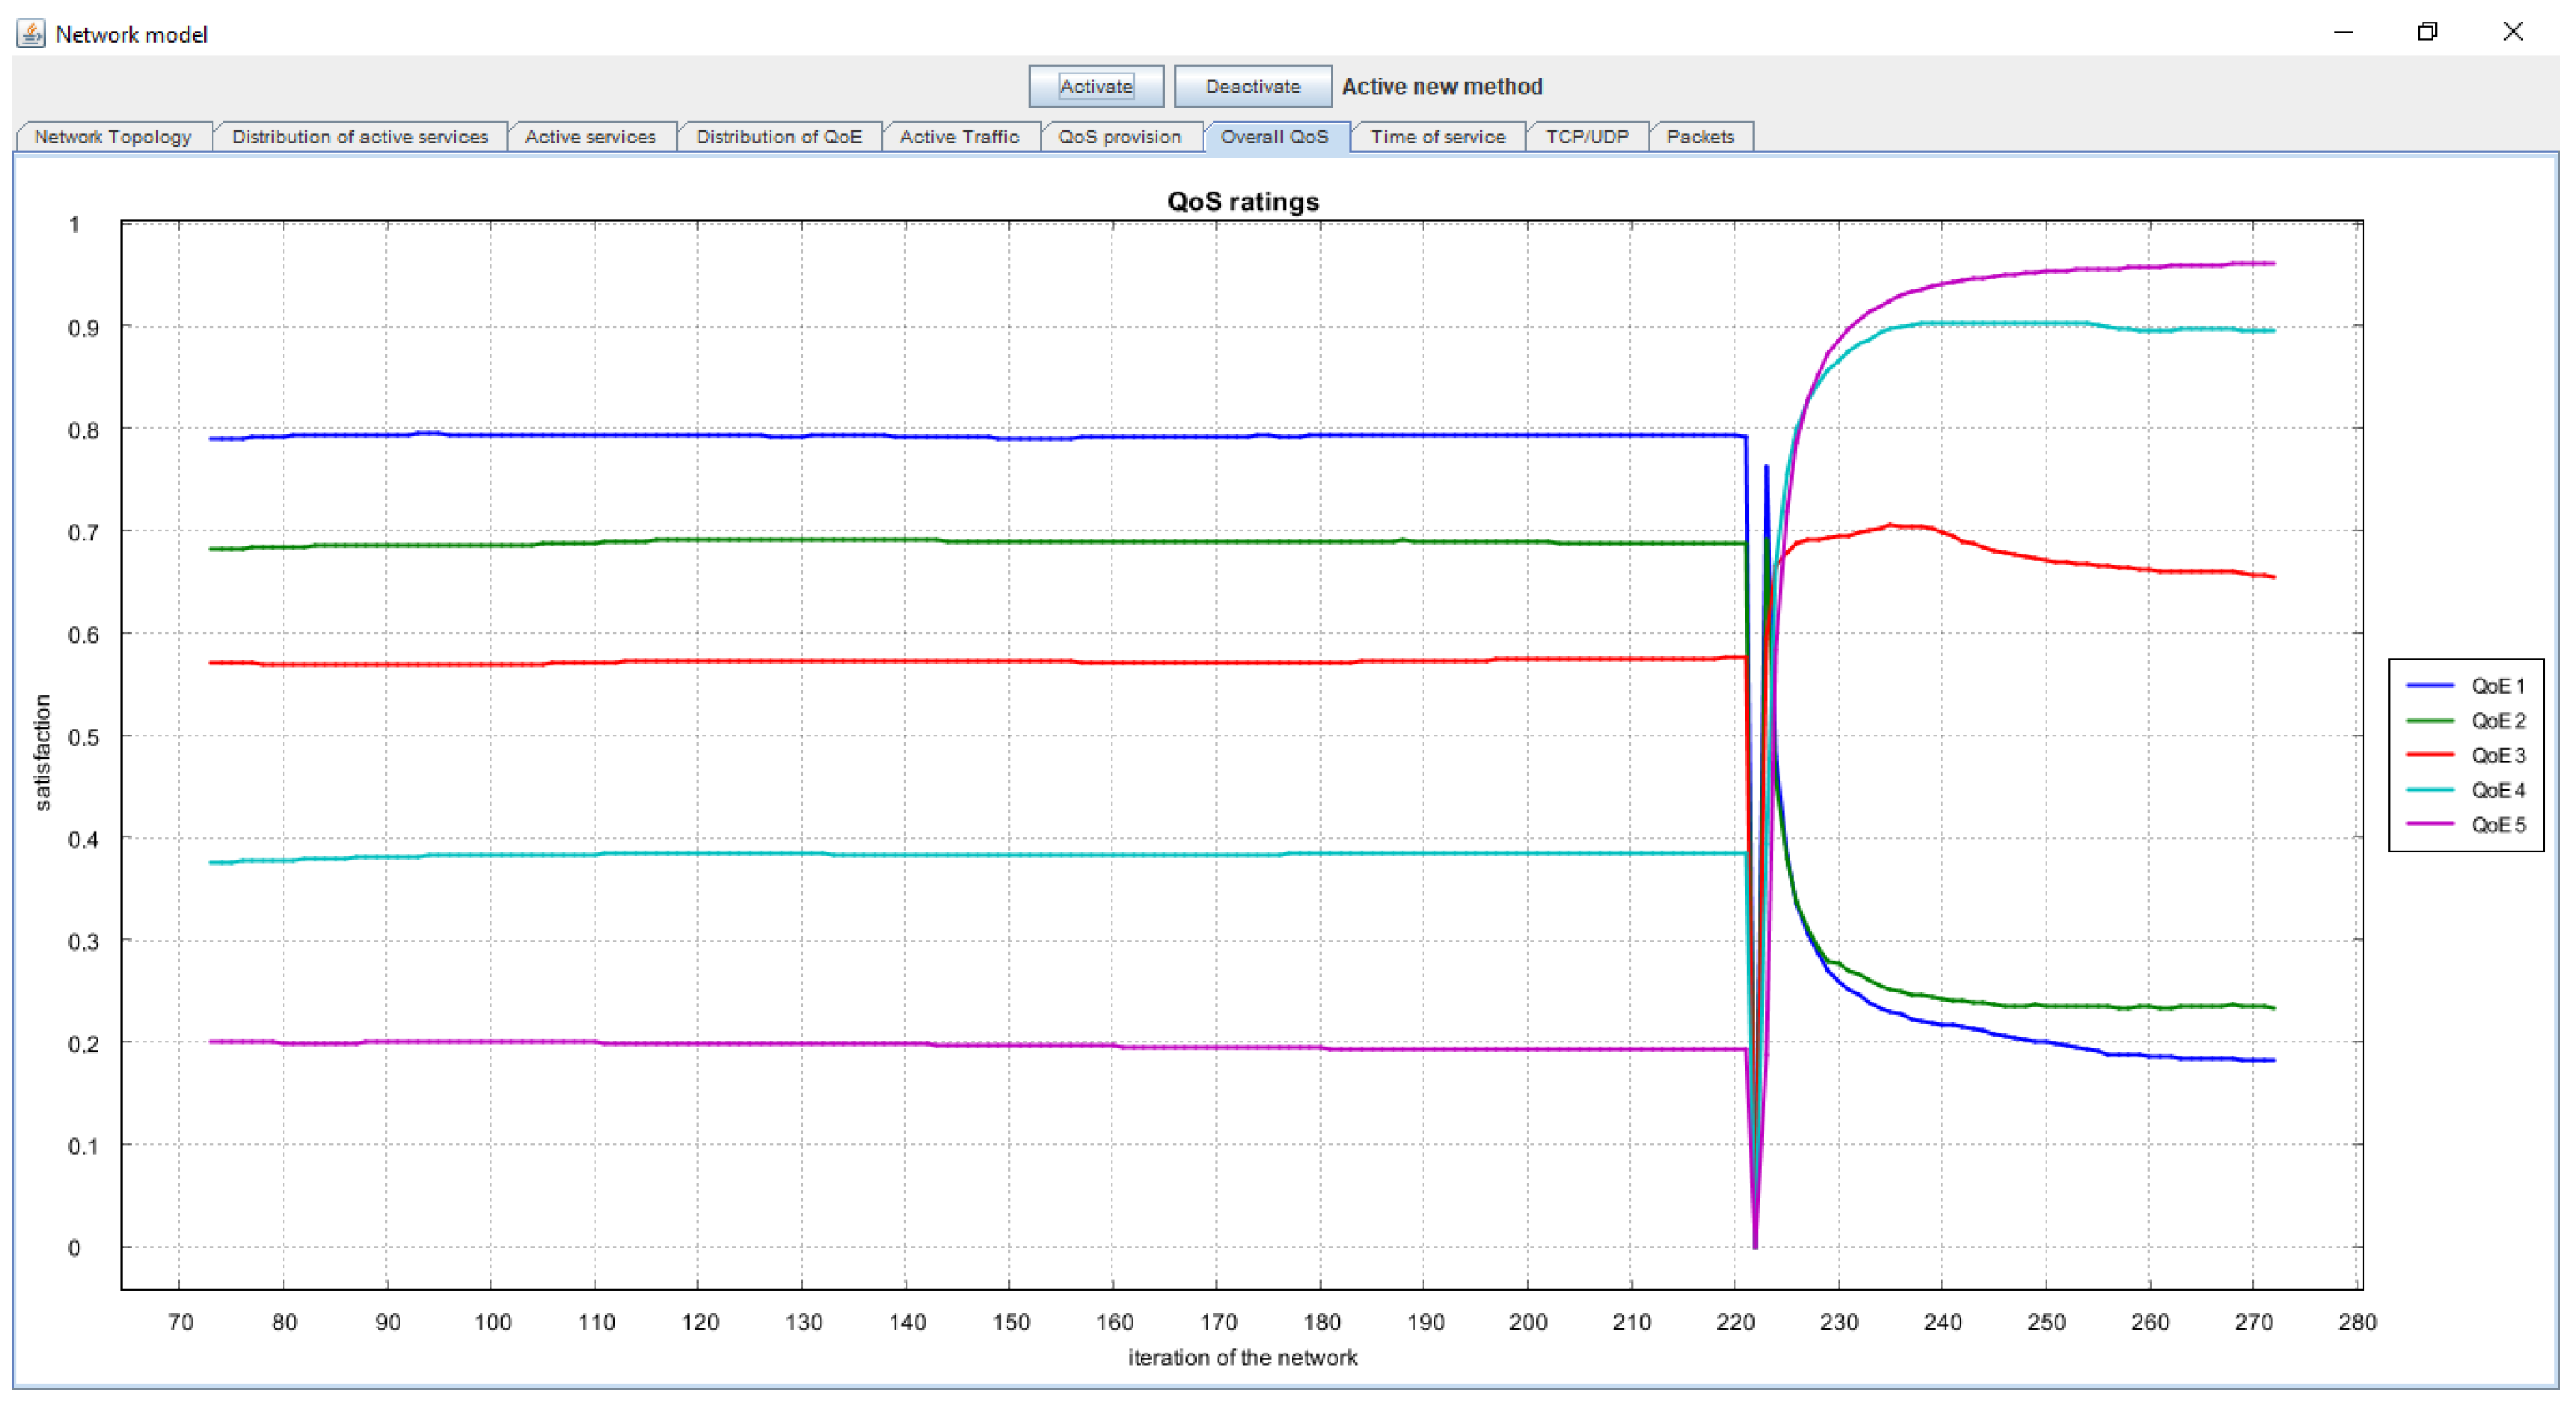
4. Simulation Results
- With an estimate of “QoE 5” in 4.99 times;
- With an estimate of “QoE 4” in 2.33 times;
- With an estimate of “QoE 3” in 1.14 times.
- With an estimate of “QoE 2” in 0.34 times;
- With an estimate of “QoE 1” in 0.23 times.
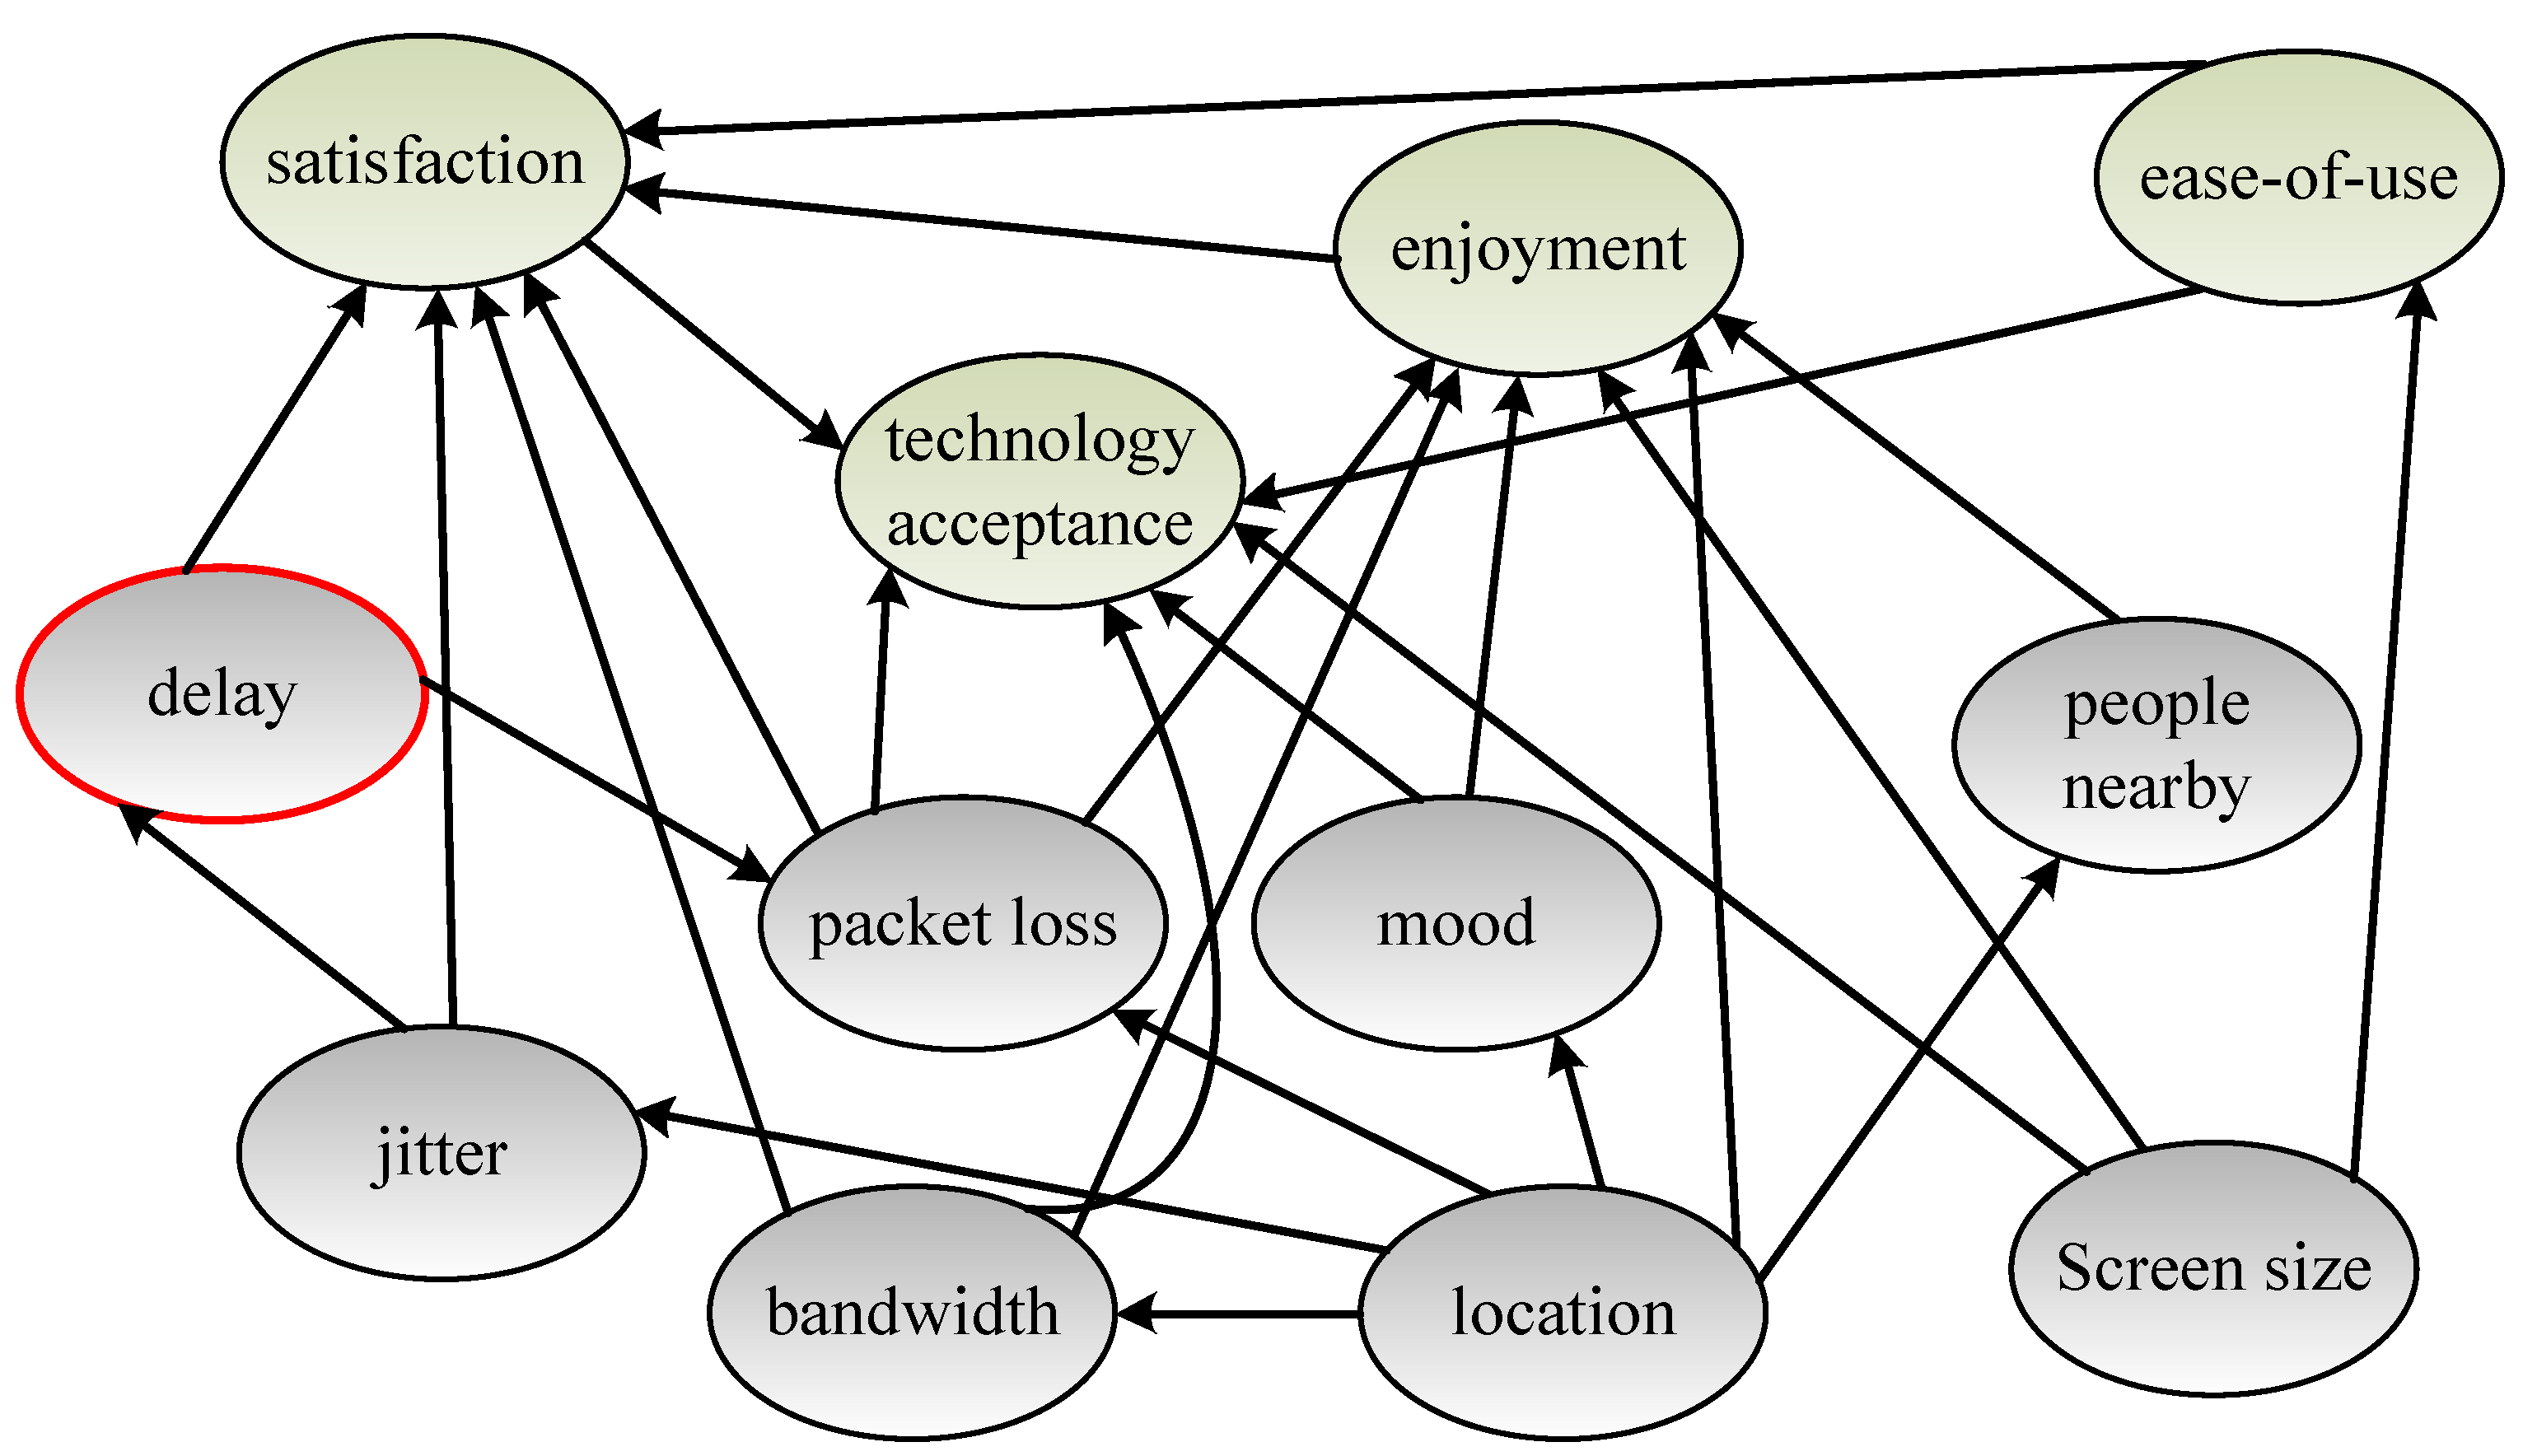
5. Discussion
- Provides billing to customers;
- Collects network statistics;
- Collects statistics about service quality.
- Weak integration with the billing system;
- Slow response to changing network topology;
- Slow response (or not at all) to the network’s load, which is dependent on system administrators;
- There is no way to “conduct” a session in the controller;
- Unnecessary signal traffic that floods the network, and others.
- The availability of a controller is the main aspect to consider. A strong relationship between network devices and the controller can be a problem when rules need to be changed. Moreover, if networks are designed with only one centralized controller in mind, it can be a “single point of failure”. A distributed approach can be implemented to ensure availability and prevent potential unwanted failures. In addition, a dedicated redundancy or backup solution can be used to ensure reliability.
- The security is important as well. A controller is a component with critical knowledge of the network and this dimension subjects the controller to possible attacks and threats. In addition, the channels between the controller and the switches can be vulnerable. According to the OpenFlow specification, it is possible to use secure communication via the TLS protocol, but its use depends on the network design.
- Scalability of the network also depends on the controller, which can potentially become a bottleneck. If too many packets are delivered to the controller, the network may experience performance problems. This means that it is important to take into account the distribution of the control plane to avoid these unwanted problems.
6. Conclusions
Author Contributions
Funding
Conflicts of Interest
References
- Barona López, L.I.; Valdivieso Caraguay, Á.L.; Sotelo Monge, M.A.; García Villalba, L.J. Key Technologies in the Context of Future Networks: Operational and Management Requirements. Future Internet 2017, 9, 1. [Google Scholar] [CrossRef] [Green Version]
- Erjavec, H.; Dmitrovic, T.; Povalej, P. Drivers of Customer Satisfaction and Loyalty in Service Industries. J. Bus. Econ. Manag. 2016, 17, 810–823. [Google Scholar] [CrossRef] [Green Version]
- Aroussi, S.; Mellouk, A. Survey on Machine Learning-Based QoE-QoS Correlation Models. In Proceedings of the 2014 International Conference on Computing, Management and Telecommunications (ComManTel), Danang, Vietnam, 27–29 April 2014; pp. 200–204. [Google Scholar]
- ITU-T Recommendation Database. Available online: https://www.itu.int/ITU-T/recommendations/rec.aspx?id=5597&lang=en (accessed on 14 October 2020).
- ITU-T Recommendation Database. Available online: https://www.itu.int/itu-t/recommendations/rec.aspx?rec=Y.1540 (accessed on 14 October 2020).
- Beshley, M.; Kryvinska, N.; Seliuchenko, M.; Beshley, H.; Shakshuki, E.M.; Yasar, A.-U.-H. End-to-End QoS “Smart Queue” Management Algorithms and Traffic Prioritization Mechanisms for Narrow-Band Internet of Things Services in 4G/5G Networks. Sensors 2020, 20, 2324. [Google Scholar] [CrossRef] [Green Version]
- Klymash, M.; Beshley, M.; Stryhaluk, B. System for Increasing Quality of Service of Multimedia Data in Convergent Networks. In Proceedings of the 2014 First International Scientific-Practical Conference Problems of Infocommunications Science and Technology, Kharkov, Ukraine, 22 December 2014; pp. 63–66. [Google Scholar]
- Pang, L.; Yang, C.; Chen, D.; Song, Y.; Guizani, M. A Survey on Intent-Driven Networks. IEEE Access 2020, 8, 22862–22873. [Google Scholar] [CrossRef]
- Fadlullah, Z.M.; Tang, F.; Mao, B.; Kato, N.; Akashi, O.; Inoue, T.; Mizutani, K. State-of-the-Art Deep Learning: Evolving Machine Intelligence Toward Tomorrow’s Intelligent Network Traffic Control Systems. IEEE Commun. Surv. Tutor. 2017, 19, 2432–2455. [Google Scholar] [CrossRef]
- Wu, Y.-J.; Hwang, P.-C.; Hwang, W.-S.; Cheng, M.-H. Artificial Intelligence Enabled Routing in Software Defined Networking. Appl. Sci. 2020, 10, 6564. [Google Scholar] [CrossRef]
- Mchergui, A.; Moulahi, T.; Nasri, S. QoS Evaluation Model Based on Intelligent Fuzzy System for Vehicular Ad Hoc Networks. Computing 2020, 12, 2501–2520. [Google Scholar] [CrossRef]
- Pierucci, L.; Micheli, D. A Neural Network for Quality of Experience Estimation in Mobile Communications. IEEE Multimed. 2016, 23, 42–49. [Google Scholar] [CrossRef]
- Luo, X.; Lv, Y.; Li, R.; Chen, Y. Web Service QoS Prediction Based on Adaptive Dynamic Programming Using Fuzzy Neural Networks for Cloud Services. IEEE Access 2015, 3, 2260–2269. [Google Scholar] [CrossRef]
- Kochan, O.; Sapojnyk, H.; Kochan, R. Temperature Field Control Method Based on Neural Network. In Proceedings of the 2013 IEEE 7th International Conference on Intelligent Data Acquisition and Advanced Computing Systems (IDAACS), Berlin, Germany, 14 November 2013; pp. 21–24. [Google Scholar]
- Yao, H.; Mai, T.; Jiang, C.; Kuang, L.; Guo, S. AI routers & network mind: A hybrid machine learning paradigm for packet routing. IEEE Comput. Intell. Mag. 2019, 14, 21–30. [Google Scholar]
- Feng, J.H.; Han, G.; Wang, H.; Li, X.; Zhang, G. Fuzzy-Logic-Based Data-Differentiated Service Supported Routing Protocol for Emergency Communication Networks in Underground Mines. Int. J. Distrib. Sens. Netw. 2019, 15. [Google Scholar] [CrossRef] [Green Version]
- Knieps, G. Internet of Things, Future Networks, and the Economics of Virtual Networks. Compet. Regul. Netw. Ind. 2017, 240–255. [Google Scholar] [CrossRef]
- Tu, W. Data-Driven QoS and QoE Management in Smart Cities: A Tutorial Study. IEEE Commun. Mag. 2018, 56, 126–133. [Google Scholar] [CrossRef]
- Ujcich, B.E.; Bates, A.; Sanders, W.H. Provenance for Intent-Based Networking. In Proceedings of the 2020 6th IEEE Conference on Network Softwarization (NetSoft), Ghent, Belgium, 29 June–3 July 2020; pp. 195–199. [Google Scholar]
- Faraz, M.; Ismail, M. INMTD: Intent-based Moving Target Defense Framework using Software Defined Networks. Eng. Technol. Appl. Sci. Res. 2020, 10, 5142–5147. [Google Scholar]
- Zeydan, E.; Turk, Y. Recent Advances in Intent-Based Networking: A Survey. In Proceedings of the 2020 IEEE 91st Vehicular Technology Conference (VTC2020-Spring), Antwerp, Belgium, 25–28 May 2020; pp. 1–5. [Google Scholar]
- Beshley, M.; Pryslupskyi, A.; Panchenko, O.; Beshley, H. SDN/Cloud Solutions for Intent-Based Networking. In Proceedings of the 2019 3rd International Conference on Advanced Information and Communications Technologies (AICT), Lviv, Ukraine, 2–6 July 2019; pp. 22–25. [Google Scholar]
- Bouraqia, K.; Sabir, E.; Sadik, M.; Ladid, L. Quality of Experience for Streaming Services: Measurements, Challenges and Insights. IEEE Access 2020, 8, 13341–13361. [Google Scholar] [CrossRef]
- Binti Atan, R. Enhancing Service Quality through Service Level Agreement (SLA) Full Implementation. In Proceedings of the 2016 2nd International Conference on Science in Information Technology (ICSITech), Balikpapan, Indonesia, 26–27 October 2016; p. 1. [Google Scholar]
- Hasan, M.Z.; Al-Rizzo, H.; Al-Turjman, F. A Survey on Multipath Routing Protocols for QoS Assurances in Real-Time Wireless Multimedia Sensor Networks. IEEE Commun. Surv. Tutor. 2017, 19, 1424–1456. [Google Scholar] [CrossRef]
- Attia, M.B.; Nguyen, K.-K.; Cheriet, M. Dynamic QoE/QoS-Aware Queuing for Heterogeneous Traffic in Smart Home. IEEE Access 2019, 7, 58990–59001. [Google Scholar] [CrossRef]
- Schatz, R.; Schwarzmann, S.; Zinner, T.; Dobrijevic, O.; Liotou, E.; Pocta, P.; Barakovic, S.; Barakovic Husic, J.; Skorin-Kapov, L. QoE Management for Future Networks. In Autonomous Control for a Reliable Internet of Services: Methods, Models, Approaches, Techniques, Algorithms, and Tools; Ganchev, I., van der Mei, R.D., van den Berg, H., Eds.; Springer International Publishing: Cham, Switzerland, 2018; pp. 49–80. [Google Scholar]
- Hewage, C.; Ekmekcioglu, E. Multimedia Quality of Experience (QoE): Current Status and Future Direction. Future Internet 2020, 12, 121. [Google Scholar] [CrossRef]
- Nagin, K.; Kassis, A.; Lorenz, D.; Barabash, K.; Raichstein, E. Estimating Client QoE from Measured Network QoS. In Proceedings of the 12th ACM International Conference on Systems and Storage, Haifa, Israel, 3–5 June 2019; Association for Computing Machinery: New York, NY, USA, 2019; p. 188. [Google Scholar]
- Barakabitze, A.A.; Barman, N.; Ahmad, A.; Zadtootaghaj, S.; Sun, L.; Martini, M.G.; Atzori, L. QoE Management of Multimedia Streaming Services in Future Networks: A Tutorial and Survey. IEEE Commun. Surv. Tutor. 2020, 22, 526–565. [Google Scholar] [CrossRef] [Green Version]
- Xu, Z.; Zhang, A. Network Traffic Type-Based Quality of Experience (QoE) Assessment for Universal Services. Appl. Sci. 2019, 9, 4107. [Google Scholar] [CrossRef] [Green Version]
- Wahab, A.; Ahmad, N.; Schormans, J. Statistical Error Propagation Affecting the Quality of Experience Evaluation in Video on Demand Applications. Appl. Sci. 2020, 10, 3662. [Google Scholar] [CrossRef]
- Trakas, P.; Adelantado, F.; Verikoukis, C. QoE-Aware Resource Allocation for Profit Maximization under User Satisfaction Guarantees in HetNets with Differentiated Services. IEEE Syst. J. 2019, 13, 2664–2675. [Google Scholar] [CrossRef]
- Zhang, J.; Ansari, N. On Assuring End-to-End QoE in next Generation Networks: Challenges and a Possible Solution. IEEE Commun. Mag. 2011, 49, 185–191. [Google Scholar] [CrossRef]
- Hoßfeld, T.; Heegaard, P.E.; Varela, M.; Möller, S. QoE beyond the MOS: An in-Depth Look at QoE via Better Metrics and Their Relation to MOS. Qual. User Exp. 2016, 1, 2. [Google Scholar] [CrossRef] [Green Version]
- Beshley, M.; Pryslupskyi, A.; Panchenko, O.; Seliuchenko, M. Dynamic Switch Migration Method Based on QoE-Aware Priority Marking for Intent-Based Networking. In Proceedings of the 2020 IEEE 15th International Conference on Advanced Trends in Radioelectronics, Telecommunications and Computer Engineering (TCSET), Lviv-Slavske, Ukraine, 20–23 February 2020; pp. 864–868. [Google Scholar]
- Rodríguez, D.Z.; Rosa, R.L.; Bressan, G. A Billing System Model for Voice Call Service in Cellular Networks Based on Voice Quality. In Proceedings of the 2013 IEEE International Symposium on Consumer Electronics (ISCE), Hsinchu, Taiwan, 3–6 June 2013; pp. 89–90. [Google Scholar]
- Mongi, A. A Conceptual Framework for QoE Measurement and Management in Networked Systems. Int. J. Comput. Appl. 2015, 112, 975–8887. [Google Scholar]
- Romanchuk, V.; Beshley, M.; Polishuk, A.; Seliuchenko, M. Method for Processing Multiservice Traffic in Network Node Based on Adaptive Management of Buffer Resource. In Proceedings of the 2018 14th International Conference on Advanced Trends in Radioelecrtronics, Telecommunications and Computer Engineering (TCSET), Slavske, Ukraine, 20–24 February 2018; pp. 1118–1122. [Google Scholar]
- Jun, S.; Przystupa, K.; Beshley, M.; Kochan, O.; Beshley, H.; Klymash, M.; Wang, J.; Pieniak, D. A Cost-Efficient Software Based Router and Traffic Generator for Simulation and Testing of IP Network. Electronics 2020, 9, 40. [Google Scholar] [CrossRef] [Green Version]


| QoE Score | Quality Category | Customer Satisfaction | Price for e-Services |
|---|---|---|---|
| 5 | Excellent | Satisfaction to the highest degree | High |
| 4 | Good | Satisfied | Good |
| 3 | Fair | Some are dissatisfied | Fair |
| 2 | Poor | Many are dissatisfied | Great |
| 1 | Bad | Almost everyone is dissatisfied | Low |
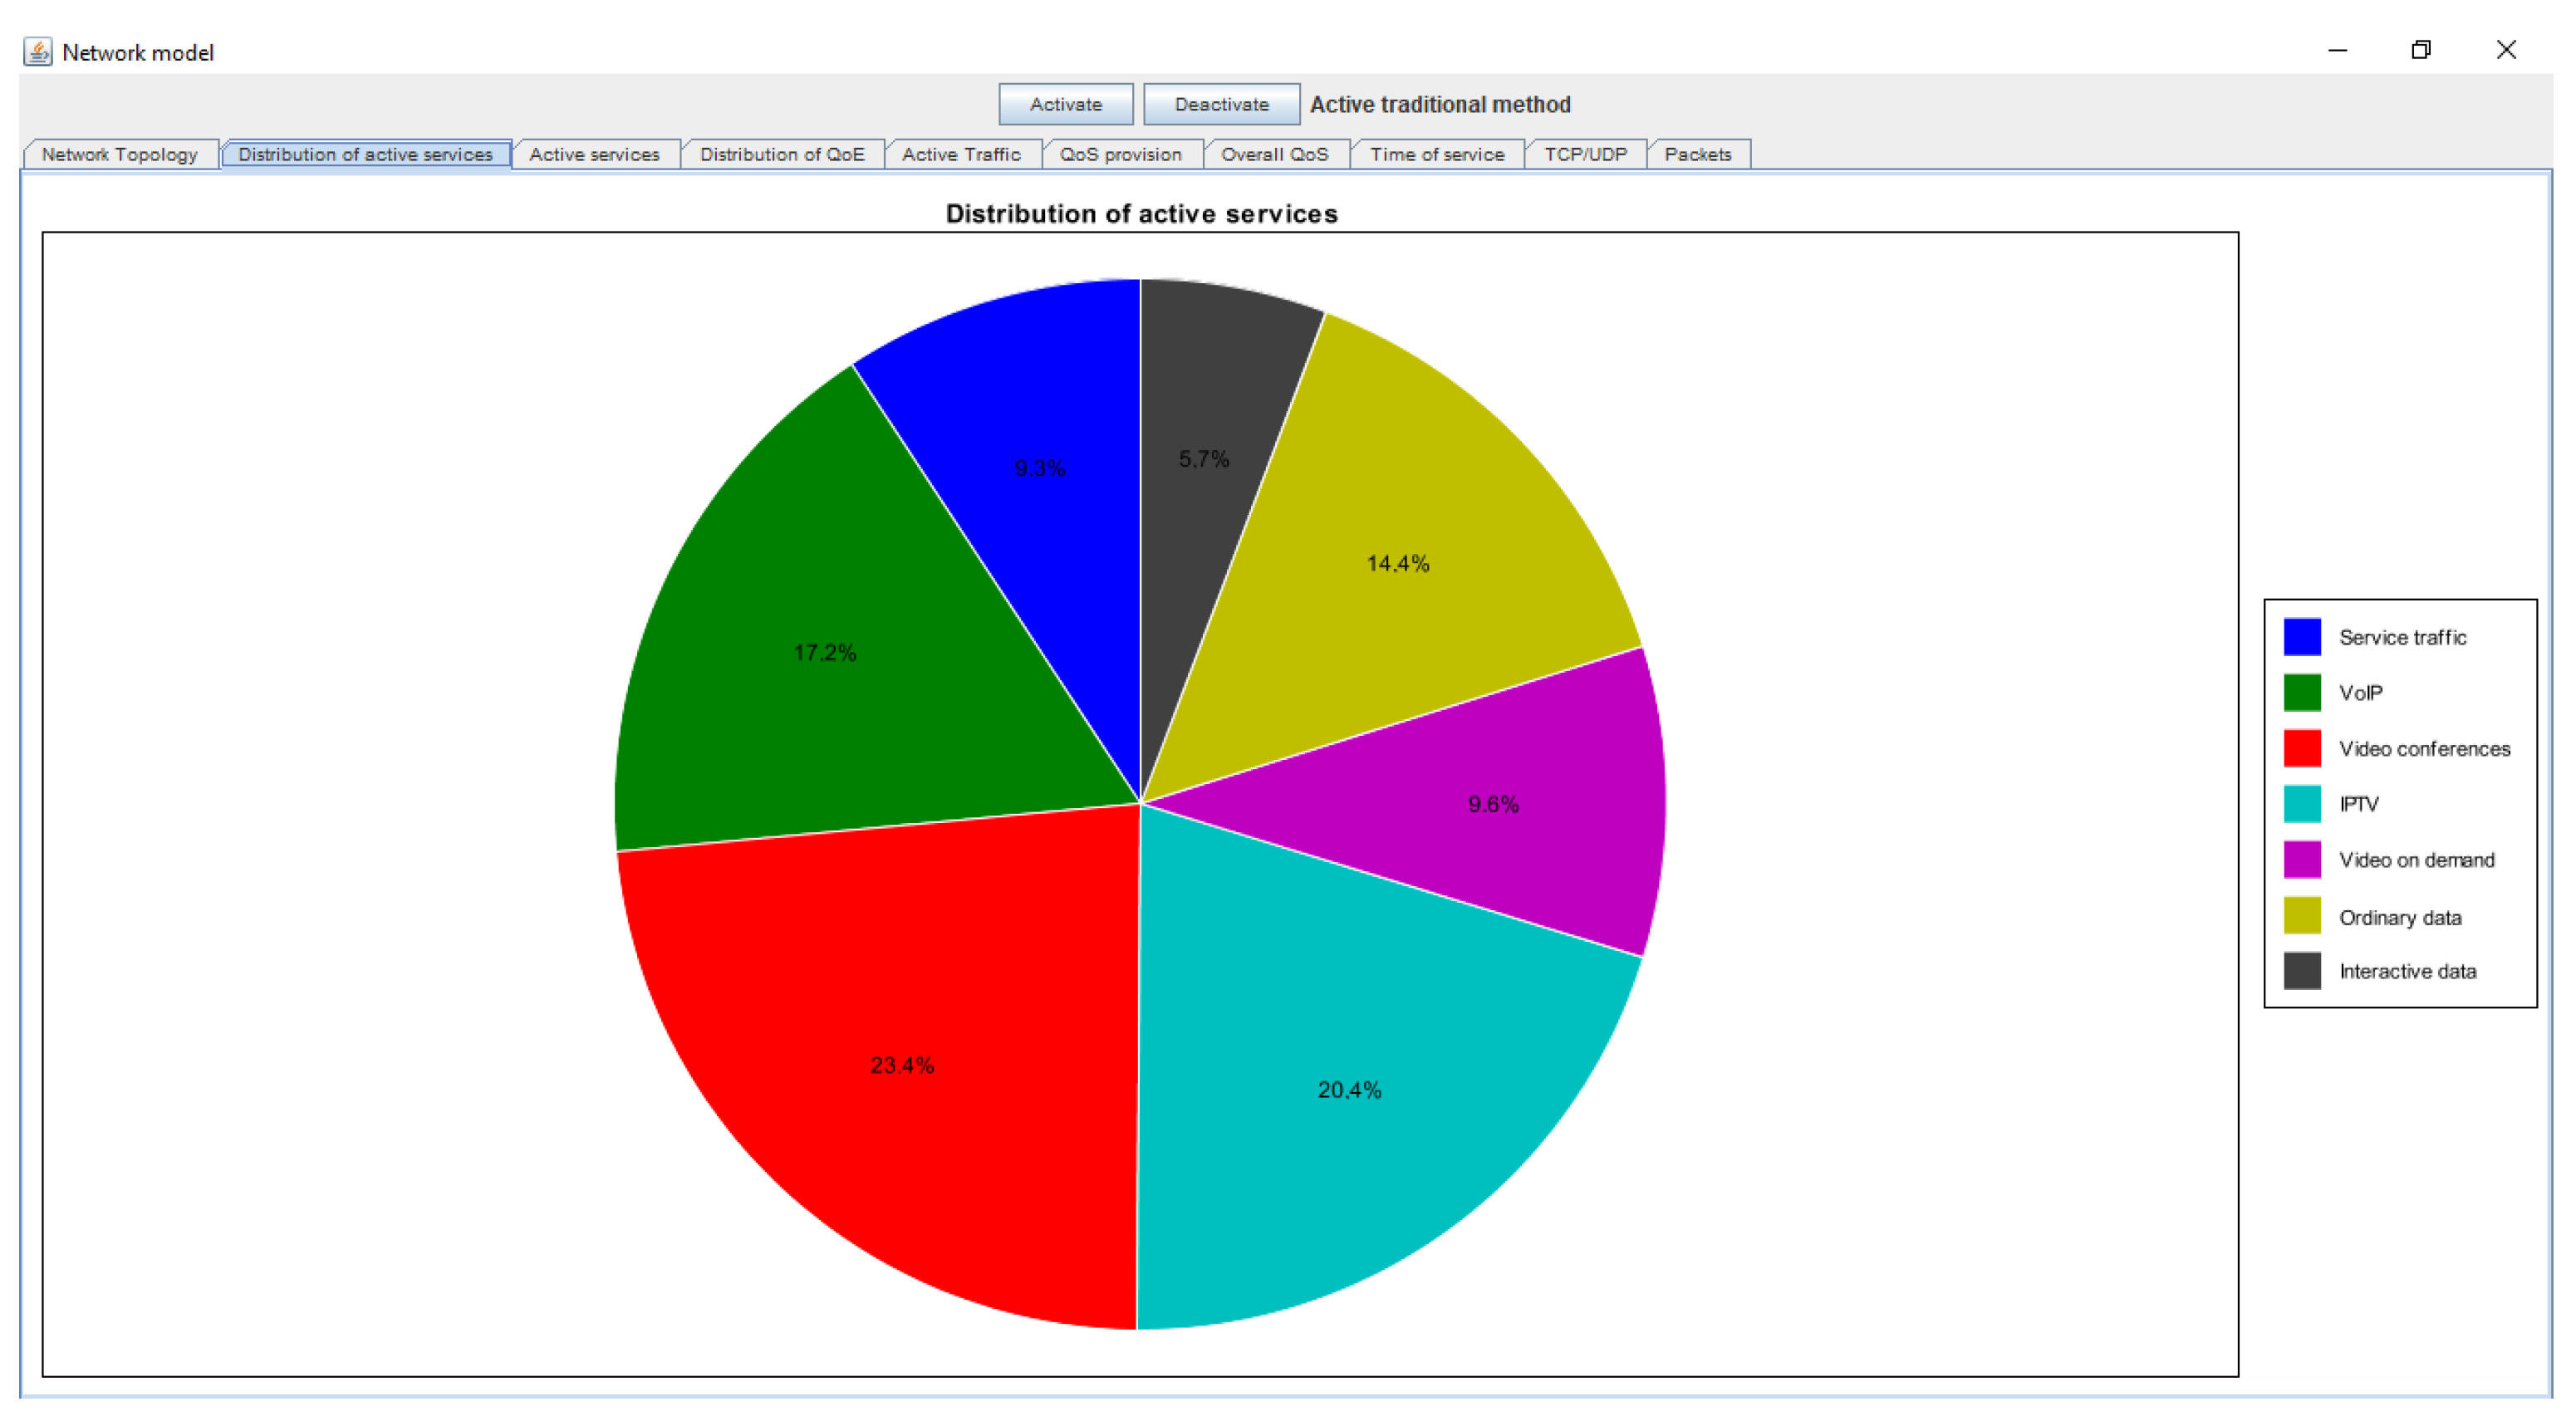
| Service Type | Percentage Equivalent, % |
|---|---|
| Voice over Internet Protocol (VoIP) | 15 |
| Data transmission | 15 |
| Interactive data | 5 |
| Internet Protocol Television (IPTV) | 20 |
| Service packets | 22 |
| Videoconferencing | 21 |
| Video on demand | 2 |
| Service Type | Minimum Packet Size, Byte | Variation in Packet Size, Byte | Maximum Use Time, Seconds | Packets per Second |
|---|---|---|---|---|
| VoIP | 100 | 199 | 260 | 60 |
| Data transmission | 800 | 700 | 320 | 90 |
| Interactive data | 350 | 299 | 400 | 60 |
| IPTV | 800 | 700 | 600 | 70 |
| Service packets | 64 | 36 | 50 | 50 |
| Videoconferencing | 600 | 199 | 360 | 80 |
Publisher’s Note: MDPI stays neutral with regard to jurisdictional claims in published maps and institutional affiliations. |
© 2020 by the authors. Licensee MDPI, Basel, Switzerland. This article is an open access article distributed under the terms and conditions of the Creative Commons Attribution (CC BY) license (http://creativecommons.org/licenses/by/4.0/).
Share and Cite
Beshley, M.; Veselý, P.; Pryslupskyi, A.; Beshley, H.; Kyryk, M.; Romanchuk, V.; Kahalo, I. Customer-Oriented Quality of Service Management Method for the Future Intent-Based Networking. Appl. Sci. 2020, 10, 8223. https://doi.org/10.3390/app10228223
Beshley M, Veselý P, Pryslupskyi A, Beshley H, Kyryk M, Romanchuk V, Kahalo I. Customer-Oriented Quality of Service Management Method for the Future Intent-Based Networking. Applied Sciences. 2020; 10(22):8223. https://doi.org/10.3390/app10228223
Chicago/Turabian StyleBeshley, Mykola, Peter Veselý, Andrii Pryslupskyi, Halyna Beshley, Marian Kyryk, Vasyl Romanchuk, and Ihor Kahalo. 2020. "Customer-Oriented Quality of Service Management Method for the Future Intent-Based Networking" Applied Sciences 10, no. 22: 8223. https://doi.org/10.3390/app10228223