Article

A Framework for Identifying Influential People by Analyzing Social Media Data

by
Md. Sabbir Al Ahsan
1,
Mohammad Shamsul Arefin
1,*,
A. S. M. Kayes
2,*,
Mohammad Hammoudeh
3 and
Omar Aldabbas
4
1
Department of Computer Science and Engineering, Chittagong University of Engineering and Technology, Chittagong 4349, Bangladesh
2
Department of Computer Science and Information Technology, La Trobe University, Melbourne, Victoria 3086, Australia
3
Department of Computing and Mathematics, Manchester Metropolitan University, Manchester M15 6BH, UK
4
Faculty of Engineering Technology, Al-Balqa’ Applied University, Amman 15008, Jordan
*
Authors to whom correspondence should be addressed.
Appl. Sci. 2020, 10(24), 8773; https://doi.org/10.3390/app10248773
Submission received: 14 October 2020 / Revised: 26 November 2020 / Accepted: 2 December 2020 / Published: 8 December 2020
(This article belongs to the Section Computing and Artificial Intelligence)

Abstract

:
In this paper, we introduce a new framework for identifying the most influential people from social sensor networks. Selecting influential people from social networks is a complicated task as it depends on many metrics like the network of friends, followers, reactions, comments, shares, etc. (e.g., friends-of-a-friend, friends-of-a-friend-of-a-friend). Data on social media are increasing day-by-day at an enormous rate. It is also a challenge to store and process these data. Towards this goal, we use Hadoop to store data and Apache Spark for the fast computation of the data. To select influential people, we apply the mechanisms of skyline query and top-k query. To the best of our knowledge, this is the first work to apply the Apache Spark framework to identify influential people on social sensor network, such as online social media. Our proposed mechanism can find influential people very quickly and efficiently on the data pattern of Facebook.

1. Introduction

Currently, the importance of social media is beyond question. People can connect anywhere in the world at an instant due to the blessings of social media on the Internet [1]. Social media influence is an important term as influencers have a great impact on social media platforms. Every moment, an enormous amount of data is generated on social media like Facebook, Twitter, Instagram, etc. Statistics show that around four petabytes of data are generated per day on Facebook alone, and Apache Spark along with Hadoop can play a big role in processing this huge amount of data [2,3].

1.1. Background

Considering these facts, we use Hadoop to store the data, as well as Apache Spark to process the data. The Apache Hadoop [4] software library is a framework that allows for the distributed processing of large data sets across clusters of computers using simple programming models. It was created by Doug Cutting in 2005 when he was working for Yahoo at the time for the Nutch search engine project. Hadoop has two major components named the HDFS (Hadoop Distributed File System) [5] and the MapReduce [6] framework.
Apache Spark was originally developed at UC Berkeley in 2009 in order to process a large amount of data (e.g., IoT streaming data or social media streaming data processing from multiple sources [7,8]), and Apache Spark can serve as a unified analytics engine through machine learning [9] and deal with big data [10]. It can run ten times faster than on disk and a hundred times faster in memory than Hadoop. Spark runs everywhere, can access diverse data sources, and has very powerful caching. Most importantly, it supports multiple platforms such as R, Scala, Python, and SQL shells [11]. In this paper, we use the Python language in our project to interact with Spark.

1.2. Motivation

Social media data are growing exponentially currently. Social influencers have a great impact on these platforms. It is a difficult task to find influential people as this depends on many metrics. If we want to analyze data from this huge source of social media data, we will be faced with mainly two problems:
  • the large data set storage problem and
  • the large data set processing problem.
Therefore, we use Hadoop and the Apache Spark framework to solve these issues.

1.3. Problem Statement

In this paper, we consider the problem of selecting influential people from social networks. We consider the data pattern of Facebook as it is the most popular social media platform currently. We consider ten different metrics to select influential people. The metrics are friends, followers, reactions, comments, groups, shares, pages liked, check-ins, mentions, and events attended.
To select influential people, we apply skyline queries and top-k queries. In a dimensional data set, a point p dominates another point q only if it is better than or equal to q in all dimensions and better than q in at least one. The points that are not dominated by any other point are called the skyline. Top-k queries produce results that are ordered by some computed score. These queries retrieve the k best results according to the user’s satisfaction.

1.4. Contributions

The major contributions of this article are listed as follows:
  • We develop a mechanism to identify influential people.
  • We use an efficient method to store and process large data.
  • We effectively apply the skyline query and top-k query to handle Facebook data.

1.5. Organization of the Paper

The rest of the paper is organized as follows. A brief review of the related work is provided in Section 2. In Section 3, we provide our methodology, describe our data set in detail, introduce the performance metrics, and then, show the selection procedure. The experimental results and performance evaluations are presented in Section 4. Finally, we conclude the paper in Section 5 and outline future research directions.

2. Related Work and Discussion

This section divides the state-of-the-art literature into four sections. We review the work related to social media in Section 2.1 and the work related to Apache Spark in Section 2.2. To retrieve the selected people, skyline queries and top-k queries are used. We review both of these queries in Section 2.3 and Section 2.4.

2.1. Work Related to Social Networks

Asif Zaman et al. [12] addressed finding key people on social media using the MapReduce framework. They considered five metrics and applied the skyline query for selecting the key people. However, the MapReduce framework is not very time efficient, and the performance degrades when the data set is large. J. Qiu et al. [13] addressed social influence prediction with deep learning. They proposed a framework that takes a user’s local network as the input to a graph neural network for learning his/her latent social representation. They showed that their proposed model significantly outperforms traditional feature engineering-based approaches. Cao et al. [14] addressed the jury selection problem for decision-making tasks on micro-blog services. To avoid the exponentially increasing calculation of the jury error rate, they introduced two efficient algorithms for choosing jury members. By evaluating a Twitter graph, they predicted the error rate of each user. DeMartini et al. [15] suggested a systematic model for search entities. They introduced a vector space model for ranking entities with the application to find experts. T. Lappas et al. [16] addressed the problem of forming a team of skilled individuals to perform a given task. They mainly focused to minimizing the communication cost among team members.

2.2. Work Related to Apache Spark

M. Zaharia et al. [17] first introduced the architecture of Apache Spark with RDDs (resilient distributed datasets), parallel computing, etc. They implemented RDDs in Spark and evaluated a variety of user applications. Satis Gopalani et al. [18] gave a comparison of Apache Spark and the MapReduce framework. They analyzed the performance using the K-means clustering algorithm. X. Meng et al. [19] introduced MLib, which is a machine learning library for Apache Spark. Anand Gupta et al. [20] introduced a framework for big data analysis using Apache Spark and deep learning. For this analysis, they used a technique called cascade learning. L. R. Nair et al. [21] analyzed Twitter data using the Apache Spark framework and classified various job categories among millions of streaming tweets by analyzing the real-time data.

2.3. Work Related to Skyline Query

The skyline query problems are related to the maximum vector problems [22,23]. Borzsonyi et al. [24] first addressed the skyline operator. They introduced three algorithms: Block Nested Loops (BNL), Divide and Conquer (D&C), and B-tree-based schemes. For BNL, every item is contrasted with each other item in the database, and the item is accounted for if no other item dominates. Chomicki et al. [25] addressed a variant of BNL by introducing an algorithm named Sort-Filter-Skyline (SFS) as an improved version of BNL. This algorithm requires a pre-sorting data set. Tan et al. [26] proposed “Bitmap” and “Index”, two progressive processing algorithms. In the Bitmap algorithm, every dimensional value of a point is represented by a few bits. It can be determined whether a given data point is in the skyline by applying a bit-wise AND operation on these vectors. In the Index algorithm, the entire data set is organized into some lists, and points are assigned to a list only if the value in the dimension is the best among all the dimensions. Chan et al. [27] addressed the k-dominant skyline in high-dimensional space. They proposed efficient algorithms to solve the k-dominant skyline problem. Balke et al. [28] addressed the problem of skyline queries in web information systems. They vertically partitioned the data set and retrieved the skyline in a distributed environment.

2.4. Work Related to the Top-k Query

Several works have been done on top-k queries. Marian et al. [29] addressed an algorithm to efficiently evaluate top-k queries over web-accessible databases, and they assumed that only random access was available for web sources. Chang et al. [30] addressed the problem of evaluating ranked top-k queries with expensive predicates. They proposed an algorithm for minimizing probe accesses as much as possible. They assumed an arranged access on one of the traits, while different scores were obtained through testing or executing some user-defined function on the rest of the attributes. Li et al. [31] introduced a framework that gives a methodical and principled structure to help with efficient assessments of top-k queries in relational database systems by expanding the relational algebra. Chaudhuri et al. [32] studied the advantages, as well as the limitations of handling a top-k query by interpreting it in a single range query that conventional relational DBMSs (database management systems) can process efficiently. D. Donjerkovic et al. [33] proposed a probabilistic approach to query optimization.

3. The Proposed Methodology on Selecting Influential People

The proposed system architecture consists of four modules. They are the storage module, calculation module, selection module, and output module. Figure 1 depicts the system architecture of our proposed method. First, we have to store all our data sets in the HDFS (Hadoop Distributed File System), which is the storage module. We have to fetch all our data from here for all the calculations. In the Calculation module, first, we need to write our program for the score calculation, which is given in Table 8. The program was written in Python and PySpark.
We first operate our program individually to generate each metric score in the PySpark shell. After testing all the code, we create an environment for submitting our entire code to Spark. Then, we submit the code to Spark. It will process the data, and the output is generated after processing. In the Selection module, the skyline query and top-k query are used to retrieve the influential people. After retrieving the output data sets, we have to store them again in the HDFS.
In the output module, the results can be easily moved into the HDFS storage. Then, we submit our job to Spark. It will process the data, and the output is generated. In the Selection module, the skyline query and top-k query are used to retrieve the influential people. The output module shows the results retrieved from both queries and stores them in the HDFS.

3.1. Dataset Description

The symbolic representation of Facebook data is shown in Table 1. To find influential people, we selected the 10 criteria given in the figure. Here, we show the symbol names for all metrics for simplicity.
The User ID column shows the list of all users on Facebook. Here, we describe all the columns for User A from the User ID column. The Friends column demonstrates that User A has friends like U, V, X, etc., and followers like S, D, R, etc. In the Like column, (1, T) means that User T has given a reaction to the first status of User A. In the Comment column, (3, Z, Comment5) means that User Z has given a comment, which is Comment1 to the third status of User A. The Groups column shows that User A is connected to different groups like G1, G3, etc. As all the groups do not have the same influence, we assume that the group that is more active is more important.
We use Table 2 to determine the activity of the group that we called influencers. In the Share column, (1, E) means User E has shared the first status or post of User A. The Pages liked column shows that User A has liked pages P1, P2, etc. The importance of all pages is not the same. To determine the page influence, we use Table 3. The Check-ins column shows that User A has checked-in different places named C1, C2, etc. A place is said to be more popular on Facebook depending on some criteria, which we show in Table 4. In the Mentioned by column, (B,6) means that User A was mentioned or was tagged by User B in his/her sixth status. The Events attended column shows that User A has attended various events named E1, E2, etc. However, the importance of all events is not the same. The metrics are shown to determine event influence in Table 5.
Table 2 consists of the group name, total members, members added the last seven days, and total posts the last 30 days. We consider the more active group to be more important. The group activity is given in Table 2. Using these three metrics, we can calculate the group influence on Facebook. Table 3 consists of the page name, followers, comments, and reviews. On every page, there is a review section where people can give a review of that page like a four-star review, five-star review, etc. We store this in the Review column. We assume a Facebook page to be influential considering all these metrics in Table 3. Here, the Comment column has the same format as described in Table 1.
In the Reviews column, (R,4) means that User 4 has given a four-star rating to that particular page. Table 4 is for determining the check-in influence. It consists of the name where a user checked-in, the followers, the comment section, and the review section of that place. The structure of Table 3 and Table 4 is the same. Table 5 consists of the event, going, and interested column. A popular event always gets a huge response from people. Therefore, we consider how many people are interested in that event, as well as how many people are going to that event to determine the event’s popularity.

3.2. Performance Metrics

In this section, we give the basic definitions, as well as the formulas for social network metrics that are used in this work. As we considered a total of 10 metrics to find influential people, we assume that each metric’s data set is in kvs (key-value storage) format. Then, we calculate the metric score for every metric separately in the PySpark [34] shell, which is described in detail in Section 3.3. Table 6 shows the considered metrics with their symbols.

3.2.1. Friend Score ( F s )

A friend score is the total number of friends a user has on social media [12]. It is defined as:
F s = Total number of friends

3.2.2. Follower Score ( F l s )

A follower score is the total number of friends a user has on social media [12]. It is defined as:
Fl s = Total number of followers

3.2.3. Reaction Score ( R s )

The term reaction refers to the like, sad, happy, angry, etc, reaction that a user has to someone’s post. The reaction score is the average number of the “reaction” count that a user has achieved. To determine the reaction score, we define the following rules:
R s = ( Total reaction received from all posts / Total posts )

3.2.4. Comment Score ( C s )

In every post, many relevant and irrelevant comments are made by users. To determine the comment score of a user, a comment bias function [12] is used to determine the polarity of the comment. The function receives comments and returns a value for each comment. We give +1 for the positive comments, −1 for negative comments, and 0 for neutral comments. For simplicity, we considered all complicated comments as neutral comments. After determining each comment bias, we replace each comment name with its corresponding value. Then, we use the formula:
C s = ( Total comment bias / Total posts )
There are mainly three types of sentiments that can be classified: positive, negative, and neutral. There are many features that are often used in this problem [35] like terms and their frequency, parts of speech, opinion words and phrases, rules of opinions, etc. We used opinion words and phrases to detect comment bias. Words that are commonly used to express positive or negative sentiments are called opinion words.

3.2.5. Group Score ( G s )

There are many groups in which a user is involved. To obtain a group score, we first calculate the group influence, which is depicted in Table 2. We assume a group to be more active, as well as influential by three criteria: total members, members added the last 30 days, and total posts the last 30 days. Group influence is the summation of all these metrics for each group. It is defined as follows:
Group influence = ( Total members + members added the last 30 days + total posts the last 30 days )
The group score is the summation of all the group influence of a user that belongs to the social network. It is defined as:
G s = Total group influence

3.2.6. Share Score ( S s )

A Facebook user’s post is shared by many people according to the quality of that posts. The share score is the average number of “share” counts of that user. It is defined as:
S s = ( Total shares / Total posts )

3.2.7. Pages Liked Score ( P s )

To obtain a page score, we first calculate the page influence, which is depicted in Table 3. We assume a page to be more influential based on total followers, the comment score, and the review score. Total followers are the total number of followers following a page. To determine the comment score, we use the same method as discussed earlier. To determine the reviews, we use the following formula:
Total reviews = ( Total review score / Total reviewers )
Adding all the measures, we obtain the page influence. It is defined as:
Page influence = ( Total followers + comment score + review score )
The pages liked score is the summation of all users that have liked the pages. It is defined as:
P s = Total page influence

3.2.8. Check-in Score ( C h s )

A user checks into different places on Facebook. To determine the importance of these places, we consider the follower score, comment score, and review score of that page and call it check-in influence. We calculate the follower score, comment score, and review score by the same method used previously. It is defined as:
Check in influence = ( follower score + comment score + review score )
The check-in score is the summation of all the check-in influence of a user that belongs to the social network. It is defined as:
Ch s = Total check in influence

3.2.9. Mention Score ( M s )

A Facebook user is mentioned by several users in their posts, photos, etc. The mention score is the number of times in total a user ID is get mentioned or tagged by another user. It is defined as:
M s = Total get mentioned

3.2.10. Event Score ( E s )

A person attends several events, and to determine event importance, we assume two criteria: how many people are going and how many people are interested in that event. It is defined as:
Event influence = ( Total going + Total interested )
The event score is the summation of the event influence of a user of the social network. It is defined as:
E s = Total event influence

3.3. Table Construction

As we mentioned before, all our data set is in kvs (key-value storage) format. We first run all our data sets individually according to the formula given in Section 3.2 to obtain the individual score of each data set, like the friend score, follower score, reaction score, comment score, group score, share score, pages liked score, check-in score, mention score, and event score. However, for every data set that has a comment column, we use the CommentBias() [12] function to determine the polarity and replace the value with the corresponding comment. Then, we follow our algorithms for further processing.
We show the friend data set and group data set in kvs format in Table 7 and Table 8. The rest of the data sets also follows the same format. To avoid redundancy, we show here only two data sets.
By using Algorithm 1, the friend score, follower score, reaction score, comment score, share score, and mention score are calculated. However, we shown the friend score calculation here. Other metric scores are calculated by following the same procedure described in Algorithm 1. By using Algorithm 2, the group score, pages liked score, check-in score, and event score are calculated. We shown only the group score calculation here. Other metric scores are calculated by following the same procedure described in Algorithm 2.
The constructed table is shown in Table 9. We use this table for further calculations to find the influential people.
Algorithm 1 Friend score calculation.
1:
 procedure friend score
2:
      initialize Spark context
3:
      load data set into a data frame df
4:
      createOrReplaceTempView of df
5:
      perform SQL operation for score calculation
6:
      store result in df_friends
7:
 end procedure
Algorithm 2 Group score calculation.
1:
 procedure Group Score
2:
      initialize Spark context
3:
      load group data set into a data frame df_1
4:
      load group influence data set into data frame df_2
5:
      createOrReplaceTempView of df_2
6:
      perform SQL operation for score calculation, and store in df_3
7:
      inner join df_1 and df_3
8:
      store result in df_groups
9:
 end procedure

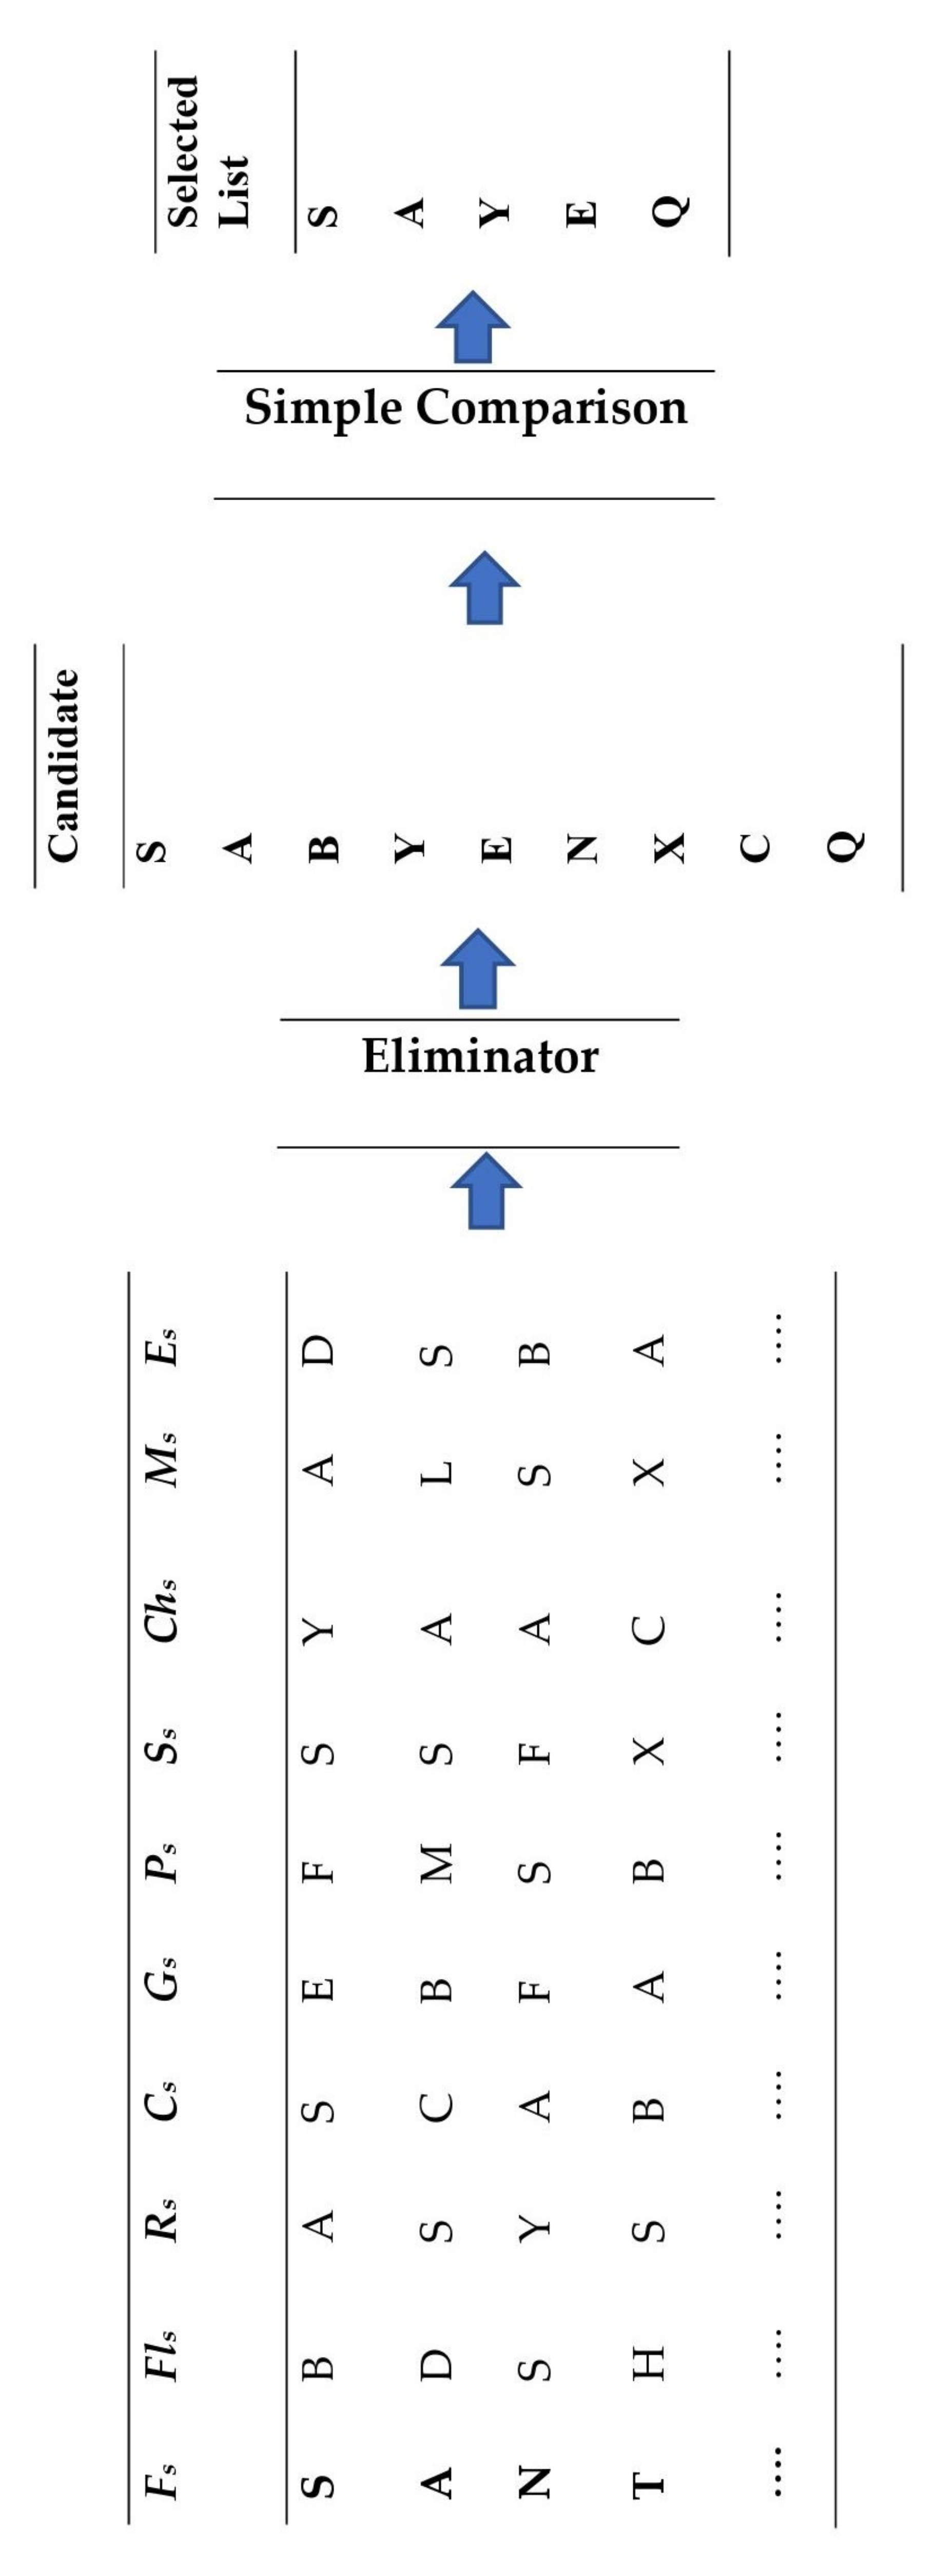
3.4. Influential People Selection

To select the influential people, we use the skyline query and top-k query.

3.4.1. Skyline Query

We first perform descending sort on the user ID according to the friend score, follower score, reaction score, comment score, group score, share score, pages liked score, check-in score, mention score, and event score. Then, we join all the tables. Then, we select the candidate list from among these sorted user IDs. As we have to select influential people based on ten criteria, an influential person ten opportunities to be selected as the best person. Therefore, for candidate selection, we programmed a Python function that maintains a counter for each user and appends a list, and if a user is retrieved ten times, then the calculation stops. Thus, we will find our candidate list. The total procedure of candidate selection is given in [12].
Here, the list returns S,A,B,Y,E,N,X,C,Q as the candidate list. Each candidate list contains separate domain values, which are given in Table 10. We have to perform a dominance test to retrieve the influential people. The dominance test is performed using a simple comparison algorithm. After the dominance test, we get our desired influential people. The procedure of the skyline query is shown graphically in Figure 2.

3.4.2. Top-k Query

There are many methods to run top-k queries efficiently. The top-k query aims to retrieve only the k best results from a large data set. We use the naive method as Spark uses the distributed computation technique, and the naive method gives efficient results in the Spark framework. We can use SQL queries very easily in PySpark.
The steps of the naive approach of top-k query are given below.
  • Compute the total score by adding all the attribute values (given in Table 9) using the SQL query in PySpark.
  • Sort all user IDs based on their scores in descending order.
  • Return the first k highest scored user IDs.
We set the limit to 10 users, so we got the top 10 influential people. The output of the top-k query is shown in Table 11.

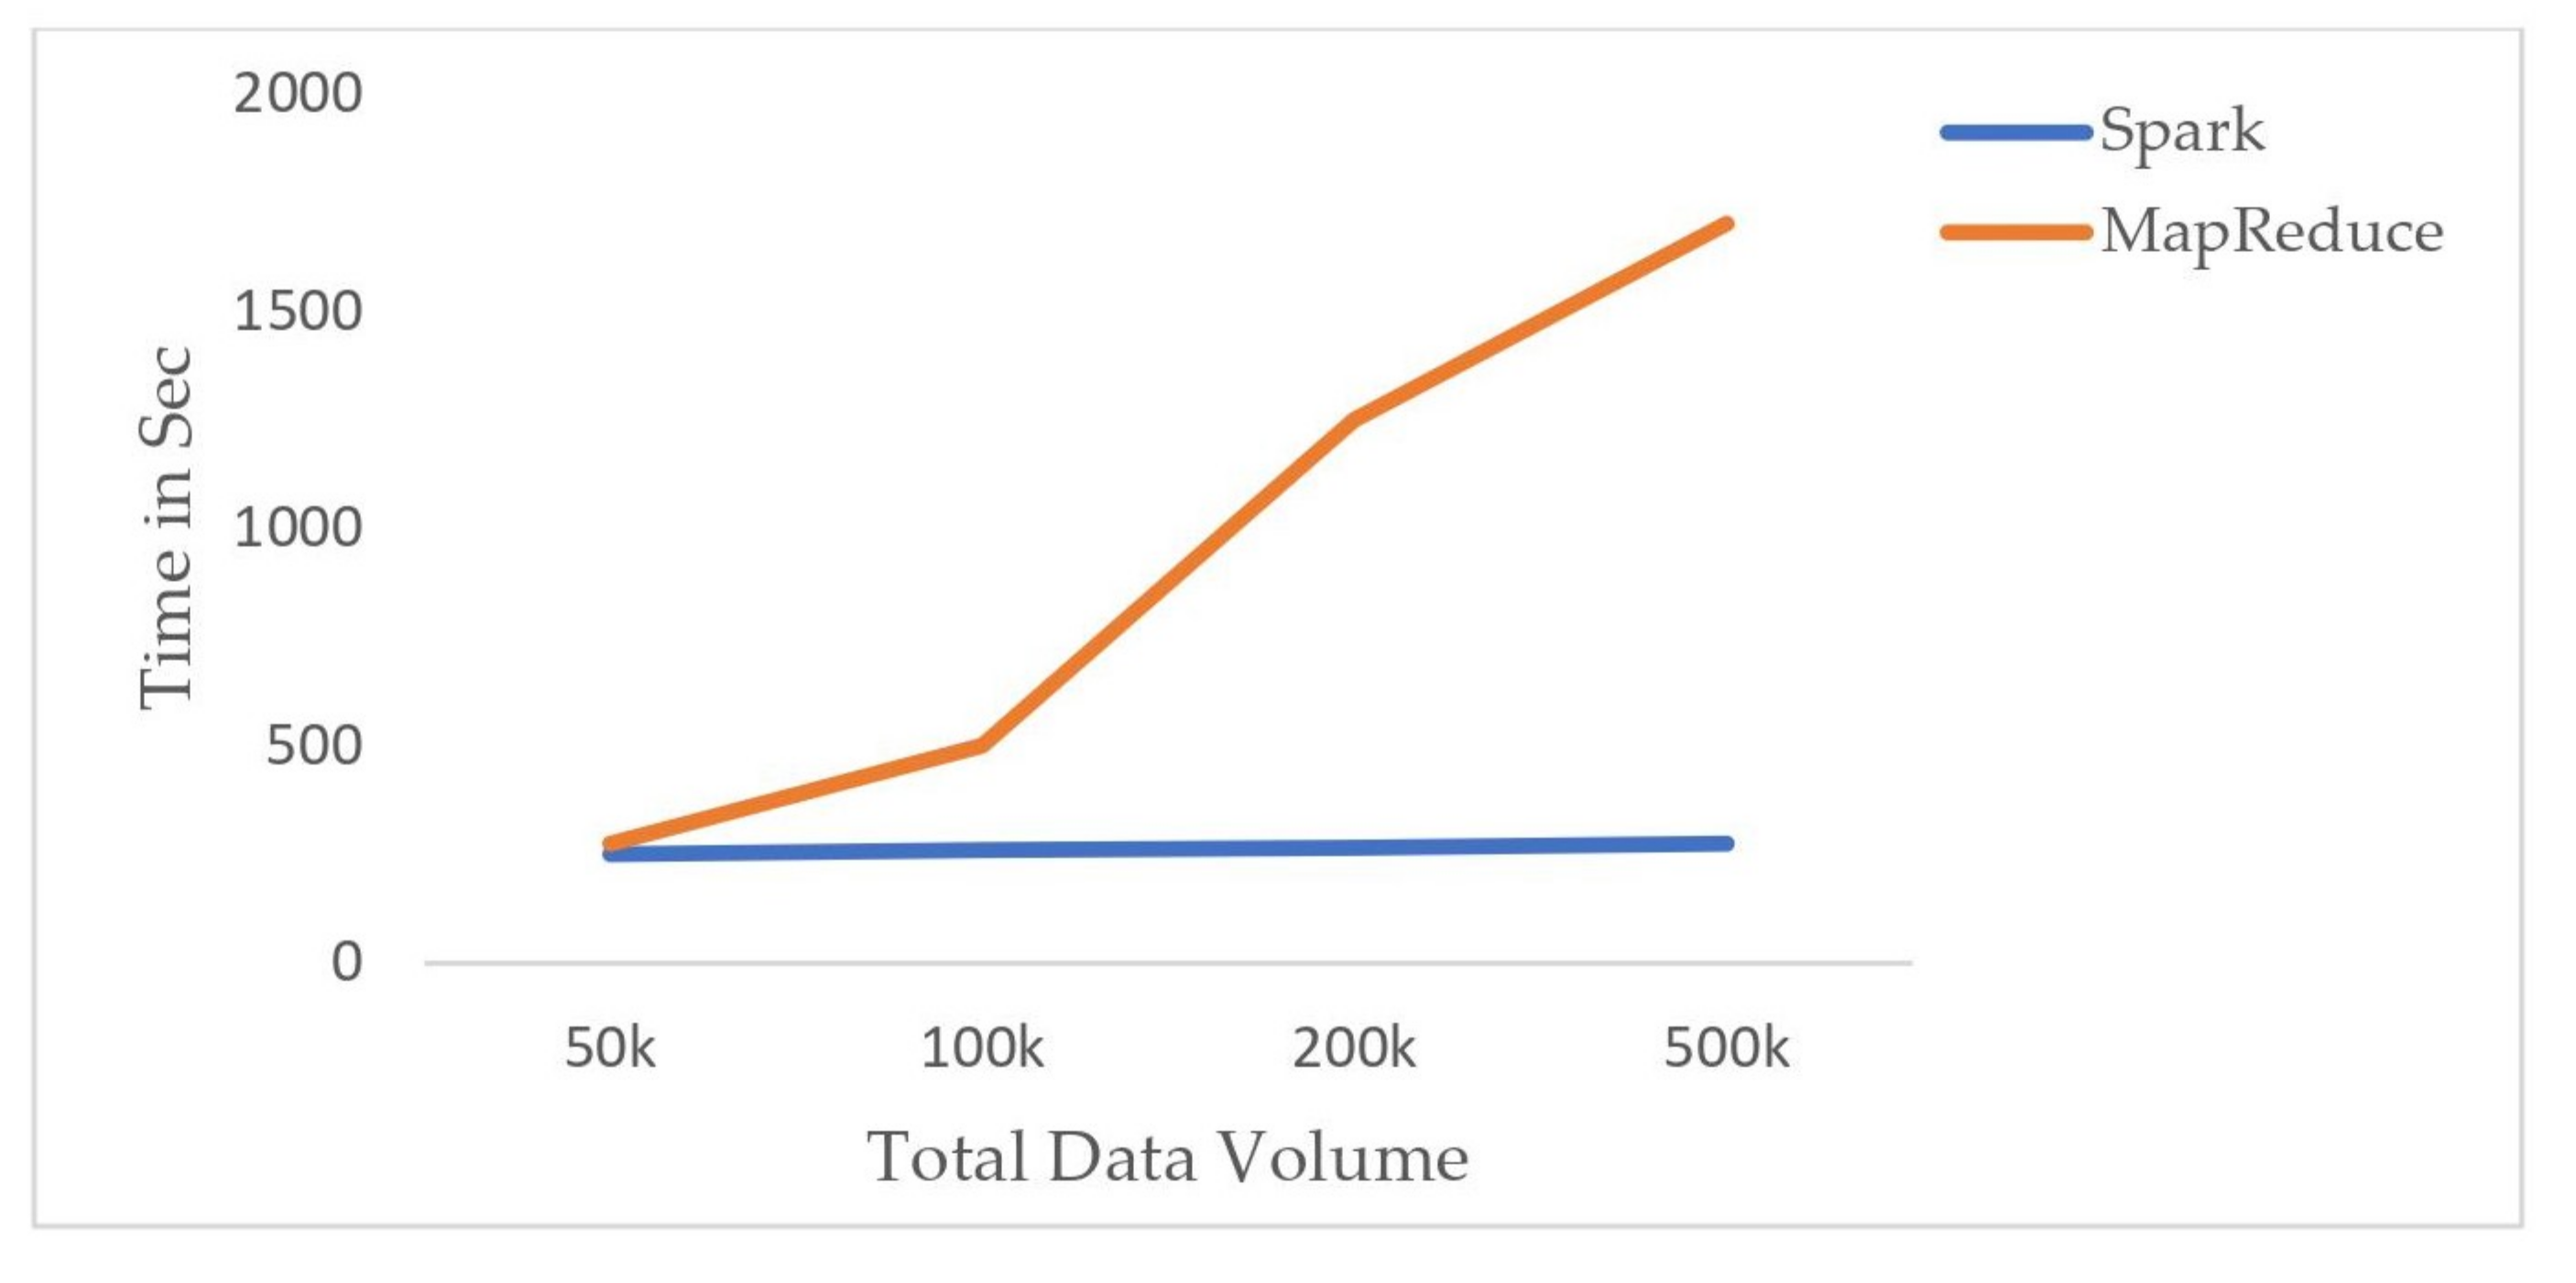
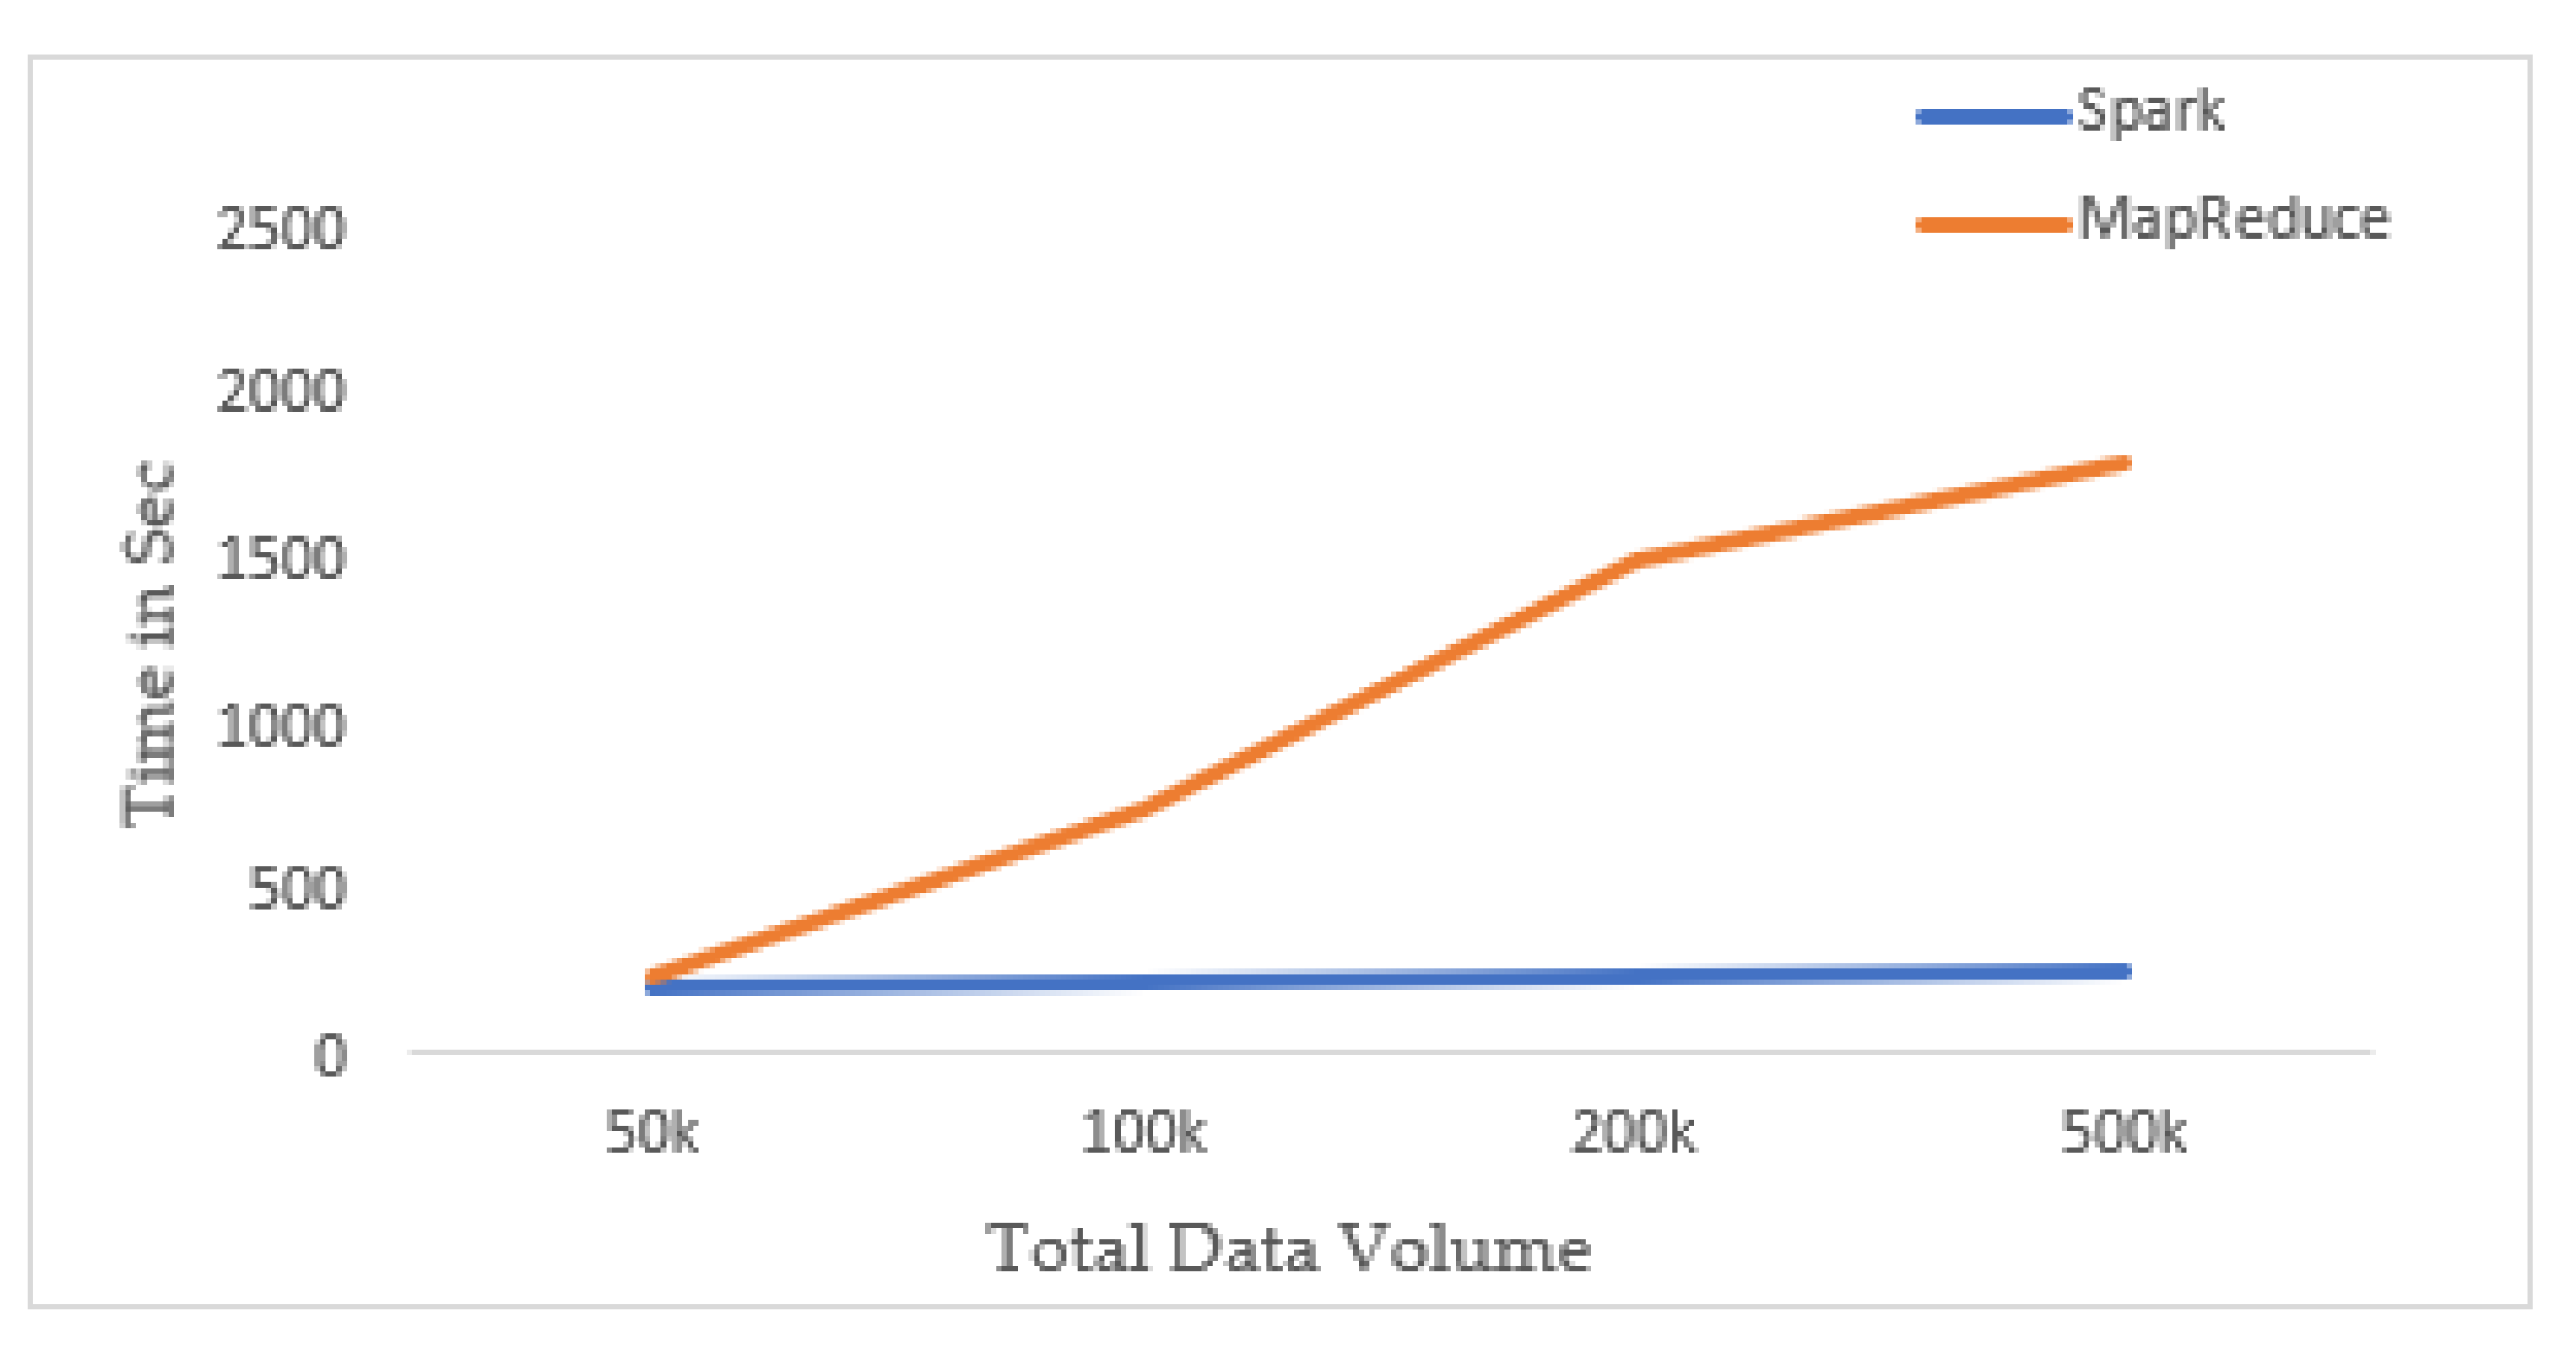
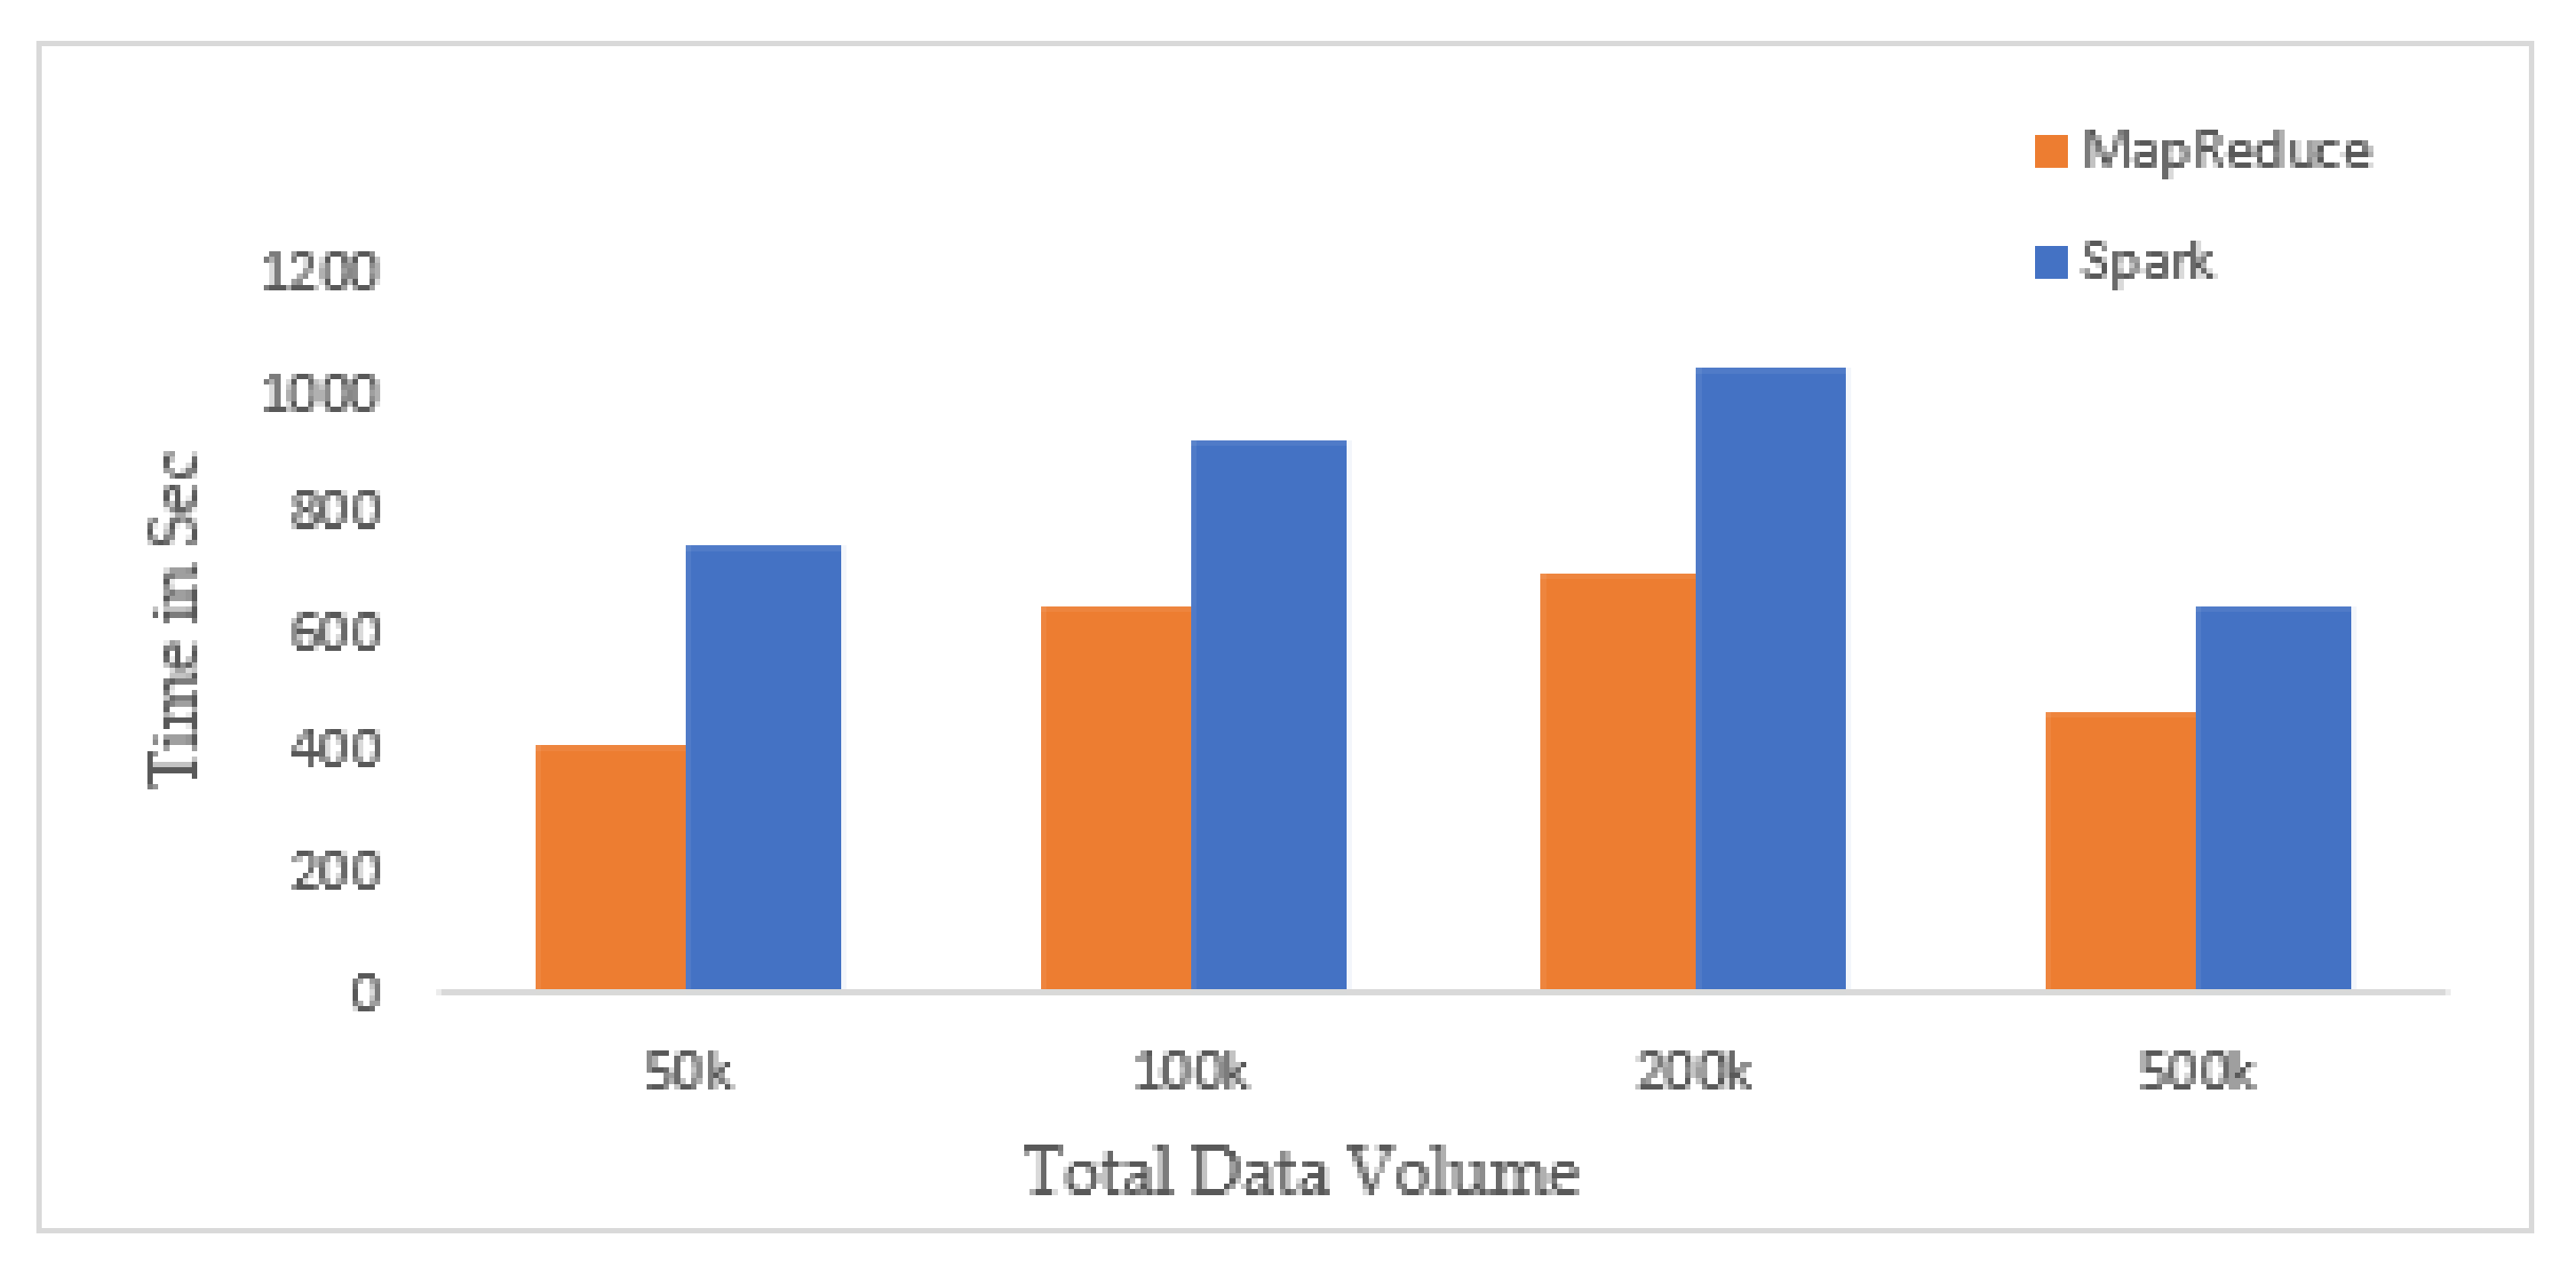
4. Experiments and Performance Evaluation

This section provides the experimental settings, as well as evaluates the performance of our methodology.

4.1. Experiment Setup

We set up a Hadoop cluster of 4 commodity PCs having 8 GB memory of each. Our Hadoop version was 2.7.1. The Apache Spark version was 2.0.0, and the Python version was 3.5.2, as it is compatible with Spark 2.0.0. The Java version was JDK 7u79. We used CentOS 7 as the operating system on each PC. The replication factor of the Hadoop configuration was 2.

4.2. Performance on Score Calculation

The score calculation table is shown in Table 6. We compared this result with the Hadoop MapReduce framework. There was a little time variation after submitting the job every time. Therefore, we repeated our job five times and took the average result. For automatic repetition, we used a crontab [36] schedule. The result is shown in Figure 3. We see that there is a constant time delay with respect to the total data volume from 50K to 500K. However, if the data volume becomes larger, there would be a slight increase in the processing time.

4.3. Performance on Skyline Queries

We used the naive approach of the skyline query. Generally, the naive approach of the skyline query takes too much time. However, in the Spark framework, we did not face such a problem. We also compared our work with the MapReduce framework. However, the time difference was huge. This is shown in Figure 4. Here, we also see that the time delay remains constant for the total data volume from 50K to 500K. The processing time would also vary here when the data volume increases.

4.4. Effect of New Metrics in Skyline Computation

The main problem of skyline computation is that either it may give a very small result set or a very large result set. It will create a great problem for a user if this condition occurs. Growing the size of social media matrices can limit the chance of experiencing such an issue. In [12], they used 5 matrices. As we use 10 metrics, we obtained more precise results, which are shown graphically in Figure 5.

4.5. Performance on Top-k Queries

The naive approach of top-k queries generally takes much time. However, within the Spark framework, it gives time-efficient results. We have compared it with the MapReduce framework. We can see that Spark is far better than MapReduce. The time comparison is shown in Figure 6.

5. Conclusions and Future Research Directions

As the nature of social networks is becoming more complicated day-by-day, social media data are also increasing at an exponential pace. Influencers on social media are currently receiving even more exposure as well. In this article, as we consider Facebook in our work, we suggest an effective method of identifying prominent individuals from the social network. Our method can obtain data from both skyline queries and top-k queries efficiently. We use Hadoop as the storage to manage the big data and Apache Spark to process the data. The algorithms used for calculating the score of different metrics and submitting the Spark job are simple, easy to implement, and very fast in obtaining the result as well. The effectiveness of our calculation is also demonstrated by multiple experiments.
In this work, we use synthetic data considering the data patterns of Facebook. In the future, we plan to use Twitter data and data from other social networking sites to further verify the performance and effectiveness of our proposed system. In addition, this work can be further expanded by adding more parameters to get more precise results.

Author Contributions

Conceptualization, M.S.A.A. and M.S.A.; investigation, M.S.A.A., M.S.A., A.S.M.K., M.H., and O.A.; methodology, M.S.A.A., M.S.A., A.S.M.K., M.H., and O.A.; implementation, M.S.A.A., M.S.A., and A.S.M.K.; experiment and evaluation, M.S.A.A. and M.S.A.; writing, original draft preparation, M.S.A.A. and M.S.A.; writing, review and editing, M.S.A.A., M.S.A., A.S.M.K., M.H., and O.A. All authors have read and agreed to the published version of the manuscript.

Funding

This research received no external funding.

Conflicts of Interest

The authors declare no conflict of interest.

References

  1. Mahbub, S.; Pardede, E.; Kayes, A.; Rahayu, W. Controlling astroturfing on the internet: A survey on detection techniques and research challenges. Int. J. Web Grid Serv. 2019, 15, 139–158. [Google Scholar] [CrossRef]
  2. Lu, L.; Dong, H.; Yang, C.; Wan, L. A novel mass data processing framework based on Hadoop for electrical power monitoring system. In Proceedings of the 2012 Asia-Pacific Power and Energy Engineering Conference, Shanghai, China, 27–29 March 2012; pp. 1–4. [Google Scholar]
  3. Tu, D.Q.; Kayes, A.; Rahayu, W.; Nguyen, K. IoT streaming data integration from multiple sources. Computing 2020, 102, 2299–2329. [Google Scholar] [CrossRef]
  4. Apache Hadoop. Available online: https://Hadoop.Apache.org/ (accessed on 1 October 2020).
  5. Shvachko, K.; Kuang, H.; Radia, S.; Chansler, R. The Hadoop distributed file system. In Proceedings of the 2010 IEEE 26th Symposium on Mass Storage Systems and Technologies (MSST2010), Incline Village, NV, USA, 3–7 May 2010. [Google Scholar] [CrossRef]
  6. Dean, J.; Ghemawat, S. MapReduce: Simplified data processing on large clusters. In Proceedings of the OSDI 2004—6th Symposium on Operating Systems Design and Implementation, San Francisco, CA, USA, 6–8 December 2004; pp. 137–149. [Google Scholar] [CrossRef] [Green Version]
  7. Tu, D.Q.; Kayes, A.; Rahayu, W.; Nguyen, K. ISDI: A new window-based framework for integrating IoT streaming data from multiple sources. In Proceedings of the International Conference on Advanced Information Networking and Applications, Matsue, Japan, 27–29 March 2019; Springer: Berlin, Germany, 2019; pp. 498–511. [Google Scholar]
  8. Doan, Q.T.; Kayes, A.; Rahayu, W.; Nguyen, K. Integration of IoT Streaming Data With Efficient Indexing and Storage Optimization. IEEE Access 2020, 8, 47456–47467. [Google Scholar] [CrossRef]
  9. Sarker, I.H.; Kayes, A.; Badsha, S.; Alqahtani, H.; Watters, P.; Ng, A. Cybersecurity data science: An overview from machine learning perspective. J. Big Data 2020, 7, 1–29. [Google Scholar] [CrossRef]
  10. Apache Spark™—What is Spark. Available online: https://databricks.com/Spark/about (accessed on 1 October 2020).
  11. Apache Spark™—Unified Analytics Engine for Big Data. Available online: https://Spark.Apache.org/ (accessed on 1 October 2020).
  12. Zaman, A.; Siddique, M.A.; Morimoto, Y. Finding Key Persons on Social Media by Using MapReduce Skyline. Int. J. Netw. Comput. 2017, 7, 86–104. [Google Scholar] [CrossRef] [Green Version]
  13. Qiu, J.; Tang, J.; Ma, H.; Dong, Y.; Wang, K.; Tang, J. DeepInf: Social influence prediction with deep learning. In Proceedings of the Proceedings of the ACM SIGKDD International Conference on Knowledge Discovery and Data Mining, London, UK, 19–23 August 2018; pp. 2110–2119. [Google Scholar] [CrossRef] [Green Version]
  14. Cao, C.C.; Shej, J.; Tong, Y.; Chen, L. Whom to ask? Jury selection for decision making tasks on micro-blog services. Proc. VLDB Endow. 2012, 5, 1495–1506. [Google Scholar] [CrossRef]
  15. Demartini, G.; Gaugaz, J.; Nejdl, W. A vector space model for ranking entities and its application to expert search. In European Conference on Information Retrieval; Lecture Notes in Computer Science (including Subseries Lecture Notes in Artificial Intelligence and Lecture Notes in Bioinformatics; Springer: Berlin/Heidelberg, Germany, 2009; Volume 5478 LNCS, pp. 189–201. [Google Scholar] [CrossRef]
  16. Lappas, T.; Liu, K.; Terzi, E. Finding a team of experts in social networks. In Proceedings of the ACM SIGKDD International Conference on Knowledge Discovery and Data Mining, Paris, France, 28 June–1 July 2009; pp. 467–475. [Google Scholar] [CrossRef] [Green Version]
  17. Zaharia, M.; Chowdhury, M.; Franklin, M.J.; Shenker, S.; Stoica, I. Spark: Cluster computing with working sets. In Proceedings of the 2nd USENIX Workshop on Hot Topics in Cloud Computing (HotCloud 2010), Boston, MA, USA, 22 June 2010. [Google Scholar]
  18. Gopalani, S.; Arora, R. Comparing Apache Spark and Map Reduce with Performance Analysis using K-Means. Int. J. Comput. Appl. 2015, 113, 8–11. [Google Scholar] [CrossRef]
  19. Meng, X.; Bradley, J.; Yavuz, B.; Sparks, E.; Venkataraman, S.; Liu, D.; Freeman, J.; Tsai, D.B.; Amde, M.; Owen, S.; et al. MLlib: Machine learning in Apache Spark. J. Mach. Learn. Res. 2016, 17, 1235–1241. [Google Scholar]
  20. Gupta, A.; Thakur, H.K.; Shrivastava, R.; Kumar, P.; Nag, S. A Big Data Analysis Framework Using Apache Spark and Deep Learning. In Proceedings of the IEEE International Conference on Data Mining Workshops (ICDMW), New Orleans, LA, USA, 18–21 November 2017; pp. 9–16. [Google Scholar] [CrossRef] [Green Version]
  21. Nair, L.R.; Shetty, S.D. Streaming twitter data analysis using Spark for effective job search. J. Theor. Appl. Inf. Technol. 2015, 80, 349–353. [Google Scholar]
  22. Bentley, J.L.; Kung, H.T.; Schkolnick, M.; Thompson, C.D. On the Average Number of Maxima in a Set of Vectors and Applications. J. ACM (JACM) 1978, 25, 536–543. [Google Scholar] [CrossRef] [Green Version]
  23. Kung, H.T.; Luccio, F.; Preparata, F.P. On Finding the Maxima of a Set of Vectors. J. ACM (JACM) 1975, 22, 469–476. [Google Scholar] [CrossRef]
  24. Borzsonyil, S.; Kossmann, D.; Stocker, K. The Skyline Operator. In Proceedings of the 17th International Conference on Data Engineering, Heidelberg, Germany, 2–6 April 2001; pp. 421–430. [Google Scholar]
  25. Street, K.; York, N.; Canada, O.M.J. Skyline with Presorting Jan Chomicki, Parke Godfrey, Jarek Gryz and Dongming Liang; Department of Computer Science, York University: York, UK, October 2002. [Google Scholar]
  26. Tan, K.L.; Eng, P.K.; Ooi, B.C. Efficient progressive skyline computation. In Proceedings of the VLDB 2001—Proceedings of 27th International Conference on Very Large Data Bases, Roma, Italy, 11–14 September 2001; pp. 301–310. [Google Scholar]
  27. Chan, C.Y.; Jagadish, H.V.; Tan, K.L.; Tung, A.K.; Zhang, Z. Finding k-dominant skylines in high dimensional space. In Proceedings of the ACM SIGMOD International Conference on Management of Data, Chicago, IL, USA, 27–29 June 2006; pp. 503–514. [Google Scholar] [CrossRef]
  28. Balke, W.T.; Güntzer, U.; Zheng, J.X. Efficient distributed skylining for web information systems. Lect. Notes Comput. Sci. (Incl. Subser. Lect. Notes Artif. Intell. Lect. Notes Bioinform.) 2004, 2992, 256–273. [Google Scholar] [CrossRef] [Green Version]
  29. Marian, A.; Bruno, N.; Gravano, L. Evaluating top-k queries over web-accessible databases. ACM Trans. Database Syst. 2004. [Google Scholar] [CrossRef] [Green Version]
  30. Chang, K.C.C.; Hwang, S.W. Minimal probing: Supporting expensive predicates for top-K queries. In Proceedings of the ACM SIGMOD International Conference on Management of Data, Madison, WI, USA, 3–6 June 2002; pp. 346–357. [Google Scholar]
  31. Li, C.; Chang, K.C.C.; Ilyas, I.F.; Song, S. RankSQL: Query algebra and optimization for relational top-k queries. In Proceedings of the ACM SIGMOD International Conference on Management of Data, Baltimore, MA, USA, 14–16 June 2005; pp. 131–142. [Google Scholar]
  32. Chaudhuri, S.; Gravano, L. Evaluating Top-k Selection Queries. Vldb 1999, 1, 397–410. [Google Scholar]
  33. Donjerkovic, D.; Ramakrishnan, R. Probabilistic Optimization of Top N Queries. Int. Conf. Very Large Databases (VLDB) 1999, 1, 411–422. [Google Scholar]
  34. PySpark. Available online: https://Spark.Apache.org/docs/2.1.0/api/python/PySpark.html (accessed on 1 October 2020).
  35. Pang, B.; Lee, L. Opinion mining and sentiment analysis. Found. Trends Inf. Retr. 2008, 2, 1–135. [Google Scholar] [CrossRef] [Green Version]
  36. Cron Job. Available online: https://en.wikipedia.org/wiki/Cron (accessed on 1 October 2020).
Figure 1. System architecture for finding influential people. HDFS, Hadoop Distributed File System.
Applsci 10 08773 g001
Figure 2. Skyline computation.
Applsci 10 08773 g002
Figure 3. Performance on score calculation.
Applsci 10 08773 g003
Figure 4. Performance on skyline queries.
Applsci 10 08773 g004
Figure 5. Effect of new metrics in skyline computation.
Applsci 10 08773 g005
Figure 6. Performance on top-k queries.
Applsci 10 08773 g006
Table 1. Facebook data.
User IDFriendsFollowersReactionsCommentsGroupsSharesPages LikedCheck-insMentioned byEvents Attended
AU, V,

X, Z,

….
S, D,

R, Y,

….
(1, T),

(3, I),

....
(3, Z, Comment5),

(6, E, Comment4),

….
G1,

G3,

G5,

….
(1,E),

(8, C),

….
P1,

P2,

P3,

….
C1,

C2,

C5,

….
(B, 6),

(M, 7),

….
E1, E2,

….
BC, M,

L, S,

S, P,

W, X,

….
(2, F),

(9, C),

….
(5, E, Comment9),

(2, P, Comment3),

….
G3,

G7,

G9,

….
(2, F),

(3, D),

….
P8,

P5,

P7,

….
C3,

C5,

C9,

….
(E, 2),

(C, 5),

….
E3, E5,

….
CA, C,

Y, U,

I, …
M, J,

K, L,

….
(16, I),

(21, J),

….
(7, A, Comment8),

(1, F, Comment2),

….
G12,

G15,
G19,

….
(7, S),

(5, N),

….
P2,

P4,

P7,

….
C1,

C9,

C11,

….
(A, 12),

(B, 17),

….
E4, E6,

….
DM, K,

S, O,

P, …
P, W,

T, I,

….
(1, E),

(8, M),

….
(9, R, Comment7),

(4, I, Comment12),

….
G2,

G4,

G6,

….
(11, I),

(4, X),

….
P5,

P6,

P9,

….
C12,

C19,

C21,

….
(R, 2),

(V, 9),

….
E7, E9,

….
…..………..…….…….…….….….…..…...
Table 2. Group influence.
GroupTotal MembersMembers Added the Last 7 DaysTotal Posts Last 30 Days
G11270E,F,G..200
G22100D,E,F..134
G31700M,N,O..305
…..….…..
Table 3. Page influence.
PageFollowersCommentsReviews
P1A,B,C…(5,Q,Comment1)…(R,4)…
P2A,C,E…(2,P,Comment3)…(S,5)…
P3L,M,P….(1,T,Comment9)…(U,3)…
….…..…..…..
Table 4. Check-in influence.
PlaceFollowersCommentsReviews
C1B,C,D…(9,S,Comment2)…(Q,5)…
C2W,E,R…(7,E,Comment1)…(A.3)…
C3T,Y,U….(3,Q,Comment5)…(C,5)…
….…..…..…..
Table 5. Event influence.
EventGoingInterested
E1180350
E2305751
E3200500
…..……
Table 6. Symbols and their meanings.
Considered MetricsSymbols
Friend Score F s
Follower Score F l s
Reaction Score R s
Comment Score C s
Group Score G s
Share Score S s
Pages Liked Score P s
Check-in Score C h s
Mention Score M s
Event Score E s
Table 7. Friends data set in key-value storage (kvs) format.
User IDFriends
AU,V,X,Z,….
BC,M,L,S,…
CA,C,Y,U,…
DM,K,S,O,…
..........
Table 8. Groups dataset in kvs format.
User IDGroups
AG1,G3,G5,….
BG3,G7,G9,….
CG12,G15,G19,….
DG2,G4,G6,….
..........
Table 9. Score calculation for each metric.
User ID F s Fl s R s C s G s P s S s Ch s M s E s
A10022001032003024097054197
B905125951205042069065129
C50750537521011510543205
D1506500150240270101320294511
…..…..…..…..…..…..…..…..…..…..…..
Table 10. Candidate domain values.
User ID F s Fl s R s C s G s P s S s Ch s M s E s
S7013058010719244692602811
A100220010320030240970541914
B905125951205042069065129
Y1501550152243267103229495515
E105621010925430455096656712
N654120196311390653841
X700994045101112705682
C50750537521011510543205
Q87737640831201546844296
Table 11. Top-K query result.
User IDInfluential Score
S9006
G8987
J8970
H8901
L8890
T8889
K8850
M8820
Z8809
X8805
Publisher’s Note: MDPI stays neutral with regard to jurisdictional claims in published maps and institutional affiliations.

