Article

A Systematic Comparative Study of the Toxicity of Semiconductor and Graphitic Carbon-Based Quantum Dots Using In Vitro Cell Models

by
Maria Carmen Navarro-Ruiz
1,2,†,
Angelina Cayuela
3,†,
María Laura Soriano
3,4,*,
Rocio Guzmán-Ruiz
1,2,
Maria M. Malagón
1,2,* and
Miguel Valcárcel
3,*
1
Department of Cell Biology, Physiology, and Immunology, Instituto Maimónides de Investigación Biomédica de Córdoba (IMIBIC), University of Córdoba, Reina Sofia University Hospital, 14014 Córdoba, Spain
2
CIBER Fisiopatología de la Obesidad y Nutrición (CIBERobn), Instituto de Salud Carlos III, 28029 Madrid, Spain
3
Department of Analytical Chemistry, Institute of Fine Chemistry and Nanochemistry, Marie Curie Building, Campus Universitario de Rabanales, University of Córdoba, E-14071 Córdoba, Spain
4
Regional Institute for Applied Chemistry Research (IRICA), 13004 Ciudad Real, Spain
*
Authors to whom correspondence should be addressed.
These authors contributed equally to this work.
Appl. Sci. 2020, 10(24), 8845; https://doi.org/10.3390/app10248845
Submission received: 11 November 2020 / Revised: 28 November 2020 / Accepted: 7 December 2020 / Published: 10 December 2020
(This article belongs to the Special Issue Application of Nanomaterials/Nanotechnology in Analytical Chemistry)

Abstract

:
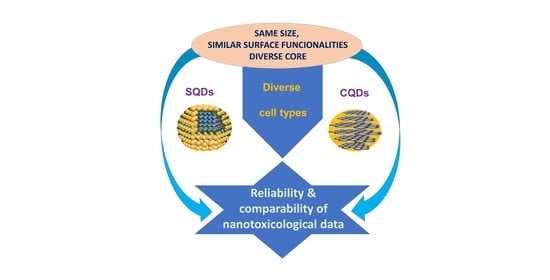
A comparative, fully parallel study of nanoparticles (NPs) toxicity by in vitro cell viability is shown looking for reliable comparability of nanotoxicological results, a well-recognized bottleneck in the context. This procedure is suitable to compare toxicity of similar NPs, as well as the influence on toxicity of the size, surface, and other characteristics. As a case of study, semiconductor (SQDs) and graphitic-carbon quantum dots (CQDs) with identical surface groups and size were evaluated. All experiments were conducted at same conditions, involving two types of cells (mouse fibroblasts (3T3-L1) and carcinoma human hepatocellular cells (HepG2)) and different extracellular components (in the absence or presence of fetal bovine serum (FBS)). Cell viability demonstrated the excellent biocompatibility of CQDs compared to SQDs, which caused higher percentage of cell death at lower concentrations, as predicted but never clearly demonstrated. However, our comparative studies established that the toxicity of SQDs and CQDs are cellular type-dependent, and the absence or presence of serum proteins reduces the minimal concentration necessary of NPs to produce toxicity.

Graphical Abstract

1. Introduction

In the last decades, highly luminescent nanomaterials have achieved a special position in nanomedicine applications due to their low cost, easy preparation, high reactivity, and excellent photoluminescence properties. The term “quantum dots” was firstly coined to the known semiconductor-based dot [1], but recently, Cayuela et al. [2] reported a novel framework to assign an adequate terminology for the different types of fluorescent nanodots containing quantum confinement: semiconductor quantum dots (SQDs) and carbon-based quantum dots (CQDs). Since the discovery of SQDs [1], their exploitation for bioimaging, tracking, and drug delivery have significantly improved the state-of-the-art labeling and sensing technologies, thus providing great expectations in the fabrication of innovative medical nanotools as an alternative to the conventional ones, such as organic dyes [3,4,5]. Accordingly, the number of published applications with SQDs has experienced a considerable increase, especially in biology and clinics [2]. In particular, this has demonstrated their potential in fluorescence resonance energy transfer (FRET) analysis, drug delivery, in vivo animal imaging, therapeutics, and cell tracking [6,7]. However, their use is limited by their potential toxicity associated with the release of heavy metals; thus, further analysis focused on identifying new fluorescent NPs with enhanced properties in biological and medical applications as alternatives of SQDs will be necessary.
In this line, the next QD generation consists of green nanomaterials that afford these mentioned multipurpose applications in nanomedicine. Thus, graphitic CQDs, discovered in 2004 during the purification of carbon nanotubes [8], have emerged as excellent candidates for both sensing and imaging biological systems. These QD generations show low toxicity to overcome the toxic effects faced by organic dyes and SQDs, and require an easy and low-cost production. CQDs exhibit stable photoluminescence properties, which can be tuned from the synthetic route chosen to the passivation/functionalization, following steps. Since their discovery, applications related to (bio)chemical sensing, photocatalysis, bioimaging, or drug delivery have been reported [2,9,10,11,12,13,14,15,16]. In recent years, CQDs have been explored in cell viability studies. Ray et al. [17] proposed the use of fluorescent carbon NPs as an ideal cell-imaging probe able to get into cells without any specific surface modification, whereas Liu et al. [18] used polyethylenimine functionalized carbon-based nanodots to both reduce toxicity and increment gene expression of plasmid DNA in carcinoma cells. However, others reported a comparison of the same fluorescent nanodots in fibroblasts and demonstrated their compatibility and use as gene delivery carriers for cancer treatment [19]. On the one hand, a systematic safety evaluation, via acute and subacute toxicities of carbon-based nanodots, reported by Wang et al. [20] demonstrated the lack of toxic effects. In fact, CQDs were reported to be biocompatible NPs in a variety of cell lines upon different experimental conditions. In this sense, a recent report on the effects of CQDs with different surface charges on the viability, proliferation, differentiation, cellular uptake, and stability of CQDs in human umbilical cord-derived mesenchymal stem cells showed that lower positively-charged CQDs maintain a good balance between biocompatibility and cellular uptake in these cells [21]. Likewise, Blas-Garcia et al. [22] reported an interesting in vitro toxicological study that demonstrated the correlation of toxicity with nanoparticle concentration at different exposition times (24, 48, and 72 h). On the other hand, regarding the influence of the nanoparticle surface in toxicological studies, Havrdova et al. [23] compiled and investigated the cytotoxicity of carbon-based nanodots as a function of the superficial charges conferred by different functional groups. Results demonstrated that the neutral-charged nanodots did not evoke oxidative stress in cells or changes in cell morphology in contrast to charged nanodots. In fact, the highest toxicity was induced by the positively-charged nanodots caused by their easy internalization into the nucleus, affecting cell morphology and evoking oxidative stress; this finding is in accordance with other reports [24] showing the nuclear translocation of zwitterionic carbon-based nanodots modified with β-alanine with positive and negative groups onto their surface.
Although these two big families of fluorescent nanodots, SQDs and CQDs, have been explored in bioimaging and biosensing of biological systems, there is not precise knowledge about how they behave in a cell type under exactly the same conditions. Herein, we propose a reliable comparative study of cell viability in two different cell types, fibroblasts and hepatocytes, exposed to CQDs and SQDs of equal size and negatively-charged surfaces, under the same physiological and cellular stress conditions. Cytotoxicity was measured by MTT assay upon exposure of fibroblast and hepatocyte cell lines to a wide range of nanoparticle concentrations. Cellular internalization of CQDs and SQDs was tracked by confocal microscopy, and the influence of the extracellular environment on nanoparticle-induced toxicity and nanoparticle properties (size, shape, surface charge) was assessed by spectrometry and spectroscopy, respectively. Therefore, this article aims at finding a new approach to assure reliability/comparability of the results of toxicological studies of NPs.

2. Materials and Methods

2.1. Materials

Multi-walled carbon nanotubes (MWCNTs) were purchased from Bayer (Germany). Nitric acid (69%) and sulfuric acid (95–98%) were obtained from PANREAC, S.A.U. (Barcelona, Spain). Hydrophilic SQDs composed of CdTe were purchased from PlasmaChem (Berlin, Germany). Dulbecco’s Modified Eagle’s Medium-low glucose (DMEM), Minimum Essential Medium Eagle (MEM), fetal bovine serum (FBS), MEM non-essential amino acid solution (100×, without L-glutamine), sodium bicarbonate (99.5–100.5%), L-glutamine solution (200 mM), antibiotic-antimycotic solution (10,000 units penicillin, 10 mg streptomycin, and 25 μg amphotericin B per mL), phosphate buffered saline (PBS, 10×), 3-(4,5-dimethyl-2-thiazolyl)-2,5-diphenyl-2H-tetrazolium bromide (MTT, 97.5%), dimethyl sulfoxide (DMSO, 99.5%), 4′,6-diamidino-2-phenylindole dihydrochloride (DAPI) powder, acetone (99.5%), ethanol (95%), and sodium carbonate (99.95%) were purchased from Sigma-Aldrich (Madrid, Spain). Paraformaldehyde (PFA, 95%) was purchased from LabClinics (Barcelona, Spain). Dako fluorescence mounting medium was purchased from Dako North America (Carpinteria, CA, USA). Murine 3T3-L1 fibroblasts were purchased from American Type Culture Collection (ATCC; LGC Standards SLU, Barcelona, Spain), and human hepatocellular carcinoma HepG2 cells from the European Collection of Cell Cultures (ECACC; Operated by Public Health England, Salisbury, UK).

2.2. Equipment

Fluorescence and absorption spectra of the nanodots in aqueous solution were recorded using a PTI QuantaMasterTM spectrofluorometer (Photon Technology International, Birmingham, NJ, USA) equipped with a 75 W xenon short arc lamp, a model 814 PMT detection system, and FeliX32 software. A FlexStation 3 multi-mode microplate reader (Molecular Devices, San Jose, CA, USA) was employed for measurement of cell viability in MTT assays and total intracellular fluorescence upon exposure of cells to nanodots (see below). Immunofluorescence measurements after CQDs treatment were also visualized in cells using a Zeiss LSM 710 spectral confocal microscopy (Carl Zeiss, Oberkochen, Germany).

2.3. Methods

2.3.1. Synthesis of Carbon-Based Quantum Dots

CQDs were synthesized as reported in our previous work [25] using the top-down methodology. Multi-walled carbon nanotubes (0.1 g) were added to 10 mL of an acidic mixture of H2SO4:HNO3 (3:1) and then were heated under reflux conditions at 140 °C for 7 h. A passivation step with acetone was performed to introduce carboxylic groups onto CQD surface with the aim of enhancing their fluorescence. Once CQDs were purified, a neutralization step with sodium carbonate was performed. Finally, the excess of salts was removed by coprecipitation with ethanol at low temperatures. The obtained negatively-charged CQDs were stored (at 4 °C) until use.

2.3.2. Cell Culture

3T3-L1 cells were seeded onto 12-well plates at a density of 3000 cells·cm−2 and incubated in DMEM, pH 7.4, containing FBS (10% v/v), sodium bicarbonate (1.5 g·L−1), glutamine (4 mM), and antibiotic-antimycotic solution (1% v/v) [26]. HepG2 cells were cultured at a density of 20,000 cells·cm−2 onto 12-well plates in MEM, pH 7.4, supplemented with FBS (10% v/v), non-essential amino acid solution (1% v/v), sodium pyruvate (1% v/v), and antibiotic-antimycotic solution (1% v/v). Both cell lines were incubated at 37 °C under a humidified atmosphere containing 5% CO2 for 3 days. For confocal microscopy studies, cells were grown on glass coverslips under the same conditions as those described for cell viability assays.

2.3.3. Exposure of Cells to CQDs and SQDs

We tested the response of 3T3-L1 and HepG2 cells to CQDs or SQDs in the presence or absence of serum (FBS) in the culture media. On the day of the experiments, the culture medium was removed, and cells were preincubated for 2 h at 37 °C under 5% CO2 humidified atmosphere in either serum-deprived or serum-complemented culture media for cell stabilization. Thereafter, cells were exposed to increasing concentrations (0–1600 mg·L−1) of either CQDs or SQDs in culture media containing, or not, FBS for 24 h at 37 °C under a humidified atmosphere containing 5% CO2.

2.3.4. MTT Cytotoxicity Assay

Cell viability in 3T3-L1 and HepG2 cell cultures after 24 h of exposure to increasing concentrations of CQDs and SQDs was measured by a yellow tetrazolium salt (MTT) assay, as previously described [26]. This assay is based on the conversion of MTT to dark blue formazan crystals by the action of mitochondrial succinate dehydrogenase in live cells. Briefly, culture media were removed after the treatments, and 500 µL of MTT (0.1 mg·mL−1) were added to the cells. After a 2 h- or 5 h-incubation period at 37 °C under 5% CO2 humidified atmosphere, for cells cultured in the presence or absence of FBS, respectively, the solution was removed and cells were incubated with 500 µL of DMSO to dissolve the formazan crystals. The optical density of the solubilized formazan was determined at a wavelength of 570 nm. Untreated cells cultured under the same experimental conditions as those exposed to nanodots were employed as controls (100% viable), and cell viability values for CQD- or SQD-treated cultures were expressed as a percentage relative to the control.

2.3.5. Immunofluorescence and Confocal Microscopy

The optical properties of CQDs and SQDs were characterized by photoluminescence and absorbance at a concentration of 200 mg·L−1. Changes in the emission signal of the nanodots in the presence of serum and different culture media were also evaluated. To be more specific, solutions of DMEM, MEM, and FBS were added to the nanodots solution (50 mg·L−1), maintaining the same proportion and experimental conditions used in the experiments for measuring cell viability.
In another set of experiments, cellular internalization of CQDs was assessed by measuring fluorescence signals (excitation wavelength of 365 nm and emission wavelength of 450 nm) in 3T3-L1 cells exposed for 1 h or 6 h to different nanoparticle concentrations (0.2, 10, and 25 mg·L−1), in the absence or presence of serum.
3T3-L1 cells grown on glass coverslips were processed for immunofluorescence and examined by confocal microscopy. After the treatments, cells were fixed in 4% PFA for 10 min, rinsed in PBS 1×, incubated with DAPI in PBS 1× during 5 min at 37 °C to stain the nuclei, and mounted with Dako fluorescence mounting medium. Coverslips bearing the cells were placed under an LSM 710 confocal laser-scanning microscope (Carl Zeiss, Jena, Germany). Depending on the cell depth, 10–20 stacks per channel were collected, projected in a single image, and merged offline. After acquisition, images underwent a deconvolution process with the software package HUYGENS ESSENTIAL 2.4.4 (Scientific Volume Imaging, Hilversum, The Netherlands).

2.3.6. Statistical Analysis

Experiments were repeated at least three times on different conditions, and a minimum of three replicate wells per treatment was tested in each experiment. Cell viability was expressed as mean ± SEM (standard error mean). Statistical differences were determined using a one-way ANOVA multiple comparison test followed by Fisher’s least significant difference (LSD) test. Values were considered significant at p < 0.05. Statistical analyses were performed using GraphPad Prism version 7.00 (GraphPad Software, San Diego, CA, USA).

3. Results and Discussion

3.1. Results

3.1.1. Selection and Optical Characterization of CQDs and SQDs

First, in order to establish an adequate comparative toxicological study, it is important to define and describe the main features of each of the fluorescent quantum dots, separately and in combination.
Both water-soluble CQDs and SQDs exhibited stable emission behaviors during a long-term irradiation, without any noticeable precipitation at room temperature. The maximum excitation (365 nm and 390 nm for CQDs and SQDs, respectively) and emission (450 nm and 650 nm for CQDs and SQDs, respectively) wavelengths of the two types of nanodots are depicted in Figure 1. The maximum emission of SQDs was independent of excitation (Figure S1 in Supplementary materials), whilst the CQD emission band shifted as a function of the excitation wavelength, as previously reported [25].
To explore the electron-donor capability of both selected nanodots, CQDs and SQDs were mixed at equimolar concentrations. The photoluminescence curve for SQDs in the presence of CQDs resulted in a significant reduction of their fluorescence intensity when excited at 390 nm (Figure S2), indicating that an electron transfer occurred.

3.1.2. Evaluation of Toxicity of CQDs and SQDs

Next, it is important to test the cell type; each cell has different morphological and metabolic characteristics. It is also essential to test the different external conditions to which the cells are exposed, since they can also be of interest in the medium–quantum dots interaction. In this study, the use of two different cell lines, grown with different culture media, was proposed to elucidate the effect of quantum dots on the cell type and on the interactions with different extracellular components.

Toxicity of CQDs and SQDs in 3T3-L1 Cells

  • Defining the optimal cellular conditions prior to cytotoxicity assay.
Previous in vitro toxicity assays involving exposure of 3T3-L1 cells to polyethylene glycol coated single-walled carbon nanotubes (SWCNTs-PEG) demonstrated that changes in cell viability could be already detected after 24 h of treatment [26]. Moreover, in our previous study, we showed that the presence of serum was essential to maintain 3T3-L1 cell viability after exposure to NPs [26].
Condition 1: Absence of serum in cell culture:
i.
MTT cell viability assay.
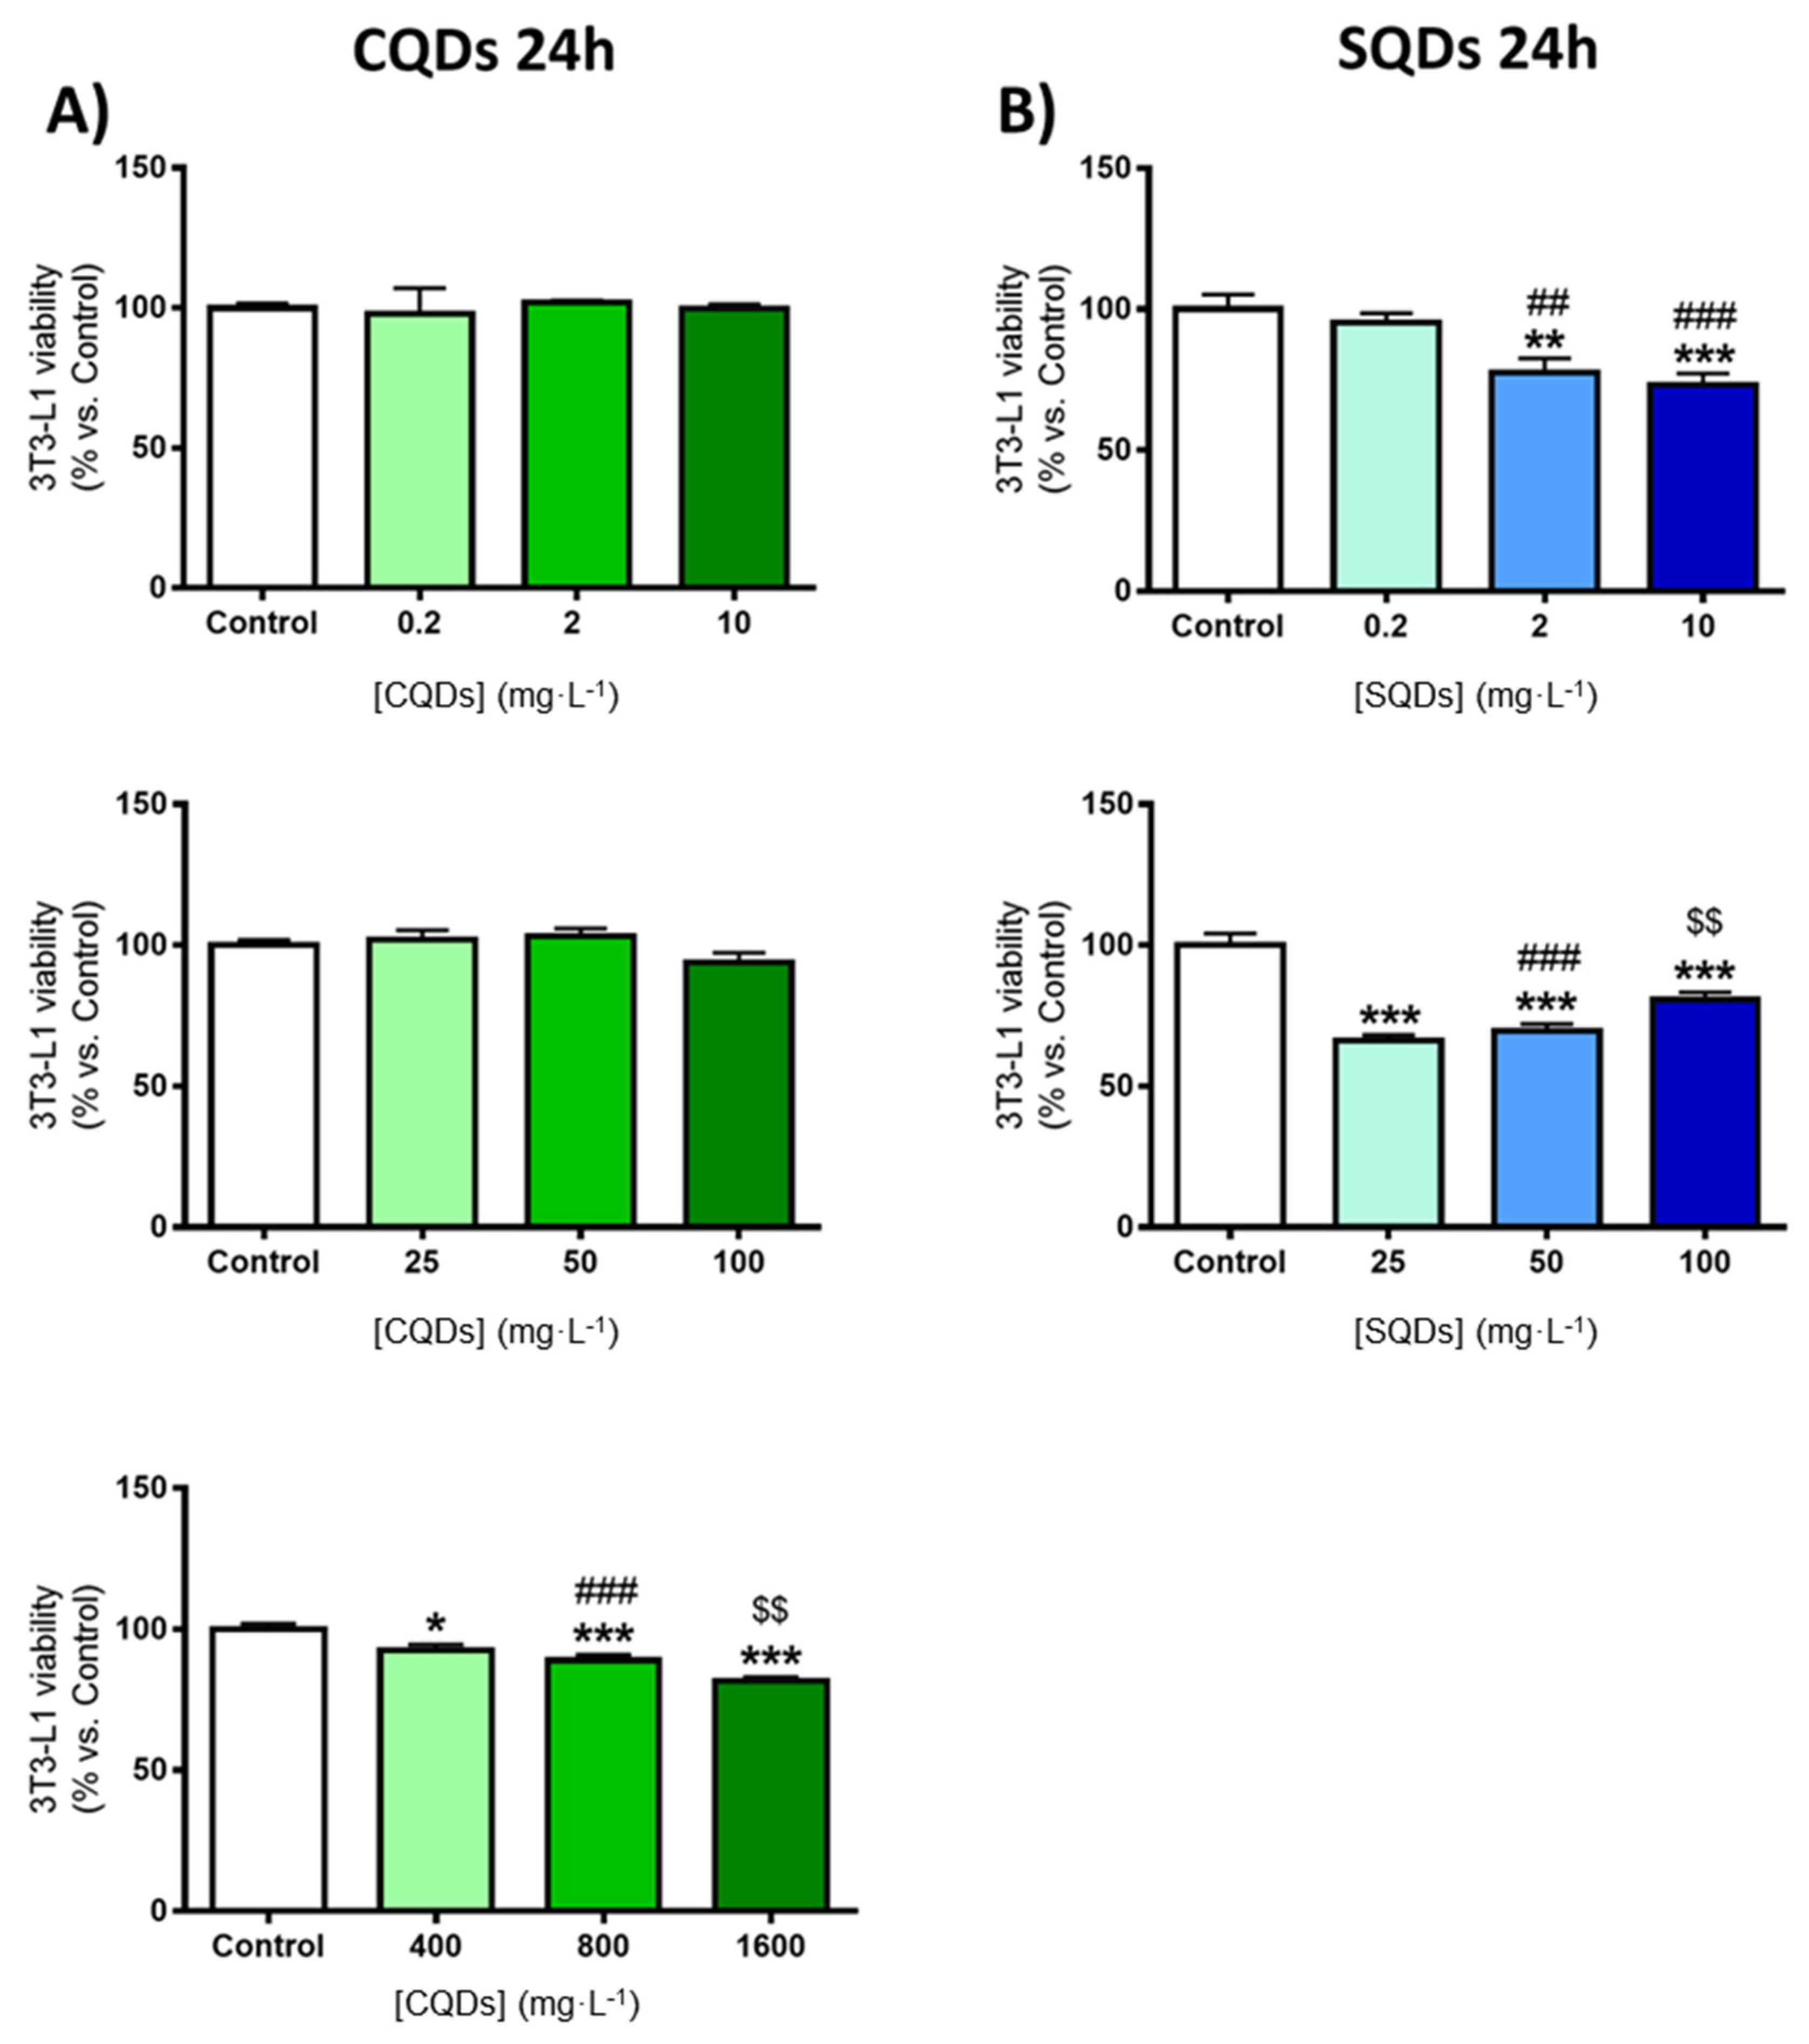
Herein, we demonstrate that 3T3-L1 cells are fully viable after a 24 h-treatment with CQDs at concentrations up to 100 mg·L−1 in the absence of serum (Figure 2A). However, from 400 mg·L−1 of CQDs, cell viability decreased significantly (18.6%, 21.1%, and 28.3% for 400 mg·L−1, 800 mg·L−1, and 1600 mg·L−1, respectively) (Figure 2A). In contrast, a 24 h-treatment with SQDs induced significant cell death in serum-deprived 3T3-L1 cells at concentrations between 2 and 100 mg·L−1, which prevented further testing of higher SQDs doses on cell viability under these conditions (Figure 2B).
ii.
Imaging assay.
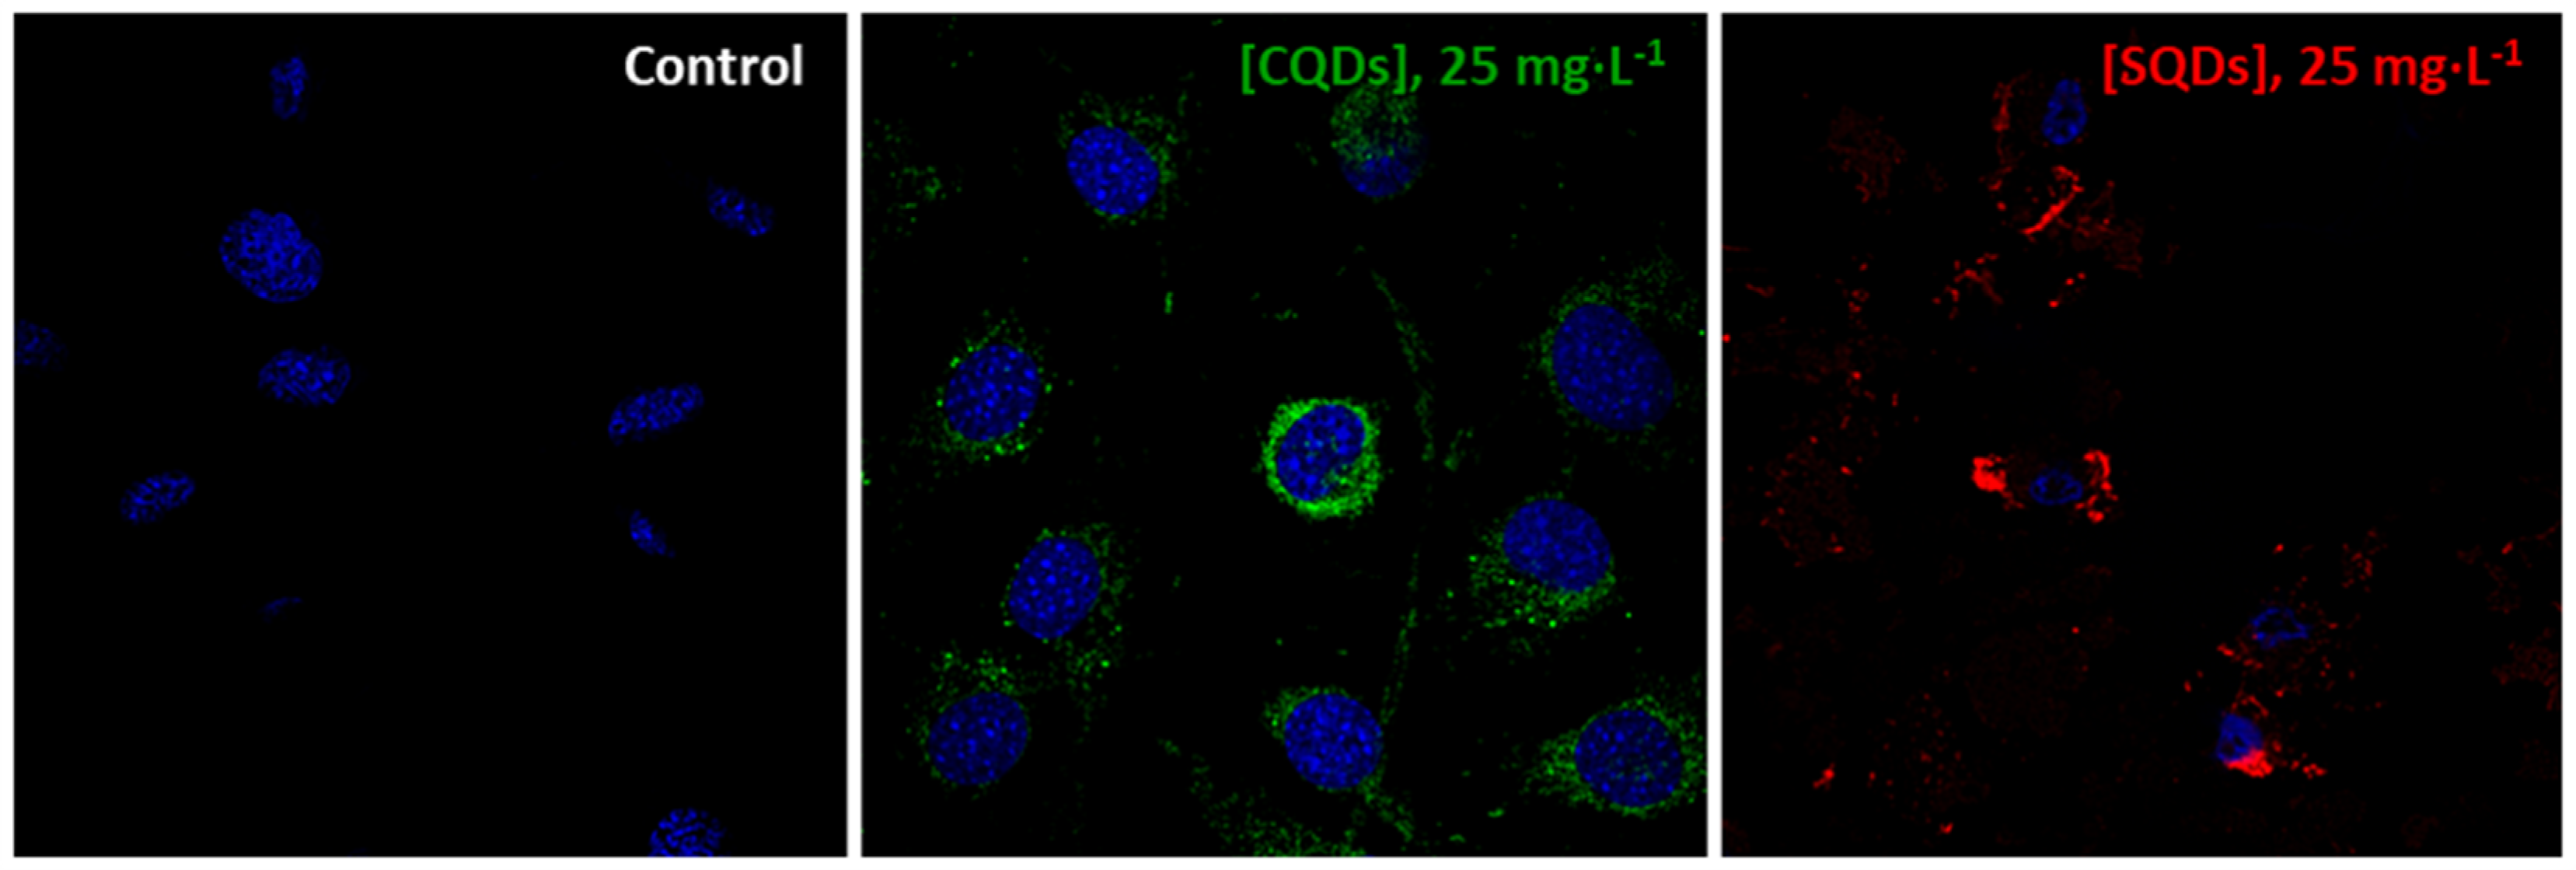
Confocal microscopy images from 3T3-L1 cells exposed to either CQDs or SQDs at 25 mg·L−1 in the absence of serum showed that both types of nanodots were incorporated by the cells while evoking different cell responses (Figure 3). In accordance with the MTT data, SQDs induced morphological changes indicative of cell death (i.e., DNA decondensation and cell membrane damage), while no apparent modifications were observed in cells exposed to CQDs (Figure 3). When SQDs were administered at a low, non-toxic dose (0.2 mg·L−1), only a few numbers of cells, with normal morphology, exhibited fluorescent puncta indicative of nanoparticle uptake (Figure S3).
iii.
Cell uptake assay.
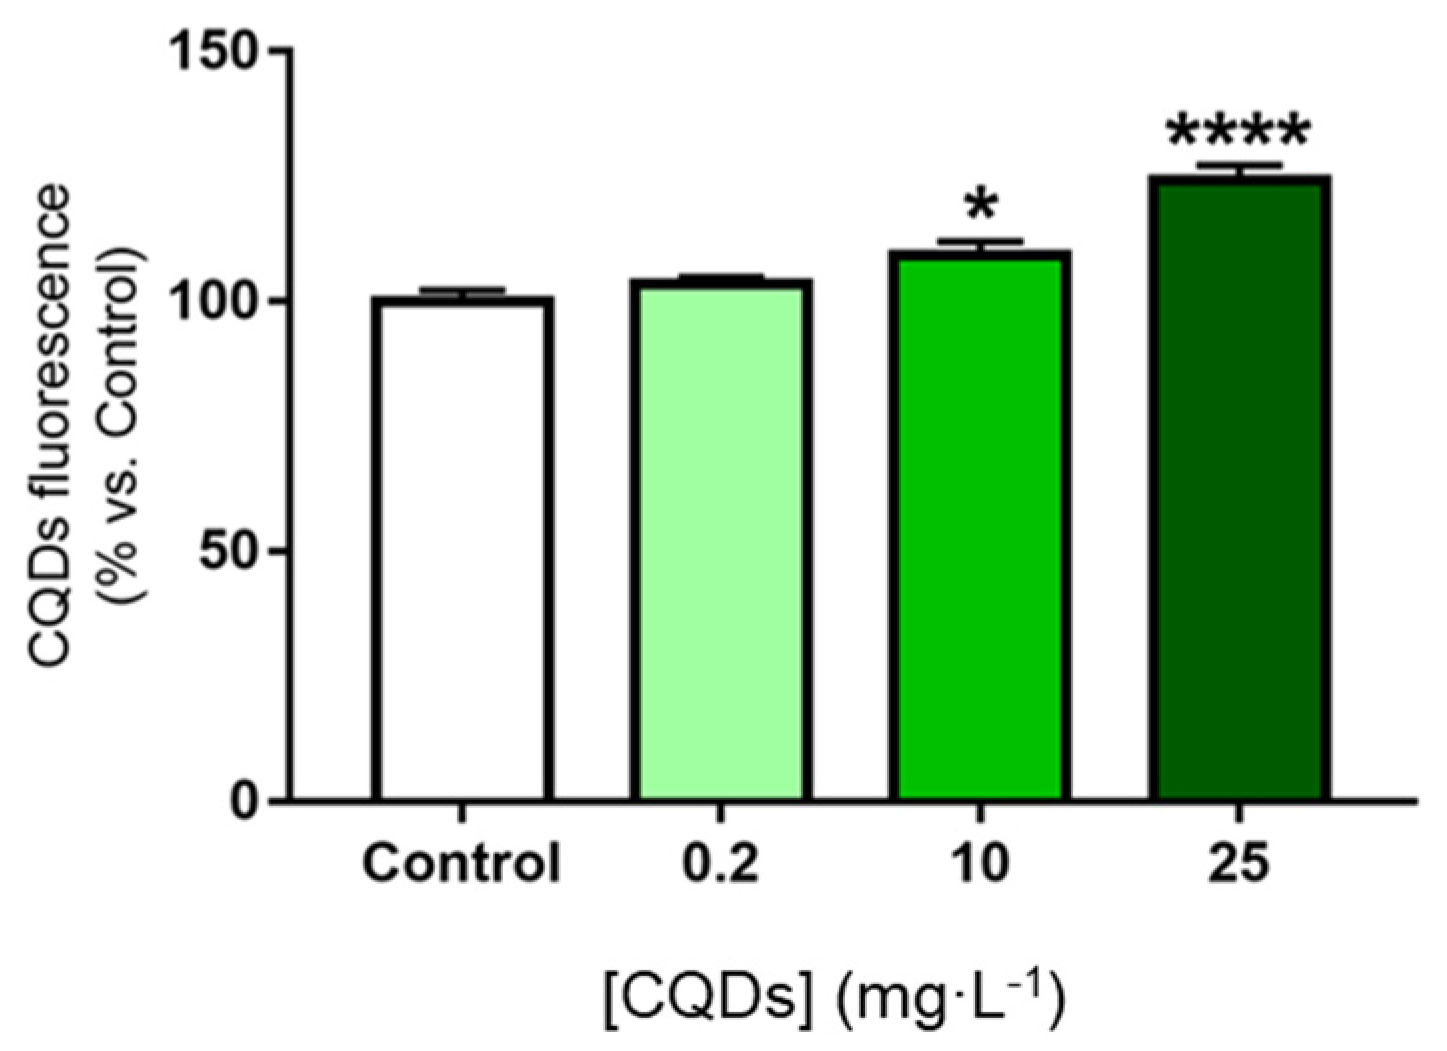
Along with the microscopy studies, particle incorporation into the cells was also assessed by spectrophotometry. As shown in Figure 4, 3T3-L1 cells exhibited significantly higher levels of total intracellular fluorescence than control cells (i.e., exposed to medium alone) when incubated in the presence of CQD doses above 10 mg·L−1 for 6 h. Lower concentrations of CQDs (0.2 mg·L−1) appeared too low to detect increases in intracellular fluorescence levels (Figure 4). Notably, nanoparticle incorporation into the cells did not only depend on the concentration, but also on the time of exposure to the nanodots. Thus, at shorter incubation times (1 h), only higher CQD doses (25 mg·L−1) evoked significant increases in cell fluorescence (Figure S4). Regarding SQDs, accumulation of NPs could be observed by confocal microscopy in the cell debris remaining in the cultures after treatment (Figure S3), which rendered aberrant measurements of intracellular fluorescence levels by spectrophotometry (data not shown).
Condition 2: Presence of serum in cell culture:
i.
MTT cell viability assay.
The response of 3T3-L1 cells to NPs was also explored at long-term exposure times. We observed that, when administered for 24 h to 3T3-L1 cells in the presence of serum, CQDs at intermediate doses (25 mg·L−1) slightly, yet significantly, decreased cell viability (Figure 5A). Nevertheless, even at concentrations of CQDs as high as 1600 mg·L−1, 3T3-L1 cell viability remained above 85% (Figure 5A). In clear contrast, the presence of serum in the culture media seemed to increase SQD-induced toxicity, compared to that observed in FBS-free culture media. Thus, all the SQD doses examined diminished cell viability, and the reductions in this parameter were higher in the presence (Figure 5B) than in the absence (Figure 2B) of FBS. Specifically, when administered in the absence of FBS, SQDs at 100 mg·L−1 reduced, by 19.4%, cell viability (Figure 2B), compared to the 66.5% reduction observed for this SQD concentration in FBS-exposed cell cultures (Figure 5B).
ii.
Cell uptake assay.
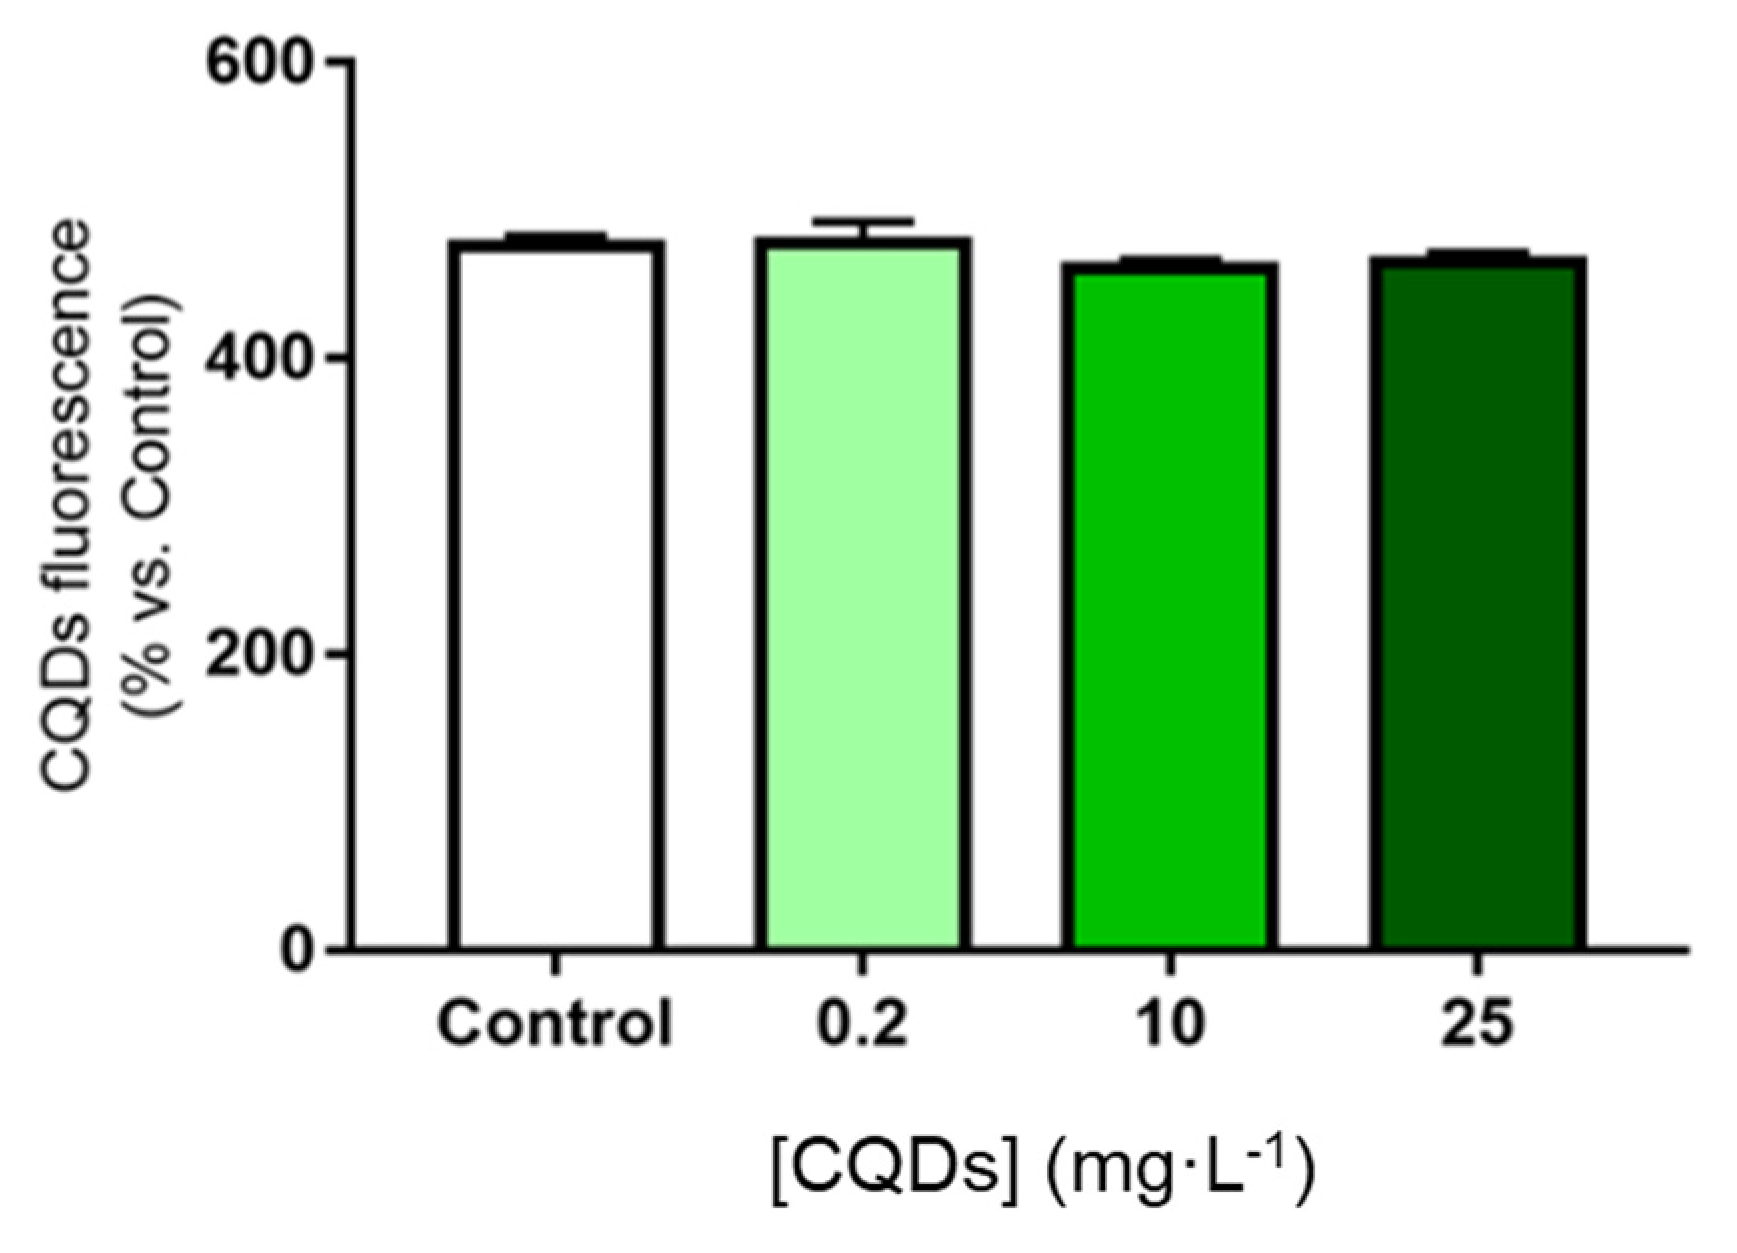
The presence of serum in the culture media also altered the time course of nanodot accumulation in 3T3-L1 cells. According to our spectrophotometry data, no changes in nanodot content were observed after short-term (1 to 6 h) exposure of 3T3-L1 cells to CQDs at doses between 0.2–25 mg·L−1, suggesting delayed incorporation of nanodots in the cells in the presence of serum (Figure 6 and Figure S5). Aberrant SQD accumulation in death cells cultured in FBS prevented us from measuring fluorescent content in 3T3-L1 cells exposed to these NPs.

Toxicity of CQDs and SQDs in HepG2 Cells

We extended our studies on CQDs and SQDs to HepG2 cells, which are considered a suitable in vitro model for toxicological studies [27]. In fact, a variety of NPs have been designed to target these cells [28].
  • Defining the optimal cellular conditions prior to cytotoxicity assay.
Preliminary studies using this cell line revealed that HepG2 cells required the presence of serum to maintain proper cell viability (Figure S6). To be more specific, FBS concentrations below 5% reduced, by more than 50%, cell viability (Figure S6). Thus, experiments aimed at assessing the effects of nanodots on HepG2 cells were carried out in media containing 10% FBS.
i.
MTT cell viability assay.
These cytotoxicity studies showed that high CQDs concentrations compromised cell viability (Figure 7A). This was particularly noticeable in the cell cultures exposed to 1600 mg·L−1 for 24 h, wherein cell viability was reduced by up to 22.1% (Figure 7A). In contrast, exposure to SQDs for 24 h was toxic to HepG2 cells at concentrations as low as 0.2 mg·L−1, yet cell viability remained above 84% for all the doses tested (Figure 7B).

Extracellular–Quantum Dot Interaction Studies. Influence of the Culture Media on Nanodot Behavior

Next, we explored the possible interaction between different microenvironments and nanodots by monitoring the fluorescence signal of CQDs and SQDs in the presence of either DMEM (specific for 3T3-L1 cells), MEM (specific for HepG2 cells), or FBS (for both cell types). As shown in Figure 8, CQD emission intensity increased when these nanodots were diluted in DMEM, MEM, or FBS, indicating the occurrence of an electron transfer reaction. Regarding SQDs, quenching of fluorescence was observed when these nanodots were diluted in DMEM or FBS, but not MEM (Figure 8).
We also tested the behavior of CQDs in response to the combination of DMEM and FBS, as that employed for 3T3-L1 cell growth in culture. As shown in Figure S7, a shoulder in the characteristic emission band of CQDs was observed, though this shoulder disappeared after continuous irradiation for almost 7 min.
This approach defines the best conditions to compare toxicity effects of NPs on cell types which are also dependent on the extracellular media, as shown in Table 1.

3.2. Discussion

Fluorescent nanodots provide a solid basis for the creation of sensors and imaging nanoagents. Amongst the two big families of fluorescent nanodots, which are CQDs and SQDs, there is plenty of room for designing and engineering their optical properties as a function of the wide variety of functional surfaces and sizes, but also of their core/shell composition for SQDs. There are many variables to be considered when assessing NP stability, cytotoxicity, and biocompatibility as a basis for judging the ideal bioscaffold. Thus, it is essential to compare the toxicity of both big families of fluorescent nanodot-based probes in situ by selecting CQDs and SQDs with the same size, superficial groups, and charges as standard selection criteria. As a proof of concept, 3-nm sized CQDs containing carboxyl groups at surface attracted our attention for biological applications, owing to their excellent water solubility, stability, and controlled fluorescent properties with specific pH [25,29]. Accordingly, hydrophilic SQDs composed of a CdTe core/shell with carboxyl groups at surface and the same size than CQDs, yet with different emission wavelengths, were selected. Fluorescence characteristics of CQDs could be attributed to the entire surface shell of the dots rather than only to the carboxylic groups, as reported elsewhere [2]. However, emission mechanism of CQDs is still under debate [2,29], and the use of these CQDs as bioprobes has been less extensively evaluated.
In this study, the characteristics and nanotoxicity of CQDs and SQDs with identical surface groups and size were evaluated in two distinct cell types, fibroblasts and hepatocytes. We report herein that, although both types of NPs may be suitable for biological and/or biomedical applications, they markedly differ in their interaction with cells, in terms of their internalization capacity and toxicity. Furthermore, the response is cell type-specific and highly dependent on microenvironmental clues.
We previously demonstrated that the toxicity of NPs, in particular, SWCNTs-PEG, increased in 3T3-L1 cells cultured in serum-free media [26]. This contrasts with the results obtained herein for CQDs, even though CQDs and SWCNTs-PEG are both carbon NPs [2,26]. To be more specific, higher CQDs doses (400 mg·L−1, 800 mg·L−1, or 1600 mg·L−1) were required to decrease 3T3-L1 cell viability in the absence of FBS, compared to SWCNTs-PEG (2.6 mg·L−1 and 13 mg·L−1) [26]. Interestingly, studies in several cell types, such as lung epithelial A549 cells, have shown that silica NPs are internalized under serum-free conditions, even with higher efficiency than in medium containing serum, via adhesion of the bare NPs on the cell membrane [30]. In this line, our previous microscopy studies on SWCNTs-PEG [26] and present data on CQDs (Figure 3) demonstrate that both NP types can be internalized into 3T3-L1 cells in the absence of serum, further supporting the notion that NP uptake is not dependent on the presence of serum proteins, irrespective of the type of cell and/or NP. As a matter of fact, both CQDs and SWCNTs-PEG induced cell toxicity in the absence of serum yet with different efficiency, with the latter being more toxic when administered to 3T3-L1 cells at concentrations ranging from 2–10 mg·L−1 [26]. This could be related to physicochemical properties of NPs, as it is clearly established that the shape, size, surface charge, and core/shell composition affect the interaction of nanodots with the cells [31].
It is noteworthy that CQDs and SWCNTs-PEG behaved differentially when administered in serum-containing media. Thus, in the presence of serum, CQDs reduced cell viability at lower doses than those observed for serum-free media, while the opposite occurred for SWCNTs-PEG [26]. These results support the notion that nanoparticle properties are also important to define their association with serum proteins, which, in turn, have an impact on cell biological responses. Nevertheless, it is also plausible that the differential behavior of PEGylated SWCNTs vs. CQDs is due, at least in part, to the PEG cover, because it has been demonstrated that this polymer interacts with serum components, such as albumin, and that this interaction modifies its stability [32].
Notwithstanding this, it is clearly established that not only the surface but also the core of NPs is an important determinant of toxicity [33]. Thus, it has been consistently shown that the cadmium core of SQDs is extremely toxic and generates DNA damage, oxidative stress by reactive oxygen species production, and cell death [6,33,34,35,36]. In accordance with these observations are our comparative studies in 3T3-L1 cells demonstrating that SQDs exhibited higher toxicity than CQDs, both in terms of threshold dose level and the extent of cell death. Furthermore, SQDs toxicity significantly increased in the presence of serum. This was also observed, though to a lower extent, for CQDs and could be accounted for by enhanced particle incorporation in serum-containing media.
Synthetic characteristics of nanodots experience changes when the nanomaterials meet an extracellular environment, acquiring a biological identity that cannot be solely attributed to their synthetic identity [37]. Thus, it has been shown that the presence of serum alters the size and zeta potential of NPs [38]. Our results indicate that microenvironmental factors may modify the synthetic identity of CQDs and SQDs, thus providing a distinct biological identity that influences the response of cells to these particles. Our comparative study of the effect of MEM, DMEM, and FBS on the fluorescence properties of SQDs and CQDs suggested that, in spite of sharing identical surface composition, the former may act as electron donors and become more positive when exposed to DMEM and FBS, while CQDs would behave as electronegative elements under these conditions.
Regardless of the field of biological or biomedical application of NPs, it is important to assess the responses of target cells to the specific type of particles to be employed. However, there are few comparative studies addressing whether different cell types may exhibit distinct responses to a given nanoparticle [34,39,40,41]. A meta-analysis of the cellular toxicity of quantum dots revealed that epithelial cells and fibroblasts, of human or murine origin, represent the cell types most employed in nanotoxicity studies [42]. In contrast, toxicological studies of NPs in hepatocytes are very limited (3%, according to the meta-analysis by Oh et al. [42]), even though these cells, which constitute nearly 80% of the liver volume, are key regulators of processes as important as metabolism, detoxification, or innate immunity activation, and are major players in liver pathologies, such as hepatic steatosis or cancer [43,44].
As compared to 3T3-L1 fibroblasts, high doses of CQDs (400 mg·L−1) were required to trigger cell toxicity in HepG2 hepatocytes. These results refer to cells cultured in the presence of serum, because cell viability was dramatically compromised when HepG2 cells were serum-deprived, while these conditions did not significantly alter 3T3-L1 cell viability. Nevertheless, HepG2 cells were as sensitive as 3T3-L1 cells to SQD-induced toxicity, at least at the lowest concentrations tested, although they seem more resistant to high SQD concentrations than fibroblasts. Apart from their different serum-dependency and culture requirements (DMEM for 3T3-L1 cells, MEM for HepG2 cells), it seems likely that NP internalization, intracellular trafficking, and metabolism occur differently in each cell type. In line with this notion, it has been demonstrated that, although both fibroblasts and liver cell lines internalize gold NPs through clathrin-mediated endocytosis, they show dissimilar responses to endocytosis inhibitors targeting distinctive parts of this pathway [45]. Further research is needed to elucidate the precise mechanisms underlying cellular uptake, intracellular distribution, and fate of NPs, which is essential for the design of successful nanotechnology approaches for biomedical applications.

4. Conclusions

The importance of performing a reliable comparison of toxicological effects of emerging fluorescent carbon nanodots is outlined and described by parallel in vitro cell viability studies. Therefore, fully reliable results were obtained from a comparison of two diverse fluorescent nanodots (various core nature) with similar characteristics (e.g., size, morphology, surface functionalities, etc.) in diverse cell types and in the presence or absence of serum, amongst other variables. The overall result corroborates the obvious prediction about the higher toxicity of SQDs compared to similarly sized-superficial CQDs; however, our comparative studies confirm differentiated cell type-specific responses in carbon-based and semiconductor nanoparticles, establishing that the toxicity levels are dependent on the cell type, the extracellular culture media, and even the presence of other substances or NPs. Our present findings further support the notion previously gained using PEGylated SWCNTs on the modulatory effect of serum proteins on nanotoxicity. For this, the use of fluorescent graphitic NPs to replace conventional dyes is a great added value of nanomedicine.

Supplementary Materials

The following are available online at https://www.mdpi.com/2076-3417/10/24/8845/s1, Figure S1: Emission spectra of SQDs at different excitation wavelengths. [SQDs] = 200 mg·L−1; slit widths set at 3 nm; Figure S2: Fluorescence quenching of SQDs in presence of CQDs in a 1:1 ratio upon excitation at 390 nm. [Nanodots] = 200 mg·L−1; slit widths at 3 nm. Figure S3: Confocal microscopy images obtained from 3T3-L1 cells cultured exposed to 0.2 mg·L−1 SQDs in the absence of serum for 24 h. Control cells were cultured in medium (DMEM) alone. Nuclei (blue) were stained with DAPI. Figure S4: Fluorescence emission in 3T3-L1 cell cultures exposed for 1 h to increasing concentration of CQDs in the absence of serum. Control cells were cultured in medium (DMEM) alone. Measurements were carried out at fluorescence excitation wavelength of 365 nm and emission wavelength of 450 nm. Data (mean ± SEM of at least three independent experiments with three replicate wells per treatment) were analyzed by one-way ANOVA multiple comparison test followed by Fisher’s LSD test. Significant differences are indicated as *** p < 0.001 vs. control. Figure S5. Fluorescence emission in 3T3-L1 cell cultures exposed for 1 h to increasing concentration of CQDs in the absence of serum. Control cells were cultured in medium (DMEM) alone. Measurements were carried out at fluorescence excitation wavelength of 365 nm and emission wavelength of 450 nm. Data (mean ± SEM of at least three independent experiments with three replicate wells per treatment) were analyzed by one-way ANOVA multiple comparison test followed by Fisher’s LSD test. Figure S6: Cell viability data in HepG2 cells cultured in the presence of decreasing concentrations of FBS (10-0%) for 24 h. Cell viability was measured by the MTT assay. Figure S7. Study of the fluorescence intensity of CQDs exposed to DMEM + 10% FBS. Lines represent fluorescence measurements at different time points [CQDs] = 50 mg·L−1; slit width at 6 nm.

Author Contributions

Conceptualization: M.L.S., M.M.M., and M.V.; methodology: R.G.-R.; synthesis and characterization: A.C. and M.L.S.; investigation: A.C., M.C.N.-R., and R.G.-R.; resources: M.M.M. and M.V.; writing—original draft preparation: all authors; writing—review and editing: M.L.S., M.M.M, and M.V. All authors have read and agreed to the published version of the manuscript.

Funding

We acknowledge support from the Spanish Ministry of Science and Innovation for funding the project NANOMIN (CTQ2014-52939-R), Plan Propio de Investigación de la Universidad de Córdoba, MINECO/FEDER (BFU2013-44229-R; BFU2016-76711-R; BFU2017-90578-REDT to M.M.M.), Consejería de Salud y Bienestar Social/J. Andalucía/FEDER (PI-0200/2013 to M.M.M.; PI-0159-2016 to G.-R.R.), Instituto de Salud Carlos III (ISCIII) and Fondos FEDER (PIE14/00005 to M.M.M.) and JJCC Castilla-La Mancha and Fondos FEDER (SBPLY/17/180501/000333 to M.L.S.).

Conflicts of Interest

The authors report no conflict of interest.

References

  1. Ekimov, A.I.; Onushchenko, A.A. Quantum size effect in the optical-spectra of semiconductor micro-crystals. Sov. Phys. Semiconduct. 1982, 16, 775–778. [Google Scholar]
  2. Cayuela, A.; Soriano, M.L.; Carrillo-Carrion, C.; Valcárcel, M. Semiconductor and carbon-based fluorescent nanodots: The need for consistency. Chem. Commun. 2016, 52, 1311–1326. [Google Scholar] [CrossRef]
  3. Wu, X.; Liu, H.; Liu, J.; Haley, K.N.; Treadway, J.A.; Larson, J.P.; Ge, N.; Peale, F.; Bruchez, M.P. Immunofluorescent labeling of cancer marker Her2 and other cellular targets with semiconductor quantum dots. Nat. Biotechnol. 2003, 21, 41–46. [Google Scholar] [CrossRef]
  4. Srinivasan, C.; Lee, J.; Papadimitrakopoulos, F.; Silbart, L.K.; Zhao, M.; Burgess, D.J. Labeling and intracellular tracking of functionally active plasmid DNA with semiconductor quantum dots. Mol. Ther. 2006, 14, 192–201. [Google Scholar] [CrossRef]
  5. Liu, Y.; Steiniger, S.C.; Kim, Y.; Kaufmann, G.F.; Felding-Habermann, B.; Janda, K.D. Mechanistic studies of a peptidic GRP78 ligand for cancer cell-specific drug delivery. Mol. Pharm. 2007, 4, 435–447. [Google Scholar] [CrossRef]
  6. Jamieson, T.; Bakhshi, R.; Petrova, D.; Pocock, R.; Imani, M.; Seifalian, A.M. Biological applications of quantum dots. Biomaterials 2007, 28, 4717–4732. [Google Scholar] [CrossRef]
  7. Rosenthal, S.J.; Chang, J.C.; Kovtun, O.; McBride, J.R.; Tomlinson, I.D. Biocompatible quantum dots for biological applications. Chem. Biol. 2011, 18, 10–24. [Google Scholar] [CrossRef] [Green Version]
  8. Xu, X.; Ray, R.; Gu, Y.; Ploehn, H.J.; Gearheart, L.; Raker, K.; Scrivens, W.A. Electrophoretic analysis and purification of fluorescent single-walled carbon nanotube fragments. J. Am. Chem. Soc. 2004, 126, 12736–12737. [Google Scholar] [CrossRef]
  9. Xu, Y.; Jia, X.-H.; Yin, X.-B.; He, X.-W.; Zhang, Y.-K. Carbon quantum dot stabilized gadolinium nanoprobe prepared via a one-pot hydrothermal approach for magnetic resonance and fluorescence dual-modality bioimaging. Anal. Chem. 2014, 86, 12122–12129. [Google Scholar] [CrossRef]
  10. Fernando, K.A.; Sahu, S.; Liu, Y.; Lewis, W.K.; Guliants, E.A.; Jafariyan, A.; Wang, P.; Bunker, C.E.; Sun, Y.P. Carbon quantum dots and applications in photocatalytic energy conversion. ACS Appl. Mater. Interfaces 2015, 7, 8363–8376. [Google Scholar] [CrossRef]
  11. Wang, Y.; Hu, A. Carbon quantum dots: Synthesis, properties and applications. J. Mater. Chem. C 2014, 2, 6921–6939. [Google Scholar] [CrossRef] [Green Version]
  12. Kargbo, O.; Jin, Y.; Ding, S.-N. Recent advances in luminescent carbon dots. Curr. Anal. Chem. 2015, 11, 4–21. [Google Scholar] [CrossRef]
  13. Liu, W.; Li, C.; Ren, Y.; Sun, X.; Pan, W.; Li, Y.; Wang, J.W.; Wang, W. Carbon dots: Surface engineering and applications. J. Mater. Chem. B 2016, 4, 5772–5788. [Google Scholar] [CrossRef]
  14. Molaei, M.J.A. review on nanostructured carbon quantum dots and their applications in biotechnology, sensors, and chemiluminescence. Talanta 2019, 196, 456–478. [Google Scholar] [CrossRef]
  15. Panwar, N.; Soehartono, A.M.; Chan, K.K.; Zeng, S.; Xu, G.; Qu, J.; Coquet, P.; Yong, K.-T.; Chen, X. Nanocarbons for biology and medicine: Sensing, imaging, and drug delivery. Chem. Rev. 2019, 16, 9559–9656. [Google Scholar] [CrossRef]
  16. Tian, X.-T.; Yin, X.-B. Carbon Dots, Unconventional preparation strategies, and applications beyond photoluminescence. Small 2019, 1901803. [Google Scholar] [CrossRef]
  17. Ray, S.C.; Saha, A.; Jana, N.R.; Sarkar, R. Fluorescent carbon NPs: Synthesis, characterization, and bioimaging application. J. Phys. Chem. C 2009, 113, 18546–18551. [Google Scholar] [CrossRef]
  18. Liu, C.; Zhang, P.; Zhai, X.; Tian, F.; Li, W.; Yang, J.; Liu, Y.; Wang, H.; Wang, W.; Liu, W. Nano-carrier for gene delivery and bioimaging based on carbon dots with PEI-passivation enhanced fluorescence. Biomaterials 2012, 33, 3604–3613. [Google Scholar] [CrossRef]
  19. Wu, Y.-F.; Wu, H.-C.; Kuan, C.J. Multi-functionalized carbon dots as theranostic nanoagent for gene delivery in lung cancer therapy. Sci. Rep. 2016, 6, 21170. [Google Scholar] [CrossRef]
  20. Wang, K.; Gao, Z.; Gao, G.; Wo, Y.; Wang, Y.; Shen, G.; Cui, D. Systematic safety evaluation on photoluminescent carbon dots. Nanoscale Res. Lett. 2013, 8, 122. [Google Scholar] [CrossRef] [Green Version]
  21. Yan, J.; Hou, S.; Yu, Y.; Qiao, Y.; Xiao, T.; Mei, Y.; Zhang, Z.; Wang, B.; Huang, C.C.; Lin, C.H.; et al. The effect of surface charge on the cytotoxicity and uptake of carbon quantum dots in human umbilical cord derived mesenchymal stem cells. Colloids Surf. B Biointerfaces 2018, 171, 241–249. [Google Scholar] [CrossRef] [PubMed]
  22. Blas-Garcia, A.; Baldovi, H.G.; Polo, M.; Victor, V.M.; Garcia, H.; Herance, J.R. Toxicological properties of two fluorescent carbon quantum dots with onion ring morphology and their usefulness as bioimaging agents. RSC Adv. 2016, 6, 30611–30622. [Google Scholar] [CrossRef]
  23. Havrdova, M.; Hola, K.; Skopalik, J.; Tomankova, K.; Petr, K.C.M.; Polakova, K.; Tucek, J.; Bourlinos, A.B.; Zboril, R. Toxicity of carbon dots—Effect of surface functionalization on the cell viability, reactive oxygen species generation and cell cycle. Carbon 2016, 99, 238–248. [Google Scholar] [CrossRef]
  24. Jung, Y.K.; Shin, E.; Kim, B.S. Cell nucleus-targeting zwitterionic carbon dots. Sci. Rep. 2015, 5, 18807. [Google Scholar] [CrossRef] [Green Version]
  25. Cayuela, A.; Soriano, M.L.; Valcárcel, M. Strong luminescence of carbon dots induced by acetone passivation: Efficient sensor for a rapid analysis of two different pollutants. Anal. Chim. Acta 2013, 804, 246–251. [Google Scholar] [CrossRef]
  26. Caballero-Díaz, E.; Guzmán-Ruiz, R.; Malagón, M.M.; Simonet, B.M.; Valcárcel, M. Effects of the interaction of single-walled carbon nanotubes with 4-nonylphenol on their in vitro toxicity. J. Hazard. Mater. 2014, 275, 107–115. [Google Scholar] [CrossRef]
  27. Nguyen, K.C.; Willmore, W.G.; Tayabali, A.F. Cadmium telluride quantum dots cause oxidative stress leading to extrinsic and intrinsic apoptosis in hepatocellular carcinoma HepG2 cells. Toxicology 2013, 306, 114–123. [Google Scholar] [CrossRef]
  28. Zhang, Y.N.; Poon, W.; Tavares, A.J.; McGilvray, I.D.; Chan, W.C.W. Nanoparticle-liver interactions: Cellular uptake and hepatobiliary elimination. J. Control. Release 2016, 240, 332–348. [Google Scholar] [CrossRef]
  29. Sciortino, A.; Cayuela, A.; Soriano, M.L.; Gelardi, F.M.; Cannas, M.; Valcárcel, M.; Messina, F. Different natures of Surface electronic transitions of carbon NPs. Phys. Chem. Chem. Phys. 2017, 19, 22670–22677. [Google Scholar] [CrossRef]
  30. Lesniak, A.; Fenaroli, F.; Monopoli, M.P.; Åberg, C.; Dawson, K.A.; Salvati, A. Effects of the presence or absence of a protein corona on silica nanoparticle uptake and impact on cells. ACS Nano 2012, 6, 5845–5857. [Google Scholar] [CrossRef]
  31. Behzadi, S.; Serpooshan, V.; Tao, W.; Hamaly, M.A.; Alkawareek, M.Y.; Dreaden, E.C.; Brown, D.; Alkilany, A.M.; Farokhzad, O.C.; Mahmoudi, M. Cellular uptake of NPs: Journey inside the cell. Chem. Soc. Rev. 2017, 46, 4218–4244. [Google Scholar] [CrossRef] [PubMed]
  32. Bekale, L.; Agudelo, D.; Tajmir-Riahi, H.A. The role of polymer size and hydrophobic end-group in PEG-protein interaction. Colloids Surf. B Biointerfaces 2015, 130, 141–148. [Google Scholar] [CrossRef] [PubMed]
  33. Tsoi, K.M.; Dai, Q.; Alman, B.A.; Chan, W.C. Are quantum dots toxic? Exploring the discrepancy between cell culture and animal studies. Acc. Chem. Res. 2013, 46, 662–671. [Google Scholar] [CrossRef] [PubMed]
  34. Grabowska-Jadach, I.; Zuchowska, A.; Olesik, M.; Drozd, M.; Pietrzak, M.; Malinowska, E.; Brzozka, Z. Cytotoxicity studies of selected cadmium-based quantum dots on 2D vs. 3D cell cultures. New J. Chem. 2018, 42, 12787–12795. [Google Scholar] [CrossRef]
  35. Papaioannou, N.; Marinovic, A.; Yoshizawa, N.; Goode, A.E.; Fay, M.; Khlobystov, A.; Titirici, M.M.; Sapelkin, A. Structure and solvents effects on the optical properties of sugar-derived carbon nanodots. Sci. Rep. 2018, 8, 1–10. [Google Scholar] [CrossRef] [PubMed]
  36. Madani, S.Y.; Shabani, F.; Dwek, M.V.; Seifalian, A.M. Conjugation of quantum dots on carbon nanotubes for medical diagnosis and treatment. Int. J. Nanomed. 2013, 8, 941–950. [Google Scholar] [CrossRef] [Green Version]
  37. Walkey, C.D.; Chan, W.C.W. Understanding and controlling the interaction of nanomaterials with proteins in a physiological environment. Chem. Soc. Rev. 2012, 41, 2780–2799. [Google Scholar] [CrossRef] [PubMed]
  38. Ehrenberg, M.S.; Friedman, A.E.; Finkelstein, J.N.; Oberdörster, G. The influence of protein adsorption on nanoparticle association with cultured endothelial cells. Biomaterials 2009, 30, 603–610. [Google Scholar] [CrossRef] [PubMed]
  39. Song, Y.; Feng, D.; Shi, W.; Li, X.; Ma, H. Parallel comparative studies on the toxic effects of unmodified CdTe quantum dots, gold NPs, and carbon nanodots on live cells as well as green gram sprouts. Talanta 2013, 116, 237–244. [Google Scholar] [CrossRef]
  40. McNamara, K.; Tofail, S.A.M. NPs in biomedical applications. Adv. Phys. 2017, 2, 54–88. [Google Scholar] [CrossRef]
  41. Bradburne, C.E.; Delehanty, J.B.; Gemmill, B.K.; Mei, B.C.; Mattoussi, H.; Susumu, K.; Blanco-Canosa, J.B.; Dawson, P.E.; Medintz, I.L. Cytotoxicity of quantum dots used for in vitro cellular labelling: Role of QD surface ligand, delivery modality, cell type, and direct comparison to organic fluorophores. Bioconjug. Chem. 2013, 24, 1570–1583. [Google Scholar] [CrossRef] [PubMed]
  42. Oh, E.; Liu, R.; Gemill, K.B.; Bilal, M.; Cohen, Y.; Medintz, I.L. Meta-analysis of cellular toxicity for cadmium containing quantum dots. Nat. Nanotech. 2016, 11, 479–493. [Google Scholar] [CrossRef] [PubMed]
  43. Schroeder, B.; McNiven, M.A. Importance of endocytic pathways in liver function and disease. Compr. Physiol. 2014, 4, 1403–1417. [Google Scholar] [CrossRef] [PubMed] [Green Version]
  44. Zhou, Z.; Xu, M.J.; Gao, B. Hepatocytes: A key cell type for innate immunity. Cell. Mol. Immunol. 2016, 13, 301–315. [Google Scholar] [CrossRef] [PubMed] [Green Version]
  45. Ng, C.T.; Tang, F.M.A.; Li, J.J.; Ong, C.; Yung, L.L.Y.; Bay, B.H. Clathrin-mediated endocytosis of gold NPs In Vitro. Anat. Rec. 2015, 298, 418–427. [Google Scholar] [CrossRef] [PubMed]
Figure 1. Absorbance and emission curves at their maximal excitation wavelengths of (A) graphitic-carbon quantum dots (CQDs) and (B) semiconductor quantum dots (SQDs). [Nanodots] = 200 mg·L−1; slit widths at emission and excitation were set at 3 and 8 nm, respectively.
Applsci 10 08845 g001
Figure 2. Cell viability data in 3T3-L1 cells cultured in the absence of serum and exposed to CQDs (A) and SQDs (B) at concentrations ranging from 0−1600 mg·L−1 for 24 h. Control cells were cultured in Dulbecco’s Modified Eagle’s Medium-low glucose (DMEM) alone. Cell viability was measured by the MTT assay. Data (mean ± SEM of at least three independent experiments with three replicate wells per treatment) were analyzed by one-way ANOVA multiple comparison test followed by Fisher’s least significant difference (LSD) test. Significant differences are indicated as * p < 0.05, ** p < 0.01, *** p < 0.001 vs. control; ## p < 0.01, ### p < 0.001 vs. 0.2, 25, or 400 mg·L−1, respectively; $$ p < 0.001 vs. 50 or 800 mg·L−1, respectively.
Applsci 10 08845 g002
Figure 3. Confocal microscopy images obtained from 3T3-L1 cells exposed to 25 mg·L−1 of CQDs or SQDs in the absence of serum for 24 h. Control cells were cultured in medium (DMEM) alone. Nuclei (blue) were stained with 4′,6-diamidino-2-phenylindole dihydrochloride (DAPI).
Applsci 10 08845 g003
Figure 4. Fluorescence emission in 3T3-L1 cell cultures exposed for 6 h to increasing concentration of CQDs in the absence of serum. Control cells were cultured in medium (DMEM) alone. Measurements were carried out at fluorescence excitation wavelength of 365 nm and emission wavelength of 450 nm. Data (mean ± SEM of at least three independent experiments with three replicate wells per treatment) were analyzed by one-way ANOVA multiple comparison test followed by Fisher’s LSD test. Significant differences are indicated as * p < 0.05, **** p < 0.001 vs. control.
Applsci 10 08845 g004
Figure 5. Cell viability data in 3T3-L1 cells cultured in the presence of 10% FBS and exposed to CQDs (A) and SQDs (B) at concentrations ranging from 0–1600 mg·L−1 for 24 h. Control cells were cultured in medium (DMEM) alone. Cell viability was measured by the MTT assay. Data (mean ± SEM of at least three independent experiments with three replicate wells per treatment) were analyzed by one-way ANOVA multiple comparison test followed by Fisher’s LSD test. Significant differences are indicated as ** p < 0.01, *** p < 0.001 vs. control; # p < 0.05, ## p < 0.01, and ### p < 0.001 vs. 0.2, 25, or 400 mg·L−1, respectively; $$$ p < 0.001 vs. 0.2 mg·L−1.
Applsci 10 08845 g005
Figure 6. Fluorescence emission in 3T3-L1 cell cultures exposed for 6 h to increasing concentration of CQDs in the absence of serum. Control cells were cultured in medium (DMEM) alone. Measurements were carried out at fluorescence excitation wavelength of 365 nm and emission wavelength of 450 nm. Data (mean ± SEM of at least three independent experiments with three replicate wells per treatment) were analyzed by one-way ANOVA multiple comparison test followed by Fisher’s LSD test.
Applsci 10 08845 g006
Figure 7. Cell viability data in carcinoma human hepatocellular cells (HepG2) cells cultured in the presence of 10% FBS and exposed to CQDs (A) and SQDs (B) at concentrations ranging from 0–1600 mg·L−1 for 24 h. Control cells were cultured in medium (DMEM) alone. Cell viability was measured by the MTT assay. Data (mean ± SEM of at least three independent experiments with three replicate wells per treatment) were analyzed by one-way ANOVA multiple comparison test followed by Fisher’s LSD test. Significant differences are indicated as * p < 0.05, ** p < 0.01, *** p < 0.001 vs. control; # p < 0.05, ### p < 0.001 vs. 400 mg·L−1; $$$ p < 0.001 vs. 800 mg·L−1.
Applsci 10 08845 g007
Figure 8. Influence of culture media on fluorescence emission of CQDs and SQDs. Effects of DMEM and Minimum Essential Medium Eagle (MEM) on fluorescence intensity of CQDs (A) and SQDs (B). Effects of fetal bovine serum (FBS) on fluorescence intensity of CQDs (C) and SQDs (D). [Nanodots] = 50 mg·L−1; slit widths at emission and excitation were set at 3 nm.
Applsci 10 08845 g008
Table 1. Comparison of the main toxicological results of our proposal vs. literature.
CQDs
(0.2–100 mg·L−1)
SQDs
(0.2–100 mg·L−1)
SWCNTs-PEG
(2.6–13 mg·L−1)
λexcitation/λ emission (nm)365/450390/650-
Cell localization in fibroblastsIntracellular, Absence of cell deathIntracellular, DNA decondensation Cell membrane damage-
% Cell viability 3T3-L1 fibroblasts
(-FBS)
94–100%66–95%85–95%
% Cell viability 3T3-L1 fibroblasts
(+FBS)
87–99%33–89%95–100%
% Cell viability HepG2 hepatocytes
(+FBS)
93–98%84–91%-
ReferenceThis work[26]
Publisher’s Note: MDPI stays neutral with regard to jurisdictional claims in published maps and institutional affiliations.