Article

Power Quality Issues and Mitigation for Electric Grids with Wind Power Penetration

by
Sulaiman A. Almohaimeed
1,* and
Mamdouh Abdel-Akher
1,2
1
Department of Electrical Engineering, College of Engineering, Qassim University, Unaizah 56452, Saudi Arabia
2
Department of Electrical Engineering, Faculty of Engineering, Aswan University, Aswan 81542, Egypt
*
Author to whom correspondence should be addressed.
Appl. Sci. 2020, 10(24), 8852; https://doi.org/10.3390/app10248852
Submission received: 27 October 2020 / Revised: 5 December 2020 / Accepted: 8 December 2020 / Published: 10 December 2020
(This article belongs to the Special Issue Wind Generators: Technology and Trends)

Abstract

:

Featured Application

This work is devoted for investigating the potential & challenges of wind energy systems in the kingdom of Saudi Arabia, classification of power quality issues due to wind energy conversion systems, techniques and recent trends for power quality mitigation, and application of reactive power compensation of inverter-based wind energy conversion systems to mitigate voltage fluctuations. Case studies using time series simulation to control and mitigate voltage fluctuations based on Saudi daily load profile and standard test systems are presented.

Abstract

Large penetration of wind energy systems into electric-grids results in many power quality problems. This paper presents a classification of power quality issues, namely harmonics and short-duration voltage variation observed due to the integration of wind power. Additionally, different techniques and technologies to mitigate the effect of such issues are discussed. The paper highlights the current trends and future scopes in the improvement of the interconnection of wind energy conversion systems (WECSs) into the grid. As the voltage variation is the most severe power quality issue, case studies have been presented to investigate this problem using steady-state time-series simulations. The standard IEEE test system namely IEEE 123-node test feeder and IEEE 30-node grid are solved under different operating conditions with wind power penetration. Typical daily load profiles of a substation in Riyadh, Saudi Arabia, and an intermittent wind power generation profile are used in all case studies. Mitigation of voltage variations due to wind intermittency is achieved using reactive power compensation of the interface inverter. The results show the effectiveness of these approaches to avoid voltage variation and excessive tap setting movements of regulators and keep the voltage within the desired operating conditions.

1. Introduction

The total electricity consumption in Saudi Arabia will be 90 GW in 2023 which represents more than 45% of the daily oil production. Additionally, the rate of peak demand growth is 7% per year meaning that the domestic consumption of oil for electricity generation will reach 8 million barrels per day by the year 2030 G if the trend consumption continues at this rate [1]. Further, carbon emission reached 28 BSCFD in 2016 due to highly dependent on fossil fuels for electricity generation [2]. As of 2020, the total available generating capacity in the Kingdom is 77.2 GW whereas the peak load reached 62 GW. Such a capacity is transformed through more than 88,731 c.km of transmission lines; 90% overhead lines and 10% underground lines. The transmission system in the Saudi Electric Grid includes 1129 transforming substations and more than 3445 transformers. The distribution system includes about 682,920 c.km of distribution lines that delivered more than 279 TWh of energy as follows; 45.8% residential, 16.4% commercial, 17.7% industrial, 14.4% government, and 5.6% for other loads such as agricultural and desalination [3].
Hence, the kingdom launched the King Salman Renewable Energy Initiative among its Vision 2030 for empowering renewable energy penetration in the electricity generation. Renewable energy integration in the Saudi electric grid aims to reduce oil dependency, system losses, and improve aging equipment.
The Kingdom targets 70% of its power generation from natural gas and 30% from renewable and other sources. In 2020, the Kingdom plans to generate 3.45 GW of renewable energy, 4% of the total consumption, as well as reducing carbon emission to 26 BSCFD [4]. Vision 2023 sets an initial target by generating 9.5 GW of renewable energy by 2023; 5.9 GW solar PV and 2.4 GW wind. The projected renewable energy installation is as flow: 2018: 0.7 GW, 2019: 1.2 GW, 2020: 1.7 GW, 2021: 1.8 GW, 2022: 2.1 GW and 2023: 2.1 GW [5]. Currently, Sakaka solar PV plant of 300 MW capacity started production in the fourth quarter of 2019. The projects are planned to be deployed in 35 different locations across the country. From a wind generation perspective, a 400 MW onshore wind farm has been successfully connected to the grid in Dumat Aljandal, northwestern Saudi Arabia. The project consists of 99 turbines that are rated ~4 MW and generates electricity for about $0.0199/kWh. Another ongoing 850 MW wind power project in Yanbu, western Saudi Arabia is expected to reduce emissions by 8 million tons/year and conserve about 18 million ballers of oil a year [6,7]. Further, Saudi Aramco has specific various locations for wind turbines. The identified sites of wind turbines meet the requirements of wind generation such as wind speed and flexible access to the electric grid. Figure 1 shows regional sites of wind turbines [8]. The installation of wind power plants that are characterized by an intermittent power source could lead to fluctuations of output power and creates power quality issues to the grid and in turn, affects system reliability and stability [9].
With the huge proliferation of wind energy penetration in the power system, the impact of wind power on power system operation and control has been of great concern. Wind power capacity has grown 7% globally with the installations increasing from 336 GW in June 2014 to 360 GW by the end of 2014 [1]. The rapid growth of wind power penetration has led to greater studies to assess the impact of wind energy conversion systems (WECSs) on the grid for a stable and efficient power system operation [2,4,5].
The integration of renewable energy resources, like wind, fosters sustainable growth, and minimizes the adverse effects of conventional power plants. In addition to WECSs being a source of clean energy, their contribution towards grid pollution needs to be considered. For integrating intermittent renewable sources like the wind into the existing power system, several technical aspects must be considered from a PQ (power quality) perspective. These PQ requirements mainly require the WECSs to maintain voltage and frequency within safe operational limits and minimize the harmonic emissions. Adhering to the PQ standards help WECSs to meet the load as well as ensure their reliable and safe integration to the grid.
As more power electronic loads are connected to the grid, their impact from a PQ perspective must be examined. Power electronic loads such as variable frequency drives, rectifiers, and inverters are considered nonlinear loads and are found in most residential, industrial, and commercial settings. These loads are highly sensitive to PQ problems which are important issues to consider for wind turbine generators (WTGs) interconnection. As wind power penetrations (WPPs) are integrated into the grid, voltage variations and harmonic distortions are some of the important PQ concerns.
WTGs harvest energy from wind which is highly intermittent. For a fixed speed wind turbine, variations in wind cause fluctuations in the mechanical torque. It also varies the electrical output from the generator leading to voltage fluctuations that need to be managed [9]. As a result, PQ issues such as voltage sag, swell, flicker, and harmonics are observed in the transmission and distribution systems. Variable speed WTGs are popular as they can extract maximum power from the wind while ensuring low mechanical stress as compared to fixed speed wind turbines. A variable speed WTG utilizes power electronic converters for mitigating output fluctuations from the generators and is a huge source for harmonic distortion. These power electronic converters can inject harmonic current into the grid and lead to high PQ issues in the power system. To address this problem, new standards and grid codes have been developed for enabling smooth and efficient integration of WPPs into the grid [10,11].
To ensure harmonic distortions are within acceptable limits to meet the satisfactory requirements by both utilities and consumers, two approaches passive and active filterings are used [8,12,13,14,15]. Conventional passive filters consist of inductors, resistors, and capacitors and are effective in attenuating harmonic components at a low cost [12]. Active filters are more commonly used as they respond efficiently to the dynamics of the electric grid as compared to the passive filters. This is because the tuning frequency and design of the passive filters cannot be changed to meet the changing system conditions. Active filters are very expensive and complicated to design at medium and high voltage levels [13]. Hybrid filters utilize the characteristics of both active and passive filters in their design and provide better performance to mitigate harmonic resonance in WPPs [15]
Voltage variation is the degree of deviation from the normal sinusoidal voltage waveform in the power system network. The first concern for integrating WTs into the grid is to ensure that the voltage in the grid is kept within an acceptable range. In the European voltage standard EN 50160, a range of 10% of the 10-min average voltages is acceptable at the end-user to ensure that appliances are not damaged or malfunctioning [16]. Further, IEC Standard 61400-21 stated that the 10-min average of voltage fluctuation should be within 5% of its nominal value for the wind power plant system [17,18]. This paper discusses short-duration voltage variation namely voltage sag and voltage swell that affect the power system during wind integration. To resolve this issue, several mitigation techniques using flexible AC transmission devices (FACTs) such as dynamic voltage restorer (DVR), and static synchronous compensator (STATCOM), or energy storage system (ESS) are used to mitigate the impact of WPP interconnection in the grid.
This paper discusses the impact of PQ issues, namely voltage fluctuation and harmonic propagation, in integrating WPPs into the grid. Section 2 and Section 3 describe the harmonic and voltage issues of WPP integration, mitigation techniques for various PQ issues, and future trends in the improvement of WPPs power quality issues. Section 4 presents the simulation of mitigating voltage fluctuation using reactive power compensation followed by selected case studies for a load profile in the kingdom with WPPs followed by a conclusion in Section 5.

2. Power Quality Issues of WPP Integration

2.1. Harmonic Issues of WPP Integration

In electrical power systems, the alternating current waveform is ideally pure sinusoidal waves with constant magnitude and frequency to meet the expectations of the end-users connected to the grid. Harmonic distortion is a periodical deviation from the ideal condition, with a period of one cycle of the frequency of the grid. IEEE standard 519-2014 provides information about the THD and acceptable levels of voltage and current distortion for each harmonic order. It is important to determine the harmonic content at the PCC of the WPPs to ensure acceptable harmonic voltages at this point [14].
There are four distinct classifications of WTGs, known as Type 1 through Type 4 [19]. Type 1 and Type 2 WTGs utilize soft starters to reduce inrush currents and voltage fluctuations. The soft starters are power electronic devices that are responsible for producing harmonic currents of very low magnitude. As the soft starters operate only for a very short duration of time, therefore, the harmonic currents produced are negligible. Harmonic currents can also occur in Type 1 and Type 2 WTGs during the energization of transformers. These are low order harmonics that appear along with the DC component. Type 3 WTGs, also known as DFIGs and Type 4 WTGs have a power electronic interface between the turbine and the grid which can produce harmonics in the grid [20].
Harmonic emissions that originate from WPPs could combine with the harmonic distortion already present in the grid and amplify harmonic distortion around the resonant frequency [20]. Harmonic resonance is caused by the interaction of inductive and capacitive elements in the network. WPPs have several elements such as capacitor banks, transformers, and cables that can interact with each other leading to resonance. Parallel and series resonance can affect the power system by causing harmonic overvoltages or harmonic overcurrents. Comparatively, Type 3 WTGs have a high content of low order harmonics in them as presented in [20]. Harmonics of higher order are reported to be associated with PWM-based Type 3 WTGs [20].

2.1.1. Effect of Harmonics in WPP

Harmonic emissions are a major issue in WPPs connected to the grid. The harmonic emissions from WPPs are different from arc furnaces. Case studies are presented to analyze the harmonics emitted from Type 1 and Type 3 WTGs based WPP.
Type 1 WTGs based WPP: Type 1 WTGs are also known as FSIG turbines. Compensation capacitors are used to compensate for the reactive power consumption of the induction generators from the grid. The capacitor bank consists of mechanically switched capacitors which result in the occurrence of resonance [20]. Generally, even and triplen harmonics are not present in WPPs and thus only 5, 7, 11, and 13 harmonic orders are considered in the study. It is shown that for the same size of reactive power there occur two resonance frequencies [2]. When the reactive power requirement of the WTG matches these critical values, resonance occurs at high harmonic frequencies. The resonance frequency can vary with increased wind speed or increased size of shunt capacitance. 7th harmonics may be observed at lower wind speed which corresponds to low wind power and lower shunt capacitance. For high wind speed and high power, 5th harmonics may be encountered [2].
Type 3 WTGs: In [20], three WPPs with type 3 WTGs and a total capacity of 185 MW are considered for a power quality study. Large voltage and current harmonics are observed at 18th, 19th, and 20th harmonic orders during certain operating conditions of the WPPs. When the three WPPs are operated at 80% of nominal capacity and the power output of the third WPP (WPP3) is reduced from 80% to 0%, severe harmonic injection is seen. It is inferred that at zero output power from WPP3, the unloaded cables and transformer inductances behave like an LC circuit. This results in the generation of large harmonic currents. This harmonic current continued to flow until the WPP3 is disconnected from the power network. Large resonance is still observed at the 19th harmonic order even after WPP3 is disconnected from the network.
Resonance in the DC link of the back to back VSC converter can also lead to the occurrence of inter-harmonic frequencies. Ref [14] presents a case study on the PQ analysis performed on three 600 kW WTGs with a full power converter in Northern Sweden. PQ measurements performed at the transformer feeding the WTGs indicated contamination from 7, 11, 13, and 17th order harmonics. Harmonic spectrum over the entire frequency range up to 4 kHz revealed a flat maximum at around 700 Hz or nearly equal to the 13th harmonic order and at 4 kHz (80th order). In all the measured observations, the 13th harmonic order shows dominance and the 11th harmonic order has the overall highest presence. In addition to the discrete harmonics, inter-harmonic orders such as 12.5 and 13.5 are also observed to be the dominant ones. Literature indicates that the waveform distortion is very high at low power output from WTGs [21]. THD is one of the metrics used to measure distortion. High THD is observed when the WTG produces low power output.

2.1.2. Types of Harmonics in WPPs

PWM harmonics: Most commercial WTGs in the market today use VSCs that operate on PWM switching. The harmonics generated by the PWM converters primarily depend on the modulation frequency ratio and modulation amplitude ratio. For a VSC-based WTG, harmonics generated by the power electronic converters during switching is named as characteristic harmonics, and other harmonics are non-characteristic harmonics. The switching frequency of the grid side and rotor side converter for modern turbines generally is in the range of 1–5 kHz [22].
Harmonic emission and susceptibility: Two important standards that need to be considered to evaluate the effect of harmonics in the power system due to WPPs. IEC 555 is the harmonic emission standards and is concerned with current and voltage waveform distortion and WPPs compliance with this grid code. It is analyzed using conventional harmonic penetration studies. IEEE 446-1987 is the harmonic susceptibility standards that examine the current distortion introduced by the power electronic loads at the PCC. The fast switching nature of the power electronic converters in WPPs may lead to destabilization of a power system equipment or a WTG. Advanced methods such as time-domain based EMT simulation are utilized to analyze harmonic susceptibility issues [22].

2.1.3. PQ Indices under Harmonic Distortion

Harmonics can cause line losses and excessive heating of equipment, thereby decreasing their lifespan [19]. Subharmonics could cause flickers that lead to an uncomfortable visual effect on the eyes and thermal aging of IGs. There are many parameters developed to evaluate the PQ of a system concerning the harmonic distortion level. The IEEE-519 standard follows a set allowable limit of harmonics (IEEE Standard 519-1991, 1992). The two most commonly used indices of harmonic analysis are THD and TDD. The allowable limit set for system distortion is 5% for THD and 3% for any individual harmonics as stipulated by IEEE 519-1992 [23].

2.2. Voltage Issues of WPP Integration

Voltage variations due to WPPs are affected by many factors, such as wind variations, the tower shadow effect, grid strength, i.e., short-circuit capacity ratio, type of WTGs, number of operating turbines, and switching period [24]. The voltage variation is directly dependent on real and reactive power variations. Variations in wind speed cause voltage excursions during the continuous operation of WTGs. This results in the fluctuation of active and reactive power output [25] and is a concern in fixed-speed WTGs because of the 3P effect. The frequency at which the effects of tower shadow and wind shear is observed will reduce the mechanical torque [25]. However, variable-speed WTGs can change the rotor speed which in turn mitigates this effect. Moreover, switching the WTGs vary the voltage due to the variations of the output power when the generator responds to cut-in or cut-out speeds [26]. According to Ref. [27], the voltage variation can be classified as short duration and long duration voltage variation.

2.2.1. Voltage Sag

Voltage sag means a decrease in the RMS voltage between 10% to 90% of the nominal voltage for the duration of a half-cycle to 1 min [24]. Thus, voltage sag can be categorized as instantaneous, momentary, and temporary [28]. In Ref. [29], the dip in voltage is given as 70% voltage reduction for 1 s, whereas the limit for many electronic devices is 85% for 40 milliseconds. Furthermore, the voltage depths of 10% to 15% are commonly due to the switching loads. Hence, voltage sag is of PQ disturbance due to its effects on sensitive equipment and industrial processes. There are many causes of voltage sag such as start-up of WTGs, wind speed variations, fault at the system network, or fault in consumer installation. Other events causing voltage sag are transformer or capacitor energizing, switching off electronic load, or connection of heavy loads. Voltage sag can lead to the disconnection of WTGs which may have negative effects on the stability of the system. Additionally, a large inrush current, as a result of voltage sag, during the recovery process after the fault, has been cleared [2].

2.2.2. Voltage Swell

Voltage swell is the increase in the nominal voltage lasting for more than 1 cycle and less than a few seconds. Voltage swell is less commonly occurring than the voltage sag and is usually associated with system fault conditions. A swell can occur due to the start or stop of heavy loads, fault on the system, which can result in a temporary voltage rise on the unfaulted phases. Further, the sudden interruption of current can generate a large voltage, and switching on large capacitor banks may also cause a swell as well. The consequence of the swell is damaging sensitive devices and disconnecting of the WTGs. In DFIG, the operation during a grid fault is complex because the stator is directly connected to the grid while the rotor is connected via a converter. Hence, most of the WTGs installed are automatically disconnected from the grid and reconnected when the fault is cleared to avoid such a problem. However, this action is not sufficient to meet the grid code requirements. So, the high voltage ride-through capability of WTGs with DFIG is implemented to ensure staying connected to the grid and stabilize the grid voltage in case of grid faults [21,27].
A case study conducted in Ref. [30] explained the voltage variation due to wind integration into the grid. This study has been implemented using four scenarios. The first scenario considers supplying electricity without wind integration while the second scenario includes 50% wind integration. The third scenario shows 100% wind energy integration while the fourth scenario demonstrates a grid with centralized 100% integration. The results of this study show that voltages are the same for all phases in the first scenario as it is a balanced system. However, the phase voltage rises vary with the increase of wind integration. This happened because the WTG was connected near the customer load and caused bi-directional power flows in the PCC.

3. PQ Mitigation Techniques

3.1. Traditional Methods

3.1.1. Harmonic Trap Filters (HTFs)

A fundamental technique used for eliminating harmonics is the classical HTF. These filters reduce harmonics from the output waveform of the PMSGs. The HTF consists of a series RLC circuit tuned to the frequency which has an adverse effect on the operation of the WTGs.
PMSGs consist of power electronic converters to convert the DC voltage to AC at a fixed frequency. These converters constitute six pulse rectifiers that inject high-intensity harmonics at low frequency into the grid. These harmonic injections cause further loss to the generator in the form of heat. This results in a decrease in the efficiency and lifespan of the generator. To mitigate this harmonic injection from the converters, passive filters, such as HPF are tuned to remove the characteristic harmonics introduced by the power electronic converters. The configuration of an HTF designed in [17] consists of the 5th HTF, 7th HTF, and damped filter. The paper demonstrated that HTF is tuned at an operating wind speed of 7m/s (34.36 Hz) and 11m/s (52.8 Hz) to filter out the 5th and 7th dominant harmonic components. It is observed that the HTF can mitigate the harmonic components from the voltage and current waveform thereby reducing the harmonic losses in the WTG. One disadvantage of this passive filter is that it increases the stator losses, dissipates power from the generator, and affects its efficiency.

3.1.2. Active Power Filters (APFs)

APFs use power electronics to mitigate the harmonic current components produced by the non-linear loads. APFs have more advantages than the passive filters as they help suppress the supply current harmonics and the reactive currents. There are two types of APFs: shunt and series APFs.
Shunt APF: Shunt APF consists of controllable voltage or current source. Voltage source inverter-based shunt APF is more commonly used as it simple and easier to install. The configuration of a VSI-based shunt APF consists of a DC-bus capacitor, power electronic switches, and an inductor. It operates by injecting a compensation current equal to the distorted current in the circuit leading to harmonic free source current.
Series APFs: Series APFs are connected to the distribution line through a matching transformer. The configuration of a series APF is similar to a shunt APF with a VSI used as the controlled source. It isolates the harmonics from the non-linear load and the source by feeding harmonic voltages across the interfacing transformer. A pure sinusoidal voltage waveform is maintained across the non-linear load by varying the injection of harmonic voltage. Series APFs must handle large load current which increases their current rating considerably as compared to the shunt APF, especially in the secondary side of the transformer interfacing it. This increases I2R losses. One of the benefits of the series APFs over shunt is that they are ideal for voltage harmonics elimination. APF makes use of fast switching transistors resulting in switching frequency noise appearing in the compensated current which in turn adversely affects sensitive equipment. To mitigate this problem, hybrid APFs are designed to reduce switching noise and EMI.
Hybrid APF: Hybrid APF is a combination of the basic APFs and passive filters. The conventional APF filters out the low order harmonics and the HPF filters out the higher-order harmonics. The two most commonly used configurations of the hybrid APF are the shunt APF with a shunt passive filter and a series APF with a shunt passive filter [15]. Hybrid APF acts as a harmonic isolator to improve the filtering capabilities of harmonic content while being cost-effective. In a hybrid shunt APF, the APF and the passive filter are connected in parallel with the nonlinear load. In a hybrid series APF, the APF is coupled in series with the distribution line via the interfacing transformer. In addition to the series APF, one or more single LC tuned filters are present. The series APF offers very high impedance for all higher-order frequencies other than the fundamental and the shunt passive filter filters out all the lower order harmonics.

3.1.3. Three-Bridge Four Wire (TBFW) Inverter

It performs as an active filter to mitigate PQ disturbances by providing compensation for current imbalance and current harmonics [28]. It also provides active and reactive power support. A bridge rectifier and a closed-loop boost converter are used to convert the output of the WTG to constant DC voltage. This constant voltage is then inverted to AC using TBFW inverter. It uses a hysteresis current controller to function as an APF and as a conventional inverter in TBFW [31].

3.1.4. Dynamic Voltage Restorer

Reactive power uncompensation is one of the most harmful PQ issues that cause voltage deviation at PCC. DVR is the solution for series compensation. Its function is to inject voltage to keep the voltage of the WTGs within the acceptable level. The system injected dynamic voltage is controlled to remove any fluctuations of the voltage. Besides maintaining the voltage level, DVR can reduce transients in voltage and limit fault current [21]. An example is given in Ref. [32] which investigates the effect of connecting DVR to a WTG-driven DFIG to allow uninterruptible fault ride-through of voltage dips fulfilling the grid code requirements. The system performance exercises a two-phase 37% voltage dip of 100 milliseconds duration. When the DVR compensation is applied, the voltage dip can be almost compensated, and the DFIG WTG can continue nominal operation as required by grid codes. Further, a symmetrical 30% grid voltage swell of 200 milliseconds duration is examined. As the voltage swell occurs at t = 0.8 s, the DVR injects back a voltage swell of the same but negative magnitude into the system. Hence, the voltage at DFIG WTG is reduced to the rated voltage while the grid swell is cleared at t = 1 s [21].

3.1.5. Static Synchronous Compensator

The use of PQ correctors such as STATCOM is one of the solutions to recover the deteriorated PQ issues. It aims to help the WPP in situations of voltage dips, voltage regulation, and power factor control. Additionally, STATCOM can improve many PQ issues at the PCC such as improving transient stability and stabilizing power flow [33,34]. Moreover, the STATCOM stimulates voltage stability by reactive power regulation. It injects reactive power compensation to or from the grid for voltage variations at the PCC. In the case of low voltage, the STATCOM injects reactive power to the grid to increase the voltage. When voltages levels are high, the STATCOM can absorb reactive power to decrease the system voltage. An example is presented in [33], explaining the effect of STATCOM in improving the voltage level in the system containing DFIG WTG. A 60 MVAR reactive load in the system causes a sudden voltage drop. Therefore, the STATCOM reactive power helps to increase the voltage level of the system. Additionally, the provision of reactive power at the WPPs connection point reduces the deviation of node voltage level from 0.946 p.u. to 0.979 p.u.

3.2. Future Mitigation Trends

This section illustrates the current and future paths in mitigating PQ issues in the grid subject to wind energy integration. Such trends demonstrate the advancements in energy storage technologies and control strategies of ESS and transmission technologies of transmitting wind energy.

3.2.1. Energy Storage Technology

Energy storage technologies can play a role in many aspects such as improvement of PQ and mitigation of voltage variation in addition to the reduction of energy cost. Therefore, WTGs configured with energy storage technology becomes an effective solution to minimize PQ issues when WTGs are integrated into the grid [35]. Several energy storage technologies have been investigated and validated such as flow (zinc bromine) batteries and supercapacitors. Further, flywheel ESS, superconducting magnetic energy storage, and compressed-air ESS in addition to pumped-hydroelectric storage are also advantageous [36]. The battery storage enhances the performance under the disturbances conditions of WPPs and can improve the voltage stability of the system. ESS provides a bulk system storage from wind in about 15-min periods during high power availability. Many types of energy storage technologies are being currently used in WPPs. The flow battery system is different in concept and design from the lead-acid battery. The zinc-bromine battery system offers the lowest cost for both the stored and delivered energy. Additionally, it offers high energy density, size, and weight savings over lead-acid batteries. Such type of batteries maintains their performance even after repeated cycling.
A study in Ref. [37] presents the sizing of ESS for smoothing voltage fluctuation to help high penetration of WTGs into the grid. The proposed approach determines the minimum capacity of ESS to satisfy the voltage limit based on the unbalanced three-phase interval power flow. The output voltages of power flow can directly demonstrate the voltage fluctuation rate based on their interval forms. Therefore, a feedback mechanism is built between the output voltage fluctuation rate, and the input ESS practical power to determine the minimum capacity of ESS to satisfy the fluctuation limit. The results show a reduction in the fluctuation rate from 5.76% to 3.89% when applying ESS with wind installation. Flywheel ESS is considered in simulating WFs comprising of four fixed-speed WTGs. The aim of choosing flywheel ESS is to reduce the power and voltage fluctuations caused by aerodynamic aspects of WTGs. Thus, the results illustrate the effectiveness of flywheel ESS for mitigating voltage and power fluctuations [38]. It shows a reduction in the magnitude of power fluctuation leading to a smoother output power of WPPs. Additionally, voltage fluctuation increases to 4.8%. Hence, STATCOM and flywheel ESS are implemented to reduce the fluctuation rate. STATCOM reduces the variation to 3.8% while flywheel ESS minimizes it to 0.6% [39]. The hydrogen-storage application is used to improve the grid PQ by smoothing large and quick fluctuations of wind energy. The control system strategies with battery storage can improve the grid PQ by absorbing or releasing power components. The combination of the battery storage with the control strategies could improve harmonic distortion and provides dynamic voltage control at PCC. However, the economic constraint and specific control strategies of the storage technologies should be studied in detail [36].

3.2.2. Transmission Technology

Offshore installation is one of the main trends in WTGs technology and might have a more favorable energy balance compared with onshore turbines. Offshore WTGs harvest 50% more energy than a turbine placed on a nearby site. The reason behind this is less friction on the sea surface. Additionally, offshore turbines have a longer life expectancy than onshore turbines, which is around 25–30 years. The longer life is because of the lower fatigue loads on the WTGs due to the flow turbulence at sea. On the other hand, the construction and installation of offshore turbines are more difficult than onshore turbines. However, the transmission of the power generated by offshore WPPs to the distribution system is another aspect to be carefully considered. HVAC is a simple and economical solution for power transmission from grid-connected offshore wind farms. However, the length and power capacity of HVAC cables are limited. The reason is that the distributed capacitance of undersea cables is much higher than that of overhead transmission lines. However, HVDC is a secure and efficient way to connect offshore WPPs to the grid. HVDC transmission system offers many advantages in comparison with HVAC. It has a higher power transmission capability and the power flow is controllable. Further, cable power losses are low, and offshore WTs are isolated from any disturbances. However, the classical HVDC transmission system is based on the CSCs with naturally commutated thyristors, which are the so-called LCC. LCC-based HVDC transmission technology suffers independent control of the active and reactive power. Furthermore, it produces a big amount of harmonics. VSC based HVDC transmission system provides more advantages for the connection of large offshore WPPs. Such a system does not require a strong offshore or onshore ac network and can even start up against a dead network. Additionally, the reactive and active power can be controlled in a VSC-based HVDC transmission system. Transmission technologies can help in stabilizing the grid at PCC [33].

4. Simulation of Voltage Mitigation

4.1. Voltage Mitigation and Control

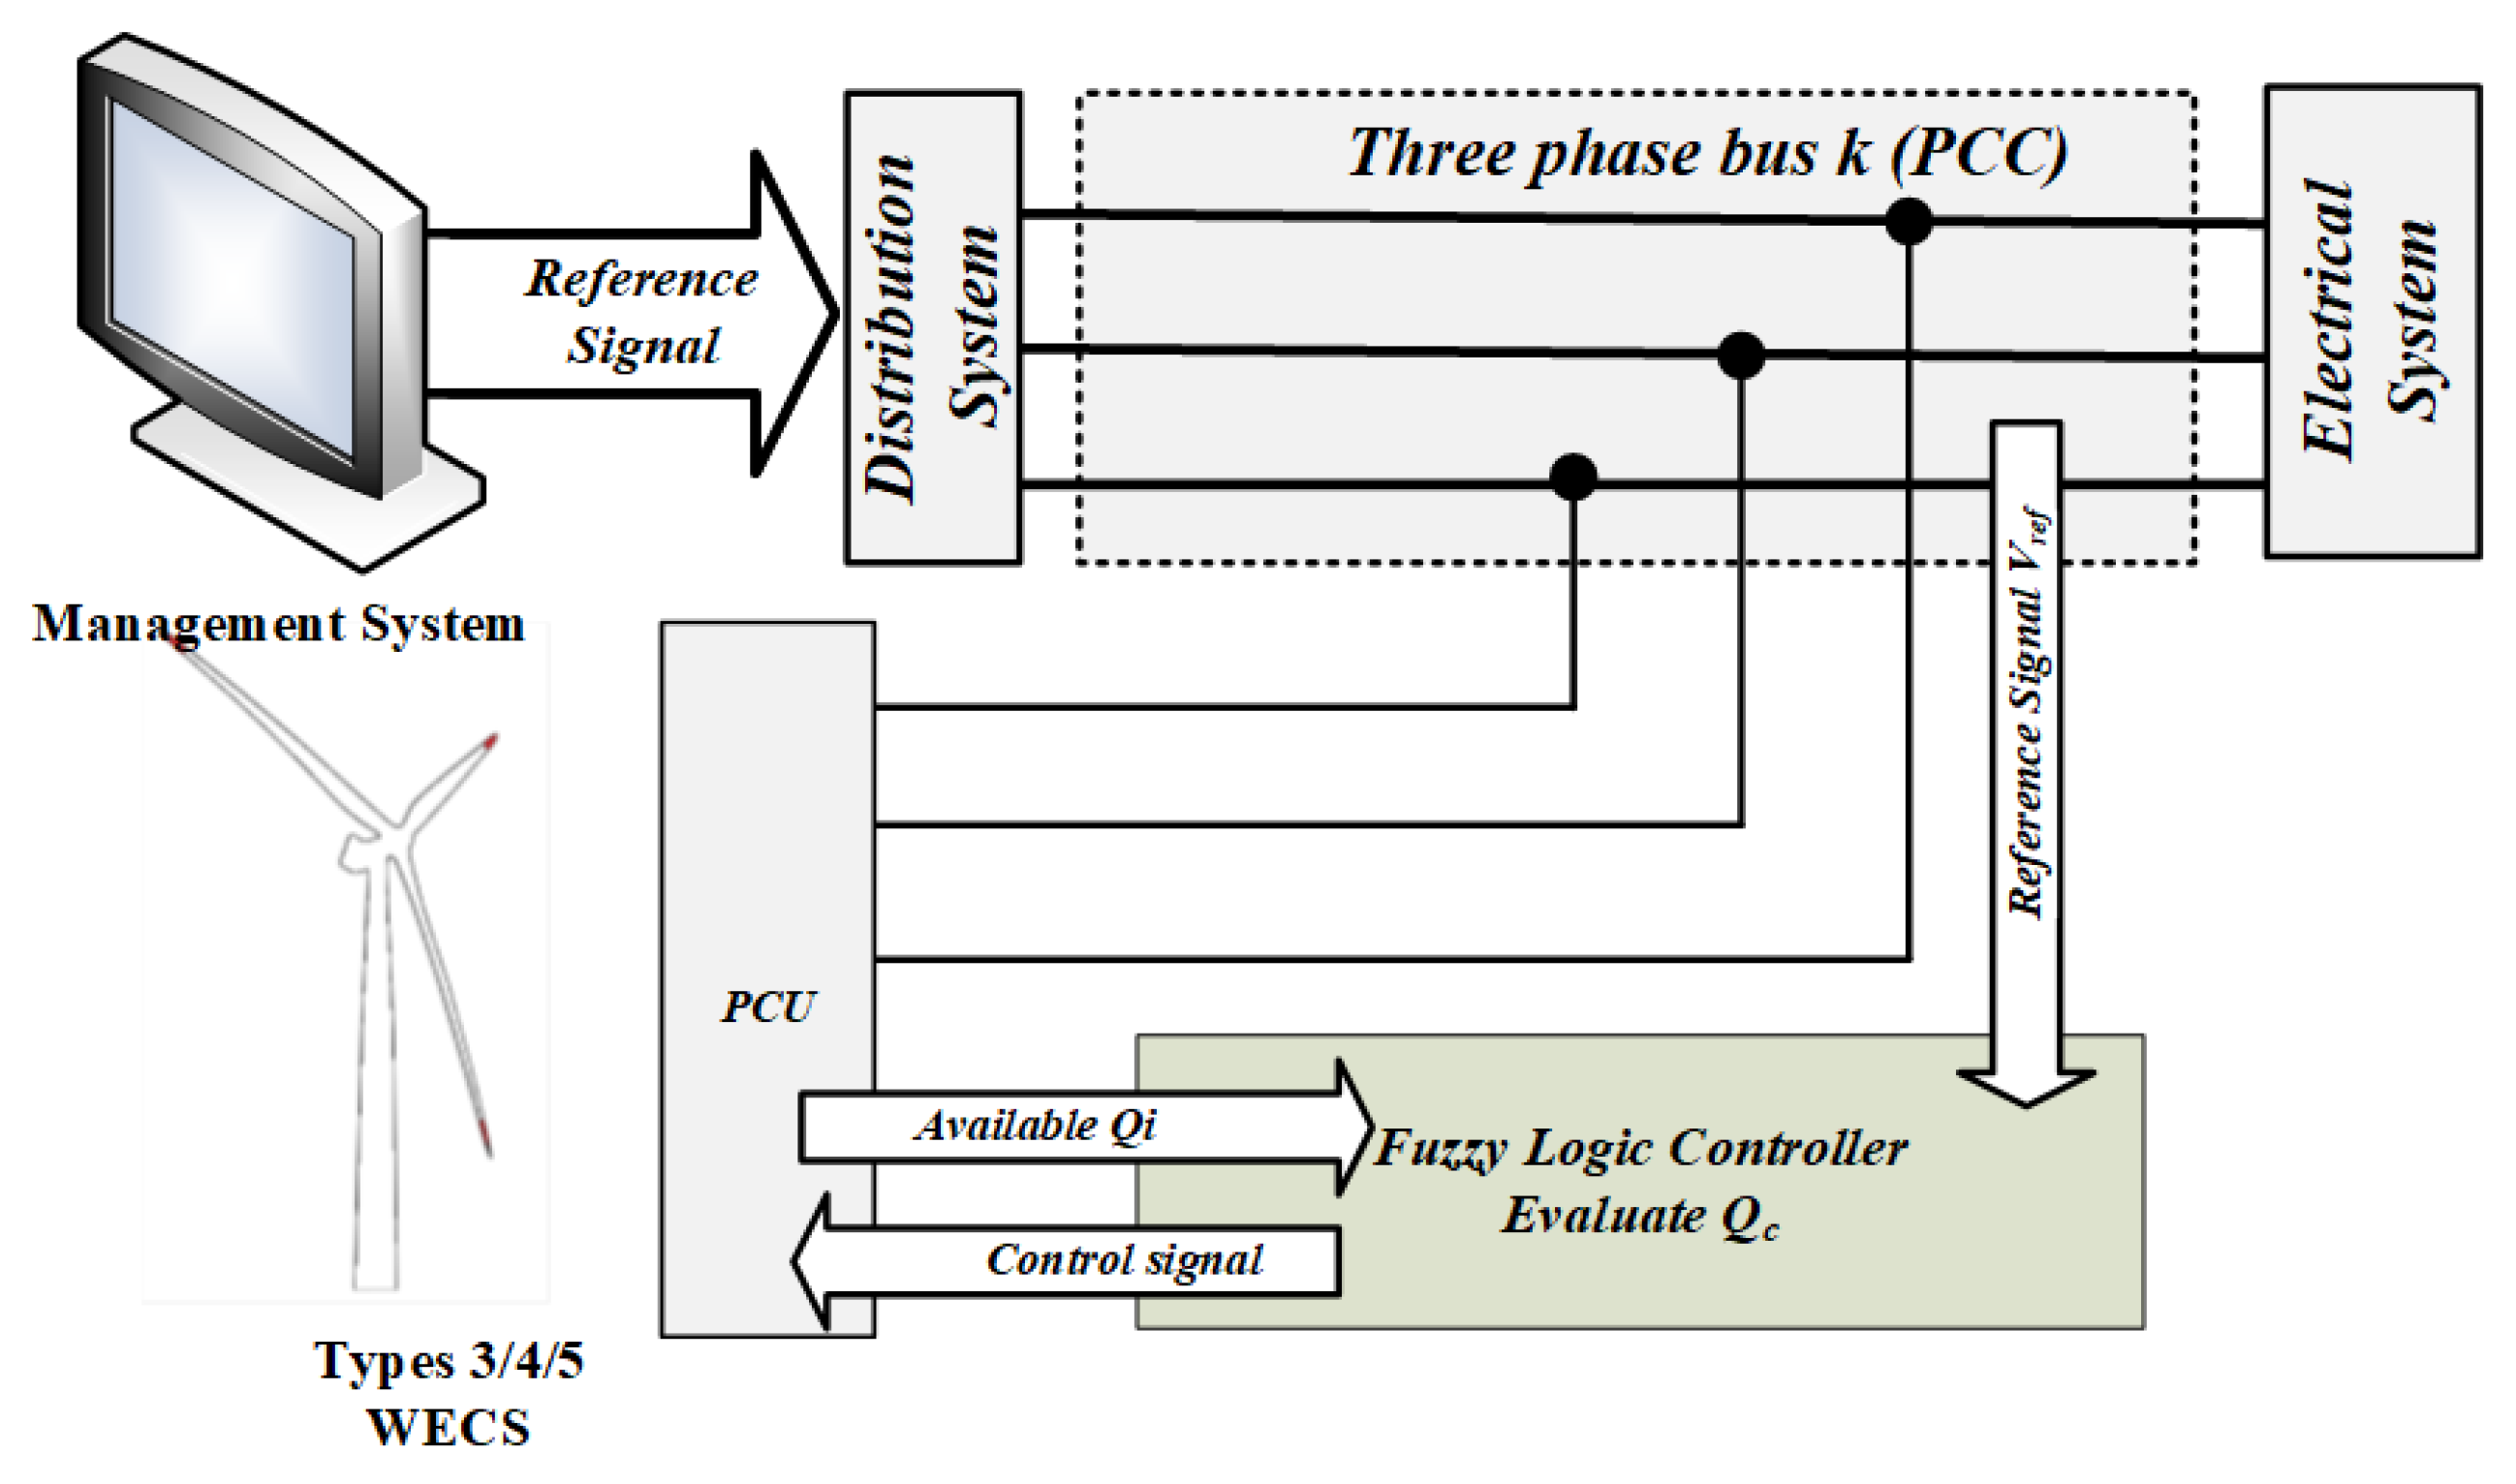
As the voltage variation is considered the main problem associated with intermittent wind-based energy sources [9]. The voltage mitigation is achieved using the available reactive of the inverter-based WECS as shown in Figure 2. The system involves WECS connected to an arbitrary node k of the study distribution network which may involve various loads. A control signal is generated from the management system which is sent via power line communication (PLC) and extracted at node k by the WECS control circuit. A developed control circuit assesses both the available reactive power from the inverter circuit as well as the voltage at the controlled node and hence a suitable amount of reactive power is compensated at the point of common coupling (PCC).
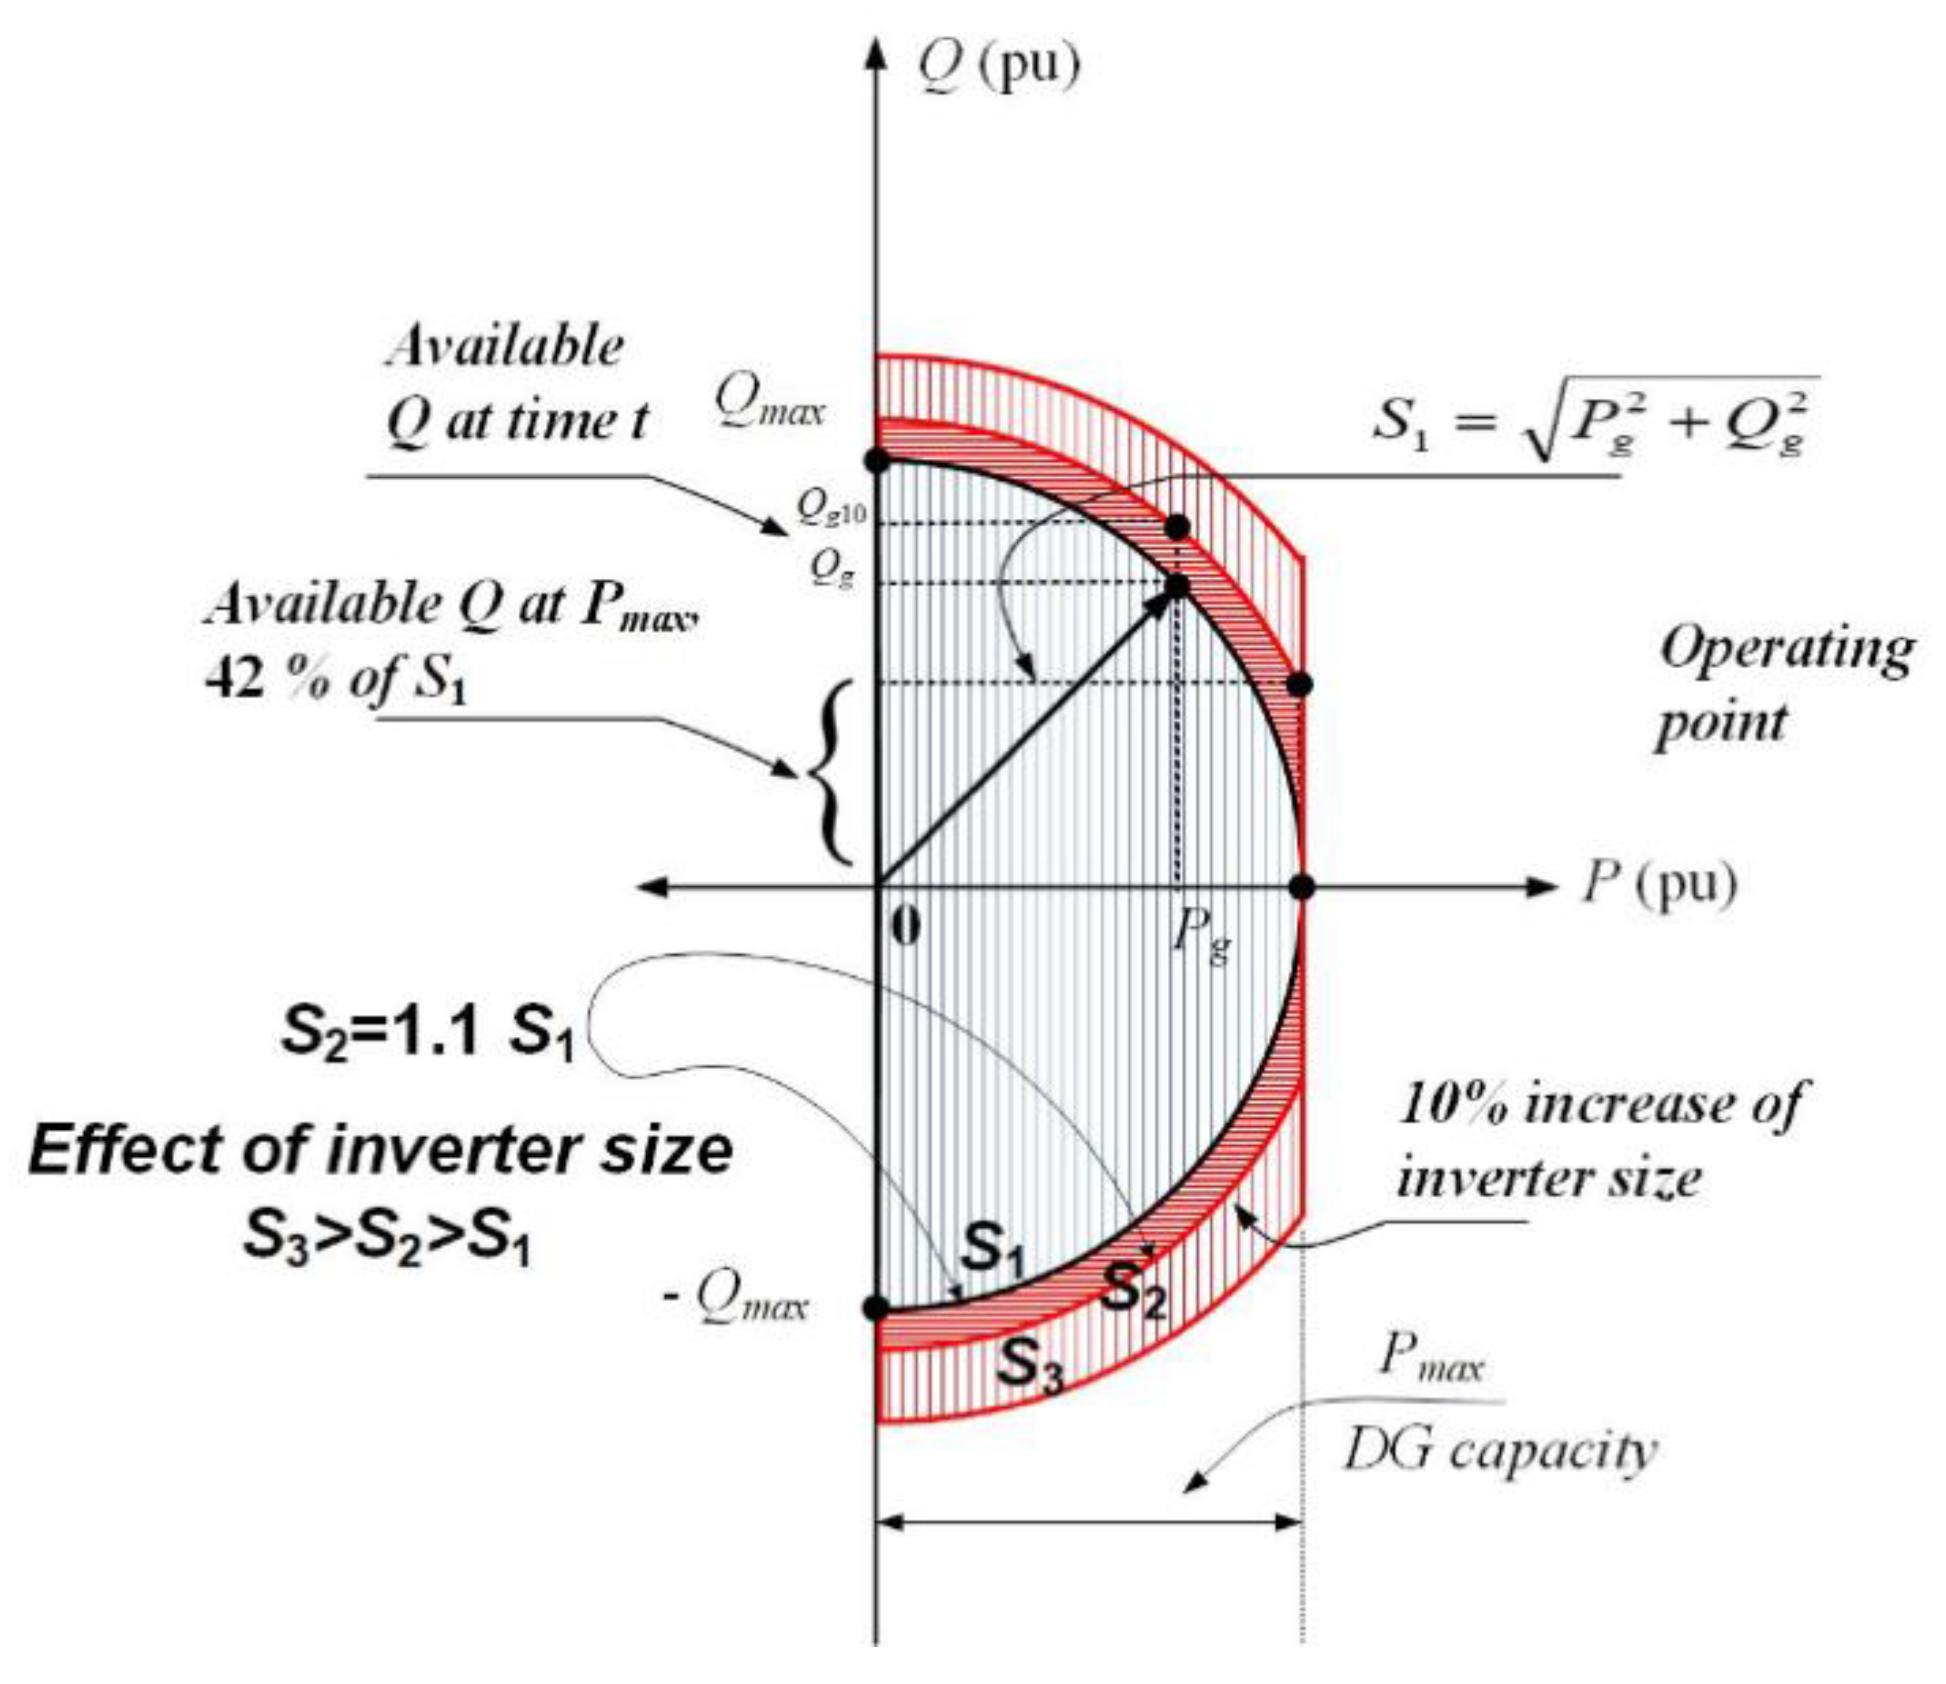
The general representation of the two-quadrant operation of the interface inverter is shown in Figure 3, which is possible for Type 3 and Type 4 WECSs [19]. As shown in the figure, the available reactive power depends on the generated real power from the WECS. For a specific power generation P g the available reactive power Q i for the purpose of compensation is calculated in real time as follows:
Q i = S i 2 P g 2
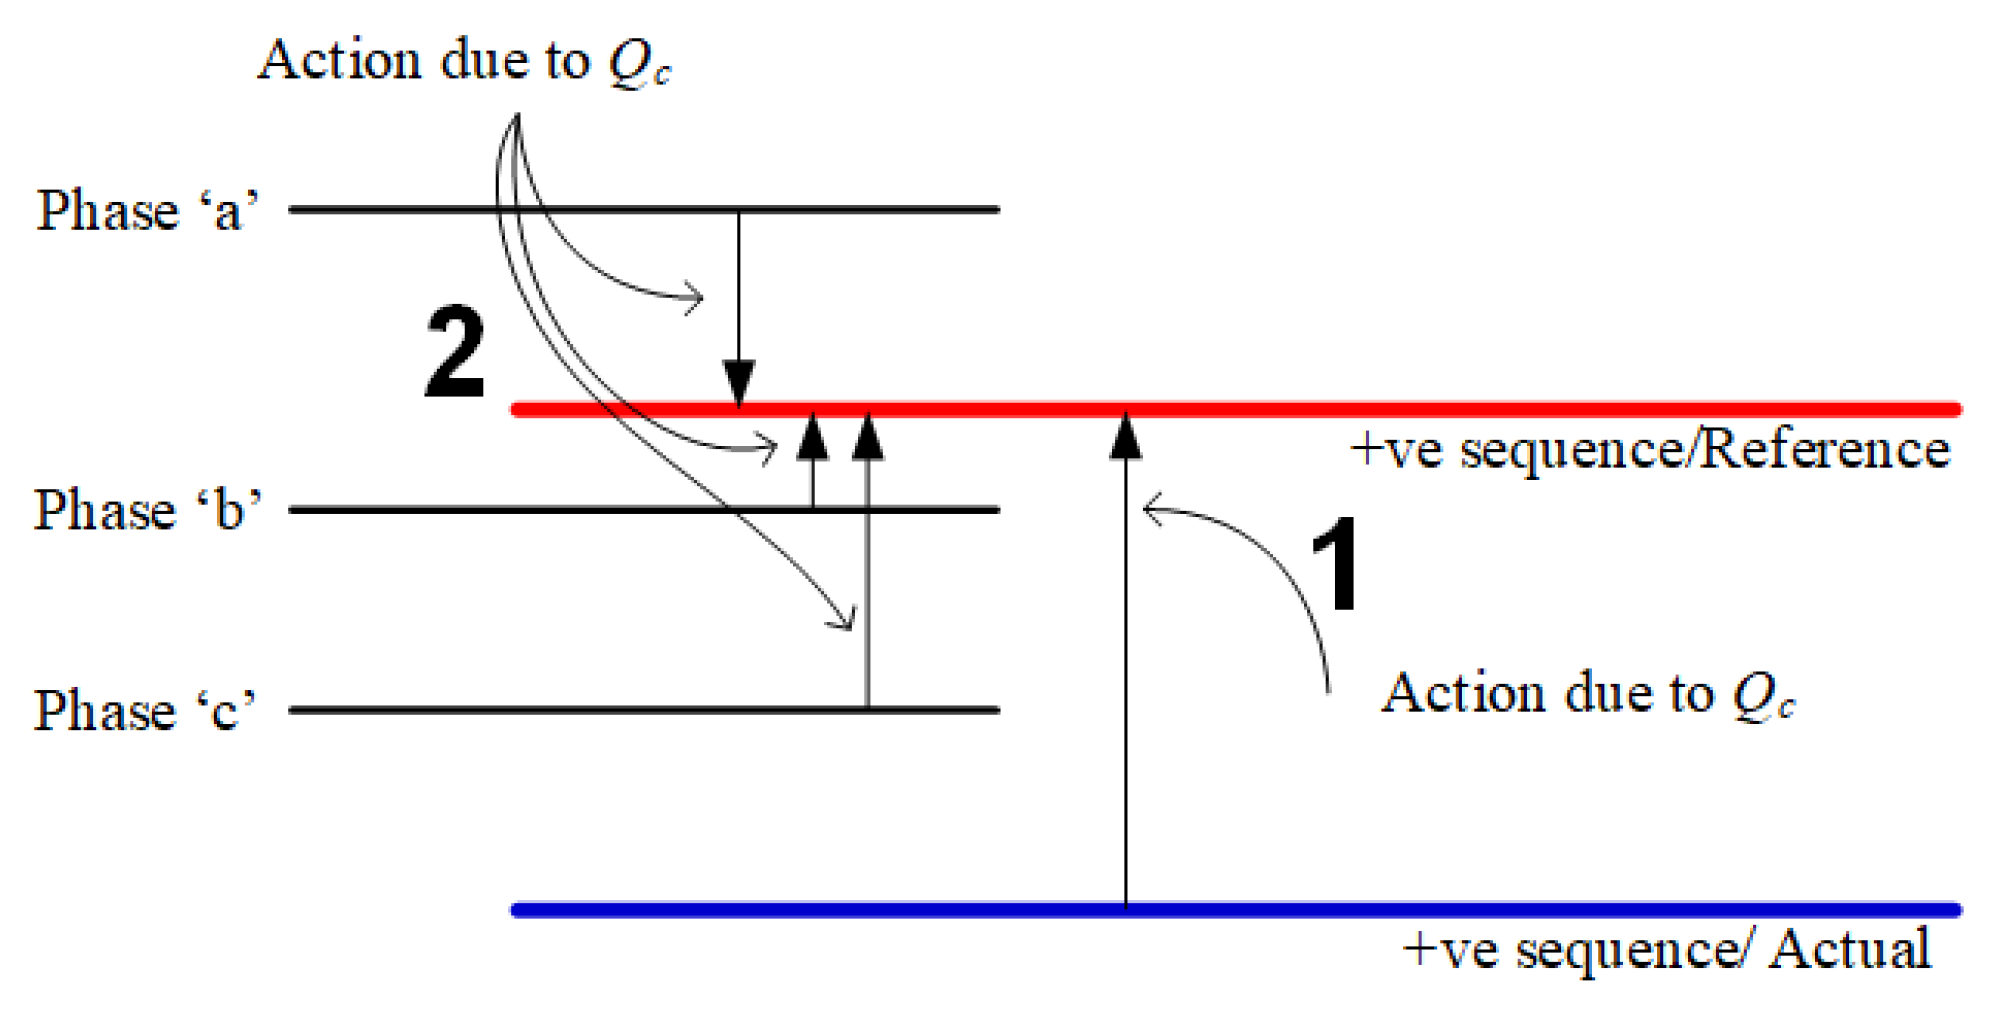
However, the actual amount required for compensation to mitigate the voltage and keep it within a preset code could be different from the available from the inverter Q i . The actual amount is computed using control methods such as drop control or fuzzy logic controllers. In this paper, the voltage deviation is evaluated, and fuzzy rules are implemented to compute the required reactive power Q c to maintain the voltage at the PCC of the WPP. The developed control depends on a reference signal sent by the management system. In distribution systems, two objectives are defined to control the voltage level as shown in Figure 4.
(1)
the compensation is computed to minimize the deviation between the actual positive sequence and the reference voltage, hence the overall voltage profile could be improved
(2)
the compensation is computed per phase based on the deviation among the three phases and the reference voltage, hence both the voltage profile and unbalance factor are improved.
In the case of Q c > Q i , the value of Q c is set to equal the available reactive power from the inverter Q i . If the inverter size is higher than the installed generator capacity, the available Q i is increased by a considerable amount which could be invaluable for voltage mitigation [40]. The figure shows that if the inverter size is increased by 10%, the available Q i changes from 0 to be 42% of the inverter capacity S i as shown in Figure 3.

4.2. Fast Quasi-Static Time Series Analysis

To simulate the intermittency of WECS and test out advanced control action, robust simulation tools are required. Since it is hard to simulate large power systems using time-domain simulation, quasi-static time series algorithms have been emerged particularly to deal with power networks with renewable energy systems (RESs). The developed fast quasi-static time series (FQSTS) algorithm has been implemented to perform various steady-state simulations of electrical energy systems [41,42,43]. The FQSTS is developed using C++ programming language and it can simulate and produce time series for many system variables [44]. There are two main algorithms have been developed to deal with electrical power systems as follows:

4.2.1. Transmission Systems Tool

The FQSTS simulation of transmission system involves two types, dispatchable and non-dispatchable sources. The dispatchable sources include fossil fuel power plants. The non-dispatchable sources include RES such as wind power penetration. The latter enjoys priority dispatch criteria to encourage investment in RES. In transmission systems, the time series involves various time-scale control actions including economic load dispatch and primary and secondary controls. The operation cost is optimized during the simulation using economic load dispatch as follows:
min F = i = 1 N g f i ( P g i )
P g i , m i n P g i P g i , m a x
where F is the total operation cost of fossil fuel power plants, f i is the cost function of a power plant, P g i the power generation of a power plant i.
Equation (8) is subject to a set of equality and inequality constraints such as power balance equation, minimum and maximum power generation for each power plant. The economic load dispatch is usually solved repeatedly during the FQSTS simulation every 15–30 min. Within this time frame, control actions including steady-state frequency error calculation and power participation are executed to guarantee power balance in the system [42]. Control action of the automatic voltage regulation (AVR) is included in the simulation for all power plants. The generated reactive power is subject to the excitation system limits which is described by:
Q g i , m a x Q g i Q g i , m a x
In the case of WPP, the reactive power limits depend on the available reactive power according to (1), hence WPP reactive power compensation is reactive power expressed as follows:
Q i Q c Q i
The developed tool utilizes standard power-flow libraries including the Gauss method and Newton-Raphson methods to track the state variables of the transmission system.

4.2.2. Distribution Systems Tool

The developed algorithm is intended to deal with distribution systems which are characterized by both system and load unbalances as well as high R/X ratio. To increase the speed of computation, hence, an accelerator is used to speed up the solution process. The main packages of the simulator include the following:
Accelerator: The developed algorithm utilizes various predictor methods including linear and non-linear predictors to predict the initial guess of the voltage magnitude and phase angle. The initial guess for a specific function can be evaluated as follows [45]:
y m ( x ) = i = 0 n y m ( x i ) j = 0 j i n x x j x i x j
where m refers to the phase a , b ,   o r   c , y m is the voltage magnitude V m or phase angle δ m , the variable x represents the independent variable which could be the time or active or reactive power according to the prediction technique adopted for calculating the initial guess [44,46,47]. If the adopted technique is based on time variation instead [44,47], a linear approximation of (6), n = 1, is expressed as follows:
V m ( t ) = V m ( t 0 ) t t 1 t 0 t 1 + V m ( t 1 ) t t 0 t 1 t 0
δ m ( t ) = δ m ( t 0 ) t t 1 t 0 t 1 + δ m ( t 1 ) t t 0 t 1 t 0
An approximation used for (3) can also be utilized for evaluating the initial guess during the solution of a time series considering the voltage magnitude and phase angle as a function in the load variation [46].
Power-flow engine: The load flow analysis utilized with the FQSTS is based on the forward-backward sweep analysis method [44,48]. The method includes mainly three basic steps [47]:
(1) calculating the nodal current injection for phase p = a, b, or c:
I i p = ( S i p V i p ) *
(2) calculating the branch current vector J l which flows in a line segment l connected between upstream node i and downstream node j nodes:
J l = I j + k L L J k ,
where k is the set of lines connected to the downstream node j of the line segment l.
(3) after calculating the branch currents, nodal voltages are updated starting from the substation as follows:
V j = V i Z i j J l ,
where V is the voltage vector, Z i j is the line impedance matrix of a line segment l connected between nodes i and j .
The above three steps are repeated until the convergence of the power flow solution is realized.

4.2.3. Overall Simulation Process

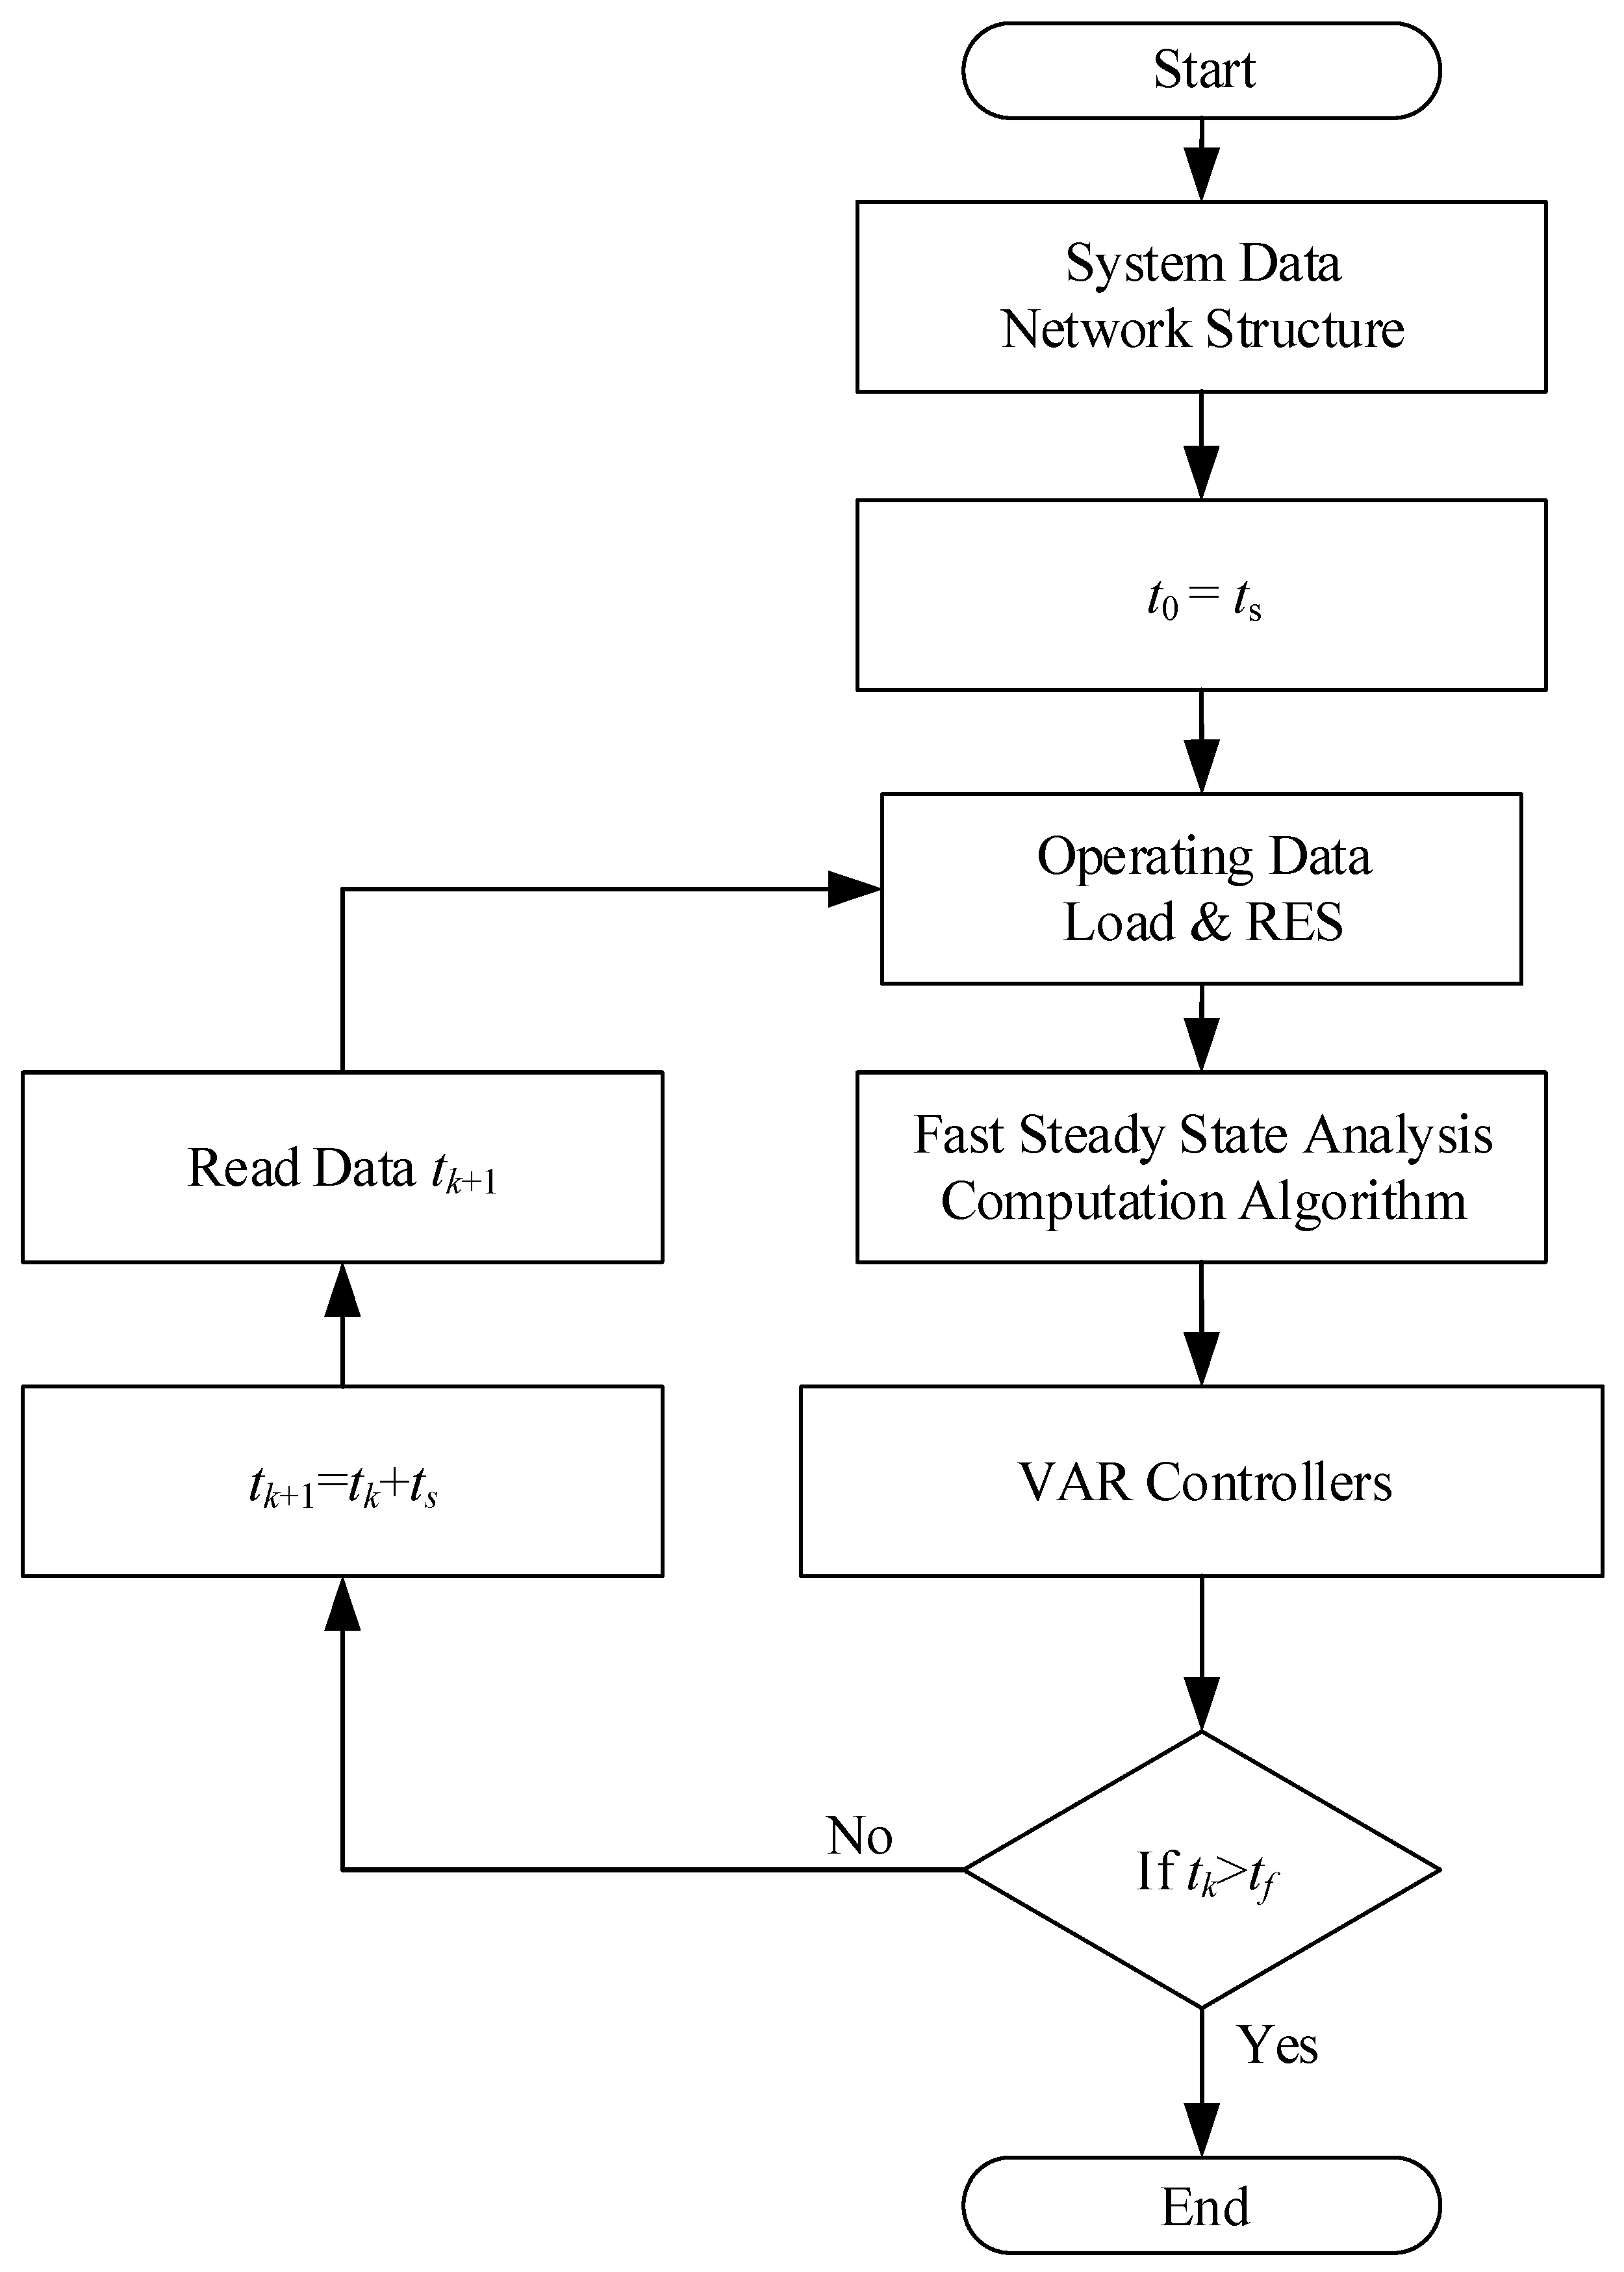
The developed FQSTS simulator models various types of wind types energy systems as well as other resources such as energy storage systems including electric vehicles [49]. Additionally, the FQSTS involves voltage stability and control algorithms [40,48,49,50,51], and system and operating data management. Hence, simulation of mitigation using active and reactive power control can be studied using the FQSTS algorithm [42,44,46,47,52,53]. The basic blocks of the solution process performed using the FQSTS simulator are shown in Figure 5 where the process starts with data preparation of the study system. The simulator begins the calculations using flat-start conditions of all variables and conducting simulations starting from the initial time t 0 whereas the time t k is progressing towards the final time of the simulation period t f . The simulator performs simulation using time steps t s starting of 1 s.

4.3. Results of Selected Case Studies

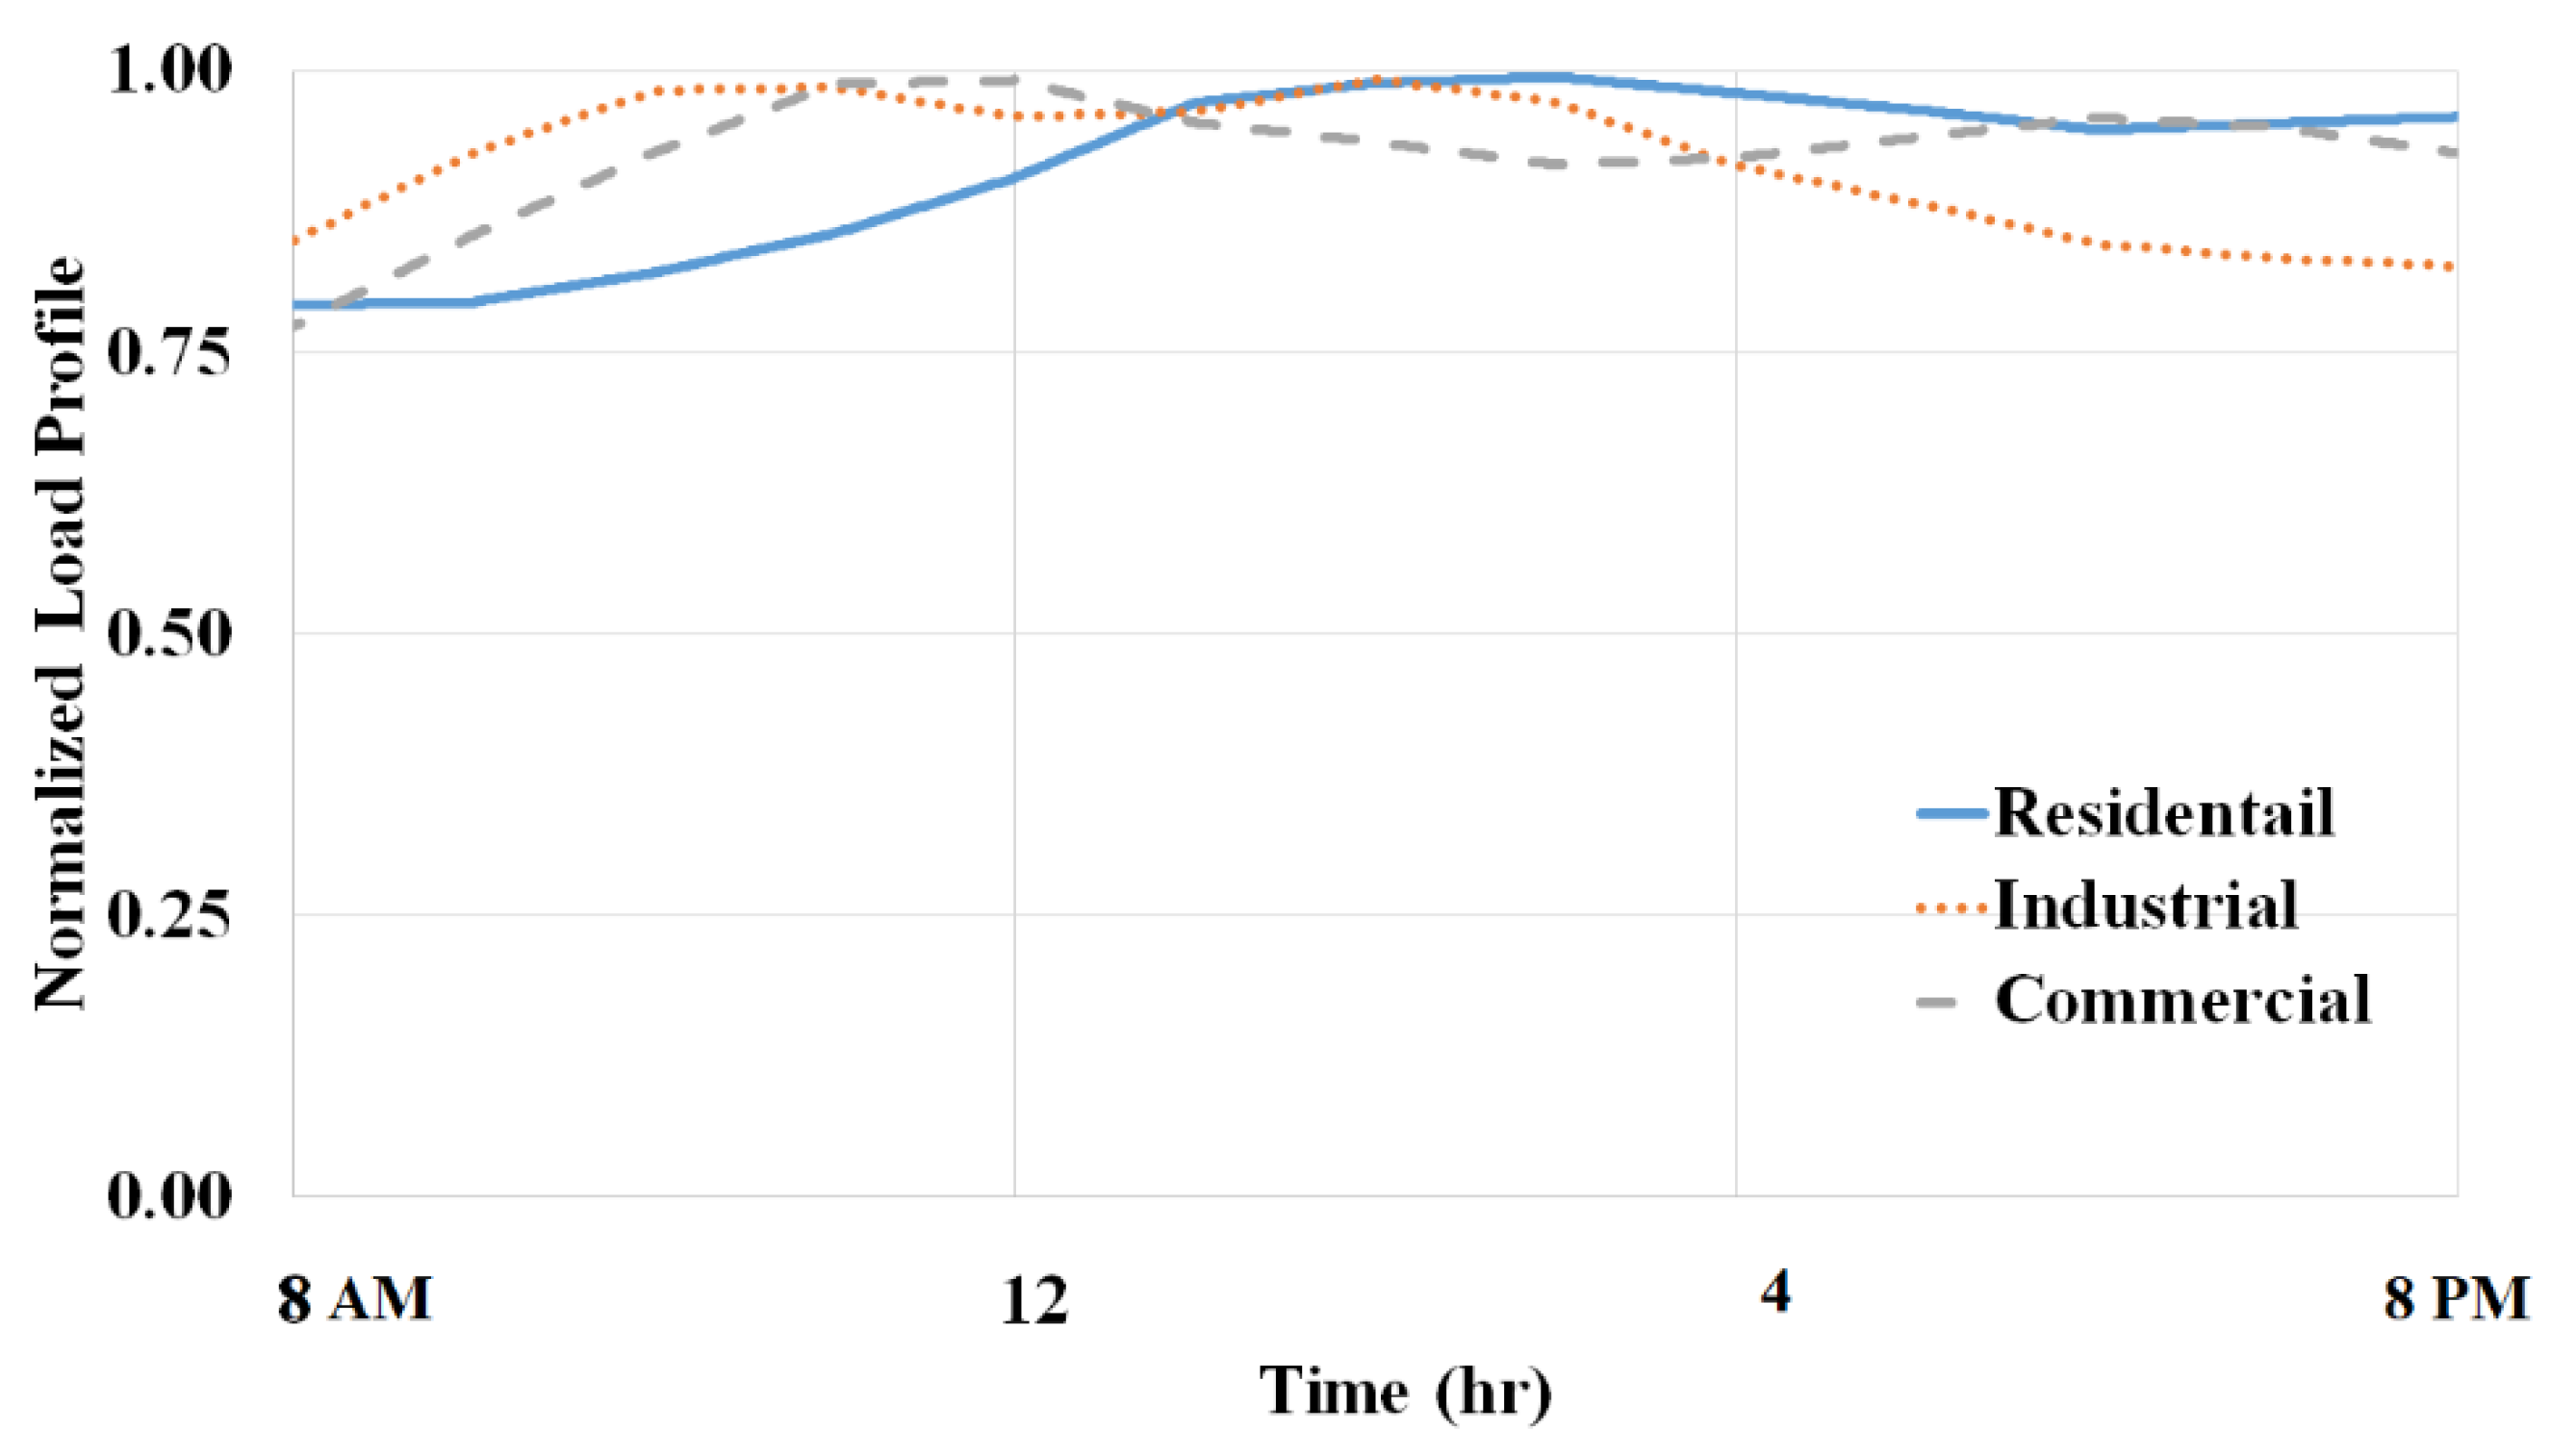
In this section, mitigation of voltage variation due to WPP using reactive power using two standard IEEE test systems [54]. Typical Saudi electric load profiles for real data collected during summer months are used to perform the simulation. The load profiles of these daily load curves are as exhibited in Figure 6 that are based on a substation located in Riyadh, Saudi Arabia [55]. The WPP utilizes an intermittent wind power generation profile which is shown in Figure 7 [42].

4.3.1. Transmission System Case Studies

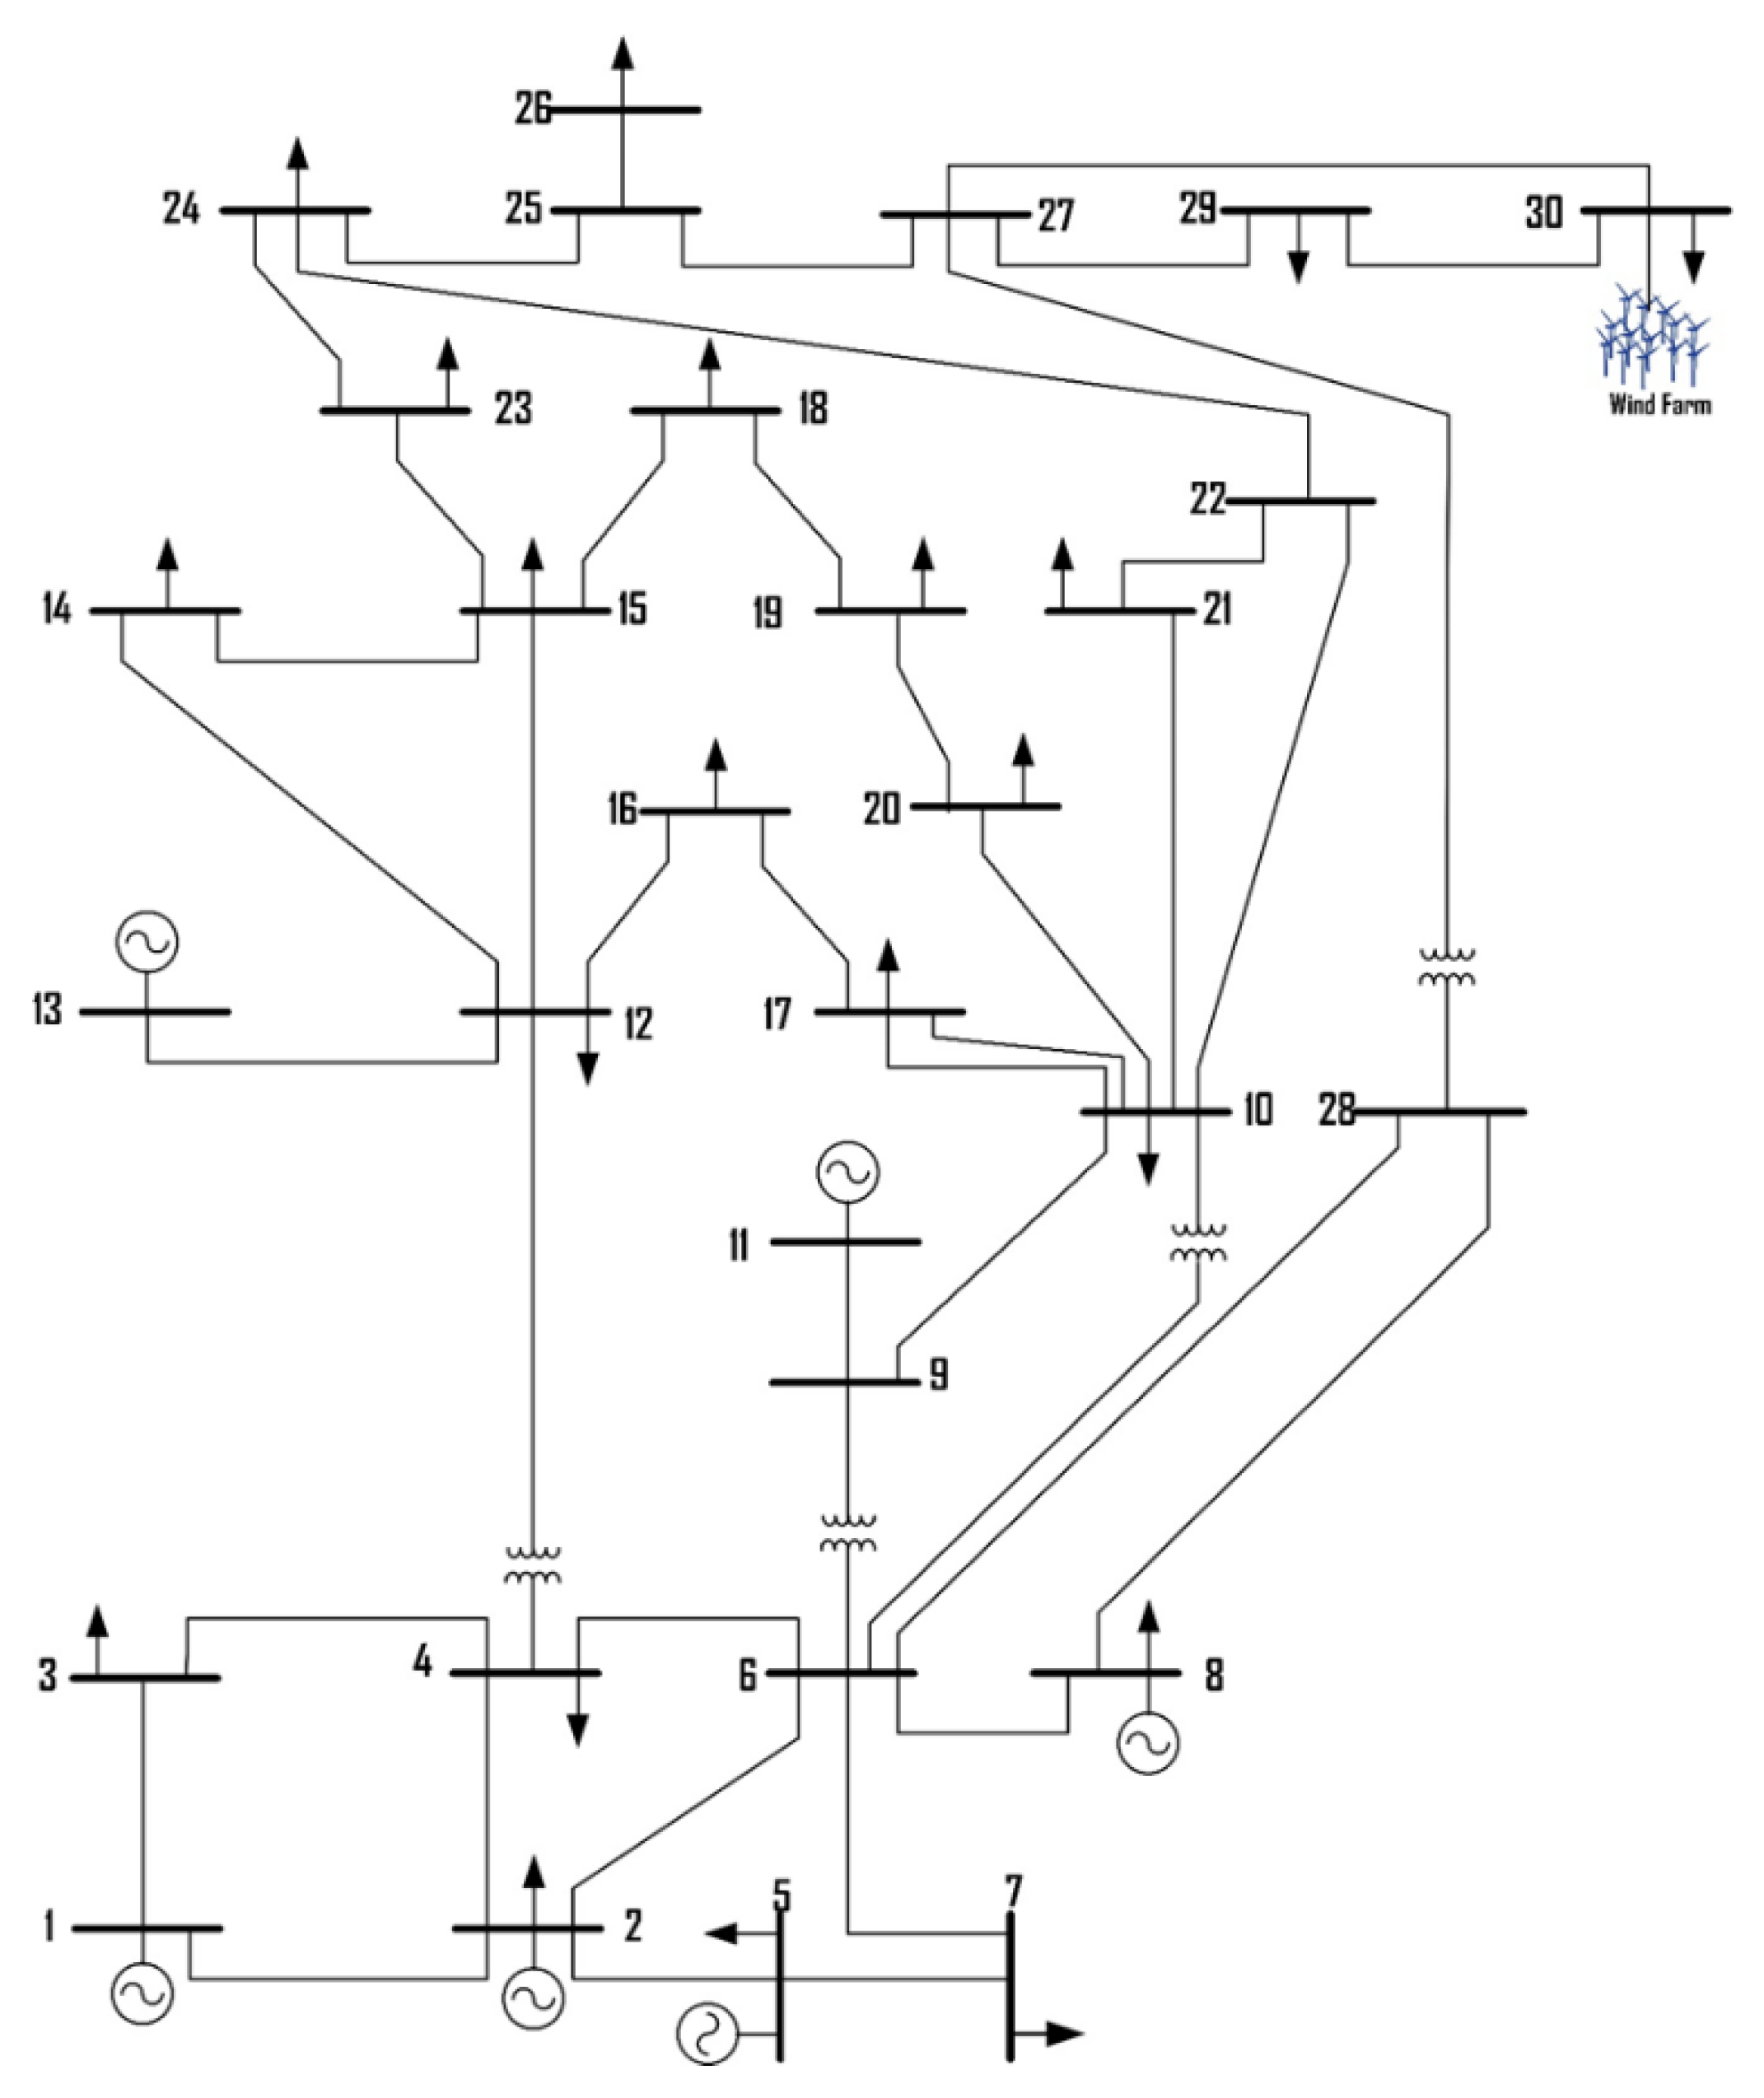
The IEEE 30-node test network comprises of 30-node, 41-line, and 256.4 MW total base demand. The system has six generators that are connected at nodes “1”, “2”, “5”, “8”, “11”, and “13”. The complete circuit of the IEEE 30-node is shown in Figure 8 which is based on reference [56]. The WPP is connected at node “30” of the IEEE 30-node test system [57]. Three cases are analyzed that include: Case 1 the system without any wind penetration at node ‘30′, Case 2 the capacity of the WPP is taken small as 10 MW, and finally Case 3 the capacity of WPP is 50 MW which is about penetration level of 25% of the total base demand.
In all cases, the IEEE 30-node test system is analyzed using the FQSTS simulator at a loading factor of one and half of the base case demand for all simulations. The simulation is conducted based on a 1-s time step whereas the economic load dispatch is executed repeatedly every 15 min. During the 15-min timescale, load frequency control and base-point participation are regularly performed. Any deviation in the power balance within a timescale of 1-min is represented by a steady-state frequency drop which is corrected via base-point participation. The test shows the interaction features of various control actions in the study system during the simulation period of 24-h. As the FQSTS provides a grid simulation with many details for system variables, the focus of the analysis here is directed to the WPP reactive power compensation, and its impact on voltage mitigation.
Case 1 System without wind penetration: the IEEE 30-node is analyzed without WPP at node “30”. The voltage profiles of the voltage-controlled nodes and node “30” are exhibited in Figure 9. The results show that the available reactive power by synchronous machines is sufficient to keep the terminal voltage of the controlled nodes “1”, “2”, “11”, and “13”. The remaining generators at nodes “5” and “8” couldn’t provide the necessary reactive power to keep the voltage at the desired reference value. This is mainly due to their excitation limits as well as high local reactive power demand and nodes “5” and “8”. The voltage at node “5” becomes controllable again as the time approaches noontime. This is in line with demand variation in the kingdom of Saudi Arabia. According to the demand profiles shown in Figure 6, commercial demand drops, and residential demand increases during the noontime (12:00–4:00 PM). The generator at node “5” can provide 40 MVAR with a maximum local demand of 19 MVAR. Hence, the generator can control the terminal voltage if there is no high reactive power demand propagated from the network. However, this is not the case for the generator at node “8”, the generator can only provide 10 MVAR whereas the maximum local demand is 30 MVAR which is much beyond the generator capacity even if there is a drop in the demand. Hence, the voltage V 8 becomes uncontrolled as exhibited in Figure 9. Finally, the voltage V 30 at node “30” which is a candidate location to install the WPP is uncontrollable since it is treated as a pure load node in the simulation. The results show that although node “30” has low active and reactive demand, the voltage drops beyond 95%.
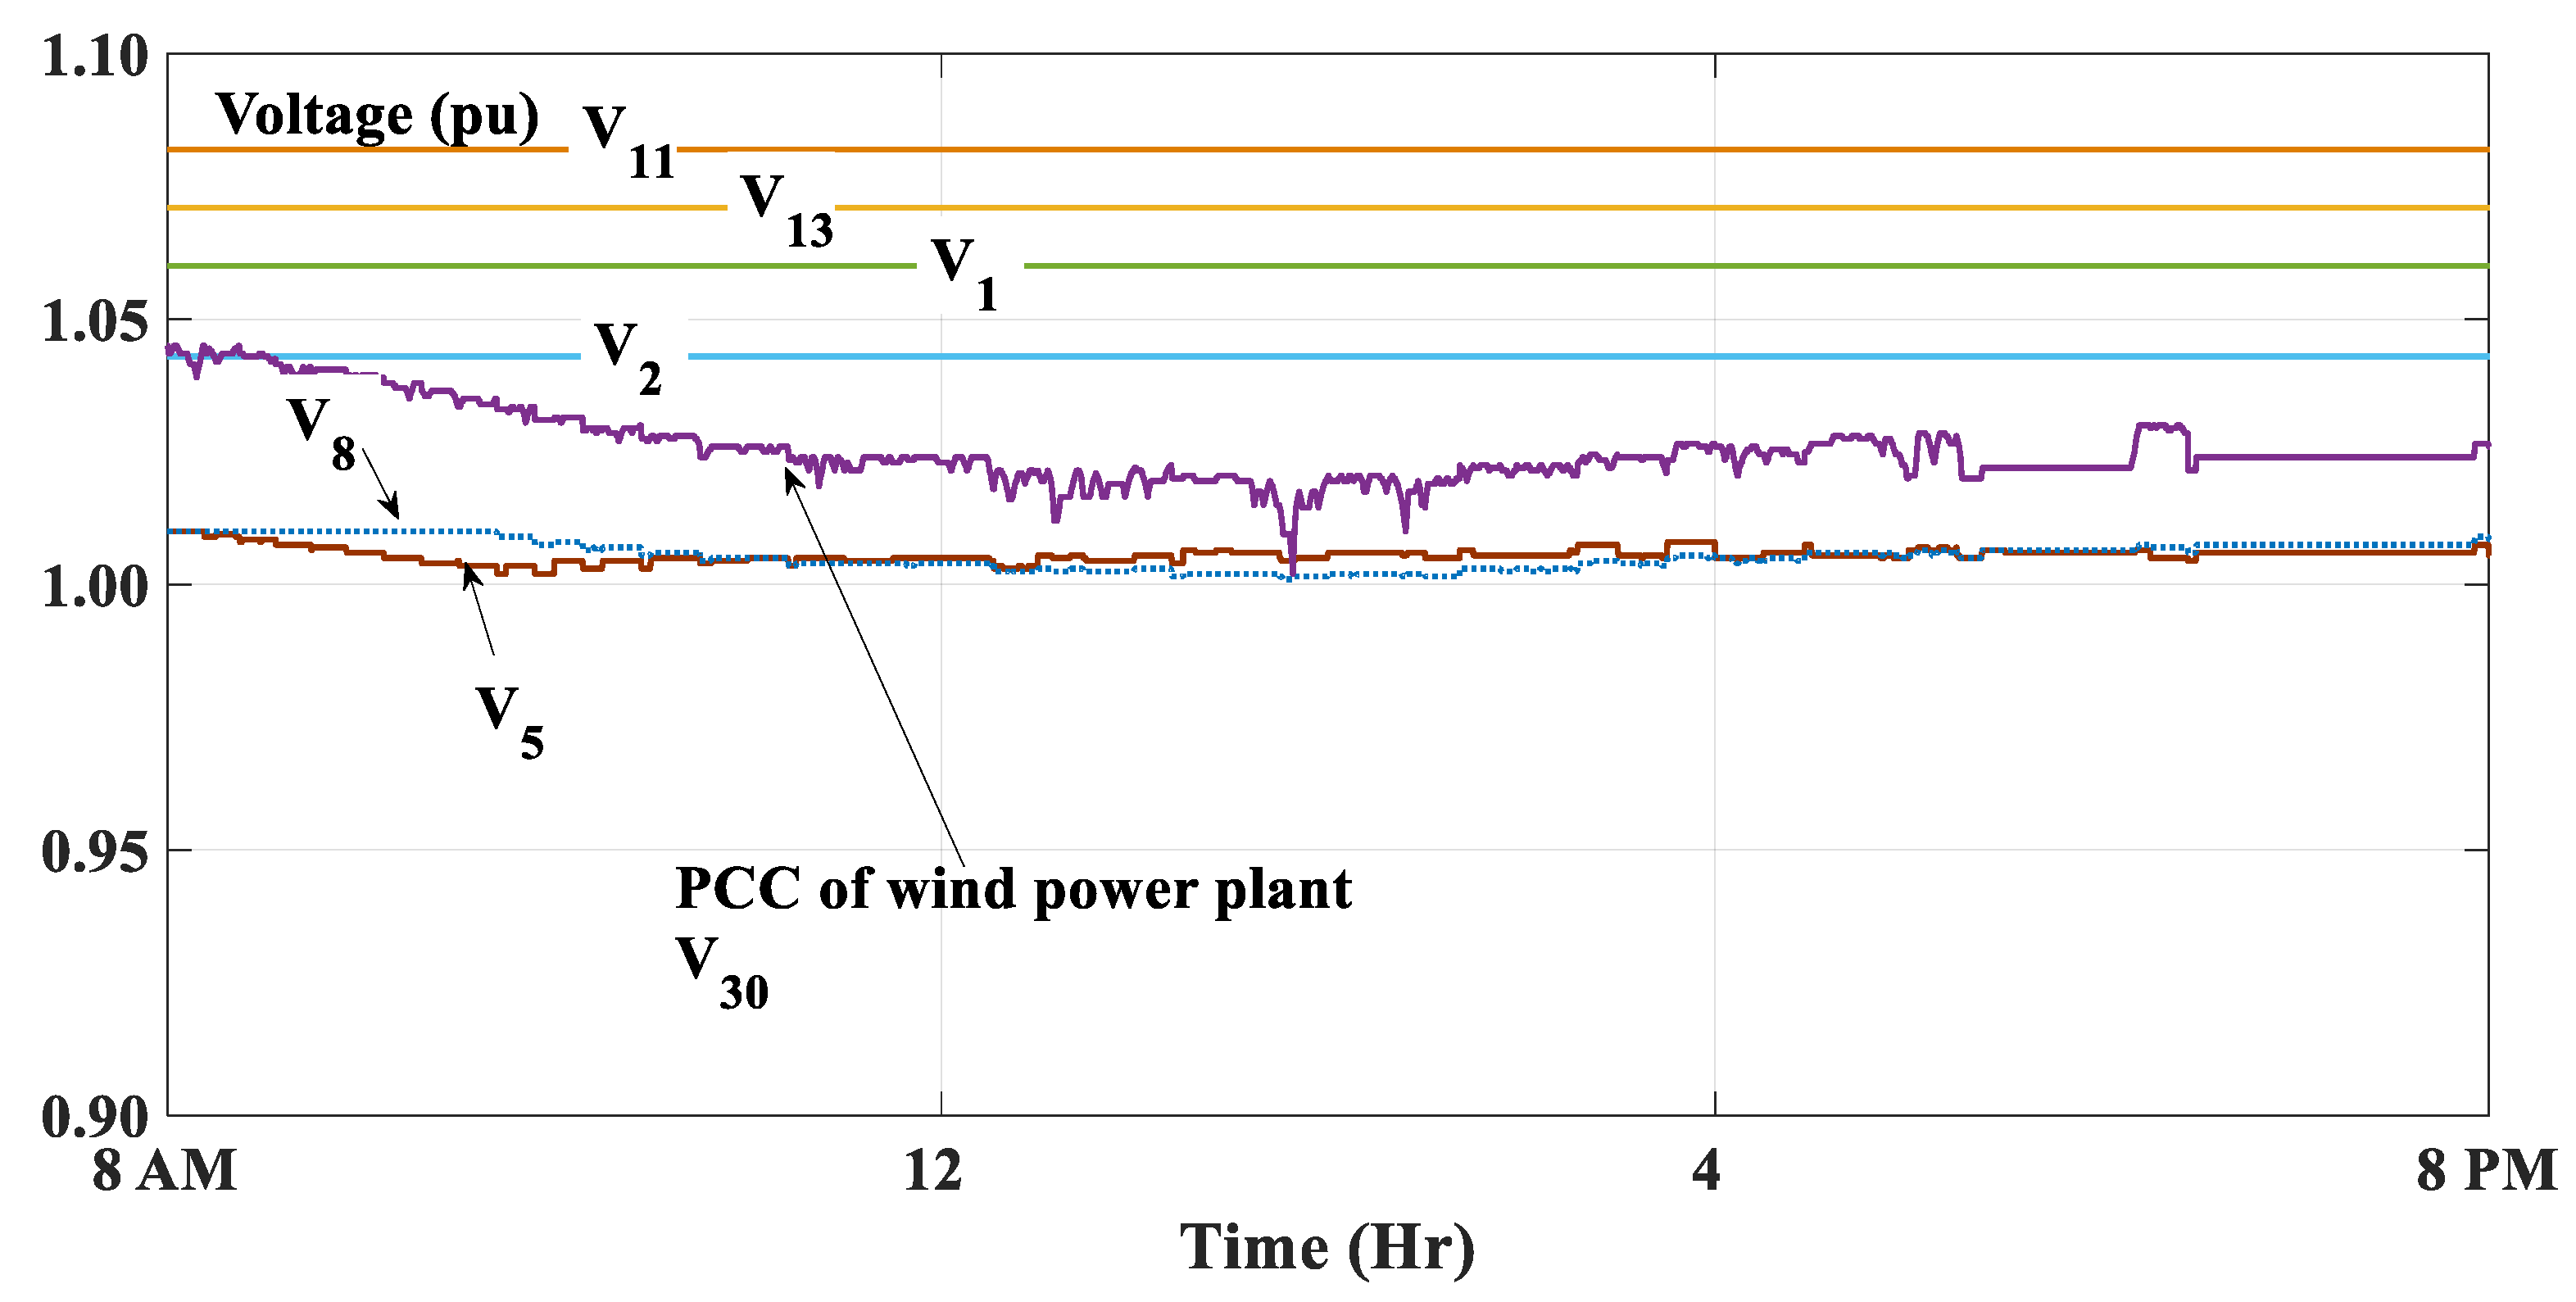
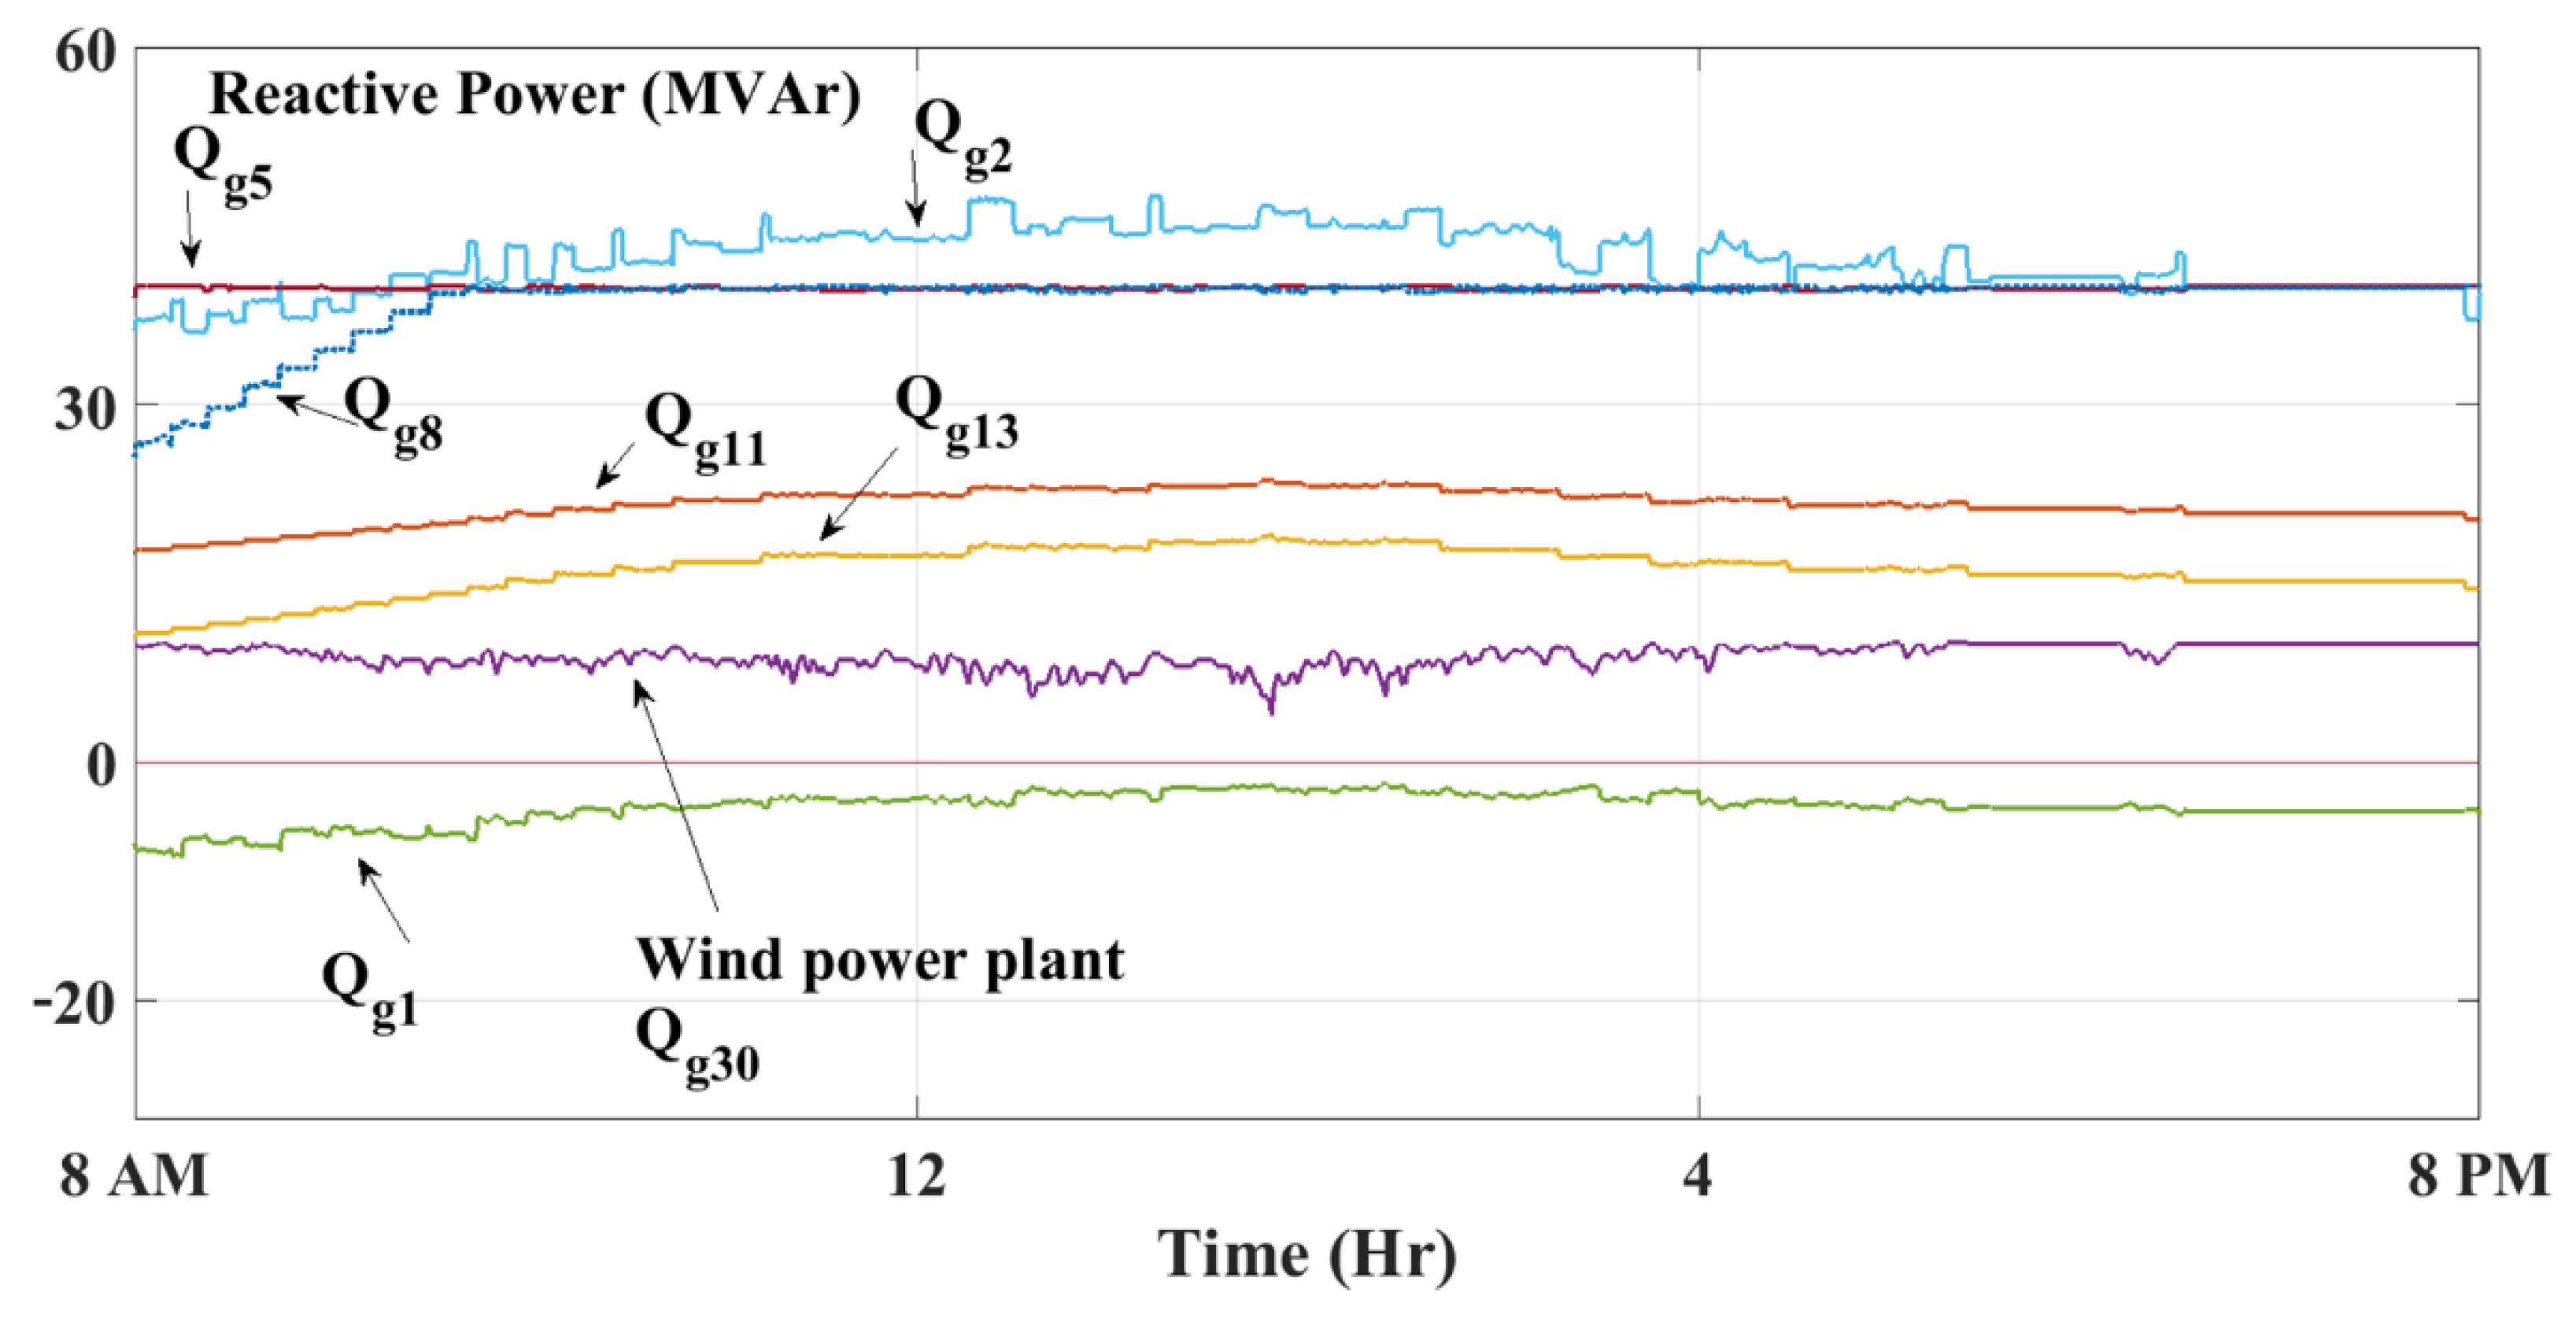
Case 2 System with 10 MW WPP: A 10 MW WPP is connected to the IEEE 30-node at node “30”. The WPP is equipped with reactive power compensation facilities. Figure 10 shows that the voltage at the controlled voltage nodes and the voltage at the PCC of the WPP. Generators at nodes “1”, “2”, “11”, and “13” have the necessary reactive power to keep the terminal voltage of these power plants at their desired reference value. However, the remaining generators have limited reactive power as discussed in Case 1. The generators at node “5” and node “8” provide the maximum reactive power available as shown in Figure 11. Hence, the two generators cannot maintain the terminal voltage at the desired values. Their model is changed from a controlled voltage node to a constant PQ generator model.
Similarly, the WPP at node “30” cannot maintain the terminal voltage at the PCC since it already delivers all reactive power available from the compensator. The reactive power of the WPP is bounded by Equations (1) and (3). With power generation intermittency, it is quite difficult to regulate the voltage all the time due to the variation of the reactive power limit. The results show that the reactive power generation of the WPP delivers its maximum reactive power during the whole simulation period. Hence, with a small WPP in a range of 5% of the total base demand, voltage fluctuations are not fully mitigated using the available reactive power from the WPP. It is important to mention herein, that the voltage variation at PCC of the WPP is not a local problem but also affects other unregulated nodes of the study system.
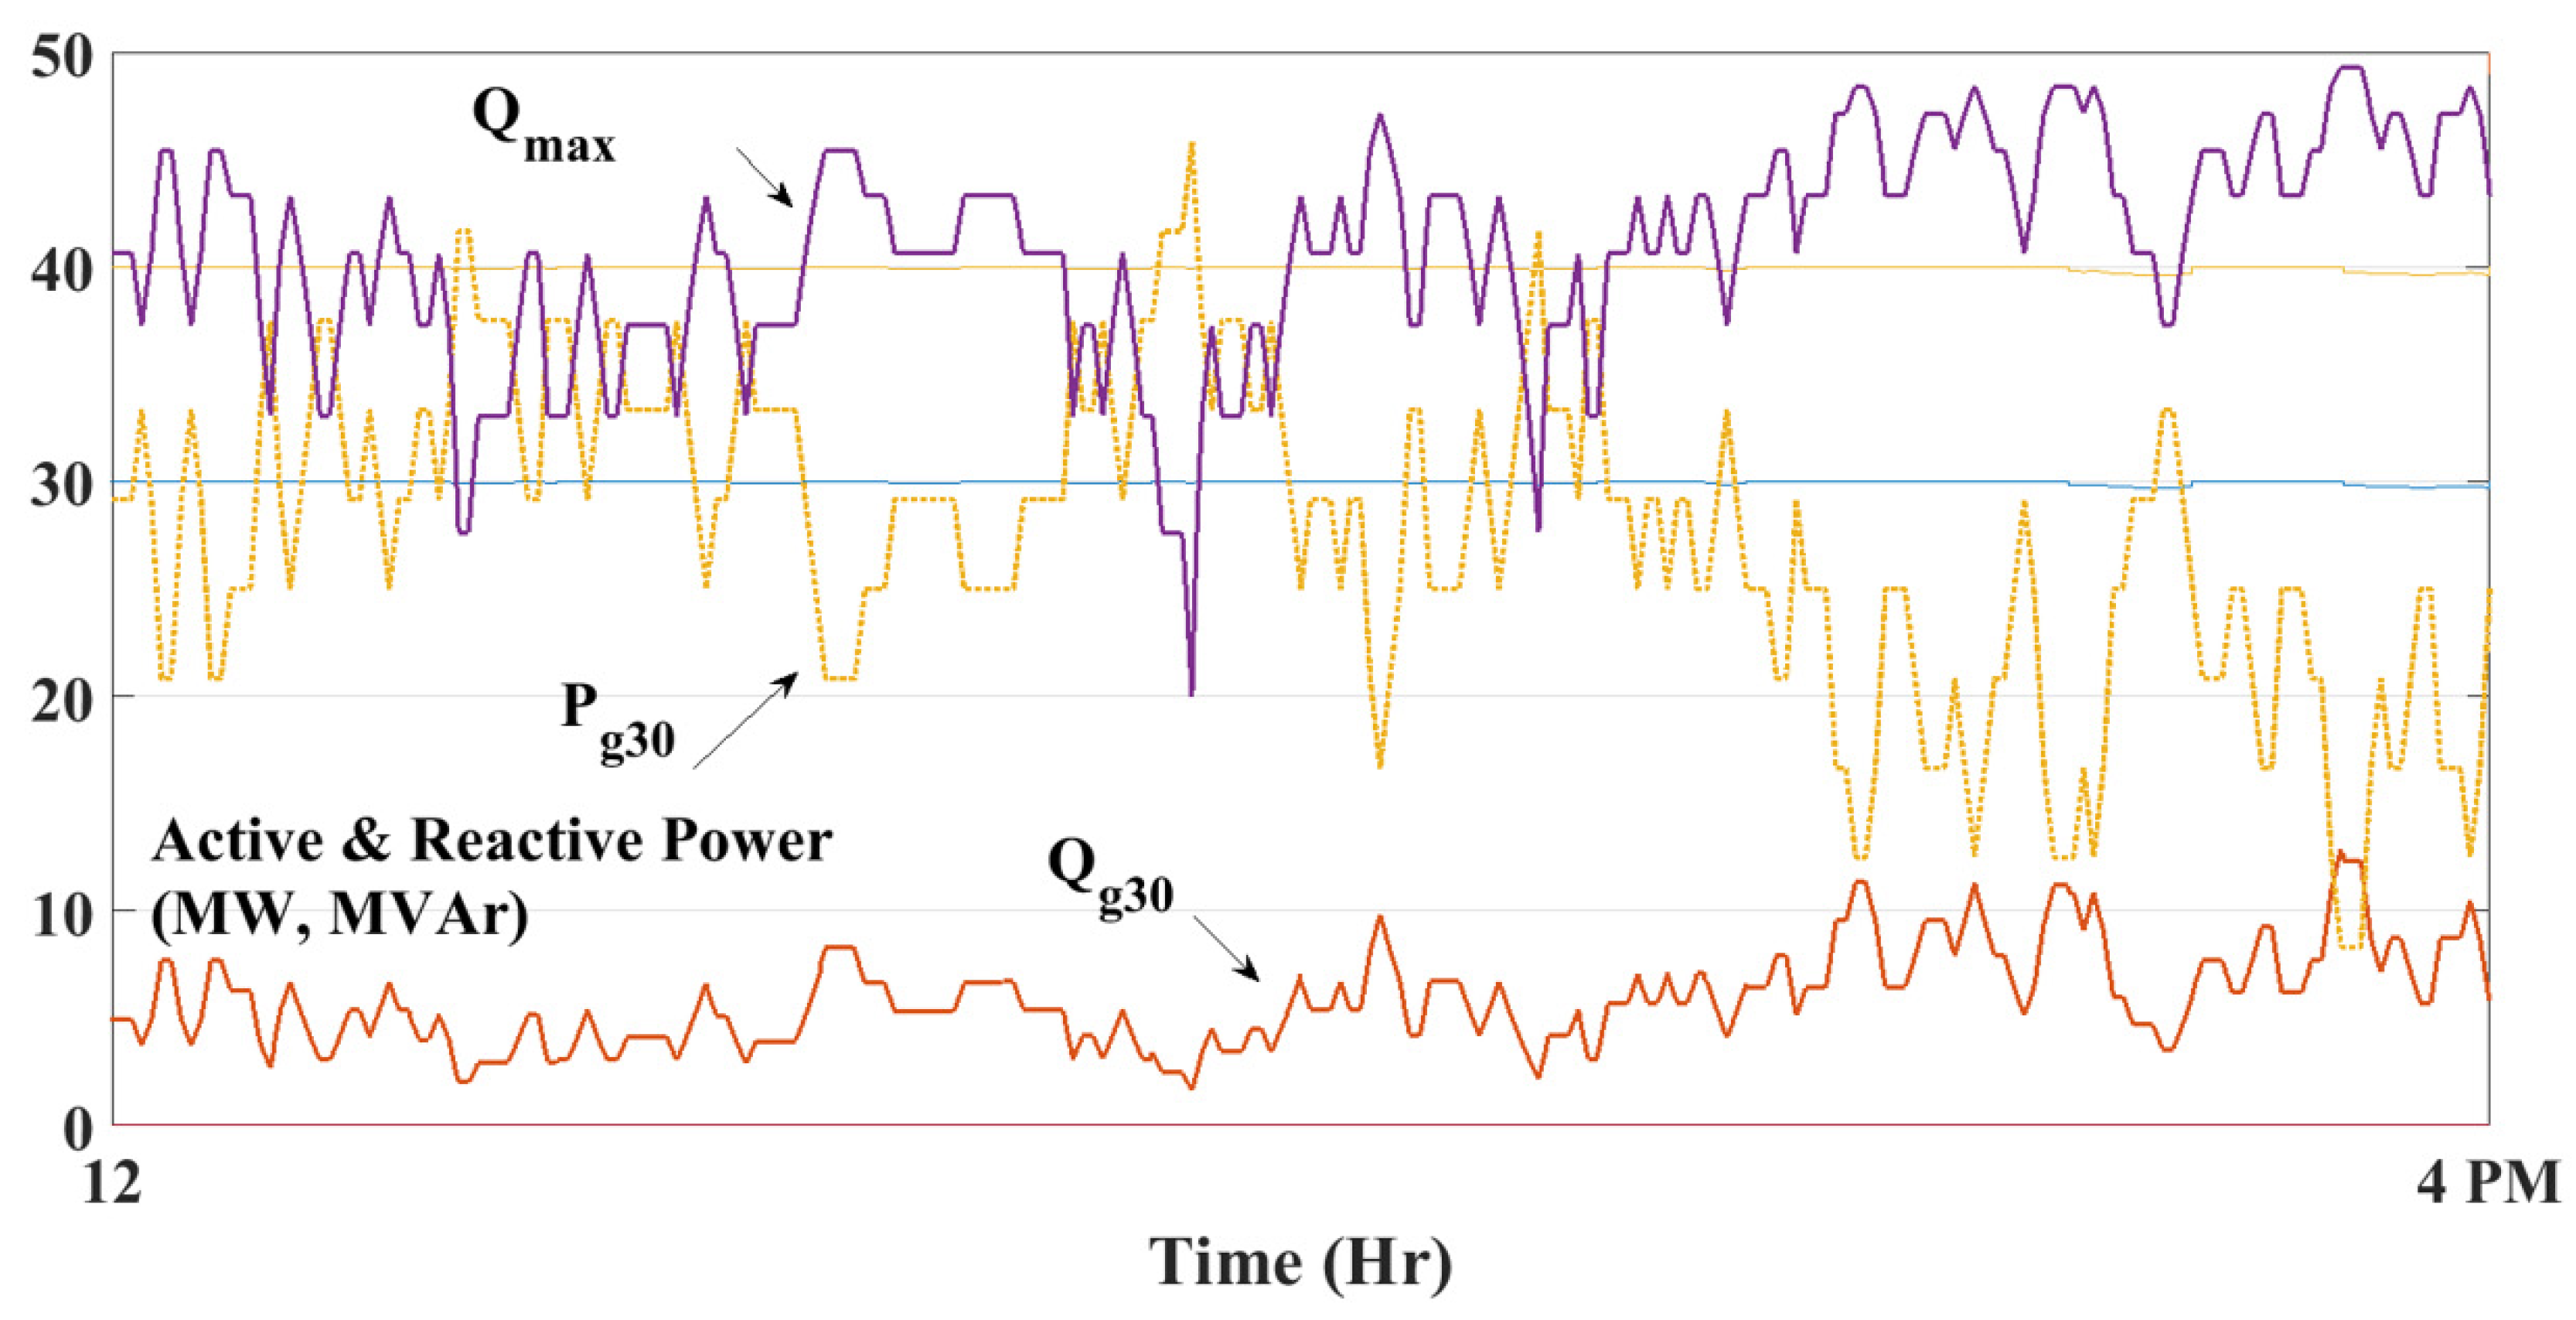
Case 3 System with 50 MW WPP: A higher penetration level is considered for the same system conditions as the above cases. The capacity of the WPP is taken to be 50 MW. The obtained results show that active power dispatch has been changed in the study system. Additionally, the available reactive power for compensation becomes visible for the grid size. Figure 12 shows both the active and the available reactive power for compensation from the WPP. Additionally, the figure exhibits the amount of reactive to be injected into the grid to regulate the voltage at node “30” and keep it at 1.06 p.u. In comparison to previous cases without or with a small power plant size, the results exhibited in Figure 13 show that the reactive power compensation mitigates the voltage at PCC and hence it could improve the overall grid voltage profile.

4.3.2. Distribution System Case Studies

The IEEE 123-node standard test feeder is selected to be used to present some selected case studies [54]. The feeder involves a mix of three-phase, two-phase, and single-phase line segments. It has four voltage regulators, various balanced and unbalanced spot loads, and four capacitor banks. In the proposed test, the load buses of the IEEE 123 feeders are classified into three categories according to load type viz. residential, industrial, and commercial. The WPP is assumed to be connected to the system at bus “67”. The size of the wind power plant is chosen to be 50% of the total load of the base case of the feeder.
Case 1 System without wind penetration: The base-case load of the IEEE 123 feeder is simulated using the Saudi load profile. Two scenarios have been simulated. In the first scenario, all voltage regulators are de-energized from the feeder. This scenario shows smooth voltage profile variations due to smooth changes in demand. This case shows that to keep the voltage profile time-series within the desired limit of V ± 5 % , voltage regulators should operate to adapt the variation of the load profiles along the day.
Case 2: System study with wind penetration: It is identical to Case 1 but with WPP. The voltage profile time series involves rapid fluctuations due to the intermittency of WPP. The voltages slightly increase and drop back as the wind power generations fluctuate. The result obtained from this case emphasizes the impact of wind power intermittency on electrical power systems. As the voltage regulators are energized, the time-series of the voltage profiles are improved and becomes closer to the allowable limits V ± 5 % . However, excessive operation of regulator taps could affect the age of the regulator and yet cannot completely handle the fast fluctuations of wind power generation.
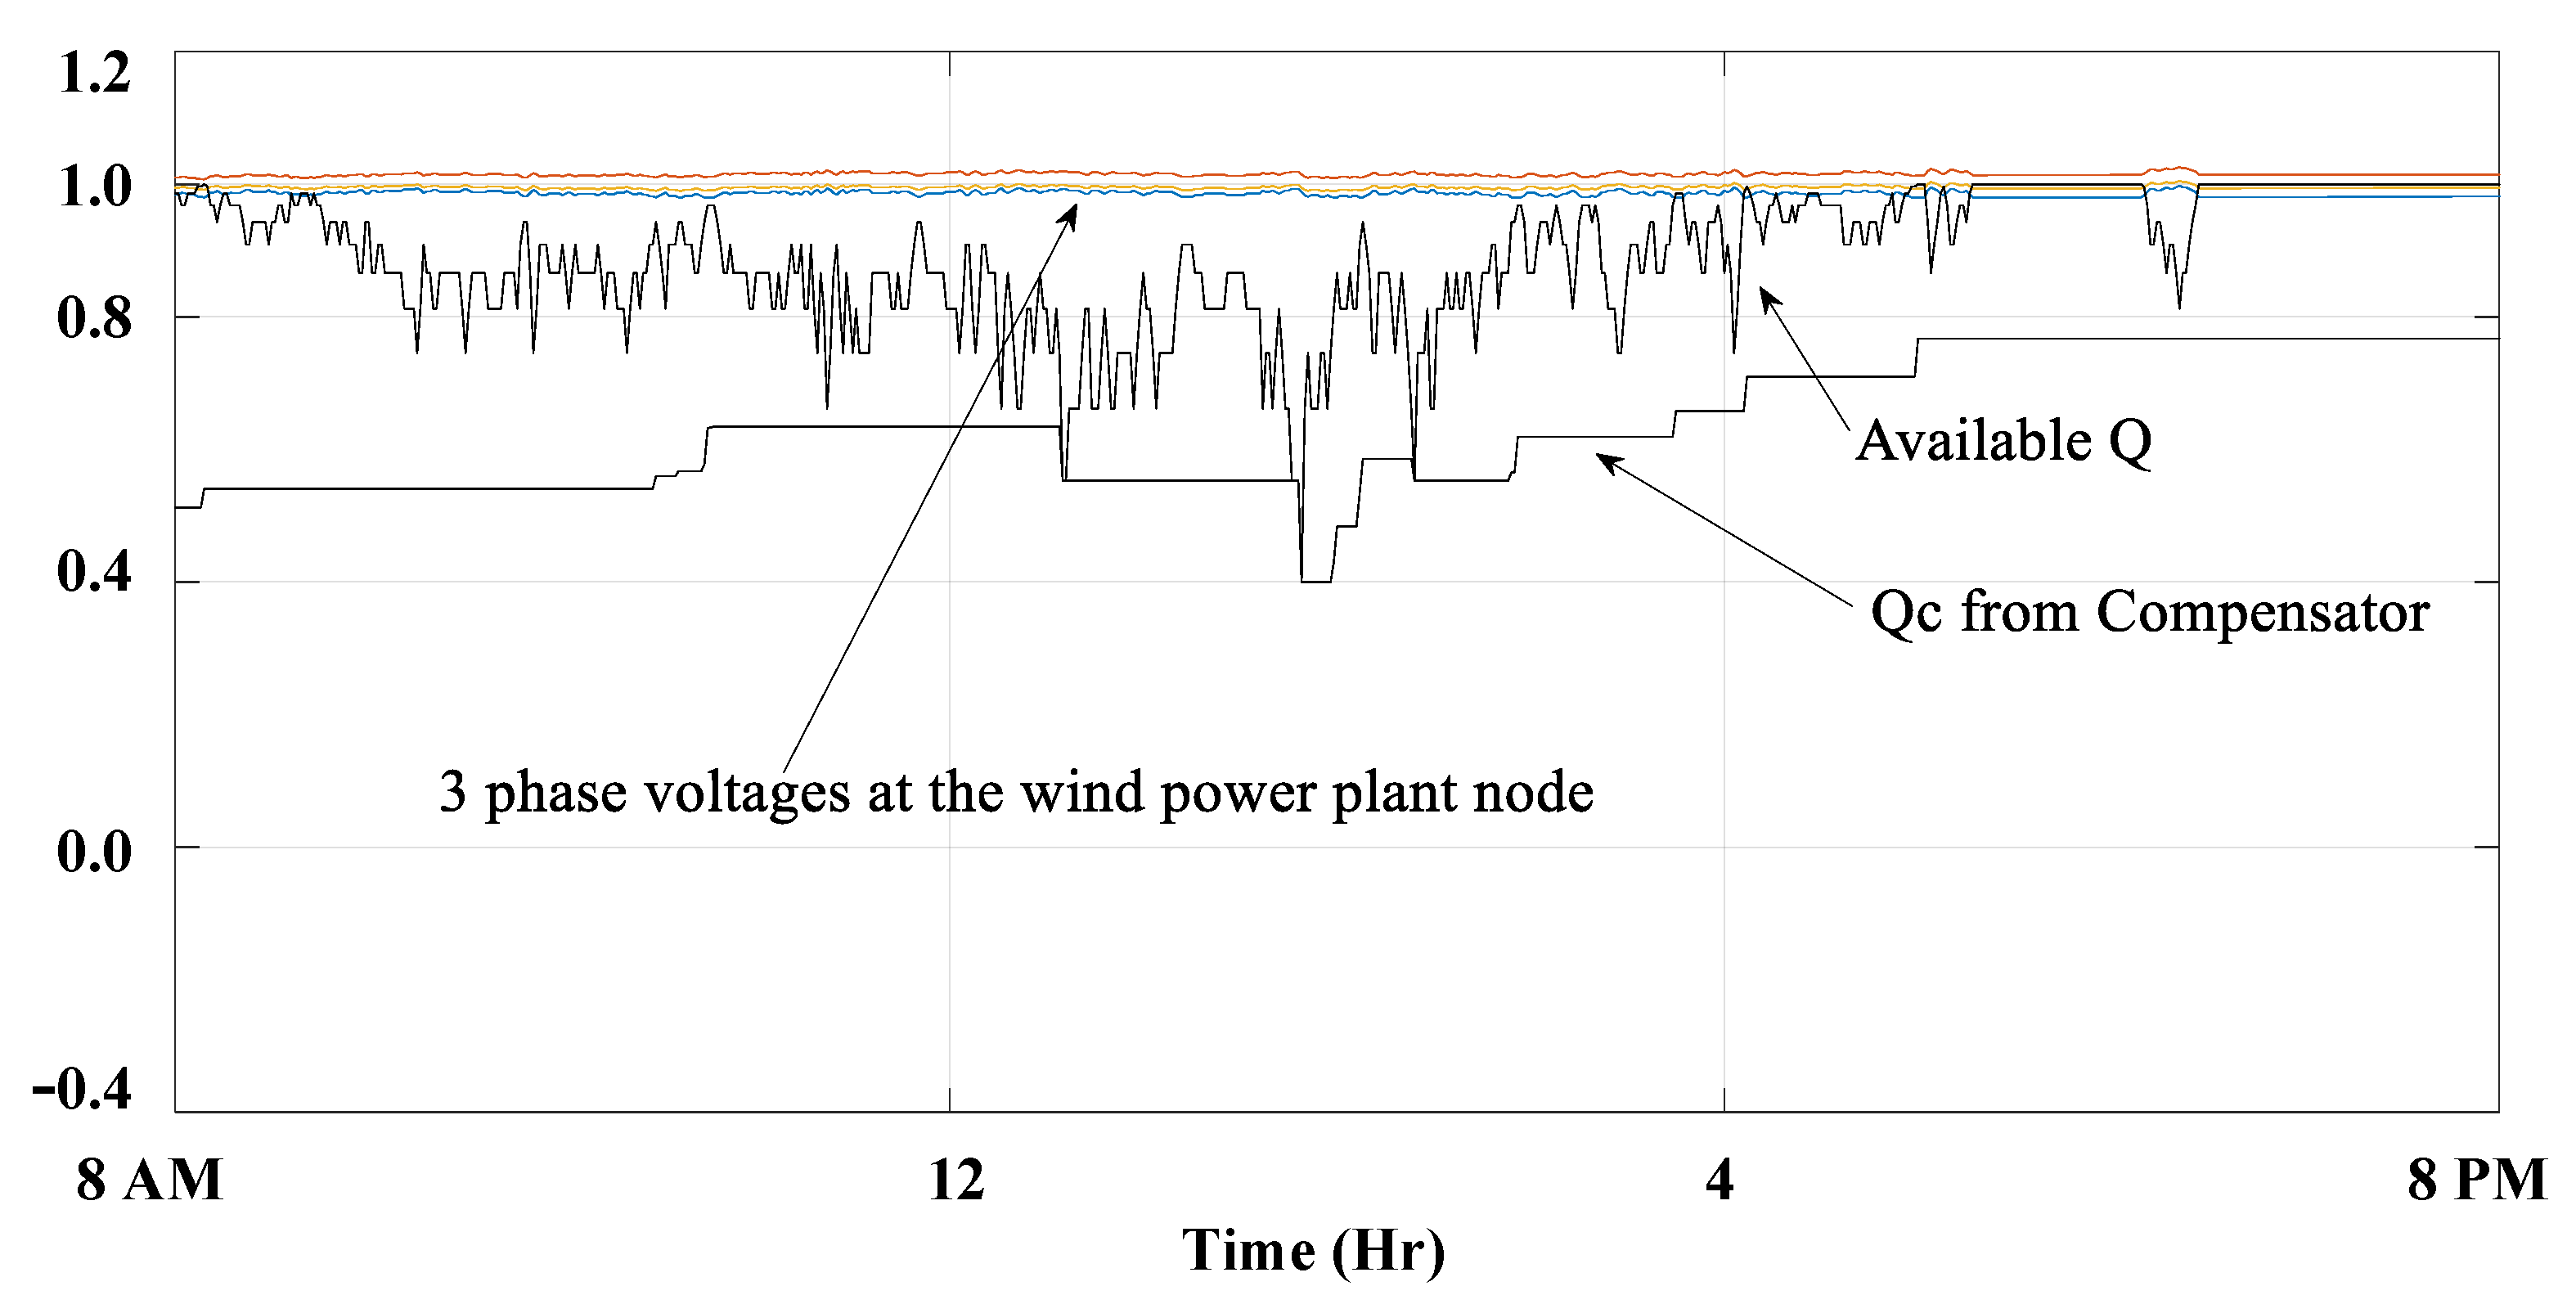
Case 3 System study with wind penetration and reactive power compensation: It is identical to case 2 but reactive power compensation is included. Firstly, regulators are de-energized, the reactive compensation successfully keeps the voltage within the limits V ± 5 % . Figure 14 shows that the changes in Q c so that the voltage is kept within its desired limit. The upper bound of Q c is the available reactive power Q from the power plant. The middle of the time axis of Figure 14 shows that as Q drops, hence, Q c drops instantaneously. Secondly, when regulators are included in the simulation, they keep the voltage profiles at a slightly higher level. This is due to the setting of the regulator and the delay time required for the regulator to operate. Along the simulation period, more tap movements are performed to keep the voltage within the allowable limits. In general, the intermittent nature of wind power affects the voltage and changes its profile from a smooth pattern to a much-fluctuated pattern.
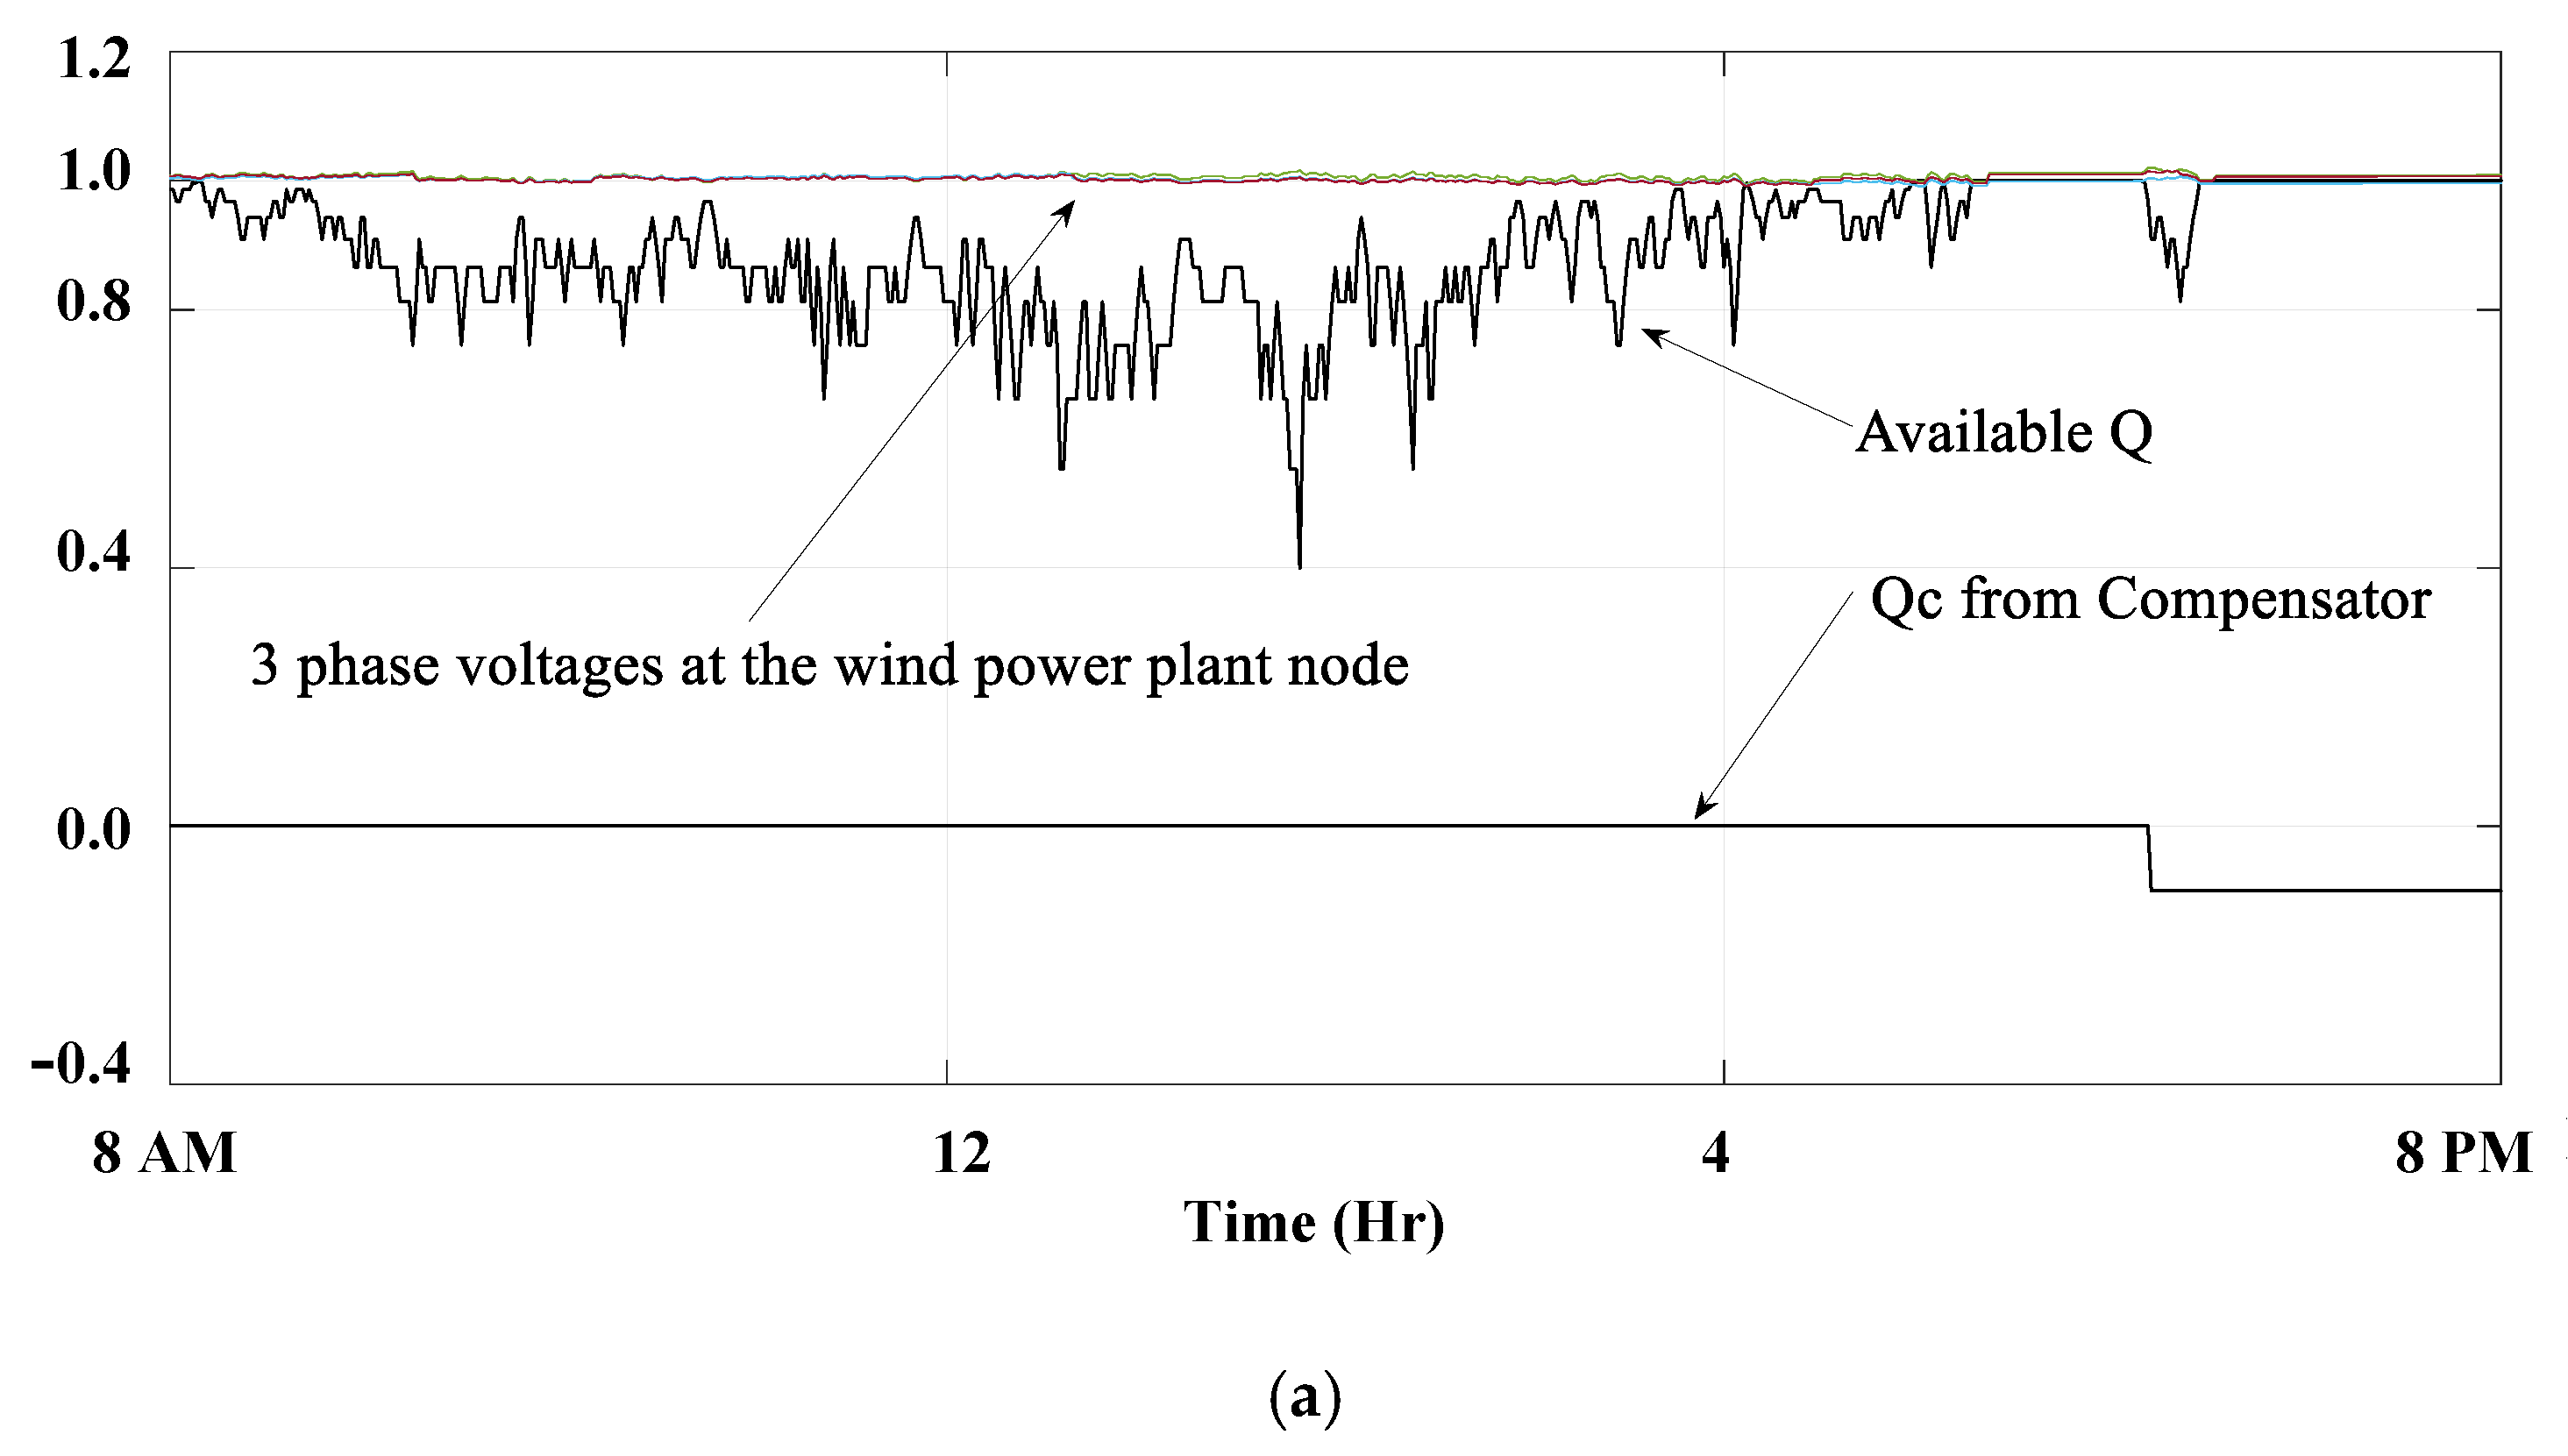
When the voltage magnitude of the regulated bus, at PCC, is within the allowable limits, the compensator will not provide additional Q c which is opposite to the regulators that are distributed along the feeder and sense different points in the grid. This is exhibited in Figure 15a which shows that Q c only appears beyond 6 PM whereas the voltage of the regulated bus drops. The amount of Q c is just enough to regulate the voltage of the PCC as shown in Figure 15a. Hence, the regulators continue to operate to regulate the remaining nodes in the study system.
Within the timescale of the simulated series, the regulators operate many times, as shown in Figure 15b, to control and keep the feeder voltages within the preset limits. However, these excessive movements could be avoided by maximizing the role of the reactive power compensation to mitigate the voltage fluctuations. When the reactive power control is enabled with all regulators de-energized, it successfully mitigates the voltage and keeps it within the desired limits. However, to increase the reliability of the compensator and guarantee the availability of Q c , the capacity of the inverter size should be higher than the capacity of the generator. The result shows that reactive power control can mitigate the voltage and increase the lifetime of voltage regulators by decreasing unnecessary tap movements.
It is important to mention herein that during implementing the above case studies, it is recognized that when the time step setting of the simulator is reduced, the reactive power compensation provides much better results in terms of smoothing the voltage fluctuations. This indicates that in the real operation of an inverter-based circuit that has a very fast time response, the reactive power compensation could provide a very smooth voltage profile in real-time. In this mitigation process, the only concern is the availability of the reactive power from the WPP which includes may be improved by increasing the size of the power electronics interface circuit. Additionally, implementing DR could eliminate fluctuations with proper control of both active and reactive power in distribution systems. This is currently under investigation and will be reported soon.

5. Conclusions and Future Work

This paper presents a brief overview of Saudi electricity consumption as well as the need for empowering renewable energy resources in the power grid. Saudi has an inductive grid due to the high use of air conditioning. Thus, this work presents the most common PQ issues in the grid due to the penetration of wind energy, namely voltage variation and harmonics. Several mitigation techniques such as DVR, STATCOM passive and active filters and inverters are discussed. However, a longer study is required to comprehensively account for wind energy integration into the Saudi electricity infrastructure. As a demonstration example for intermittent wind power supply, a typical summer load profile of a substation in Riyadh city is analyzed using the quasi-static time series simulator with a standard IEEE test systems. The IEEE 30-node is simulated to assess the role of reactive power of WPP in voltage mitigation. The results show that the larger WPP with reactive power capability could mitigate the voltage at the PCC of the WPP and hence improve the overall voltage profile of the study system. On the other hand, the analysis of radial distribution systems with WWP shows that the voltage regulators can keep the voltage profile within the allowable preset limits of the nominal voltages. However, regulators cannot eliminate the fluctuations in the voltage profile. Besides, excessive operation and movements of the regulator tap setting could affect the device’s lifetime. Reactive power compensation provides an efficient and fast control action due to inverter circuits. The amount of reactive power depends on the type and size of the interface circuit. The future research seeks for robust control and management of various power resources in a competitive power pool with demand-side mechanism and at the same time mitigate any resulting power quality issues accompanied by RES integration.

Author Contributions

Conceptualization, S.A.A.; methodology, S.A.A.; software, M.A.-A.; validation, M.A.-A.; formal analysis, S.A.A.; investigation, S.A.A.; writing—original draft preparation, S.A.A.; writing—review and editing, S.A.A. Both authors have read and agreed to the published version of the manuscript.

Funding

This research received no external funding.

Acknowledgments

Researchers would like to thank the Deanship of Scientific Research, Qassim University for funding publication of this project.

Conflicts of Interest

The authors declare no conflict of interest.

Abbreviations

ACAlternation Current
APFActive Power Filter
BSCFDBillion Standard Cubic Feet per Day
CSCCurrent Source Converter
DCDirect Current
DFIGDoubly Fed Induction Generators
DMSDistribution Management Systems
DRDemand Response
DVRDynamic Voltage Restorer
EMIElectromagnetic Interference
EMTElectromagnetic Transient
ESSEnergy Storage System
FACTsFlexible AC Transmission systems
FQSTSFast Quasi-static time-series
FSIGFixed Speed Induction Generator
HTFHarmonic Trap Filter
HVACHigh Voltage Alternating Current
HVDCHigh Voltage Direct Current
LCCLine Commutated Current
PCCPoint of Common Coupling
PCUPower Conditioning Unit
PLCPower Line Communication
PMSRoot Mean Square
PMSGPermanent Magnet Synchronous Generator
PQPower Quality
PWMPulse Width Modulation
RESRenewable Energy Systems
RLCCombination of Resistance/Inductor/Capacitor Circuit
STATCOMStatic Synchronous Compensator
TBFWThree-Bridge Four Wire Inverter
TDDTotal Demand Distortion
THDTotal Harmonic Distortion
VSCVoltage Source Converter
WFWind Farm
WPPWind Power Plant
WTGWind Turbine Generator
List of Symbols
c subscript refers to compensator
f subscript refers to final time
g subscript refers to generator
I current
I subscript refers to inverter capacity
I nodal current vector
i , j subscripts refers to counter serial
J branch current vector
k subscript refers to time sample counter
m , p superscript refers phase a, b, and c
n total number of a sample
Q reactive power
δ phase angle of a nodal voltage
0 subscript refers to initial time
S apparent power
P active power
s subscript refers to the width of the time sample
t time
V voltage magnitude of a nodal voltage
x refer to impendent variable in Lagrange’s equation
y refers to dependent variable in Lagrange’s equation
Z branch current impedance matrix

References

  1. Saudi Arabia Report; U.S. Energy Information Administration: Washington, DC, USA, 2013.
  2. Maqbool, E.A.; Malik, N.H. Demand response in Saudi Arabia. In Proceedings of the International Conference on Electric Power and Energy Conversion Systems, Sharjah, UAE, 15–17 November 2011; pp. 1–6. [Google Scholar]
  3. H1 2020 Earnings Conference Call. Saudi Electricity Company. Available online: https://bit.ly/3l40dj9 (accessed on 20 November 2020).
  4. Saudi Vision 2030. 2016. Available online: https://vision2030.gov.sa/en (accessed on 20 November 2020).
  5. Yamada, M. Vision 2030 and the Birth of Saudi Solar Energy; Middle East Institute: Washington, DC, USA, 2016. [Google Scholar]
  6. The Kingdom of Saudi Arabia National Renewable Energy Program. Ministry of Energy. Available online: https://bit.ly/35fmfet (accessed on 20 November 2020).
  7. Saudi Arabia National Renewable Energy Program. Ministry of Energy. Available online: https://bit.ly/2ZbZHrp (accessed on 20 November 2020).
  8. Mohamed, M.A.; Eltamaly, A.M.; Alolah, A.I. PSO-based smart grid application for sizing and optimization of hybrid renewable energy systems. PLoS ONE 2016, 11, e0159702. [Google Scholar] [CrossRef]
  9. Jabir, M.; Azil Illias, H.; Raza, S.; Mokhlis, H. Intermittent smoothing approaches for wind power output: A review. Energies 2017, 10, 1572. [Google Scholar] [CrossRef] [Green Version]
  10. Mohod, S.W.; Aware, M.V. A STATCOM-control scheme for grid connected wind energy system for power quality improvement. IEEE Syst. J. 2010, 4, 346–352. [Google Scholar] [CrossRef]
  11. Thiringer, T.; Petru, T.; Liljegren, C. Power quality impact of a sea located hybrid wind park. IEEE Trans. Energy Convers. 2001, 16, 123–127. [Google Scholar] [CrossRef]
  12. Chen, Z.; Spooner, E. Grid power quality with variable speed wind turbines. IEEE Trans. Energy Convers. 2001, 16, 148–154. [Google Scholar] [CrossRef]
  13. British Standards Institution. BS EN 50160: Voltage Characteristics of Electricity Supplied by Public Distribution Networks; British Standards Institution: London, UK, 2007. [Google Scholar]
  14. Ayodele, T.R.; Jimoh, A.; Munda, J.L.; Agee, J.T. Challenges of grid integration of wind power on power system grid integrity: A. review. World 2020, 3, 6. [Google Scholar]
  15. International Standard. Measurement and Assessment of Power Quality Characteristics of Grid Connected Wind Turbines; IEC 61400-21; CIE/IEC: Geneva, Switzerland, 2001. [Google Scholar]
  16. Nassif, A.B.; Xu, W. Passive harmonic filters for medium-voltage industrial systems: Practical considerations and topology analysis. In Proceedings of the 2007 39th North American Power Symposium, Las Cruces, NM, USA, 30 September–2 October 2007; pp. 301–307. [Google Scholar]
  17. Salam, Z.; Tan, P.C.; Jusoh, A. Harmonics mitigation using active power filter: A technological review. Elektr. J. Electr. Eng. 2006, 8, 17–26. [Google Scholar]
  18. Das, J. Passive filters-potentialities and limitations. IEEE Trans. Ind. Appl. 2004, 40, 232–241. [Google Scholar] [CrossRef]
  19. Orchi, T.F.; Hossain, M.J.; Pota, H.R.; Rahman, M.S. Voltage stability and power quality issues of wind farm with series compensation. In Proceedings of the 2013 IEEE Electrical Power & Energy Conference, Vancouver, BC, Canada, 21–25 July 2013; pp. 1–6. [Google Scholar]
  20. Dolan, D.S.; Lehn, P.W. Simulation model of wind turbine 3p torque oscillations due to wind shear and tower shadow. IEEE Trans. Energy Convers. 2006, 21, 717–724. [Google Scholar] [CrossRef]
  21. Preciado, V.; Madrigal, M.; Muljadi, E.; Gevorgian, V. Harmonics in a wind power plant. In Proceedings of the 2015 IEEE Power & Energy Society General Meeting, Denver, CO, USA, 26–30 July 2015; pp. 1–5. [Google Scholar]
  22. Mohod, S.W.; Aware, M.V. Power quality issues and its improvement in wind energy generation interface to grid system. MIT Int. J. Electr. Instrum. Eng. 2011, 1, 116–122. [Google Scholar]
  23. Wessels, C.; Fuchs, F.W. Concept and Performance of Voltage Swell Mitigation in Wind Farms with FACTS; Center of Excellence for Wind Energy: Schleswig Holstein, Germany, 2009; Volume 16, p. 2009. [Google Scholar]
  24. Shafiullah, G.M.; Oo, A.M.; Ali, A.B.; Stojcevski, A. Influences of wind energy integration into the distribution network. J. Wind Energy 2013, 2013, 1–21. [Google Scholar] [CrossRef] [Green Version]
  25. Dugan, R.C.; Mc Granaghan, M.F.; Santoso, S.; Beaty, H.W. Electric Power Systems Quality; McGraw-Hill: New York, NY, USA, 2004. [Google Scholar]
  26. Bollen, M.H. What is power quality? Electr. Power Syst. Res. 2003, 66, 5–14. [Google Scholar] [CrossRef]
  27. Muljadi, E.; Butterfield, C.P.; Chacon, J.; Romanowitz, H. Power quality aspects in a wind power plant. In Proceedings of the 2006 IEEE Power Engineering Society General Meeting, Montreal, QC, Canada, 18–22 June 2006; p. 8. [Google Scholar]
  28. Langella, R.; Testa, A.; Alii, E. IEEE Recommended Practice and Requirements for Harmonic Control in Electric Power Systems; IEEE: New York, NY, USA, 2014. [Google Scholar]
  29. Ellis, A.; Muljadi, E.; Sanchez-Gasca, J.; Kazachkov, Y. Generic models for simulation of wind power plants in bulk system planning studies. In Proceedings of the 2011 IEEE Power and Energy Society General Meeting, Detroit, MI, USA, 24–28 July 2011; pp. 1–8. [Google Scholar]
  30. Bollen, M.H.; Yao, L.; Rönnberg, S.K.; Wahlberg, M. Harmonic and interharmonic distortion due to a windpark. In Proceedings of the IEEE PES General Meeting, Minneapolis, MN, USA, 25–29 July 2010; pp. 1–6. [Google Scholar]
  31. Badrzadeh, B.; Gupta, M.; Singh, N.; Petersson, A.; Max, L.; Høgdahl, M. Power system harmonic analysis in wind power plants—Part I: Study methodology and techniques. In Proceedings of the 2012 IEEE Industry Applications Society Annual Meeting, Las Vegas, NV, USA, 7–11 October 2012; pp. 1–11. [Google Scholar]
  32. Yıldız, C.; Keçecioğlu, Ö.F.; Açıkgöz, H.; Gani, A.; Şekkeli, M. Power quality measurement and evaluation of a wind farm connected to distribution grid. Procedia Soc. Behav. Sci. 2015, 195, 2370–2375. [Google Scholar] [CrossRef] [Green Version]
  33. Wessels, C.; Gebhardt, F.; Fuchs, F.W. Dynamic voltage restorer to allow LVRT for a DFIG wind turbine. In Proceedings of the 2010 IEEE International Symposium on Industrial Electronics, Bari, Italy, 4–7 July 2010; pp. 803–808. [Google Scholar]
  34. Díaz González, F.; Martínez Rojas, M.; Sumper, A.; Gomis Bellmunt, O. Strategies for reactive power control in wind farms with STATCOM. In Proceedings of the EPE Wind Energy Chapter Symposium, Stafford, UK, 15–16 April 2010; pp. 1–10. [Google Scholar]
  35. Tascikaraoglu, A.; Uzunoglu, M.; Vural, B.; Erdinc, O. Power quality assessment of wind turbines and comparison with conventional legal regulations: A case study in Turkey. Appl. Energy 2011, 88, 1864–1872, 2011. [Google Scholar] [CrossRef]
  36. Shyam, B.; Raj, A.B.; Thomas, P.C. A novel Wind Energy Conversion System with power quality improvement features. In Proceedings of the ISGT2011-India, Bangalore, India, 1–3 December 2011; pp. 84–88. [Google Scholar]
  37. Ali, M.H. Wind Energy Systems: Solutions for Power Quality and Stabilization; CRC Press: Boca Raton, FL, USA, 2012. [Google Scholar]
  38. Aly, M.M.; Abdel-Akher, M.; Said, S.M.; Senjyu, T. A developed control strategy for mitigating wind power generation transients using superconducting magnetic energy storage with reactive power support. Int. J. Electr. Power Energy Syst. 2016, 83, 485–494. [Google Scholar] [CrossRef]
  39. Carrasco, J.M.; Franquelo, L.G.; Bialasiewicz, J.T.; Galván, E.; PortilloGuisado, R.C.; Prats, M.M.; León, J.I.; Moreno-Alfonso, N. Power-electronic systems for the grid integration of renewable energy sources: A survey. IEEE Trans. Ind. Electron. 2006, 53, 1002–1016. [Google Scholar] [CrossRef]
  40. Aly, M.M.; Abdel-Akher, M.; Ziadi, Z.; Senjyu, T. Assessment of reactive power contribution of photovoltaic energy systems on voltage profile and stability of distribution systems. Int. J. Electr. Power Energy Syst. 2014, 61, 665–672. [Google Scholar] [CrossRef]
  41. Abdel-Warth, M.A.; Abdel-Akher, M.; Aly, M.M. Quasi-Static Time-Series Simulation of Congested Power Systems with Wind Power Plant. In Proceedings of the 17th International Middle-East Power System Conference MEPCON’2015, Al Mansoura, Egypt, 15–17 December 2015. [Google Scholar]
  42. Abdel-Warth, M.; Abdel-Akher, M.; Aly, M.M.; Eid, A. Quasi-Static Time-Series Analysis of Congested Transmission Networks with Intermittent Wind Power Penetration. Int. Rev. Electr. Eng. (IREE) 2017, 12, 237–249. [Google Scholar] [CrossRef]
  43. Abdel-Warth, M.A.; Abdel-Akher, M.; Eid, A.; Aly, M.M. Deployment and control of PHEVs in electrical power systems with wind power penetration. In Proceedings of the Power Systems Conference (MEPCON), 2016 Eighteenth International Middle East, Cairo, Egypt, 27–29 December 2016; pp. 735–740. [Google Scholar]
  44. Abdel-Akher, M.; Selim, A.; Aly, M.M. Initialised load-flow analysis based on Lagrange polynomial approximation for efficient quasi-static time-series simulation. IET Gener. Transm. Distrib. 2015, 9, 2768–2774. [Google Scholar] [CrossRef]
  45. Chapra, S.C.; Canale, R.P. Numerical Methods for Engineers; McGraw-Hill: New York, NY, USA, 2012. [Google Scholar]
  46. Selim, A.; Abdel-Akher, M.; Kamel, S.; Aly, M.M. A Developed Approach Based on Lagrange Linear Prediction for Time-series Power-flow Simulation. Electr. Power Compon. Syst. 2018, 46, 1312–1320. [Google Scholar] [CrossRef]
  47. Selim, A.; Abdel-Akher, M.; Aly, M.M.; Kamel, S.; Senjyu, T. Fast quasi-static time-series analysis and reactive power control of unbalanced distribution systems. Int. Trans. Electr. Energy Syst. 2019, 29, e2673. [Google Scholar] [CrossRef] [Green Version]
  48. Abdel-Akher, M. Voltage stability analysis of unbalanced distribution systems using backward/forward sweep load-flow analysis method with secant predictor. IET Gener. Transm. Distrib. 2013, 7, 309–317. [Google Scholar] [CrossRef]
  49. Selim, A.; Abdel-Akher, M.; Aly, M.M. Plug-in hybrid electric vehicles aggregation and real-time active power control simulation analysis in distribution systems. In Proceedings of the Power Systems Conference (MEPCON), 2016 Eighteenth International Middle East, Cairo, Egypt, 27–29 December 2016; pp. 723–728. [Google Scholar]
  50. Selim, A.; Abdel-Akher, M.; Aly, M.M.; Kamel, S. Efficient time series simulation of distribution systems with voltage regulation and PV penetration. In Proceedings of the Power Systems Conference (MEPCON), 2016 Eighteenth International Middle East, Cairo, Egypt, 27–29 December 2016; pp. 717–722. [Google Scholar]
  51. Abdel-Akher, M.; Mahmoud, K. Unbalanced distribution power-flow model and analysis of wind turbine generating systems. Int. Trans. Electr. Energy Syst. 2013, 23, 689–700. [Google Scholar] [CrossRef]
  52. Aly, M.M.; Abdel-Akher, M. A robust quasi-direct continuous power-flow analysis using two-bus equivalents for voltage stability analysis of radial distribution systems. Electr. Eng. 2018, 100, 47–57. [Google Scholar] [CrossRef]
  53. Aly, M.M.; Abdelkarim, E.; Abdel-Akher, M. Mitigation of photovoltaic power generation fluctuations using plug-in hybrid electric vehicles storage batteries. Int. Trans. Electr. Energy Syst. 2015, 25, 3720–3737. [Google Scholar] [CrossRef]
  54. Kersting, W.H. Radial distribution test feeders. In Proceedings of the Power Engineering Society Winter Meeting, Columbus, OH, USA, 28 January–1 February 2001; Volume 2, pp. 908–912. [Google Scholar]
  55. Faruqui, A.; Hledik, R.; Wikler, G.; Ghosh, D.; Prijyanonda, J.; Dayal, N. Bringing Demand-Side Management to the Kingdom of Saudi Arabia; The Brattle Group: Boston, MA, USA, 2011. [Google Scholar]
  56. Power Flow Test Cases. Available online: https://labs.ece.uw.edu/pstca/ (accessed on 3 December 2020).
  57. Cheng, W.; Cheng, R.; Shi, J.; Zhang, C.; Sun, G.; Hua, D. Interval Power Flow Analysis Considering Interval Output of Wind Farms through Affine Arithmetic and Optimizing-Scenarios Method. Energies 2018, 11, 3176. [Google Scholar] [CrossRef] [Green Version]
Figure 1. Regional sites of wind turbines in Saudi Arabia.
Applsci 10 08852 g001
Figure 2. Reactive power compensation of inverter-based WECS.
Applsci 10 08852 g002
Figure 3. Reactive power control capability of inverter-based energy systems.
Applsci 10 08852 g003
Figure 4. Possible compensation alternatives for available reactive power from the inverter Q i .
Applsci 10 08852 g004
Figure 5. Fast QSTS time-series grid simulator.
Applsci 10 08852 g005
Figure 6. Normalized load profiles of a substation located in Riyadh city.
Applsci 10 08852 g006
Figure 7. Intermittent wind power generation profile.
Applsci 10 08852 g007
Figure 8. The IEEE-30 node standard test feeder with WPP at node ‘30’ [56].
Applsci 10 08852 g008
Figure 9. The voltage of the generator nodes of the IEEE 30-node and the voltage at node “30” which is a potential candidate to install a non-dispatchable wind farm.
Applsci 10 08852 g009
Figure 10. The voltage of the voltage-controlled nodes of the IEEE 30-node including a non-dispatchable 10 MW wind farm located at node “30”.
Applsci 10 08852 g010
Figure 11. Reactive power generation from synchronous machines and the non-dispatchable 10 MW wind farm.
Applsci 10 08852 g011
Figure 12. Active and reactive power generation of a 50 MW wind farm located at bus “30” of the IEEE 30-node.
Applsci 10 08852 g012
Figure 13. Voltage profiles at PCC for a WPP with reactive power compensation capability, the WPP is connected at the node “30” of the IEEE 30-node.
Applsci 10 08852 g013
Figure 14. The phase voltages (p.u.), the available reactive from the WPP Q (p.u.), and reactive power compensation Q c (p.u.) when the regulators are de-energized.
Applsci 10 08852 g014
Figure 15. The reactive power compensation and voltage regulator action of Case 3: (a) The pu phase voltages, the available reactive from the WECS Q , and reactive power compensation Q c (b) Tap changes operation.
Applsci 10 08852 g015aApplsci 10 08852 g015b
Publisher’s Note: MDPI stays neutral with regard to jurisdictional claims in published maps and institutional affiliations.