Article

Floating Offshore Wind Farms in Italy beyond 2030 and beyond 2060: Preliminary Results of a Techno-Economic Assessment

1
RSE Ricerca sul Sistema Energetico S.p.A., via Rubattino 54, 20134 Milan, Italy
2
Department of Earth and Environmental Sciences—DISAT, University of Milano-Bicocca, Piazza dell’Ateneo Nuovo 1, 20126 Milan, Italy
*
Author to whom correspondence should be addressed.
Appl. Sci. 2020, 10(24), 8899; https://doi.org/10.3390/app10248899
Submission received: 22 October 2020 / Revised: 27 November 2020 / Accepted: 4 December 2020 / Published: 13 December 2020
(This article belongs to the Collection Wind Energy: Current Challenges and Future Perspectives)

Abstract

:
At the end of 2019, 10.5 GW of wind capacity was installed in Italy, all onshore. The National Integrated Climate and Energy Plan sets a target of 18.4 GW of onshore wind capacity and 0.9 GW of offshore wind capacity by 2030. Significant exploitation of offshore wind resources in Italy is expected after 2030, using floating wind turbines, suitable for water depths greater than 50 m. This technology is at the demonstration phase at present. Results of a preliminary techno-economic assessment of floating wind plants in Italian marine areas in a medium (2030) and long-term (2060) scenario are presented. In 2030, a reference park with 10 MW wind turbines will be defined, and parametric costs, depending on distance from shore, were assessed. In 2060, possible wind resource variations due to climate change, and cost reductions due to large diffusion of the technology were considered in three case studies. The economic model used was the simple Levelized Cost of Energy (sLCoE). Different values of Weighted Average Cost of Capital (WACC) were considered too. The results show LCoEs comparable to the ones expected for the sector in 2030. In 2060, even in the more pessimistic scenario, wind resource decreases will be abundantly compensated by expected cost reductions.

1. Introduction

It is now universally recognized that global warming and related climate changes are caused by anthropogenic emissions of climate-altering gases into the atmosphere. In order to contain the increase in global temperatures to below 1.5 °C, compared to pre-industrial levels, incisive measures must be quickly adopted. Following the Paris Agreement (COP21, 2015), many countries have committed to reducing emissions and various initiatives are already in place to encourage the so-called decarbonization of the various sectors. Approximately one-third of emissions is generated by electricity production, where decarbonization is strictly related to the increasingly massive energy production from renewable sources. The European Commission is one of the main players in this transition, setting ambitious and binding renewable targets for its member states. At the European level, a target of 20% and 32% renewable energy on gross final consumption was set at 2020 (Directive 2009/28/EC) and at 2030 (Directive REDII), respectively, and then was broken down into specific targets for each member state. One of the most widespread renewables installed in Europe at the end of 2019 was wind power [1], with a significant growth rate, because Europe still holds technological leadership in the wind energy sector.
Wind installation transition from land to sea is due to several different factors: the land sites suitable for sustainable exploitation of wind from economic, environmental, and social resources are gradually decreasing. Offshore wind resources are generally higher and less turbulent than onshore ones. Visual impact, as long as you move far enough from the coast, is reduced; it is possible to revitalize the offshore industrial sector and the ports, currently in decline in many European regions, and to create jobs in the frame of a “blue” and “green” economy. One of the challenges related to offshore wind installation is the higher cost compared to land-based ones, which, until a few years ago, was not completely compensated by the higher energy production. In recent years, costs significantly reduced because of technological research in the sector and of a scale economy. In 2019, the average electricity cost from offshore wind plants winning the auctions in Europe was in the order of 50 €/MWh, competitive with the land-based one [2]. Another challenge concerns the turbine foundations. Offshore wind turbines are installed on foundations where technology is borrowed from the oil and gas sector. As far as fixed foundations are concerned, the solutions are mature: monopiles are used, up to 30 m water depth, while jackets or tripods are used from 30 to 50–60 m water depth. Over 60 m water depth: floating platforms are the suitable technology; however, floating wind turbines are currently at the demonstration stage. There is still no consensus about the buoyancy design (single-column, semi-submerged, tension leg platform), the material (steel or concrete), and a number of other features. The two most advanced systems are Hywind, a ballasted monocolumn produced by Equinor (former SINTEF), and Windfloat, the semi-submersible platform produced by Principle Power. These are the only two solutions that reached the array level demonstration phase at present [3,4,5].
Concerning Europe, at the end of 2019, 183 GW of onshore wind power capacity and 22 GW of offshore wind power capacity were installed [6]—almost all in the North Sea. Offshore wind capacity growth in 2019 was equal to 3.6 GW [2]. The European Community expects to install 450 GW of offshore wind by 2050 [7].
Concerning Italy, the wind power capacity installed at the end of 2019 was equal to 10.5 GW, all onshore, mainly distributed in the major islands and in the southern regions, where the wind resource is higher. In 2019, the percentage of wind production on the total energy demand was 6.3% [8]. The National Integrated Climate and Energy Plan, published in 2019, foresees a significant growth in the onshore wind capacity by 2030, with a target of 18.4 GW, and a cautious starting of the offshore wind sector with a target of 0.9 GW—corresponding to approximately two-three offshore wind farms of the present average size. This “cautious” target is due to two main factors. The first is that most of Italy’s offshore wind potential corresponds to marine areas with deep waters, where there is, at present, no commercial technology available for the installation. The second is that the offshore wind resource is, on average, lower than the northern Europe seas and oceans. Both of these factors question the economic sustainability of future floating wind initiatives in Italy.
The purpose of this study was to conduct a technical-economic analysis regarding future floating offshore wind installations in Italy. The uncertainty factors in this analysis were high, mainly due to the lack of in-field data about the costs of construction, installation, and maintenance of such plants, and to the high uncertainty of the assessment of the offshore wind resources due to the lack of (long-term) direct measures. However, understanding in advance the factors affecting the economic sustainability of floating wind plants in Italy is quite important to plan future development and to eventually anticipate the design of support measures. The performed analysis was based on similar studies conducted by authors in the past [9,10], and available in the literature for other geographical areas [11,12,13]. Two scenarios were considered: the first scenario starts from 2030; according to Italy’s 2030 offshore wind target, the majority of offshore wind development in Italy is expected beyond 2030. At this time, on the basis of International Renewable Energy Agency (IRENA) assumptions [14], the floating offshore wind technology is considered fully commercial. For the second scenario, the authors went so far as to analyze a second generation of floating wind farms, starting from 2060. In this scenario, cost reductions due to a probable widespread diffusion of these types of plants, and possible variations of the wind resources due to climate change, were considered. Regarding the estimation of this last parameter, there is an uncertainty due to the different approaches and models through which its prediction is performed. A conservative approach was chosen considering the higher negative variations in three offshore areas in Italy (Sicily, Sardinia, and Apulia).
The economic model chosen to perform the analysis is the Levelized Cost of Energy (LCoE). This parameter, albeit with limitations, is still one of the most used to conduct comparative economic analyses among different technologies or among different scenarios inside the same technology, such as those presented here. LCoE depends on both the total costs and the energy production throughout the life of the plant. The costs themselves are dependent on many factors: in this study, as a first approximation, they were parameterized as a function of the distance from shore. The costs also depend on water depth. Going farther from the coast usually means meeting higher water depth; however, the relationship is strongly affected from the bathymetry shape, and is very different from area-to-area, and even from site-to-site. In this study, the water depth is considered fixed. Another assumption was to consider average costs for different technologies. This is mainly because the complete sets of inputs needed for the evaluation were not available for different technologies. Moreover, there is no consensus in the literature about the cost differences among technologies. The costs assumed in this study refer to an average between monocolumn and semi-submersible platform. Different energy production (or capacity factor) values were also chosen representing different geographical offshore areas in Italy. Finally, the LCoE depends on financial parameters. A range of value for the Weighted Average Cost of Capital (WACC) parameter was considered representing, substantially, different degrees of confidence from the investors.
The study did not compare directly the results of LCoE with future electricity selling prices. The electricity market is facing a radical change in the future, including the gradual disappearing of renewable incentive mechanisms. Therefore, it is a very big issue to assess the future electricity prices, until almost the end of this century, as required by the time framing considered in this study. However, some considerations are reported at the end of the paper.
The results of this study could represent one of the most important pieces of information to be combined with, for example, environmental and regulatory ones, to perform a more realistic assessment of the offshore wind potential in Italy.

2. Techno-Economic Analysis at 2030

2.1. Materials and Methods

The model chosen to perform the economic analysis is the LCoE, an economic index widely used in the energy sector to estimate the average cost of energy produced during the entire lifetime of a given plant, and which considers the investment, financing, and operation and maintenance costs of a plant at all stages of its life cycle, in ratio to the total energy production guaranteed by it over the same period of time. More precisely, in the context of this study, an LCoE model that allows comparisons to be made without evaluating the specific financial variations over the various years, proposed by the U.S. National Renewable Energy Laboratory (NREL) [15], was adopted. This model is simply called LCoE, but still reported as LCoE in the following. The LCoE is calculated with the following formula:
LCoE = {(CAPEX × CRF + fixed OPEX)/(8760 × CF)} + variable OPEX
where: CAPEX (M€/MW) is the CAPital Expenditure, specific investment costs valued in the “overnight capital cost” method; CRF (pure number) is the Capital Recovery Factor; fixed OPEX (M€/MW/y) is the Operational Expenditure, the annual fixed maintenance and operating costs; CF (%), or Capacity Factor, is the percentage of the annual hours in which the plant produced at maximum power; variable OPEX (M€/MWh) are the annual variable maintenance and operating costs. All of these parameters, which define the variability of the LCoE, are influenced by a variety of different factors. In the first approach presented here, the study considers some of the factors that may be relevant to compare, in terms of electricity cost, different geographical areas in Italy, and the Italian context with other European ones.
The first step of the study was to define a reference offshore floating wind park at 2030. In this study, this park was defined starting from the average characteristics of the offshore wind parks with fixed monopile foundations installed in 2019 in the North Sea [2], and taking into account possible technology development, in particular, concerning the size of the wind turbine. The 10 MW DTU (Danmarks Tekniske Universitet) reference turbine described in [16] was chosen.
The reference park features are listed below:
  • The park is constituted by 100 turbines for an overall size of 1000 MW;
  • The hub height of the turbines is 119 m;
  • The water depth is 150 m;
  • The lifetime of the plant is 30 years.
As already mentioned above, considering that there are still no commercial floating offshore wind farms, all considerations relating to input parameters are affected by a certain degree of uncertainty that is common to all the research in the sector.
CAPEX is one of the variables that most affects the calculation of the LCoE: its economic value is derived from the sum of a whole series of factors that contribute to the definition of costs related to the purchase, installation, and implementation of all the components that make up a system. As already mentioned above, CAPEX are parametrized as a function of the distance from shore, concerning installation, operation, maintenabnce and the cost of external cables for the grid connection to the shore. A reference base CAPEX value, which includes the cost of export cables and their installation, was first obtained from an average of the two values reported in [11,17], and it is 2.4 M€/MW. The cost of export cables, including installation, commissioning, and maintenance, was conservatively fixed at 1 M€/km [18]; while the specific costs of cables and installation was calculated as an average of the two formulas reported in [19] for the two technologies considered. The resulting formula for the installation cost (CI) used in the study is the following one
CI = 0.300637678 + 1.10606 × 10⁻⁵ × wd + 0.000585152 × d
where: wd is the depth (m) and d is the distance from the coast (km). Calculating the contribution of these two costs for the reference parks in [11,17], subtracting them from the average CAPEX and rounding, the base value of CAPEX for this study was fixed at 2 M€/MW.
Distance from shore of 10 to 200 km are considered. However, water depth in most of the Italian marine areas with high wind resources reach 1000 m (the present limit for the installation of floating wind turbines, according to the developers [11] within 50 km). The range 50–200 km refer to northern European seas.
OPEX, “Operation and Maintenance” costs, depends on a number of variables, and by their variations as a function of additional parameters. Since there is no experience in the field of floating offshore wind technologies, except for relatively short periods and only in relation to demonstrators, it is very difficult to produce estimates of this parameter. Sector studies usually refer to the values for offshore wind on fixed foundations, which are now known and are estimated within the range of 115–131 k €/MW/y [17]. In this study, a very simple relationship was sought for the parameterization of the OPEX as a function of the distance from the coast: they are considered as a percentage of the overall CAPEX. In particular, a value of 5% was chosen, considering literature values, and from authors experienced in the offshore renewable field [20].
For the determination of the possible CF values in Italian marine areas, a web atlas developed in 2007 by Ricerca sul Sistema Energetico (RSE), called ATLAEOLICO [21], was used. This tool shows, in an interactive system, the average annual wind speed and the production associated within Italian land and sea areas. The specific production was calculated in equivalent hours, considering the average annual wind speed and the power curve of a reference turbine with average commercial characteristics. Reference to atlas maps requires consideration of the following factors:
  • With regards to the speed maps, data relating to offshore areas appear to be affected by great uncertainty: the measurements used for the calibration of the offshore maps of the atlas are few and almost all from satellite;
  • The maps may be slightly underestimated;
  • The offshore wind turbine technology has greatly evolved from 2007 to today;
  • The specific production reported in the atlas refer to gross specific production: this means that it does not consider the losses due to aerodynamic interference between the turbines of the same fleet, the network losses, or those due to machine downtime, while the CF used in the calculation of the LCoE refers to net production;
  • The maximum height of the maps is 100 m above sea level, while the hub height of the reference turbines is around 120 m.
In order to evaluate the increase of available energy per unit of area between 100 and 120 m, first, the “wind shear” law [22], expressed by the following formula, has been applied to calculate the ratio between the wind speed 120 m and 100 m a.s.l.
v z v z 0 = ( z z 0 ) α
where vz and vz0 are the wind speeds respectively at the height z and z0 a.t.l./a.s.l. and α is an empirically coefficient, called wind shear coefficient or friction coefficient, which takes into account the stability of the atmosphere, the roughness, and morphology of the terrain/sea and the wind speed—α = 0.11 is the standard value for offshore areas.
According to the fact that the available wind energy is proportional to the third power of the wind speed, the ratio of the available energy at 120 m and 100 m has been calculated applying the third power to the found ratio. The result is that the available energy at 120 m is 6.2% higher than the one at 100 m. Considering that 6.2% found value is comparable to the energy losses of an offshore wind park, the ATLAEOLICO gross specific production map (measured in equivalent hours) at 100 m a.s.l. has been assumed as the net specific production map at 120 m a.s.l. Table 1 shows the correspondence between the ATLAEOLICO specific production map values and the CF values considered in the LCoE calculation.
According to the map shown in Figure 1, CF value between 25% and 45% represent different marine areas in Italy, while the two more values 50% and 55% are also considered in the calculation to represent the northern Europe context.
The WACC, weighted average cost of capital, is a statistical parameter that is calculated and studied as a tool for evaluating investments. It is influenced by a multiplicity of different factors and it is quite difficult to assess in a developing sector. To determine the range of variability of WACC for this study, the authors mainly refer to literature. A BGV Associates and WindEurope study [23] estimates a value of 5.5% for a 1000 MW for commercial offshore park with fixed foundations, while [24] indicates 4.8%. Due to the higher uncertainty of the floating wind energy sector, a conservative range of 5–9% was considered.
Once the inputs and their variability have been defined, a calculation tool was created to calculate LCoE values shown in the following paragraph.

2.2. Results and Discussion

The results of the study were obtained in the form of output tables, distinguished by the different WACC values considered. Table 2, Table 3 and Table 4 refer to WACC equal to 5%, 7%, and 9%, respectively. Each raw represents a given CF and contains the value of the LCoE calculated for increasing distances from shore, from left to right. Each column represents a given distance from shore and contains the value of the LCoE calculated for increasing CF from top to bottom. As already mentioned, the values for future offshore wind floating parks in Italy refer mainly to 10–50 km distances from shore and 25–45% CF.
According to the assumptions done, the offshore floating wind park LCoE value in Italy at 2030 ranges:
  • From 70 to 122 €/MWh for WACC = 5%;
  • From 79 to 138 €/MWh for WACC = 7%;
  • From 89 to 156 €/MWh for WACC = 9%.
A first comparison of these values was done with the literature values. The central value of the central table (100 €/MWh) is in good agreement with the average LCoE value (85 £/MWh) estimated by Carbon Trust [11] for the future commercial floating wind array. The table with WACC equal to 5% obviously shows the most optimistic results, while the tables with WACC set at 7% and 9% show progressively higher values, but which can still be considered acceptable. Roughly speaking, in Italy, the lower resource is compensated by lower costs due the lower distance from shore, at which the floating wind plants can be installed. Given the availability, the first generation of Italian offshore wind farms will probably be installed not too far from the coast, and the first areas to be occupied will be defined by CF at around 25–30%. Within the first 10–25 km from the Italian coasts, marine areas mainly present CF in the range of 25–30%. Sardinia and the tip of Sicily stand out from this trend, reaching higher winds, therefore higher producibility.
A second comparison is done with the value calculated for the north European context, corresponding to the complementary row and columns in the table, with respect to the ones indicated for the Italian context. Roughly speaking, the lower resource and lower production of the parks in the Italian marine areas are mainly compensated by the lower costs due to possibility to install these kind of plants closer to the coast.
Further considerations are reported in Section 4.

3. Techno-Economic Analysis at 2060

3.1. Materials and Methods

In this section, the authors present a long-term approach that aims to evaluate the electricity costs produced by floating offshore wind farms in Italy, considering effects of climate change on wind energy production and further costs optimization due to development and large diffusion of this technology. The difficulty in conducting studies of this type arises from the multidisciplinary approach that must be applied. In order to set up a comprehensive long-term predictive methodology, it is necessary to consider the interactions between the development of the technology, the costs and the market, the climate, and sociopolitical dynamics (the latter is out of the scope of this study) of the next decades. Forecasting the evolution of all these issues is not simple, given their complexity [25].
Concerning the costs, in Section 2 an extensive assessment at 2030 was reported. In this section, the economic benefits beyond 2060, such as long-term progressive decrease of costs and weighted average cost of capital (WACC) due to the learning curve, and reaching large diffusion of floating wind technology, are considered [26].
Climate change has potential impacts on the whole energy sector, but especially on renewables. Several studies provide risks analyses and predictions of future resource availability [27]. The focus of the present study is on the change in spatial distribution of wind resources, and possible effects on wind energy productivity and, consequently, on economic sustainability of wind farms in Italian seas. Obviously, a reduction in mean wind speed generally leads to a drop in power production and, accordingly, to an increase in LCoE. Otherwise, a higher resource is favored in terms of economic sustainability.
Current resource distribution reproduced in wind charts and atlases is based on historical data recordings and on climatic models fitting those data. Uncertainties arise because of an incomplete knowledge of atmospheric processes and because of lack of data, especially offshore, where there are very few measurement stations.
Future spatial and temporal variations of meteorological parameters, such as temperature, precipitation, and mean wind speed, are estimated by simulations carried out with regional climate models (RCMs), whose boundary conditions (which include CO2 emission pathways, as provided by Intergovernmental Panel on Climate Change, IPCC) are derived from global climate models (GCMs). Uncertainties related to these models are often softened by running different simulations constituting an “ensemble” or by validation through comparison with empirical data sets [25,28].
Concerning the possible impact of climate change on the production expected from wind power plants in the future, the studies are focused on mapping the wind speed and identifying the areas that, in long-term scenarios, will benefit from an increased wind potential, and areas that will be negatively impacted [28]. Since wind energy density increases as the cube of the speed, even small variations in wind speed are amplified in the production calculation [25].
Moreover, to depict a complete frame about economics, the trend of other LCoE drivers, such as CAPEX, OPEX, and WACC were investigated.
In order to carry out this analysis, a parametric tool similar to the one presented in Section 2 has been developed. For the second generation of floating wind parks to be installed in 2060, the starting base case was the 30-year life cycle—1000 MW reference wind power plant already used in the 2030 analysis, and the central values of the previous cost analysis were applied. Moreover, for the baseline, no wind resource variation was supposed, since reference literature examined in this study do not show significant modifications of wind speed patterns over the area of interest in the next decade.
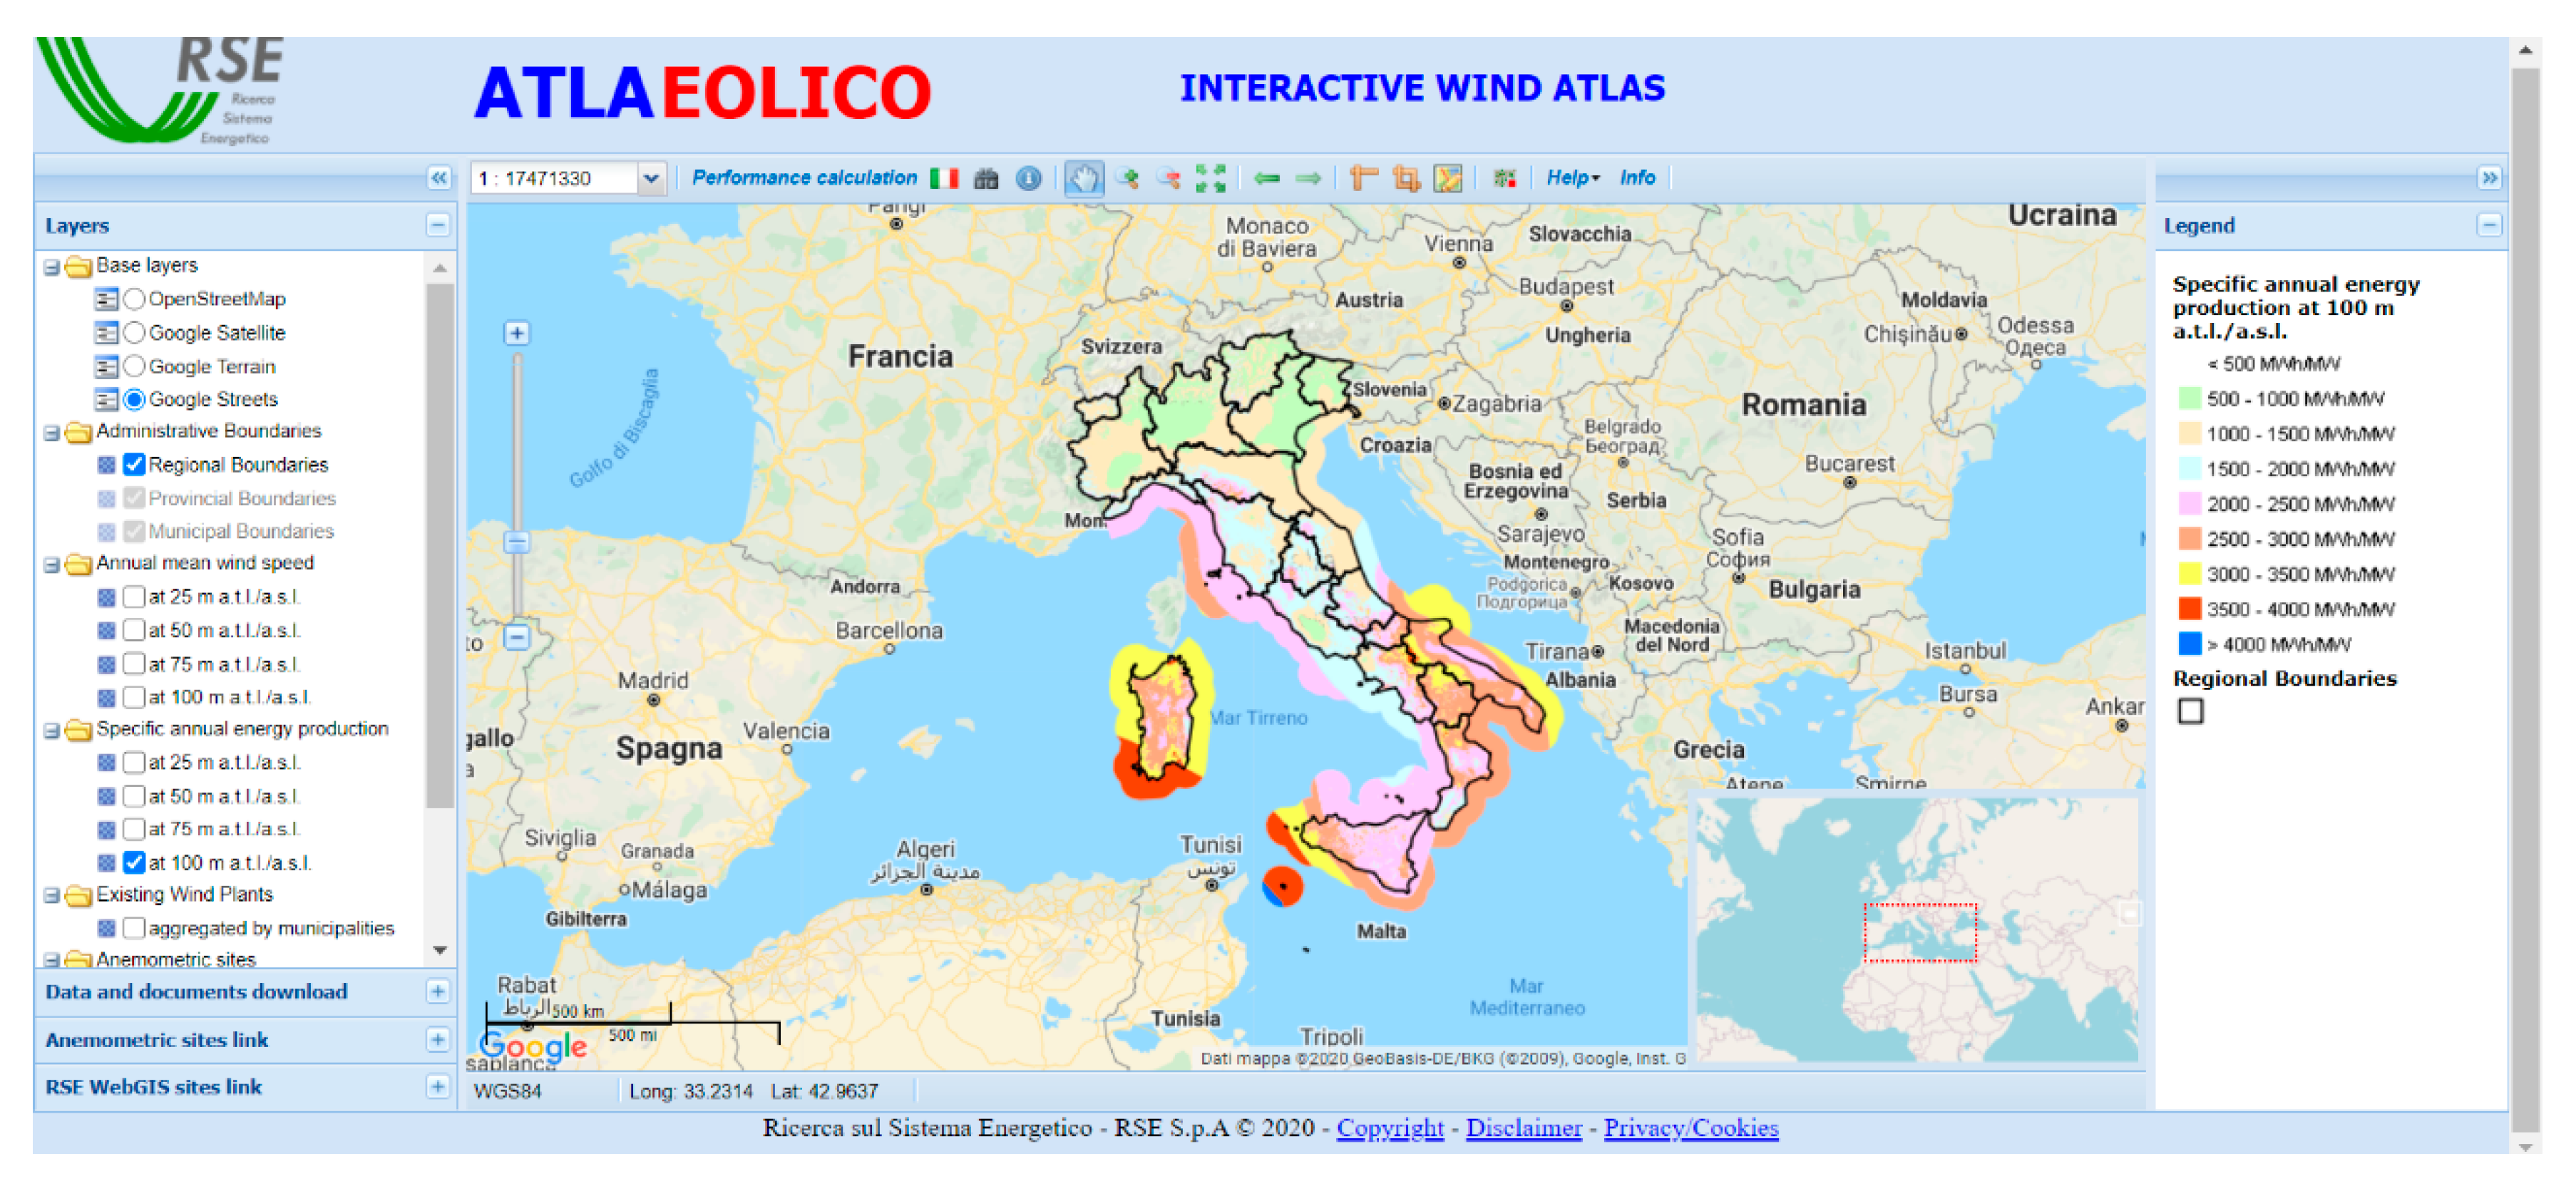
According to ATLAEOLICO [21], Italy’s wind power productivity maps, shown in Figure 2, indicate Apulia, Sardinia, and south Sicily’s coasts as the more attractive regions for installation of new offshore wind plants. In fact, in these areas, the average wind speed is closer to the North Sea or Atlantic one, where higher mean wind speeds occasionally exceed 12 m/s.
Firstly, as an exemplary demonstration, three hypothetical case studies were arranged in these three marine areas, about 40 km from the coastlines, at less than 500 m water-depth. The ATLAEOLICO performance calculator tool was employed to find out the power productivity of a theoretical parametric floating wind farm, given the geographic coordinates of the site and the hub height of the selected wind turbine. This tool is applied in the reference case and for all of the other production evaluations. Wind speed at hub height is automatically extrapolated by the software through vertical gradient wind intensity equation.
Secondly, we introduced parameters to represent long-term scenarios at 2060. To evaluate possible variations in wind resources due to climate change, the authors mainly refer to the above mentioned study [28] that analyzes the results, and the level of accord of six different simulations performed with three RCM (KNMI-RACMO2, HIRHAM5, RCA3) and four GCM (BCM, ECHAM5, ECHAM5-r3, HadCM3Q16). General conclusions of the paper are that, although some delimited regions could experience an increase in mean wind speed, the wind resource in the Mediterranean area will generally undergo a modest decrease (especially in the Central Mediterranean) or remain constant. A comparable tendency is extrapolated for Italy: models agree on a slight reduction (up to − 0.5m/s) over Sicily and Calabria’s coasts, while there is not an obvious trend for the rest of the Italian seas. This picture is also confirmed by the simulations conducted with a RSE tool, called CLIMED [29], aimed to assess the impacts of climate change on the electricity system. Even in a scenario with high emissions, the decrease in wind speed on Italian seas is limited to −0.4 m/s and seems concentrated around Sicily. Nevertheless, even though some general patterns may be distinguished, it must be accounted that perceptible discrepancy still exists between long-term projections provided by different sources. Accordingly, a conservative approach was applied in determining long-term resource decrease estimates. Chosen values should be intended as the worst scenario that could incur based on the sources analyzed in this section. We set for case study 1 (Apulia) a null variation of wind speed, for case study 2 (Sicily), due to the scarce level of agreement of predictive models, two −0.25 m/s (less pessimistic) and −0.5 m/s (pessimistic) hypothesis and, finally, for case study 3 (Sardinia), a decrease of −0.25 m/s. The new values of wind speed were re-implemented in ATLAEOLICO and, for each case study, future estimates of wind power productivity were obtained as reported in the following Table 5, Table 6, Table 7 and Table 8.
Regarding economic inputs, projections of the main parameters, CAPEX and OPEX, at 2060 were extracted from NREL reports [30,31], which contain mid and low cost trends, and allowed to develop more or less optimistic scenarios. Distance-from-shore-dependent costs, such as grid connection expenses, were considered in the 2030 scenario. In order to represent more fortunate evolutions to 2060 of the floating wind sector, the WACC was gradually lowered to 2.5% [24].
Wind farms and turbine sizes are expected to change as well. To describe this increasing trend, we introduced a second reference 2000 MW wind power plant, composed by 100 20-MW turbines. To compute power productivity of these hypothetical turbines, we assumed (in a very rough first approximation) that the power curve is twice the curve of the reference 10-MW turbine. Therefore, performance calculation for this layout was simply run considering twice as many turbines. Another factor was the higher hub height of the supposed 20 MW turbine, which was set at 168 m a.s.l. Wind velocity at that altitude was calculated using the “wind shear” equation—α equal to 0.11 (already discussed in Section 2).
In order to outline the range of potential evolutions of floating wind LCoE in Italy, data inputs are clustered in different scenarios, highlighting optimistic, medium, and conservative inputs combinations:
  • “Baseline 2030”, as already reported, considered the performance of 1000 MW reference farm without assuming any change in the resource compared to current values. This constitutes a reference point for following scenarios.
  • “CC 2060” (climate change at 2060) is a scenario that shows only wind resource rearrangement, without variations on cost and technology variables. Thus, modifying only wind speed inputs, climate change effects were isolated.
  • “CC + TEC(I) 2060” (climate change + low technology development at 2060) combines both climate change effects on wind velocities and an initial conservative hypothesis about costs and WACC (–10% for CAPEX and –5% for OPEX, WACC reduced from 7% to 5%).
  • “CC + TEC(II) 2060” (climate change + mid technology development at 2060) examines a more optimistic but still realistic framework in which, besides resource change, favorable reductions of WACC (reduced to 3.75%) and an increase in farm size (2000 MW) are assumed.
  • “TEC(II) 2060” (technology development II at 2060) simulates the same pattern of inputs of the previous scenario except for the fact that resource variation is not considered.
  • “CC + TEC(III) 2060” (climate change + high technology development at 2060) finally includes a wind farm operating over the most favorable techno-economic conditions: CAPEX and OPEX are assumed to decline by, respectively, 35% and 50%, compared to the 2030 baseline. WACC is fixed at 2.5%, a value corresponding to mature technology with established market.

3.2. Results and Discussion

The results of this assessment are reported in Table 5, Table 6, Table 7 and Table 8. Every table contains the input parameters discussed in the previous section, mentioned by classes (geophysical and environmental parameters, wind farm specifications, costs, financial aspects and losses). Note that only some of these parameters plays a role in LCoE calculation. Mean wind speed (whereby gross production and capacity factor are derived), CAPEX, OPEX, and WACC are the main drivers of LCoE, which was variated. LCoE and LCoE percentage variation compared to the baseline for each case study are reported in the last lines of the tables.
The benchmark scenario at 2030 indicates, as in the previous section, a mean LCoE near to 100 €/MWh, a value compatible with the estimates reported in [11] for floating wind turbines at commercial stage. The baseline highlights differences in wind resource between case study sites, which recur along successive scenarios. As noticeable in ATLAEOLICO wind speed maps, all selected sites present attracting wind conditions. In the Apulia site, the resource (7.79 m/s) is slightly lower than the other sites, but is still assessed as profitable in terms of electricity production. Marine surroundings of Sicily present more suitable wind velocities while Sardinia’s west coast exhibit even better wind conditions. Sicily and Sardinia sites currently present, respectively, wind speeds of 8.05 m/s and 8.92 m/s. Some projects of wind farms for these zones have already been submitted, but are still waiting for authorization [32].
For clarity’s sake, the results are summarized in the following bar plot (Figure 3), which shows the differences between case studies along the different scenarios.
Specific scenario related comments are:
  • In CC 2060, following the approach used by [25], the first scenario at 2060 was assembled by focusing only on the resource change. Costs and technological parameters were not then modified in order to isolate climate change effects on capacity factors and consequently on LCoE. Results show an increase smaller than 10% in the LCoE at 2060 for case study 2 (Sicily) under a −0.50 m/s speed decrease hypothesis, and an increase smaller than 5% in the LCoE at 2060 for case studies 2 (Sicily) and 3 (Sardinia) under a −0.25 m/s speed decrease hypothesis. For case study 1 (Apulia) no resource variation was applied; therefore, LCoE did not experience any variation. Given these results, obtained without considering any technological improvement or costs decrease, it is inferable that climate change could play an antagonistic role in reducing LCoE of floating wind technology, although its impacts does not appear to be dramatic.
  • CC + TEC(I) 2060 shows that, even when a conservative hypothesis of costs and WACC reduction is applied, the LCoE positive trend of the previous scenario is largely balanced. Decrease in LCoE, which involves both resource change and a low technological development contributes, is placed between −10.9% (case study 2 under −0.50 m/s hypothesis) and −18.4% (case study 1).
  • In the CC + TEC(II) 2060 scenario, a more optimistic pattern of economic and technological inputs is applied, including higher turbines, which access greater wind speeds. LCoE reductions is more evident: Apulia’s site, which does not suffer climate change effects, experiences a reduction of −28.4% in LCoE. Sicily shows reductions of −25.4% (optimistic hypothesis) and −22.1% (pessimistic hypothesis), while Sardinia LCoE drops by 25.6%. Absolute values of LCoE decrease to about 70–80 €/MWh range.
  • In the TEC(II) 2060, the deviation between LCoE decreases if resource variations are taken or not into account is negligible and obviously maximal in the −0.50 m/s hypothesis for case study 2 (−6.2%). This, fortunately, confirms again the weak effects of climate change on wind energy production in the analyzed sites.
  • Lastly, in the hyper-optimistic scenario, CC + TEC(III) 2060, very low LCoE values (below 50 €/MWh) are reached by considerable percentage reductions (−55% to −60%) compared to 2030. Although very optimistic, this scenario could be achieved if a large diffusion of floating wind technology will take place in the next decades following, i.e., the learning curve of the onshore wind energy sector.

4. Consideration about Economic Sustainability

In order to assess economic sustainability, all of the evaluations of the LCoE for the offshore floating wind plants, as for any other generation technology, have to be compared to selling prices of the energy during the plants lifetime.
In the past decades, incentive mechanisms were in place for the renewable generation. Most of them are based on a fix fid-in tariff for all of the (previously defined) lifetimes of the plants. The lifetimes for the wind plants are usually set in 20 years for onshore plants and 25 years for offshore ones. Most of the present generated wind electricity is paid with this tariff. In many countries, including Italy, this mechanism is still in place. The access to the incentive tariff usually takes place through downward auctions. For example, the base tariff for the onshore wind and photovoltaic plants in the 2019 auction in Italy was 70 €/MWh. However, the incentive mechanisms will experiment a gradual decrease until they disappear. One of the new mechanisms to sell renewable energy is the power purchase agreement, where a private subject will buy renewable production at a fixed price for a given period. The period is usually shorter (or significantly shorter) than the lifetime of the plant. At the end of this period, the agreement can be renegotiated. The renewable energy can also be sold directly in the electricity market, however, this market needs a strong redesign to not penalize too much the fluctuating renewable generation (typically solar and wind generation). At present, the market works on “demand and supply”, so countries with very high fluctuating renewable production could experience situations in which the price of electricity falls to zero, or even becomes negative, i.e., the noon of a windy day in the summer. This is, for example, what many countries, such as Italy, experimented during the coronavirus disease 2019 (COVID-19) pandemic lockdown [33]. Many production facilities were closed and the electricity demand deceased significantly. Therefore, the penetration of the renewable reached the highest even value, but the prices dramatically fell. This will occur more often with the expected increase of wind and solar plants in the next decades, without intervention on the electricity market structure.
Some mitigations can be obtained storing the excess of wind production directly with storage systems (batteries); however, these system are still of quite small size compared with the average wind plant one, expensive [34], not completely reliable, and there is no clear regulation about them. Many other storage systems, i.e., pumping the water up in the big hydro plants or offshore compressed air energy storage (CAES) [35], can be associated to wind production, but they are strongly dependent on the presence of already operating plants and/or on the morphologic characteristics of the geographical area.
Another way of using the excess of production is the generation of hydrogen or other gaseous fuels. This is the so-called “Power to Gas” option [36]. Wind generation can also contribute to the recharge of electrical vehicles, which are seen as distributed storage in a future “vehicle to grid” scenario [37].
Wind generation can also contribute to distributed generation in isolated small grids, such as the small island ones [38] or the energy supply of offshore oil and gas platforms, such as the Tampere Hywind floating wind plant [39]. In a future vision of smart grids, wind generation can also contribute to supply energy to an “aggregate” of production and demand that is seen as a unique subject by the grid. The aggregate has the purpose to use the generated energy in a smart way inside the aggregate and mitigate the variability of what is send to the grid. In Italy, tests of small aggregate are already in place [40].
Moreover, wind generation can contribute to the frequency regulation of the power grid [41].
Summarizing, the future selling price of the wind electricity could depend on different factors and on the services that the wind plants can perform to the grid or to other private and public organizations. It is therefore very difficult to define a long-term scenario (until 2090!) of the expected revenues of the future wind plants; however, if the costs will stay aligned with the ones estimated by other studies on floating wind plants, in Italy, they will foreseeably be economically sustainable.

5. Conclusions

Massive offshore wind energy deployment in Italy is expected, starting from 2030. Very long-term scenarios have been developed in order to assess the costs of offshore floating wind plants in Italy. The uncertainty of these evaluations is quite high because the technology is not yet mature and because the evaluation needs a strong multidisciplinary approach. However, the authors deem that these evaluations are important for the better assessment of the offshore wind potential in Italy and as the first input to policymakers. The study made some approximations, and borrowed many inputs from the literature, specializing them to the Italian content. The results show that the values of LCoE are in good agreement with the future expected ones for the sector, even in long-term, pessimistic scenarios, with a slight reduction of wind resources due to climate change.

Author Contributions

Writing—review and editing, L.S.; scenarios at 2030, L.C.; scenarios at 2060, B.V.; supervision, T.B. All authors have read and agreed to the published version of the manuscript.

Funding

This work was financed by the Research Fund for the Italian Electrical System under the contract agreement between RSE and the Ministry of Economic Development.

Conflicts of Interest

The authors declare no conflict of interest.

References

  1. Eionet Portal. Renewable Energy in Europe 2019—Recent Growth and Knock-on Effects. Available online: https://www.eionet.europa.eu/etcs/etc-cme/products/etc-cme-reports/renewable-energy-in-europe-2019-recent-growth-and-knock-on-effects (accessed on 21 September 2020).
  2. WindEurope. Offshore Wind in Europe: Key Trends and Statistics. 2019. Available online: https://windeurope.org/about-wind/statistics/offshore/european-offshore-wind-industry-key-trends-statistics-2019/ (accessed on 21 September 2020).
  3. We’re Building the World’s Largest Floating Offshore Windfarm. Available online: https://www.equinor.com/ (accessed on 21 September 2020).
  4. WindFloat. Available online: https://www.principlepowerinc.com/en/windfloat (accessed on 21 September 2020).
  5. WindFloat Atlantic. Available online: https://www.edp.com/en/innovation/windfloat (accessed on 25 November 2020).
  6. WindEurope. Wind Energy in Europe in 2019 Trends and Statistics. Available online: https://windeurope.org/wp-content/uploads/files/about-wind/statistics/WindEurope-Annual-Statistics-2019.pdf (accessed on 21 September 2020).
  7. WindEurope. Our Energy, Our Future How Offshore Wind Will Help Europe Go Carbon-Neutral. Available online: https://windeurope.org/wp-content/uploads/files/about-wind/reports/WindEurope-Our-Energy-Our-Future.pdf (accessed on 21 September 2020).
  8. Serri, L.; Greco, L. IEA WIND Annual Report 2019, Italy Chapter. Available online: https://ieawind.connectedcommunity.org/publications/ar (accessed on 4 December 2020).
  9. Casale, C.A.; Lembo, E.; Serri, L.; Viani, S. Preliminary design of a floating wind turbine support structure and relevant system cost assessment. Wind Eng. 2010, 34, 29–50. [Google Scholar] [CrossRef]
  10. Airoldi, D.; Casale, C.A.; Lembo, E.; Serri, L. Italian Offshore Wind Potential Evaluation through GIS Tools and Data; EWEA Offshore: Amsterdam, The Netherlands, 2011. [Google Scholar]
  11. Carbon Trust. Floating Offshore Wind: Market and Technology Review; Prepared for the Scottish Government; Carbon Trust: London, UK, 2015; Available online: https://prod-drupal-files.storage.googleapis.com/documents/resource/public/Floating%20Offshore%20Wind%20Market%20Technology%20Review%20-%20REPORT.pdf (accessed on 21 November 2020).
  12. Beiter, P.; Musial, W.; Smith, A.; Kilcher, L.; Damiani, R.; Maness, M.; Sirnivas, S.; Stehly, T.; Gevorgian, V.; Mooney, M.; et al. A Spatial-Economic Cost-Reduction Pathway Analysis for U.S. Offshore Wind Energy Development from 2015–2030; Technical Report NREL/TP-6A20-66579; U.S. Department of Energy Office of Scientific and Technical Information: Golden, CO, USA, 2016.
  13. Kikuchi, Y.; Ishihara, T. Upscaling and levelized cost of energy for offshore wind turbines supported by semi-submersible floating platforms. In Proceedings of the 16th Deep Sea Offshore Wind R&D Conference, Radisson Blu Royal Garden Hotel, Trondheim, Norway, 16–18 January 2019. [Google Scholar]
  14. IRENA. Future of Wind: Deployment, Investment, Technology, Grid Integration and Socio-Economic Aspects. 2019. Available online: https://www.irena.org/-/media/Files/IRENA/Agency/Publication/2019/Oct/IRENA_Future_of_wind_2019.pdf (accessed on 21 September 2020).
  15. Simple Levelized Cost of Energy (LCOE) Calculator Documentation. Available online: https://www.nrel.gov/analysis/tech-lcoe-documentation.html (accessed on 21 September 2020).
  16. Desmond, C.; Murphy, J.; Blonk, L.; Haans, W. Description of an 8 MW reference wind turbine. In Journal of Physics: Conference Series (JPCS); IOP Publishing Ltd.: Bristol, UK, 2016; Volume 753. [Google Scholar]
  17. Myhr, A.; Bjerkseter, C.; Ågotnes, A.; Nygaard, T.A. Levelised cost of energy for offshore floating wind turbines in a life cycle perspective. Renew. Energy 2014, 66, 714–728. [Google Scholar] [CrossRef] [Green Version]
  18. Nieradzinska, K.; MacIver, C.; Gill, S.; Agnew, G.A.; Anaya-Lara, O.; Bell, K.R.W. Optioneering analysis for connecting Dogger Bank offshore wind farms to the GB electricity network. Renew. Energy 2016, 91, 120–129. [Google Scholar] [CrossRef] [Green Version]
  19. Heidari, S. Economic Modelling of Floating Offshore Wind Power: Calculation of Levelized Cost of Energy. Master’s Thesis, Mälardalen University, Västerås, Sweden, 2017. Available online: https://www.semanticscholar.org/paper/Economic-Modelling-of-Floating-Offshore-Wind-Power-Heidari/36f20e44a1206323f452b45bda3c28931b4572ef (accessed on 21 September 2020).
  20. Mazzuccato, A. Sviluppo e distribuzione dei dispositivi di Energia dalle onde sul territorio italiano. Bachelor’s Thesis, Università Bicocca, Milan, Italy, 2020. [Google Scholar]
  21. ATLAEOLICO. Available online: https://atlanteeolico.rse-web.it/ (accessed on 21 September 2020).
  22. L’energia Elettrica dal Vento. 2017. Available online: http://www.rse-web.it/collanaRseview/L-rsquoenergia-elettrica-dal-vento----in-versione-2-0.page (accessed on 25 November 2020).
  23. BVG and WindEurope. Unleashing Europe’s Offshore Wind Potential. 2017. Available online: https://windeurope.org/wp-content/uploads/files/about-wind/reports/Unleashing-Europes-offshore-wind-potential.pdf (accessed on 21 September 2020).
  24. Milborrow, D. WindEconomics: Renewables Lead the Way. 2018. Available online: https://www.windpowermonthly.com/article/1519228/windeconomics-renewables-lead (accessed on 21 September 2020).
  25. Hdidouan, D.; Staffel, I. The impact of climate change on the levelized cost of wind energy. Renew. Energy 2017, 101, 575–592. [Google Scholar] [CrossRef] [Green Version]
  26. Lecca, P.; McGregor, P.G.; Swales, K.J.; Tamba, M. The importance of learning for achieving the UK’s targets for offshore wind. Ecol. Econ. 2017, 135, 259–268. [Google Scholar] [CrossRef]
  27. Solaun, K.; Cerda, E. Climate change impacts on renewable energy generation. A review of quantitative projections. Renew. Sustain. Energy Rev. 2019, 116, 109415. [Google Scholar] [CrossRef]
  28. Koletsis, I.; Kotroni, V.; Lagouvardos, K.; Soukissian, T. Assessment of offshore wind speed and power potential over the Mediterranean and the Black Seas under future climate changes. Renew. Sustain. Energy Rev. 2016, 60, 234–245. [Google Scholar] [CrossRef]
  29. CLIMED. Available online: http://climed.rse-web.it/#!/wind_intensity (accessed on 21 September 2020).
  30. NREL. Annual Technology Baselines. 2017. Available online: https://atb.nrel.gov/electricity/2017/index.html?t=ow (accessed on 21 September 2020).
  31. NREL. Annual Technology Baselines: Electricity. 2019. Available online: https://atb.nrel.gov/electricity/2019/index.html?t=inlwowsusdsrscgthpcgcccncb&m=1 (accessed on 21 September 2020).
  32. ANEV. Brochure ANEV 2019. Available online: https://www.anev.org/ (accessed on 21 September 2020).
  33. Pineda, I. IEA Wind TCP ExCo 86 Online Meeting, 12–15 October 2020. Confidential.
  34. Jafari, M.; Botterud, A.; Sakti, A. Estimating revenues from offshore wind-storage systems: The importance of advanced battery models. Appl. Energy 2020, 276, 115417. [Google Scholar] [CrossRef]
  35. Wang, Z.; Carriveau, R.; Ting, D.S.K.; Xiong, W.; Wang, Z. A review of marine renewable energy storage. Int. J. Energy Res. 2019, 43, 6108–6150. [Google Scholar] [CrossRef]
  36. McDonagh, S.; Ahmed, S.; Desmond, C.; Murphy, J.D. Hydrogen from offshore wind: Investor perspective on the profitability of a hybrid system including for curtailment. Appl. Energy 2020, 265, 114732. [Google Scholar] [CrossRef]
  37. Vehicle to Grid Technology Could Address UK’s Energy Storage Challenge. Available online: https://www.theengineer.co.uk/vehicle-to-grid-technology-could-address-uks-energy-storage-challenge/ (accessed on 21 October 2020).
  38. Mendoza-Vizcaino, J.; Sumper, A.; Galceran-Arellano, S. PV, wind and storage integration on small islands for the fulfilment of the 50-50 renewable electricity generation target. Sustainability 2017, 9, 905. [Google Scholar] [CrossRef] [Green Version]
  39. Hywind Tampen Floating Wind Park. Available online: https://www.equinor.com/en/what-we-do/hywind-tampen.html (accessed on 21 October 2020).
  40. Progetto Pilota per Unità Virtuali Abilitate Miste—UVAM. Available online: https://www.terna.it/it/sistema-elettrico/progetti-pilota-delibera-arera-300-2017-reel/progetto-pilota-uvam (accessed on 21 October 2020).
  41. Wu, Z.; Gao, W.; Gao, T.; Yan, W.; Zhang, H.; Yan, S.; Wang, X. State-of-the-art review on frequency response of wind power plants in power systems. J. Mod. Power Syst. Clean Energy 2018, 6, 1–16. [Google Scholar] [CrossRef] [Green Version]
Figure 1. A view of ATLAEOLICO specific annual energy production at 100 m a.g.l./a.s.l. [21].
Applsci 10 08899 g001
Figure 2. A view of ATLAEOLICO mean wind speed map at 100 m a.g.l./a.s.l. The three case study sites are shown: (1) Apulia, (2) Sicily, (3) Sardinia.
Applsci 10 08899 g002
Figure 3. Graphical comparison between developed scenarios.
Applsci 10 08899 g003
Table 1. Correspondence between net equivalent hours (NEH) at 120 m a.s.l. and capacity factors (CF).
NEHCF
240925
289130
337335
385440
433645
481850
530055
Table 2. LCoEs (in bold in the table) calculated as function of CAPEX, OPEX and CF. WACC equal to 5%.
LCoE (€/MWh)
n (years)30
WACC (%)5.00
CRF0.07
Distance from the Coast (km)10255075100200
Export Cable Costs (M€/MW)0.010.030.050.080.100.20
Installation Costs (M€/MW)0.310.320.330.340.360.42
CAPEX (M€/MW)2.322.342.382.422.462.62
OPEX (M€/MW)0.1160.1170.1190.1210.1230.131
CF25122123125127129138
30101102104106108115
35878889919298
40767778798186
45686870717276
50616163646569
55555657585963
Table 3. LCoEs (in bold in the table) calculated as function of CAPEX, OPEX, and CF. WACC equal to 7%.
LCoE (€/MWh)
n (years)30
WACC (%)7.00
CRF0.07
Distance from the Coast (km)10255075100200
Export Cable Costs (M€/MW)0.010.030.050.080.100.20
Installation Costs (M€/MW)0.310.320.330.340.360.42
CAPEX (M€/MW)2.322.342.382.422.462.62
OPEX (M€/MW)0.1160.1170.1190.1210.1230.131
CF25138140142144147156
30115116118103122130
359910010190105112
40868789809298
45777879718187
50697071727378
55636365666771
Table 4. LCoEs (in bold in the table) calculated as function of CAPEX, OPEX, and CF. WACC equal to 9%.
LCoE (€/MWh)
n (years)30
WACC (%)9.00
CRF0.07
Distance from the Coast (km)10255075100200
Export Cable Costs (M€/MW)0.010.030.050.080.100.20
Installation Costs (M€/MW)0.310.320.330.340.360.42
CAPEX (M€/MW)2.322.342.382.422.462.62
OPEX (M€/MW)0.1160.1170.1190.1210.1230.131
CF25156157160163165176
30130131134136138147
35111112115116118126
409798100102103110
45878789909298
50787980818388
55717273747580
Table 5. Case study 1 (Apulia); net wind speed variation: −0 m/s. (Variable parameters in bold).
Baseline 2030CC 2060CC + TEC(I) 2060CC + TEC(II) 2060TEC(II) 2060CC + TEC(III) 2060
Water depth (m)−379−379−379−379−379−379
Distance from shore (Km)404040404040
Distance from grid (Km)42.742.742.742.742.742.7
Mean wind speed at hub height (m/s)7.797.797.798.098.098.09
Wind farm capacity (MW)100010001000200020002000
Number of turbines100100100100100100
Turbine rate (MW)101010202020
Hub height (m)119119119168168168
Terrestrial cable cost (M€/Km)0.250.250.250.250.250.25
Offshore cable cost (M€/MW)1.001.001.001.001.001.00
Total grid- connection costs (M€)40.6840.6840.6840.6840.6840.68
CAPEX (excluding cables costs) (M€/MW)2.302.302.072.072.071.50
Total CAPEX (M€/MW)2.342.342.112.112.091.52
OPEX (M€/MW)0.1250.1250.1190.1190.1190.063
WACC (%)7.007.005.003.753.752.50
Farm lifecycle (year)303030303030
Total production efficiency (%)83.383.383.383.383.383.3
Gross annual production (MWh) 3,419,0003,419,0003,419,0007,178,0007,178,0007,178,000
Net annual production (MWh)2,847,0372,847,0372,847,0375,977,1965,977,1965,977,196
Specific productivity (MWh/MW)284728472847298929892989
Capacity factor (%)32.532.532.534.134.134.1
LCoE (€/MWh)110.2110.289.979.079.045.1
LCoE variation referring to baseline (%)/0.0−18.4%−28.3%−28.3%−59.0%
Table 6. Case study 2 (Sicily); net wind speed variation: −0.25 m/s. (Variable parameters in bold).
Baseline 2030CC 2060CC + TEC(I) 2060CC + TEC(II) 2060TEC(II) 2060CC + TEC(III) 2060
Water depth (m)−463−463−463−463−463−463
Distance from shore (Km)404040404040
Distance from grid (Km)44.944.944.944.944.944.9
Mean wind speed at hub height (m/s)8.057.807.808.108.368.10
Wind farm capacity (MW)100010001000200020002000
Number of turbines100100100100100100
Turbine rate (MW)101010202020
Hub height (m)119119119168168168
Terrestrial cable cost (M€/Km)0.250.250.250.250.250.25
Offshore cable cost (M€/MW)1.001.001.001.001.001.00
Total grid-connection costs (M€)41.2341.2341.2341.2341.2341.23
CAPEX (excluding cables costs) (M€/MW)2.302.302.072.072.071.50
Total CAPEX (M€/MW)2.342.342.112.092.091.52
OPEX (M€/MW)0.1250.1250.1190.1190.1190.063
WACC (%)7.007.005.003.753.752.50
Farm lifecycle (year)303030303030
Total production efficiency (%)83.383.383.383.383.383.3
Gross annual production (MWh) 3,602,0003,454,0003,454,0007,262,0007,560,0007,262,000
Net annual production (MWh)2,999,4232,876,1822,876,1826,047,1436,295,2916,047,143
Specific productivity (MWh/MW)299928762876302431483024
Capacity factor (%)34.232.832.834.535.934.5
LCoE (€/MWh)104.6109.189.078.175.044.6
LCoE variation referring to baseline (%)/+4.3−14.9%−25.4%−28.3%−57.3%
Table 7. Case study 2 (Sicily); net wind speed variation: −0.50 m/s. (Variable parameters in bold).
Baseline 2030CC 2060CC + TEC(I) 2060CC + TEC(II) 2060TEC(II) 2060CC + TEC(III) 2060
Water depth (m)−463−463−463−463−463−463
Distance from shore (Km)404040404040
Distance from grid (Km)44.944.944.944.944.944.9
Mean wind speed at hub height (m/s)8.057.557.557.848.367.84
Wind farm capacity (MW)100010001000200020002000
Number of turbines100100100100100100
Turbine rate (MW)101010202020
Hub height (m)119119119168168168
Terrestrial cable cost (M€/Km)0.250.250.250.250.250.25
Offshore cable cost (M€/MW)1.001.001.001.001.001.00
Total grid-connection costs (M€)41.2341.2341.2341.2341.2341.23
CAPEX (excluding cables costs) (M€/MW)2.302.302.072.072.071.50
Total CAPEX (M€/MW)2.342.342.112.092.091.52
OPEX (M€/MW)0.1250.1250.1190.1190.1190.063
WACC (%)7.007.005.003.753.752.50
Farm lifecycle (year)303030303030
Total production efficiency (%)83.383.383.383.383.383.3
Gross annual production (MWh) 3,602,0003,300,0003,300,0006,956,0007,560,0006,956,000
Net annual production (MWh)2,999,4232,747,9452,747,9455,792,3346,295,2915,792,334
Specific productivity (MWh/MW)299927482748289631482896
Capacity Factor (%)34.231.431.433.135.933.1
LCoE (€/MWh)104.6114.193.281.575.046.6
LCoE variation referring to baseline (%)/+9.2%−10.9%−22.1%−28.3%−55.5%
Table 8. Case study 3 (Sardinia); net wind speed variation: −0.25 m/s. (Variable parameters in bold).
Baseline 2030CC 2060CC + TEC(I) 2060CC + TEC(II) 2060TEC(II) 2060CC + TEC(III) 2060
Water depth (m)−443−443−443−443−443−443
Distance from shore (Km)40.540.540.540.540.540.5
Distance from grid (Km)49.449.449.449.449.449.4
Mean wind speed at hub height (m/s)8.928.678.679.019.269.01
Wind farm capacity (MW)100010001000200020002000
Number of turbines100100100100100100
Turbine rate (MW)101010202020
Hub height (m)119119119168168168
Terrestrial cable cost (M€/Km)0.250.250.250.250.250.25
Offshore cable cost (M€/MW)1.001.001.001.001.001.00
Total grid-connection costs (M€)42.7342.7342.7342.7342.7342.73
CAPEX (excluding cables costs) (M€/MW)2.302.302.072.072.071.50
Total CAPEX (M€/MW)2.342.342.112.092.091.52
OPEX (M€/MW)0.1250.1250.1190.1190.1190.063
WACC (%)7.007.005.003.753.752.50
Farm lifecycle (year)303030303030
Total production efficiency (%)83.383.383.383.383.383.3
Gross annual production (MWh) 4,044,0003,916,0003,916,0008,178,0008,422,0008,178,000
Net annual production (MWh)3,367,4813,260,8943,260,8946,809,9067,013,0886,809,906
Specific productivity (MWh/MW)336732613261340535073405
Capacity Factor (%)38.437.237.238.940.038.9
LCoE (€/MWh)93.296.278.669.367.339.6
LCoE variation referring to baseline (%)/+3.3%−15.7%−25.6%−27.8%−57.5%
Publisher’s Note: MDPI stays neutral with regard to jurisdictional claims in published maps and institutional affiliations.

