Where We Come from and Where We Are Going: A Systematic Review of Human Factors Research in Driving Automation


Abstract
:1. Introduction
- Providing an overview of emerging possibilities for study design in driving automation research
- Outlining which constructs have been investigated, which data collection methods have been applied, and which specific parameters have been calculated and reported
2. Research Status on Automated Vehicle HMIs
2.1. Topics of Interest
2.2. Possibilities for Study Design
3. Method
3.1. Venue Selection Process
3.2. Paper Selection Process
3.3. Paper Reviewing Strategy
3.4. Database Structure
- Paper: For each paper, we collected descriptive information (title, abstract, year, authors, conference), as well as the levels of automation addressed in the study. The following additional information was collected: The type of user (driver, passenger, external), road type (urban, highway, rural, not relevant), study type (lab, test track, real road, survey), the representation of the AV (static text description, sketch, driving simulator, Wizard-of-Oz, real vehicle), study period (single session, short-term, long-term), type of research (basic research, concept evaluation, method development, model development), as well as participant information, such as the number of subjects, their mean age, as well as if they were internally (students, employees, etc.) or externally recruited.
- Construct: Represents the topics of investigation. To avoid subjective interpretation by the reviewers, we only collected constructs which were explicitly mentioned by authors in the papers, (such as Safety, Trust, Acceptance, etc.). All constructs which were only investigated by one single paper are summarized within another construct. Generic investigations on participants’ opinion and general perception without directly mentioning specific constructs are summarized with a General Attitude construct.
- Collection Method: Relevant data collection methods, such as driving performance, TOR performance, secondary task performance, ECG, EEG, standardized questionnaire, interview, etc. Secondary task performance in particular refers to a participant’s performance in a task not related to driving (e.g., number of missed target stimuli on a tablet). Again, we came up with initial suggestions that were expanded in case a new item emerged during the reviewing process.
- Parameter: Parameters that were used in the different data collection methods, for example standard deviation of lateral position (SDLP) [68], response time (could be used to measure driving performance), gaze-off-road time, gaze standard deviation (eye-tracking), technology acceptance model [35], NASA-TLX [69] (examples for standardized questionnaires), etc.
- Relationships: To structure our data, we created a relationship table to represent (n:m) relations of papers, collection methods, parameters, and constructs. Thus, each paper can investigate different constructs, where each construct can be assessed by one (or multiple) data collection methods, and each data collection method by one (or multiple) parameters. For each relation, we categorized whether the combination represents behavioral, self-reported, or physiological data. Furthermore, we assessed if the parameter was measured before/during/after a trial in the experiment. This data model allowed us to store all information without duplicates (each combination of paper/construct/collection method/parameter was stored only once using database key constraints), while the relations allow for performing powerful queries on the data (in comparison to pure list/sheet based representations). For example, we can ask the database which papers investigated a certain construct using physiological sensors, how many papers utilized a certain standardized scale, or how constructs changed over the years.
4. Results
4.1. General Study Details
4.2. Methodological Approaches
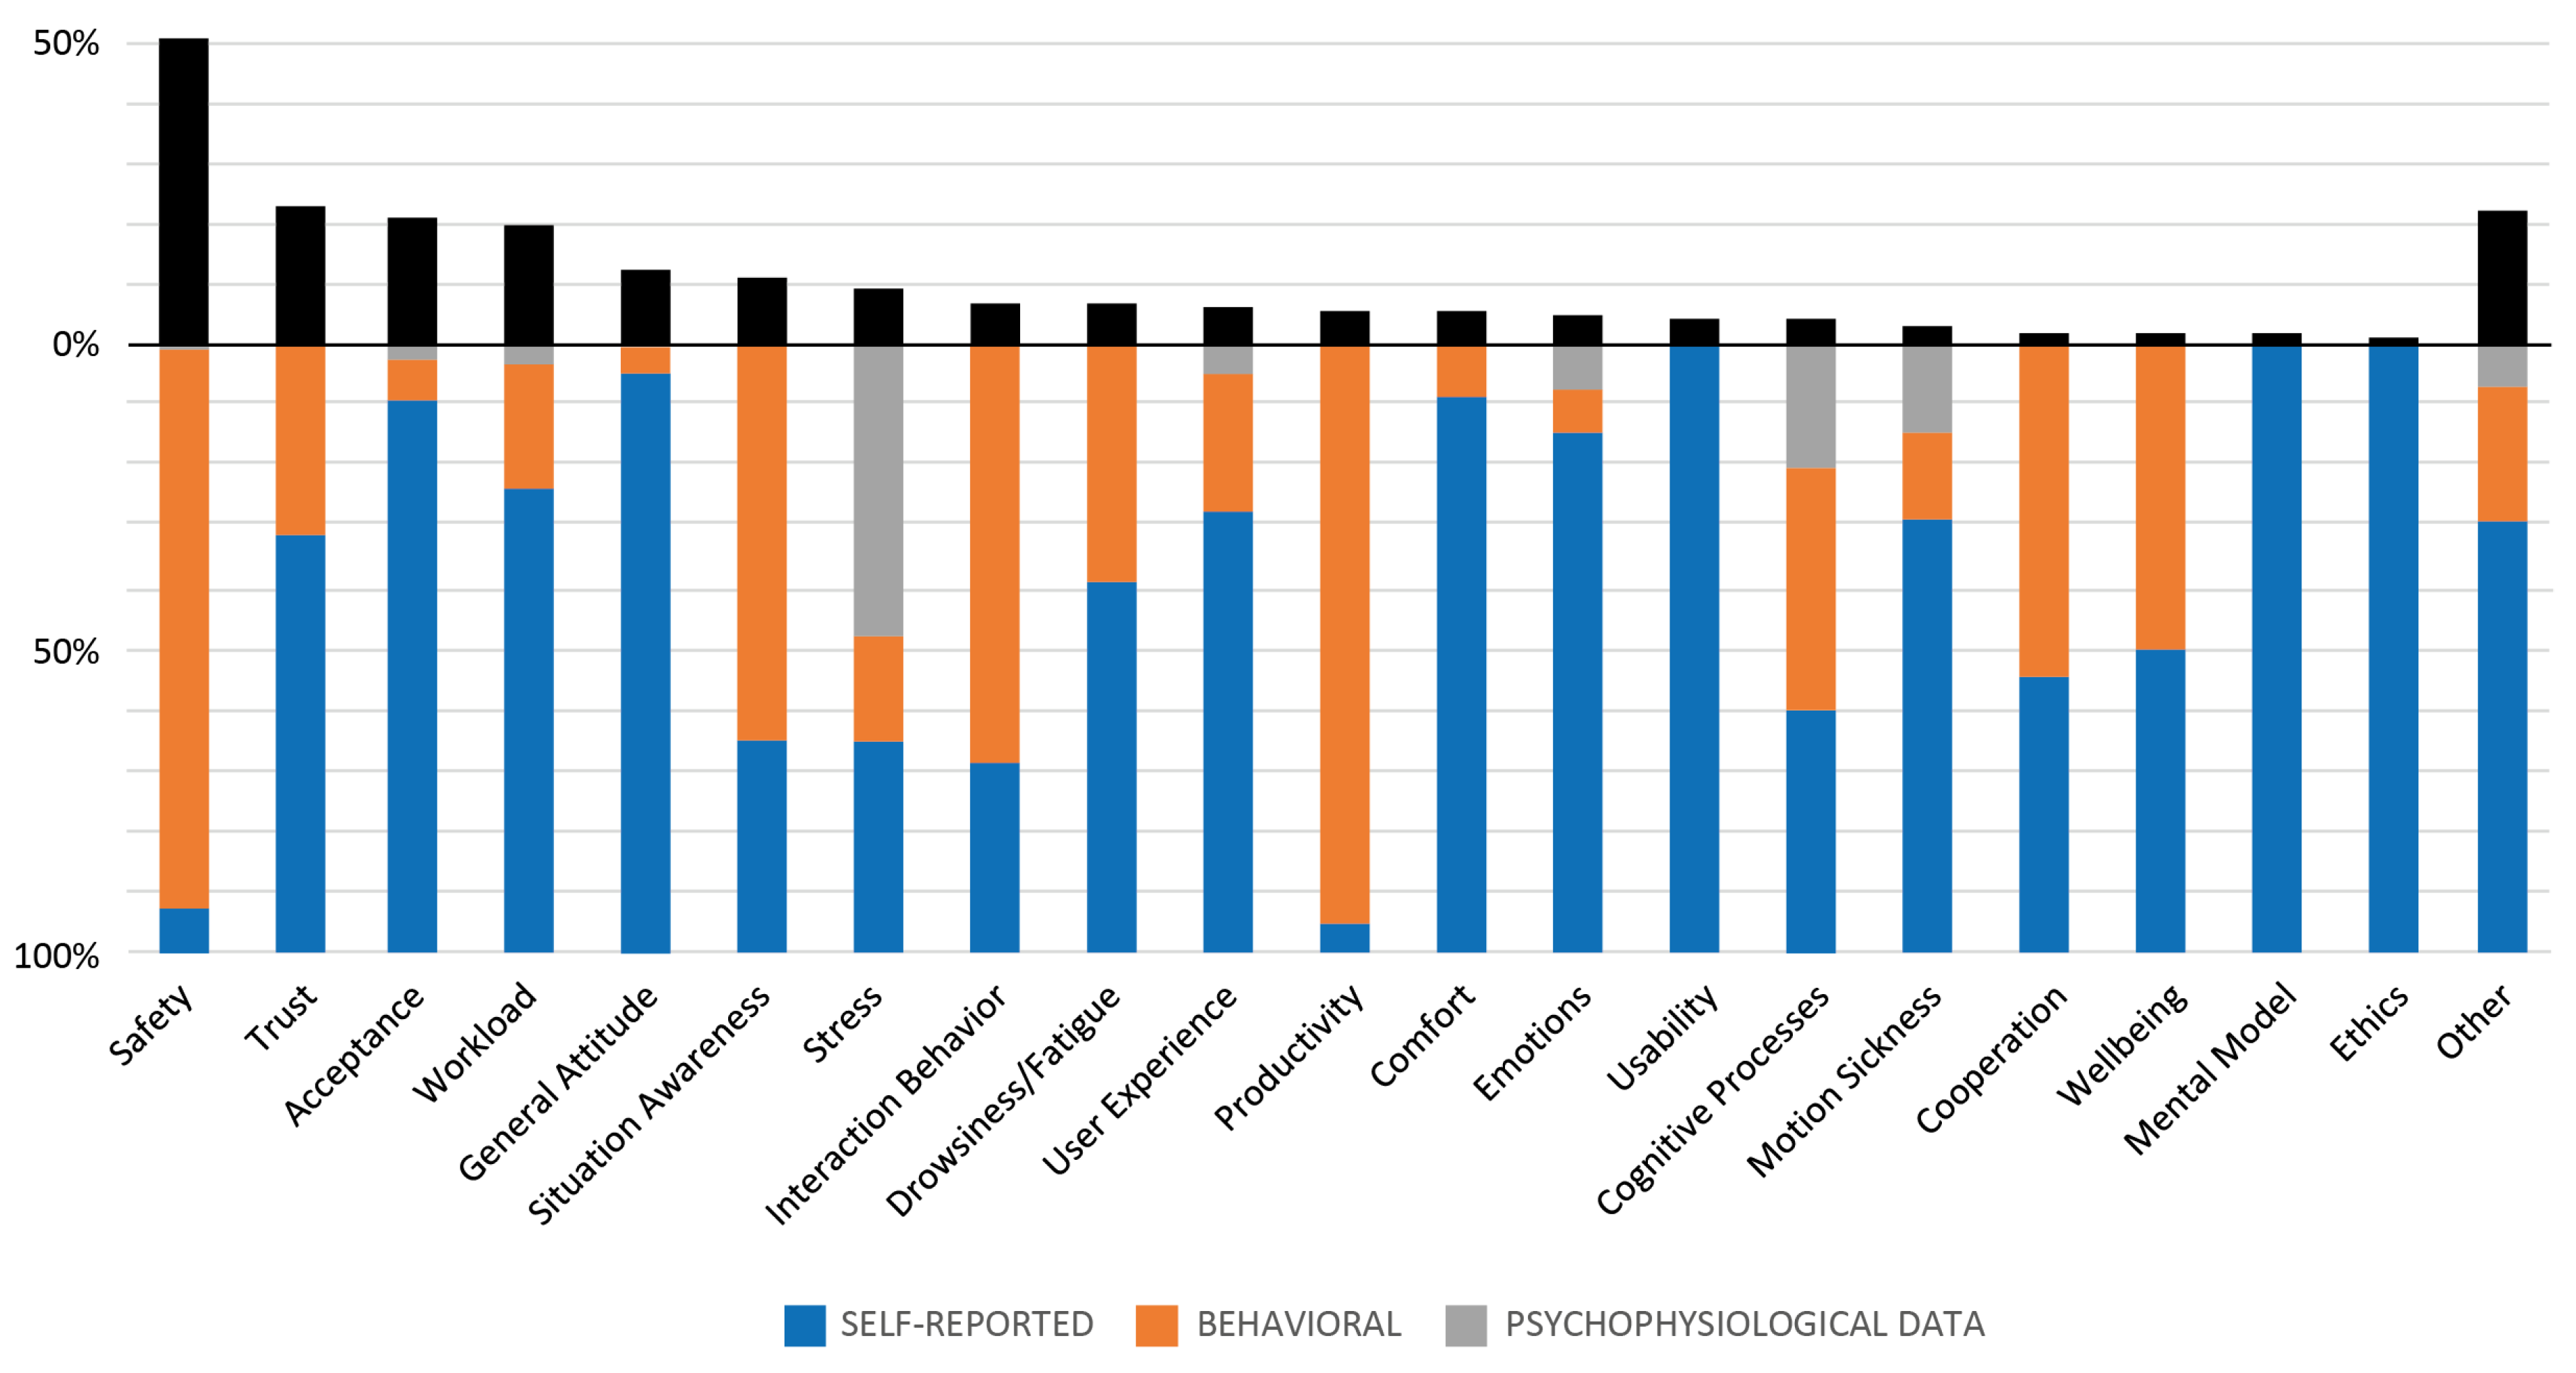
4.3. Constructs and Methodological Approaches
4.3.1. Safety
4.3.2. Trust, Acceptance, and Workload
4.3.3. General Attitude, Situation Awareness, and Stress
4.3.4. Interaction Behavior, Drowsiness/Fatigue, and User Experience
4.3.5. Productivity, Comfort, Emotions, Usability, Cognitive Processes, and Motion Sickness
4.3.6. Other Constructs
5. Discussion of Findings and Recommendations for Future AD Studies
5.1. Study Setup
5.2. Data Collection Methods
5.3. Parameters
5.4. Constructs
6. Limitations
7. Conclusions
- Existing study results obtained in driving simulators should be validated in realistic on-road settings. As most experimental results were obtained in driving simulators (or used even lower degree of realism/immersion), their main findings must urgently be validated in more realistic settings, especially when addressing constructs that incorporate risk (such as trust in automation).
- In contrast to single session experiments, insights into the long-lasting effects of AD usage are scarce and can benefit from longitudinal study designs. Another huge potential for future work are longitudinal studies. Such studies cannot only validate results obtained in single-session experiments: they might even reveal new issues which have not been addressed yet.
- Depending on the particular research question, we suggest going beyond established constructs like safety, trust, acceptance, or workload. In addition, take constructs into account that have not yet been intensively addressed (such as personalization, cooperation, wellbeing, etc.). Cooperation in particular refers to different parties performing as a team together rather than only one party at a time [87]. When designing HMIs for vehicles, consider the full spectrum of user experience research and include user satisfaction (such as hedonic qualities) in HMI evaluation also as these aspects will finally decide between success or defeat of the technology on the market.
- To increase validity, the sample characteristics should be adapted to the addressed research questions. In addition, researchers need to explain why the particular sample was chosen and considered valid. Aim for a participant sample that allows for investigating the proposed research question plausibly. Do not only list a more diverse sample as a limitation, but also discuss how your results could be affected by biases in participant sampling.
- Researchers should consider the collection of more than a single source of data (i.e., triangulating behavioral, psychophysiological, and self-reported data). Insights from self-report measures might be worthy of future research for its effects on user behavior. Evaluation of different types of data sometimes leads to contradicting results. Such conflicts should not be avoided, as in the best case they contribute to a better understanding of established theory. Only comprehensive evaluation of the involved factors allows for drawing meaningful conclusions.
- Consider existing or proposed standards for measurements to allow for comparison of study results. The possibility to compare study results is a key element of scientific practices. Thus, if possible, utilize standardized methods (regarding parameters, their measurement times, as well as their calculation). In case there is no such standard or best practice, instead of inventing additional measurements, build upon related work.
- Clearly communicate which constructs are addressed by an experiment to foster transparency. Minimize the potential for ambiguity. Clearly state which constructs are investigated, and how the selection of methods/parameters used for evaluation are related to them.
Author Contributions
Funding
Conflicts of Interest
References
- SAE. Taxonomy and Definitions for Terms Related to On-Road Motor Vehicle Automated Driving Systems; SAE International: Warrendale, PE, USA, 2018. [Google Scholar]
- Sarter, N.B.; Woods, D.D.; Billings, C.E. Automation surprises. Handb. Hum. Factors Ergon. 1997, 2, 1926–1943. [Google Scholar]
- Billings, C.E. Aviation Automation: The Search for a Human-Centered Approach; CRC Press: Boca Raton, FL, USA, 2018. [Google Scholar]
- Pritchett, A.R. Aviation automation: General perspectives and specific guidance for the design of modes and alerts. Rev. Hum. Factors Ergon. 2009, 5, 82–113. [Google Scholar] [CrossRef]
- AdaptIVe Consortium. Final Human Factors Recommendations (D3.3); 2017. Available online: http://eprints.whiterose.ac.uk/161983/ (accessed on 15 November 2020).
- RESPONSE Consortium. Code of Practice for the Design and Evaluation of ADAS: RESPONSE 3: A PReVENT Project. 2006. Available online: https://www.acea.be/uploads/publications/20090831_Code_of_Practice_ADAS.pdf (accessed on 15 November 2020).
- Hoeger, R.; Zeng, H.; Hoess, A.; Kranz, T.; Boverie, S.; Strauss, M. The Future of Driving—HAVEit (Final Report, Deliverable D61.1); Continental Automotive GmbH: Regensburg, Germany, 2011. [Google Scholar]
- Pettersson, I.; Lachner, F.; Frison, A.K.; Riener, A.; Butz, A. A Bermuda Triangle? A Review of Method Application and Triangulation in User Experience Evaluation. In Proceedings of the 2018 CHI Conference, Montreal, QC, Canada, 21–26 April 2018; pp. 1–16. [Google Scholar] [CrossRef]
- Lamm, L.; Wolff, C. Exploratory Analysis of the Research Literature on Evaluation of In-Vehicle Systems. In Proceedings of the 11th International Conference on Automotive User Interfaces and Interactive Vehicular Applications, Utrecht, The Netherlands, 22–25 September 2019; ACM: New York, NY, USA, 2019; pp. 60–69. [Google Scholar]
- Ayoub, J.; Zhou, F.; Bao, S.; Yang, X.J. From Manual Driving to Automated Driving: A Review of 10 Years of AutoUI. In Proceedings of the 11th International Conference on Automotive User Interfaces and Interactive Vehicular Applications, Utrecht, The Netherlands, 22–25 September 2019; ACM: New York, NY, USA, 2019; pp. 70–90. [Google Scholar]
- Forster, Y.; Hergeth, S.; Naujoks, F.; Krems, J.F. How Usability can Save the Day: Methodological Considerations for Making Automated Driving a Success Story. In Proceedings of the 10th International Conference on Automotive User Interfaces and Interactive Vehicular Applications, Toronto, ON, Canada, 23–25 September 2018. [Google Scholar]
- Naujoks, F.; Mai, C.; Neukum, A. The effect of urgency of take-over requests during highly automated driving under distraction conditions. Adv. Hum. Asp. Transp. 2014, 7, 431. [Google Scholar]
- Gold, C.; Damböck, D.; Lorenz, L.; Bengler, K. “Take over!” How long does it take to get the driver back into the loop? In Proceedings of the Human Factors and Ergonomics Society Annual Meeting, San Diego, CA, USA, 30 September–4 October 2013; SAGE Publications: Los Angeles, CA, USA, 2013. [Google Scholar]
- Merat, N.; Jamson, A.H.; Lai, F.C.; Daly, M.; Carsten, O.M. Transition to manual: Driver behavior when resuming control from a highly automated vehicle. Transp. Res. Part Traffic Psychol. Behav. 2014, 27, 274–282. [Google Scholar] [CrossRef] [Green Version]
- Jarosch, O.; Kuhnt, M.; Paradies, S.; Bengler, K. It’s Out of Our Hands Now! Effects of Non-Driving Related Tasks During Highly Automated Driving on Drivers’ Fatigue. In Proceedings of the 9th International Driving Symposium on Human Factors in Driver Assessment, Training, and Vehicle Design, Manchester Village, VT, USA, 26–29 June 2017. [Google Scholar]
- Neubauer, C.; Matthews, G.; Langheim, L.; Saxby, D. Fatigue and voluntary utilization of automation in simulated driving. Hum. Factors 2012, 54, 734–746. [Google Scholar] [CrossRef]
- Feldhütter, A.; Segler, C.; Bengler, K. Does Shifting Between Conditionally and Partially Automated Driving Lead to a Loss of Mode Awareness? In Proceedings of the International Conference on Applied Human Factors and Ergonomics, Los Angeles, CA, USA, 17–21 July 2017. [Google Scholar]
- Hergeth, S.; Lorenz, L.; Vilimek, R.; Krems, J.F. Keep your scanners peeled: Gaze behavior as a measure of automation trust during highly automated driving. Hum. Factors 2016, 58, 509–519. [Google Scholar] [CrossRef]
- Hergeth, S.; Lorenz, L.; Krems, J.F. Prior familiarization with takeover requests affects drivers’ takeover performance and automation trust. Hum. Factors 2017, 59, 457–470. [Google Scholar] [CrossRef]
- Forster, Y.; Naujoks, F.; Neukum, A. Increasing anthropomorphism and trust in automated driving functions by adding speech output. In Proceedings of the Intelligent Vehicles Symposium (IV), Los Angeles, CA, USA, 11–14 June 2017. [Google Scholar]
- Wintersberger, P.; Riener, A.; Schartmüller, C.; Frison, A.K.; Weigl, K. Let Me Finish before I Take Over: Towards Attention Aware Device Integration in Highly Automated Vehicles. In Proceedings of the 10th International Conference on Automotive User Interfaces and Interactive Vehicular Applications, Toronto, ON, Canada, 23–25 September 2018; ACM: New York, NY, USA, 2018; pp. 53–65. [Google Scholar]
- Merat, N.; Lee, J.D. Preface to the special section on human factors and automation in vehicles: Designing highly automated vehicles with the driver in mind. Hum. Factors 2012, 54, 681–686. [Google Scholar] [CrossRef] [Green Version]
- Nordhoff, S.; de Winter, J.; Madigan, R.; Merat, N.; van Arem, B.; Happee, R. User acceptance of automated shuttles in Berlin-Schöneberg: A questionnaire study. Transp. Res. Part Traffic Psychol. Behav. 2018, 58, 843–854. [Google Scholar] [CrossRef] [Green Version]
- Osswald, S.; Wurhofer, D.; Trösterer, S.; Beck, E.; Tscheligi, M. Predicting information technology usage in the car: Towards a car technology acceptance model. In Proceedings of the 4th International Conference on Automotive User Interfaces and Interactive Vehicular Applications, Portsmouth, NH, USA, 17–19 October 2012. [Google Scholar]
- Kyriakidis, M.; Happee, R.; de Winter, J.C.F. Public opinion on automated driving: Results of an international questionnaire among 5000 respondents. Transp. Res. Part Traffic Psychol. Behav. 2015, 32, 127–140. [Google Scholar] [CrossRef]
- Wintersberger, P.; Riener, A.; Frison, A.K. Automated Driving System, Male, or Female Driver: Who’d You Prefer? Comparative Analysis of Passengers’ Mental Conditions, Emotional States & Qualitative Feedback. In Proceedings of the 8th International Conference on Automotive User Interfaces and Interactive Vehicular Applications, Ann Arbor, MI, USA, 24–26 October 2016; ACM: New York, NY, USA, 2016; pp. 51–58. [Google Scholar]
- Payre, W.; Cestac, J.; Dang, N.T.; Vienne, F.; Delhomme, P. Impact of training and in-vehicle task performance on manual control recovery in an automated car. Transp. Res. Part Traffic Psychol. Behav. 2017, 46, 216–227. [Google Scholar] [CrossRef]
- Wintersberger, P.; Frison, A.K.; Riener, A.; von Sawitzky, T. Fostering User Acceptance and Trust in Fully Automated Vehicles: Evaluating the Potential of Augmented Reality. Presence 2019, 27, 1–17. [Google Scholar] [CrossRef]
- Forster, Y.; Hergeth, S.; Naujoks, F.; Beggiato, M.; Krems, J.F.; Keinath, A. Learning to Use Automation: Behavioral Changes in Interaction with Automated Driving Systems. Transp. Res. Part Traffic Psychol. Behav. 2019, 62, 599–614. [Google Scholar] [CrossRef]
- Naujoks, F.; Hergeth, S.; Wiedemann, K.; Schömig, N.; Forster, Y.; Keinath, A. Test procedure for evaluating the human–machine interface of vehicles with automated driving systems. Traffic Inj. Prev. 2019, 20, S146–S151. [Google Scholar] [CrossRef] [Green Version]
- Rödel, C.; Stadler, S.; Meschtscherjakov, A.; Tscheligi, M. Towards Autonomous Cars. In Proceedings of the 6th International Conference on Automotive User Interfaces and Interactive Vehicular Applications, Seattle, WA, USA, 17–19 September 2014; pp. 1–8. [Google Scholar] [CrossRef]
- Frison, A.K.; Wintersberger, P.; Riener, A.; Schartmüller, C. Driving Hotzenplotz: A Hybrid Interface for Vehicle Control Aiming to Maximize Pleasure in Highway Driving. In Proceedings of the 9th International Conference on Automotive User Interfaces and Interactive Vehicular Applications, Oldenburg, Germany, 24–27 September 2017; pp. 236–244. [Google Scholar]
- Frison, A.K.; Wintersberger, P.; Riener, A.; Schartmüller, C.; Boyle, L.; Miller, E.; Weigl, K. In UX We Trust: Investigation of Aesthetics and Usability of Driver-Vehicle Interfaces and Their Impact on the Perception of Automated Driving. In Proceedings of the 2019 CHI Conference on Human Factors in Computing Systems, Glasgow, UK, 4–9 May 2019; pp. 1–13. [Google Scholar]
- DIN-EN ISO. Ergonomie der Mensch-System-Interaktion—Teil 210: Prozess zur Gestaltung Gebrauchstauglicher Interaktiver Systeme; EIN e.V.: Berlin, Germany, 2011. [Google Scholar]
- Davis, F.D. Perceived Usefulness, Perceived Ease of Use, and User Acceptance of Information Technology. MIS Q. 1989, 13, 319. [Google Scholar] [CrossRef] [Green Version]
- Venkatesh, V.; Morris, M.G.; Davis, G.B.; Davis, F.D. User acceptance of information technology: Toward a unified view. MIS Q. 2003, 27, 425–478. [Google Scholar] [CrossRef] [Green Version]
- Hassenzahl, M.; Beu, A.; Burmester, M. Engineering joy. IEEE Softw. 2001, 18, 70–76. [Google Scholar] [CrossRef]
- Sheldon, K.M.; Elliot, A.J.; Kim, Y.; Kasser, T. What is satisfying about satisfying events? Testing 10 candidate psychological needs. J. Personal. Soc. Psychol. 2001, 80, 325. [Google Scholar] [CrossRef]
- Hassenzahl, M.; Diefenbach, S.; Göritz, A. Needs, affect, and interactive products–Facets of user experience. Interact. Comput. 2010, 22, 353–362. [Google Scholar] [CrossRef]
- Frison, A.K.; Wintersberger, P.; Liu, T.; Riener, A. Why do you like to drive automated?: A context-dependent analysis of highly automated driving to elaborate requirements for intelligent user interfaces. In Proceedings of the 24th International Conference on Intelligent User Interfaces, Los Angeles, CA, USA, 17–20 March 2019; ACM: New York, NY, USA, 2019; pp. 528–537. [Google Scholar]
- Forster, Y.; Naujoks, F.; Neukum, A. Your Turn or My Turn? Design of a Human–Machine Interface for Conditional Automation. In Proceedings of the 8th International Conference on Automotive User Interfaces and Interactive Vehicular Applications, Ann Arbor, MI, USA, 24–26 October 2016; pp. 253–260. [Google Scholar] [CrossRef]
- Louw, T.; Madigan, R.; Carsten, O.; Merat, N. Were they in the loop during automated driving? Links between visual attention and crash potential. Inj. Prev. 2017, 23, 281–286. [Google Scholar] [CrossRef] [Green Version]
- Donmez, B.; Boyle, L.N.; Lee, J.D.; McGehee, D.V. Drivers’ attitudes toward imperfect distraction mitigation strategies. Transp. Res. Part Traffic Psychol. Behav. 2006, 9, 387–398. [Google Scholar] [CrossRef]
- Van Veen, T.; Karjanto, J.; Terken, J. Situation awareness in automated vehicles through proximal peripheral light signals. In Proceedings of the 8th International Conference on Automotive User Interfaces and Vehicular Applications, Ann Arbor, MI, USA, 24–26 October 2016; ACM: New York, NY, USA, 2016; pp. 287–292. [Google Scholar]
- Yusof, N.M.; Karjanto, J.; Terken, J.; Delbressine, F.; Hassan, M.Z.; Rauterberg, M. The Exploration of Autonomous Vehicle Driving Styles. In Proceedings of the 8th International Conference on Automotive User Interfaces and Interactive Vehicular Applications, Ann Arbor, MI, USA, 24–26 October 2016; ACM: New York, NY, USA, 2016; pp. 245–252. [Google Scholar] [CrossRef]
- Trösterer, S.; Meschtscherjakov, A.; Mirnig, A.G.; Lupp, A.; Gärtner, M.; McGee, F.; McCall, R.; Tscheligi, M.; Engel, T. What We Can Learn from Pilots for Handovers and (De)Skilling in Semi-Autonomous Driving. In Proceedings of the 9th International Conference on Automotive User Interfaces and Interactive Vehicular Applications, Oldenburg, Germany, 24–27 September 2017; ACM: New York, NY, USA, 2017; pp. 173–182. [Google Scholar] [CrossRef] [Green Version]
- Dikmen, M.; Burns, C.M. Autonomous driving in the real world: Experiences with tesla autopilot and summon. In Proceedings of the 8th International Conference on Automotive User Interfaces and Interactive Vehicular Applications, Ann Arbor, MI, USA, 24–26 October 2016; ACM: New York, NY, USA, 2016; pp. 225–228. [Google Scholar]
- Omozik, K.; Yang, Y.; Kuntermann, I.; Hergeth, S.; Bengler, K. How long does it take to relax? Observation of driver behaviors during real-world conditionally automated driving. In Proceedings of the 10th International Driving Symposium on Human Factors in Driver Assessment, Training, and Vehicle Design, Santa Fe, NM, USA, 24–27 June 2019. [Google Scholar]
- Naujoks, F.; Purucker, C.; Wiedemann, K.; Marberger, C. Noncritical State Transitions During Conditionally Automated Driving on German Freeways: Effects of Non–Driving Related Tasks on Takeover Time and Takeover Quality. Hum. Factors 2019, 61, 1–18. [Google Scholar] [CrossRef] [PubMed]
- Wintersberger, P.; Frison, A.K.; Riener, A. Man vs. Machine: Comparing a Fully Automated Bus Shuttle with a Manually Driven Group Taxi in a Field Study. In Proceedings of the 10th International Conference on Automotive User Interfaces and Interactive Vehicular Applications, Toronto, ON, Canada, 23–25 September 2018; ACM: New York, NY, USA, 2018; pp. 215–220. [Google Scholar]
- Reig, S.; Norman, S.; Morales, C.G.; Das, S.; Steinfeld, A.; Forlizzi, J. A Field Study of Pedestrians and Autonomous Vehicles. In Proceedings of the 10th International Conference on Automotive User Interfaces and Interactive Vehicular Applications (AutomotiveUI’18), Toronto, ON, Canada, 23–25 September 2018; ACM: New York, NY, USA, 2018; pp. 198–209. [Google Scholar] [CrossRef]
- Kunze, A.; Summerskill, S.; Marshall, R.; Filtness, A. Augmented Reality Displays for Communicating Uncertainty Information in Automated Driving. In Proceedings of the 10th International Conference on Automotive User Interfaces and Interactive Vehicular Applications, Toronto, ON, Canada, 23–25 September 2018; ACM Press: New York, NY, USA, 2018; pp. 164–175. [Google Scholar]
- Hock, P.; Kraus, J.; Walch, M.; Lang, N.; Baumann, M. Elaborating Feedback Strategies for Maintaining Automation in Highly Automated Driving. In Proceedings of the 8th International Conference on Automotive User Interfaces and Interactive Vehicular Applications, Ann Arbor, MI, USA, 24–26 October 2016; pp. 105–112. [Google Scholar] [CrossRef]
- Chang, C.M.; Toda, K.; Sakamoto, D.; Igarashi, T. Eyes on a Car: An Interface Design for Communication between an Autonomous Car and a Pedestrian. In Proceedings of the 9th International Conference on Automotive User Interfaces and Interactive Vehicular Applications, Oldenburg, Germany, 24–27 September 2017; ACM: New York, NY, USA, 2017; pp. 65–73. [Google Scholar] [CrossRef]
- Van der Meulen, H.; Kun, A.L.; Janssen, C.P. Switching Back to Manual Driving: How Does it Compare to Simply Driving Away After Parking? In Proceedings of the 8th International Conference on Automotive User Interfaces and Vehicular Applications, Ann Arbor, MI, USA, 24–26 October 2016; ACM: New York, NY, USA, 2016; pp. 229–236. [Google Scholar]
- Sikkenk, M.; Terken, J. Rules of conduct for autonomous vehicles. In Proceedings of the 7th International Conference on Automotive User Interfaces and Interactive Vehicular Applications, Nottingham, UK, 1–3 September 2015; ACM: New York, NY, USA, 2015; pp. 19–22. [Google Scholar]
- Balters, S.; Sibi, S.; Johns, M.; Steinert, M.; Ju, W. Learning-by-Doing: Using Near Infrared Spectroscopy to Detect Habituation and Adaptation in Automated Driving. In Proceedings of the 9th International Conference on Automotive User Interfaces and Interactive Vehicular Applications, Oldenburg, Germany, 24–27 September 2017; ACM: New York, NY, USA, 2017; pp. 134–143. [Google Scholar] [CrossRef]
- McCall, R.; McGee, F.; Meschtscherjakov, A.; Louveton, N.; Engel, T. Towards a taxonomy of autonomous vehicle handover situations. In Proceedings of the 8th International Conference on Automotive User Interfaces and Interactive Vehicular Applications, Ann Arbor, MI, USA, 24–26 October 2016; ACM: New York, NY, USA, 2016; pp. 193–200. [Google Scholar]
- Wintersberger, P.; Green, P.; Riener, A. Am I driving or are you or are we both? A taxonomy for handover and handback in automated driving. In Proceedings of the 9th International Driving Symposium on Human Factors in Driver Assessment, Training, and Vehicle Design, Manchester Village, VT, USA, 26–29 June 2017. [Google Scholar]
- Naujoks, F.; Hergeth, S.; Wiedemann, K.; Schömig, N.; Keinath, A. Use Cases for Assessing, Testing, and Validating the Human Machine Interface of Automated Driving Systems. In Proceedings of the Human Factors and Ergonomics Society Annual Meeting, Philadelphia, PA, USA, 1–5 October 2018; Sage Publications: Los Angeles, CA, USA, 2018; pp. 1873–1877. [Google Scholar]
- Gold, C.; Naujoks, F.; Radlmayr, J.; Bellem, H.; Jarosch, O. Testing Scenarios for Human Factors Research in Level 3 Automated Vehicles. In Proceedings of the International Conference on Applied Human Factors and Ergonomics, Los Angeles, CA, USA, 17–21 July 2017; Springer: Berlin/Heidelberg, Germany; Los Angeles, CA, USA, 2017. [Google Scholar]
- Forster, Y.; Hergeth, S.; Naujoks, F.; Krems, J.F. Unskilled and Unaware: Subpar Users of Automated Driving Systems Make Spurious Decisions. In Proceedings of the 10th International Conference on Automotive User Interfaces and Interactive Vehicular Applications, Toronto, ON, Canada, 23–25 September 2018; ACM: New York, NY, USA, 2018; pp. 159–163. [Google Scholar]
- Millonig, A.; Fröhlich, P. Where Autonomous Buses Might and Might Not Bridge the Gaps in the 4 A’s of Public Transport Passenger Needs: A Review. In Proceedings of the 10th International Conference on Automotive User Interfaces and Interactive Vehicular Applications, Toronto, ON, Canada, 23–25 September 2018; ACM: New York, NY, USA, 2018; pp. 291–297. [Google Scholar]
- Inners, M.; Kun, A.L. Beyond liability: Legal issues of human-machine interaction for automated vehicles. In Proceedings of the 9th International Conference on Automotive User Interfaces and Interactive Vehicular Applications, Oldenburg, Germany, 24–27 September 2017; ACM: New York, NY, USA, 2017; pp. 245–253. [Google Scholar]
- Roider, F.; Rümelin, S.; Pfleging, B.; Gross, T. The effects of situational demands on gaze, speech and gesture input in the vehicle. In Proceedings of the 9th International Conference on Automotive User Interfaces and Interactive Vehicular Applications, Oldenburg, Germany, 24–27 September 2017; ACM: New York, NY, USA, 2017; pp. 94–102. [Google Scholar]
- Merenda, C.; Kim, H.; Gabbard, J.L.; Leong, S.; Large, D.R.; Burnett, G. Did You See Me?: Assessing Perceptual vs. Real Driving Gains Across Multi-Modal Pedestrian Alert Systems. In Proceedings of the 9th International Conference on Automotive User Interfaces and Interactive Vehicular Applications, Oldenburg, Germany, 24–27 September 2017; ACM: New York, NY, USA, 2017; pp. 40–49. [Google Scholar]
- Liu, R.; Kwak, D.; Devarakonda, S.; Bekris, K.; Iftode, L. Investigating remote driving over the LTE network. In Proceedings of the 9th International Conference on Automotive User Interfaces and Interactive Vehicular Applications, Oldenburg, Germany, 24–27 September 2017; ACM: New York, NY, USA, 2017; pp. 264–269. [Google Scholar]
- Knappe, G.; Keinath, A.; Meinecke, C. Empfehlungen für die Bestimmung der Spurhaltegüte im Kontext der Fahrsimulation. MMI-Interakt. 2006, 11, 3–13. [Google Scholar]
- Hart, S.G.; Staveland, L.E. Development of NASA-TLX (Task Load Index): Results of empirical and theoretical research. In Advances in Psychology; Elsevier: Amsterdam, The Netherlands, 1988; Volume 52, pp. 139–183. [Google Scholar]
- Lee, J.; Kim, N.; Imm, C.; Kim, B.; Yi, K.; Kim, J. A question of trust: An ethnographic study of automated cars on real roads. In Proceedings of the 8th International Conference on Automotive User Interfaces and Interactive Vehicular Applications, Ann Arbor, MI, USA, 24–26 October 2016; ACM: New York, NY, USA, 2016; pp. 201–208. [Google Scholar]
- Currano, R.; Park, S.Y.; Domingo, L.; Garcia-Mancilla, J.; Santana-Mancilla, P.C.; Gonzalez, V.M.; Ju, W. ¡Vamos!: Observations of Pedestrian Interactions with Driverless Cars in Mexico. In Proceedings of the 10th International Conference on Automotive User Interfaces and Interactive Vehicular Applications, Toronto, ON, Canada, 23–25 September 2018; ACM: New York, NY, USA, 2018; pp. 210–220. [Google Scholar]
- Telpaz, A.; Rhindress, B.; Zelman, I.; Tsimhoni, O. Haptic seat for automated driving: Preparing the driver to take control effectively. In Proceedings of the 7th International Conference on Automotive User Interfaces and Interactive Vehicular Applications, Nottingham, UK, 1–3 September 2015; ACM: New York, NY, USA, 2015; pp. 23–30. [Google Scholar]
- Frison, A.K.; Aigner, L.; Wintersberger, P.; Riener, A. Who is Generation A?: Investigating the Experience of Automated Driving for Different Age Groups. In Proceedings of the 10th International Conference on Automotive User Interfaces and Interactive Vehicular Applications, Toronto, ON, Canada, 23–25 September 2018; ACM: New York, NY, USA, 2018; pp. 94–104. [Google Scholar]
- Forster, Y.; Kraus, J.; Feinauer, S.; Baumann, M. Calibration of Trust Expectancies in Conditionally Automated Driving by Brand, Reliability Information and Introductionary Videos: An Online Study. In Proceedings of the 10th International Conference on Automotive User Interfaces and Interactive Vehicular Applications (AutomotiveUI’18), Toronto, ON, Canada, 23–25 September 2018; ACM: New York, NY, USA, 2018; pp. 118–128. [Google Scholar] [CrossRef]
- Bashiri, B.; Mann, D.D. Drivers’ mental workload in agricultural semi-autonomous vehicles. In Proceedings of the Human Factors and Ergonomics Society Annual Meeting, San Diego, CA, USA, 30 September–4 October 2013; SAGE Publications: Los Angeles, CA, USA, 2013; Volume 57, pp. 1795–1799. [Google Scholar]
- Biondi, F.N.; Lohani, M.; Hopman, R.; Mills, S.; Cooper, J.M.; Strayer, D.L. 80 MPH and out-of-the-loop: Effects of real-world semi-automated driving on driver workload and arousal. In Proceedings of the Human Factors and Ergonomics Society Annual Meeting, Philadelphia, PA, USA, 1–5 October 2018; SAGE Publications: Los Angeles, CA, USA, 2018; Volume 62, pp. 1878–1882. [Google Scholar]
- Maurer, S.; Erbach, R.; Kraiem, I.; Kuhnert, S.; Grimm, P.; Rukzio, E. Designing a Guardian Angel: Giving an Automated Vehicle the Possibility to Override Its Driver. In Proceedings of the 10th International Conference on Automotive User Interfaces and Interactive Vehicular Applications (AutomotiveUI’18), Toronto, ON, Canada, 23–25 September 2018. [Google Scholar]
- Clark, H.; McLaughlin, A.C.; Feng, J. Situational Awareness and Time to Takeover: Exploring an Alternative Method to Measure Engagement with High-Level Automation. In Proceedings of the Human Factors and Ergonomics Society Annual Meeting, Austin, TX, USA, 9–13 October 2017; SAGE Publications: Los Angeles, CA, USA, 2017; Volume 61, pp. 1452–1456. [Google Scholar]
- Karjanto, J.; Yusof, N.M.; Wang, C.; Terken, J.; Delbressine, F.; Rauterberg, M. The effect of peripheral visual feedforward system in enhancing situation awareness and mitigating motion sickness in fully automated driving. Transp. Res. Part Traffic Psychol. Behav. 2018, 58, 678–692. [Google Scholar] [CrossRef]
- Naujoks, F.; Höfling, S.; Purucker, C.; Zeeb, K. From partial and high automation to manual driving: Relationship between non-driving related tasks, drowsiness and take-over performance. Accid. Anal. Prev. 2018, 121, 28–42. [Google Scholar] [CrossRef]
- Oliveira, L.; Luton, J.; Iyer, S.; Burns, C.; Mouzakitis, A.; Jennings, P.; Birrell, S. Evaluating How Interfaces Influence the User Interaction with Fully Autonomous Vehicles. In Proceedings of the 10th International Conference on Automotive User Interfaces and Interactive Vehicular Applications (AutomotiveUI’18), Toronto, ON, Canada, 23–25 September 2018; ACM: New York, NY, USA, 2018; pp. 320–331. [Google Scholar] [CrossRef] [Green Version]
- Reimer, B.; Pettinato, A.; Fridman, L.; Lee, J.; Mehler, B.; Seppelt, B.; Park, J.; Iagnemma, K. Behavioral Impact of Drivers’ Roles in Automated Driving. In Proceedings of the 8th International Conference on Automotive User Interfaces and Interactive Vehicular Applications (Automotive’UI 16), Ann Arbor, MI, USA, 24–26 October 2016; ACM: New York, NY, USA, 2016; pp. 217–224. [Google Scholar] [CrossRef] [Green Version]
- Bellem, H.; Klüver, M.; Schrauf, M.; Schöner, H.P.; Hecht, H.; Krems, J.F. Can we study autonomous driving comfort in moving-base driving simulators? A validation study. Hum. Factors 2017, 59, 442–456. [Google Scholar] [CrossRef]
- Terken, Z.; Haex, R.; Beursgens, L.; Arslanova, E.; Vrachni, M.; Terken, J.; Szostak, D. Unwinding After Work: An In-car Mood Induction System for Semi-autonomous Driving. In Proceedings of the 5th International Conference on Automotive User Interfaces and Interactive Vehicular Applications (AutomotiveUI’13), Eindhoven, The Netherlands, 28–30 October 2013; ACM: New York, NY, USA, 2013; pp. 246–249. [Google Scholar] [CrossRef]
- Glatz, C.; Krupenia, S.S.; Bülthoff, H.H.; Chuang, L.L. Use the right sound for the right job: Verbal commands and auditory icons for a task-management system favor different information processes in the brain. In Proceedings of the 2018 CHI Conference on Human Factors in Computing Systems, Montreal, QC, Canada, 21–26 April 2018; ACM: New York, NY, USA, 2018; p. 472. [Google Scholar]
- Guo, C.; Sentouh, C.; Popieul, J.C.; Haué, J.B.; Langlois, S.; Loeillet, J.J.; Soualmi, B.; That, T.N. Cooperation between driver and automated driving system: Implementation and evaluation. Transp. Res. Part Traffic Psychol. Behav. 2017. [Google Scholar] [CrossRef]
- Walch, M.; Sieber, T.; Hock, P.; Baumann, M.; Weber, M. Towards Cooperative Driving: Involving the Driver in an Autonomous Vehicle’s Decision Making. In Proceedings of the 8th International Conference on Automotive User Interfaces and Interactive Vehicular Applications, Ann Arbor, MI, USA, 24–26 October 2016; ACM: New York, NY, USA, 2016; pp. 261–268. [Google Scholar]
- Beggiato, M.; Pereira, M.; Petzoldt, T.; Krems, J.F. Learning and development of trust, acceptance and the mental model of ACC. A longitudinal on-road study. Transp. Res. Part Traffic Psychol. Behav. 2015, 35, 75–84. [Google Scholar] [CrossRef]
- Mattes, S. The lane-change-task as a tool for driver distraction evaluation. Qual. Work. Prod. Enterp. Future 2003, 57, 60. [Google Scholar]
- Naujoks, F.; Purucker, C.; Neukum, A.; Wolter, S.; Steiger, R. Controllability of partially automated driving functions–does it matter whether drivers are allowed to take their hands off the steering wheel? Transp. Res. Part Traffic Psychol. Behav. 2015, 35, 185–198. [Google Scholar] [CrossRef]
- Jian, J.Y.; Bisantz, A.M.; Drury, C.G. Foundations for an empirically determined scale of trust in automated systems. Int. J. Cogn. Ergon. 2000, 4, 53–71. [Google Scholar] [CrossRef]
- Rotter, J.B. A new scale for the measurement of interpersonal trust 1. J. Personal. 1967, 35, 651–665. [Google Scholar] [CrossRef]
- McKnight, D.H.; Choudhury, V.; Kacmar, C. Developing and validating trust measures for e-commerce: An integrative typology. Inf. Syst. Res. 2002, 13, 334–359. [Google Scholar] [CrossRef] [Green Version]
- Van Der Laan, J.D.; Heino, A.; De Waard, D. A simple procedure for the assessment of acceptance of advanced transport telematics. Transp. Res. Part Emerg. Technol. 1997, 5, 1–10. [Google Scholar] [CrossRef]
- Schaefer, K.E. Measuring trust in human robot interactions: Development of the “trust perception scale-HRI”. In Robust Intelligence and Trust in Autonomous Systems; Springer: Berlin/Heidelberg, Germany, 2016; pp. 191–218. [Google Scholar]
- Merritt, S.M.; Heimbaugh, H.; LaChapell, J.; Lee, D. I trust it, but I don’t know why: Effects of implicit attitudes toward automation on trust in an automated system. Hum. Factors 2013, 55, 520–534. [Google Scholar] [CrossRef] [PubMed]
- Helldin, T.; Falkman, G.; Riveiro, M.; Davidsson, S. Presenting system uncertainty in automotive UIs for supporting trust calibration in autonomous driving. In Proceedings of the 5th International Conference on Automotive User Interfaces and Interactive Vehicular Applications, Eindhoven, The Netherlands, 28–30 October 2013; ACM: New York, NY, USA, 2013; pp. 210–217. [Google Scholar]
- Pauzié, A. A method to assess the driver mental workload: The driving activity load index (DALI). IET Intell. Transp. Syst. 2008, 2, 315–322. [Google Scholar] [CrossRef]
- Zijlstra, F.R.H. Efficiency in Work Behaviour: A Design Approach for Modern Tools. Ph.D. Dissertation, Delft Technical University, Delft University Press, Delft, The Netherlands, 1993. [Google Scholar]
- Eilers, K.; Nachreiner, F.; Hänecke, K. Entwicklung und Überprüfung einer Skala zur Erfassung subjektiv erlebter Anstrengung. Z. Arbeitswissenschaft 1986, 4, 214–224. [Google Scholar]
- Wierwille, W.W.; Casali, J.G. A validated rating scale for global mental workload measurement applications. In Proceedings of the Human Factors society Annual Meeting, Norfolk, VI, USA, 10–14 October 1983; Sage Publications: Los Angeles, CA, USA, 1983; Volume 27, pp. 129–133. [Google Scholar]
- Endsley, M.R. Situation awareness global assessment technique (SAGAT). In Proceedings of the IEEE 1988 National Aerospace and Electronics Conference, Dayton, OH, USA, 23–27 May 1988; pp. 789–795. [Google Scholar]
- Helton, W.S. Validation of a short stress state questionnaire. In Proceedings of the Human Factors and Ergonomics Society Annual Meeting, New Orleans, LA, USA, 20–24 September 2004; SAGE Publications: Los Angeles, CA, USA, 2004; Volume 48, pp. 1238–1242. [Google Scholar]
- Matthews, G.; Szalma, J.; Panganiban, A.R.; Neubauer, C.; Warm, J.S. Profiling task stress with the dundee stress state questionnaire. Psychol. Stress. New Res. 2013, 1, 49–90. [Google Scholar]
- Matthews, G.; Desmond, P.A.; Joyner, L.; Carcary, B.; Gilliland, K. Validation of the driver stress inventory and driver coping questionnaire. In Proceedings of the International Conference on Traffic and Transport Psychology, Valencia, Spain, 22–25 May 1996; pp. 1–27. [Google Scholar]
- Deb, S.; Strawderman, L.; DuBien, J.; Smith, B.; Carruth, D.W.; Garrison, T.M. Evaluating pedestrian behavior at crosswalks: Validation of a pedestrian behavior questionnaire for the US population. Accid. Anal. Prev. 2017, 106, 191–201. [Google Scholar] [CrossRef]
- Hoyle, R.H.; Stephenson, M.T.; Palmgreen, P.; Lorch, E.P.; Donohew, R.L. Reliability and validity of a brief measure of sensation seeking. Personal. Individ. Differ. 2002, 32, 401–414. [Google Scholar] [CrossRef]
- Ajzen, I. The theory of planned behavior. Organ. Behav. Hum. Decis. Process. 1991, 50, 179–211. [Google Scholar] [CrossRef]
- Shahid, A.; Wilkinson, K.; Marcu, S.; Shapiro, C.M. Karolinska sleepiness scale (KSS). In STOP, THAT and One Hundred Other Sleep Scales; Springer: Berlin/Heidelberg, Germany, 2011; pp. 209–210. [Google Scholar]
- Matthews, G.; Desmond, P.A.; Joyner, L.; Carcary, B.; Gilliland, K. A comprehensive questionnaire measure of driver stress and affect. Traffic Transp. Psychol. Theory Appl. 1997, 317–324. [Google Scholar]
- Smets, E.; Garssen, B.; Bonke, B.D.; De Haes, J. The Multidimensional Fatigue Inventory (MFI) psychometric qualities of an instrument to assess fatigue. J. Psychosom. Res. 1995, 39, 315–325. [Google Scholar] [CrossRef] [Green Version]
- Kujala, S.; Roto, V.; Väänänen-Vainio-Mattila, K.; Karapanos, E.; Sinnelä, A. UX Curve: A method for evaluating long-term user experience. Interact. Comput. 2011, 23, 473–483. [Google Scholar] [CrossRef]
- Hassenzahl, M.; Burmester, M.; Koller, F. AttrakDiff: Ein Fragebogen zur Messung wahrgenommener hedonischer und pragmatischer Qualität. In Mensch & Computer 2003; Springer: Berlin/Heidelberg, Germany, 2003; pp. 187–196. [Google Scholar]
- Laugwitz, B.; Held, T.; Schrepp, M. Construction and evaluation of a user experience questionnaire. In Symposium of the Austrian HCI and Usability Engineering Group; Springer: Berlin/Heidelberg, Germany, 2008; pp. 63–76. [Google Scholar]
- Rice, S.; Winter, S. A quick affect scale: Providing evidence for validity and reliability. In Proceedings of the 10th International Conference on Interdisciplinary Social Sciences, Split, Croatia, 11–14 June 2015. [Google Scholar]
- Kennedy, R.S.; Lane, N.E.; Berbaum, K.S.; Lilienthal, M.G. Simulator sickness questionnaire: An enhanced method for quantifying simulator sickness. Int. J. Aviat. Psychol. 1993, 3, 203–220. [Google Scholar] [CrossRef]
- Gianaros, P.J.; Muth, E.R.; Mordkoff, J.T.; Levine, M.E.; Stern, R.M. A questionnaire for the assessment of the multiple dimensions of motion sickness. Aviat. Space Environ. Med. 2001, 72, 115. [Google Scholar]
- Nielsen, J.; Levy, J. Measuring usability: Preference vs. performance. Commun. ACM 1994, 37, 66–76. [Google Scholar] [CrossRef]
- Endsley, M.R. The divergence of objective and subjective situation awareness: A meta-analysis. J. Cogn. Eng. Decis. Mak. 2020, 14, 34–53. [Google Scholar] [CrossRef]
- Hancock, P.A.; Matthews, G. Workload and performance: Associations, insensitivities, and dissociations. Hum. Factors 2019, 61, 374–392. [Google Scholar] [CrossRef]
- Slater, M. A note on presence terminology. Presence Connect 2003, 3, 1–5. [Google Scholar]
- Will, S. Development of a Presence Model for Driving Simulators Based on Speed Perception in a Motorcycle Riding Simulator. Ph.D. Thesis, University of Wuerzburg, Wuerburg, Germany, 2017. [Google Scholar]
- Naujoks, F.; Befelein, D.; Wiedemann, K.; Neukum, A. A review of non-driving-related tasks used in studies on automated driving. In Proceedings of the International Conference on Applied Human Factors and Ergonomics, Los Angeles, CA, USA, 17–21 July 2017; Springer: Los Angeles, CA, USA, 2017; pp. 525–537. [Google Scholar]
- Wandtner, B. Non-Driving Related Tasks in Highly Automated Driving—Effects of Task Characteristics and Drivers’ Self-Regulation on Take-Over Performance. Ph.D. Thesis, University of Wuerzburg, Wuerzburg, Germany, 2018. [Google Scholar]
- State of California. Disengagement Report; Department of Motor Vehicles: Sacramento, CA, USA, 2017.
- Fisher, D.L.; Rizzo, M.; Caird, J.; Lee, J.D. Handbook of Driving Simulation for Engineering, Medicine, and Psychology; CRC Press: Boca Raton, FL, USA, 2011. [Google Scholar]
- Kemeny, A.; Panerai, F. Evaluating perception in driving simulation experiments. Trends Cogn. Sci. 2003, 7, 31–37. [Google Scholar] [CrossRef]
- Hock, P.; Kraus, J.; Babel, F.; Walch, M.; Rukzio, E.; Baumann, M. How to Design Valid Simulator Studies for Investigating User Experience in Automated Driving: Review and Hands-On Considerations. In Proceedings of the 10th International Conference on Automotive User Interfaces and Interactive Vehicular Applications, Toronto, ON, Canada, 23–25 September 2018; ACM: New York, NY, USA, 2018; pp. 105–117. [Google Scholar]
- Banks, V.A.; Eriksson, A.; O’Donoghue, J.; Stanton, N.A. Is partially automated driving a bad idea? Observations from an on-road study. Appl. Ergon. 2018, 68, 138–145. [Google Scholar] [CrossRef] [PubMed] [Green Version]
- Pettersson, I.; Ju, W. Design techniques for exploring automotive interaction in the drive towards automation. In Proceedings of the 2017 Conference on Designing Interactive Systems, Edinburgh, UK, 10–14 June 2017; ACM: New York, NY, USA, 2017; pp. 147–160. [Google Scholar]
- Lee, J.D.; Moray, N. Trust, control strategies and allocation of function in human-machine systems. Ergonomics 1992, 35, 1243–1270. [Google Scholar] [CrossRef] [PubMed]
- Lee, J.D.; See, K.A. Trust in automation: Designing for appropriate reliance. Hum. Factors 2004, 46, 50–80. [Google Scholar] [CrossRef]
- Metz, B.; Landau, A.; Just, M. Frequency of secondary tasks in driving–Results from naturalistic driving data. Saf. Sci. 2014, 68, 195–203. [Google Scholar] [CrossRef]
- Dingus, T.A.; Klauer, S.G.; Neale, V.L.; Petersen, A.; Lee, S.E.; Sudweeks, J.; Perez, M.A.; Hankey, J.; Ramsey, D.; Gupta, S.; et al. The 100-Car Naturalistic Driving Study. Phase 2: Results of the 100-Car Field Experiment; Technical Report; Department of Transportation, National Highway Traffic Safety Administration (NHTSA): Washington, DC, USA, 2006.
- Gaspar, J.; Carney, C. The Effect of Partial Automation on Driver Attention: A Naturalistic Driving Study. Hum. Factors 2019, 61, 1261–1276. [Google Scholar] [CrossRef]
- L3 Pilot Consortium. Deliverable D3.1 From Research Questions to Logging Requirements. 2018. Available online: https://cris.vtt.fi/en/publications/from-research-questions-to-logging-requirements-l3pilot-deliverab (accessed on 15 November 2020).
- Löcken, A.; Heuten, W.; Boll, S. Enlightening Drivers: A Survey on In-Vehicle Light Displays. In Proceedings of the 8th International Conference on Automotive User Interfaces and Interactive Vehicular Applications, Ann Arbor, MI, USA, 24–26 October 2016; pp. 97–104. [Google Scholar]
- Just, M.A.; Carpenter, P.A. The role of eye-fixation research in cognitive psychology. Behav. Res. Methods Instrum. 1976, 8, 139–143. [Google Scholar] [CrossRef] [Green Version]
- Kenntner-Mabiala, R.; Kaussner, Y.; Hoffmann, S.; Volk, M. Driving performance of elderly drivers in comparison to middle-aged drivers during a representative, standardized driving test. Z. Verkehrsscherheit 2016, 3, 73. [Google Scholar]
- Naujoks, F.; Wiedemann, K.; Schömig, N.; Jarosch, O.; Gold, C. Expert-based controllability assessment of control transitions from automated to manual driving. MethodsX 2018, 5, 579–592. [Google Scholar] [CrossRef]
- Jarosch, O.; Bengler, K. Rating of Take-Over Performance in Conditionally Automated Driving Using an Expert-Rating System. In Proceedings of the International Conference on Applied Human Factors and Ergonomics, Orlando, FL, USA, 22–26 July 2018; Springer: Los Angeles, CA, USA, 2018. [Google Scholar]
- Pettersson, I.; Frison, A.K.; Lachner, F.; Riener, A.; Nolhage, J. Triangulation in UX Studies: Learning from Experience. In Proceedings of the 2017 ACM Conference Companion Publication, Denver, CO, USA, 6–11 May 2017; pp. 341–344. [Google Scholar] [CrossRef]
- AAM. Statement of Principles, Criteria and Verification Procedures on Driver Interactions with Advanced In-Vehicle Information and Communication Systems; Alliance of Automobile Manufactures: Washington, DC, USA, 2006. [Google Scholar]
- NHTSA. Visual-Manual NHTSA Driver Distraction Guidelines for In-Vehicle Electronic Devices; National Highway Traffic Safety Administration (NHTSA), Department of Transportation (DOT): Washington, DC, USA, 2012.
- Damböck, D.; Bengler, K. Übernahmezeiten beim hochautomatisierten Fahren. In 5. Tagung Fahrerassistenz; Unfallforschung der Versicherer: Munich, Germany, 2012. [Google Scholar]
- Ghazizadeh, M.; Lee, J.D.; Boyle, L.N. Extending the Technology Acceptance Model to assess automation. Cogn. Technol. Work 2012, 14, 39–49. [Google Scholar] [CrossRef]
- Eriksson, A.; Stanton, N.A. Takeover time in highly automated vehicles: Noncritical transitions to and from manual control. Hum. Factors 2017, 59, 689–705. [Google Scholar] [CrossRef] [PubMed]
- Frison, A.K.; Wintersberger, P.; Riener, A. Resurrecting the ghost in the shell: A need-centered development approach for optimizing user experience in highly automated vehicles. Transp. Res. Part Traffic Psychol. Behav. 2019, 65, 439–456. [Google Scholar] [CrossRef]
- Frison, A.K.; Wintersberger, P.; Oberhofer, A.; Riener, A. ATHENA: Supporting UX of Conditionally Automated Driving with Natural Language Reliability Displays. In Proceedings of the 11th International Conference on Automotive User Interfaces and Interactive Vehicular Applications: Adjunct Proceedings (AutomotiveUI’19), Utrecht, The Netherlands, 22–25 September 2019; pp. 187–193. [Google Scholar] [CrossRef]
- Forster, Y.; Frison, A.K.; Wintersberger, P.; Geisel, V.; Hergeth, S.; Riener, A. Where we come from and where we are going: A review of automated driving studies. In Proceedings of the 11th International Conference on Automotive User Interfaces and Interactive Vehicular Applications: Adjunct Proceedings, Utrecht, The Netherlands, 22–25 September 2019; ACM: New York, NY, USA, 2019; pp. 140–145. [Google Scholar]


| n | in % | Examples | |
|---|---|---|---|
| Safety | 82 | 50.93 | Gold et al. [13], Merat et al. [14], Wintersberger et al. [21] |
| Trust | 37 | 22.98 | Hergeth et al. [19], Forster et al. [74] |
| Acceptance | 34 | 21.12 | Nordhoff et al. [23], Kyriakidis et al. [25] |
| Workload | 32 | 19.88 | Bashiri and Mann [75], Biondi et al. [76] |
| General Attitude | 20 | 12.42 | Maurer et al. [77] |
| Situation Awareness | 18 | 11.18 | Clark et al. [78], Karjanto et al. [79] |
| Stress | 15 | 9.32 | Wintersberger et al. [21] |
| Interaction Behavior | 11 | 6.83 | Currano et al. [71] |
| Drowsiness/Fatigue | 11 | 6.83 | Neubauer et al. [16], Naujoks et al. [80] |
| User Experience | 10 | 6.21 | Frison et al. [32,73], Oliveira et al. [81] |
| Productivity | 9 | 5.59 | Chang et al. [54], Reimer et al. [82] |
| Comfort | 9 | 5.59 | Bellem et al. [83] |
| Emotions | 8 | 4.97 | Wintersberger et al. [26], Terken et al. [84] |
| Usability | 7 | 4.35 | Forster et al. [41] |
| Cognitive Processes | 7 | 4.35 | Glatz et al. [85] |
| Motion Sickness | 5 | 3.11 | Karjanto et al. [79] |
| Cooperation | 3 | 1.86 | Guo et al. [86], Walch et al. [87] |
| Wellbeing | 3 | 1.86 | Telpaz et al. [72] |
| Mental Model | 3 | 1.86 | Beggiato et al. [88] |
| Ethics | 2 | 1.24 | Sikkenk and Terken [56] |
| Other, e.g., Personalization | 36 | 22.36 | - |
| Collection Method for Safety (n) | Parameter | np |
|---|---|---|
| TOR Performance (58) | Reaction Time | 70 |
| Lateral Position | 18 | |
| Time to Collision | 15 | |
| Speed Parameters | 10 | |
| TOR Timing | 10 | |
| Acceleration | 9 | |
| Braking | 7 | |
| Steering Wheel Angle | 5 | |
| Distance Front | 4 | |
| First, Driving Action | 4 | |
| Number of Collisions | 4 | |
| Disengagements | 3 | |
| Lane Change Parameters | 3 | |
| Steering | 3 | |
| Accuracy | 2 | |
| NDRT Engagement | 2 | |
| Accident Avoidance Ranking (AAR) | 1 | |
| Number of Interactions | 1 | |
| N/D | 7 | |
| Driving Performance (24) | Lateral Position | 13 |
| Speed Parameters | 9 | |
| Reaction Time | 7 | |
| Time to Collision | 5 | |
| Acceleration | 3 | |
| Steering Wheel Angle | 3 | |
| Braking | 2 | |
| Lane Departure Parameters | 2 | |
| Number of Collisions | 2 | |
| Automation Enabled/Disabled | 1 | |
| Distance Front | 1 | |
| Overtakings per Km | 1 | |
| Steering | 1 | |
| N/D | 1 | |
| Eye Tracking/Gaze Behavior (12) | Gaze Percentage | 9 |
| Gaze Duration | 6 | |
| Gaze Number | 3 | |
| Glancing Behavior | 3 | |
| Reaction Time | 3 | |
| Pathways | 1 | |
| Saccade | 1 | |
| Observation (12) | Crossing Behavior | 2 |
| NDRT Engagement | 2 | |
| Reaction Time | 2 | |
| Accuracy | 1 | |
| Automation Enabled/Disabled | 1 | |
| Braking | 1 | |
| Crossing Time | 1 | |
| Gaze Number | 1 | |
| Number of Collisions | 1 | |
| Situation Criticality | 1 | |
| Steering | 1 | |
| Time to Collision | 1 | |
| N/D | 2 | |
| Self-Defined Questionnaire (11) | N/D | 10 |
| Accuracy | 1 | |
| Standardized Questionnaire (6) | Scale for Criticality Assessment of Driving and Traffic Scenarios | 2 |
| Cooper–Harper Scale | 2 | |
| Auditory Urgency Scale | 1 | |
| Secondary Task Performance (3) | NDRT Engagement | 1 |
| Reaction Time | 1 | |
| N/D | 1 | |
| Interviews (2) | Semi-structured Interview | 2 |
| Matching (1) | Accuracy | 1 |
| Collection Method for Trust (n) | Parameter | np |
|---|---|---|
| Self-Defined Questionnaire (19) | N/D | 19 |
| Standardized Questionnaire (17) | Automation Trust Scale (ATS) | 12 |
| Interpersonal Trust Scale (ITS) | 1 | |
| Van der Laan Acceptance Scale | 1 | |
| Trust in Technology Scale | 1 | |
| Trust Perception Scale-HRI | 1 | |
| Propensity to Trust Scale | 1 | |
| N/D | 1 | |
| Observation (5) | Body Pose/Movements | 4 |
| Acceleration | 1 | |
| Brake | 1 | |
| Driving Action | 1 | |
| Gaze Duration | 1 | |
| Reaction Time | 1 | |
| Steering | 1 | |
| Waiting Time | 1 | |
| Interviews (4) | Semi-structured Interview | 3 |
| Structured Interview | 1 | |
| Eye Tracking/Gaze Behavior (4) | Gaze Duration | 2 |
| Gaze Percentage | 1 | |
| Glancing Behavior | 1 | |
| Gaze Number | 1 | |
| Driving Performance (1) | Brake | 1 |
| Steering | 1 | |
| Decision Game (1) | N/D | 1 |
| TOR Performance (1) | Reaction Time | 1 |
| Collection Method for Acceptance | Parameter | np |
|---|---|---|
| Standardized Questionnaire (18) | Van der Laan Acceptance Scale | 10 |
| Unified Theory of Acceptance and Use of Technology (UTAUT) | 4 | |
| Technology Acceptance Model (TAM) | 3 | |
| Car Technology Acceptance (CTAM) | 2 | |
| Willingness to Ride | 1 | |
| Perceived Behavioral Control (PCB) | 1 | |
| System Usability Scale | 1 | |
| Personal Innovativeness Scale | 1 | |
| Self-Defined Questionnaire (13) | N/D | 13 |
| Observation (3) | Automation Enabled/Disabled | 1 |
| Reaction Time | 1 | |
| N/D | 1 | |
| Driving Performance (1) | Proportion of Manually Driven Scenarios | 1 |
| Interviews (1) | Unstructured Interview | 1 |
| Focus Group (1) | N/D | 1 |
| Secondary Task Performance (1) | NDRT engagement | 1 |
| Collection Method for Workload (n) | Parameter | np |
|---|---|---|
| Standardized Questionnaire (22) | NASA-TLX | 17 |
| Driver Activity Load Index (DALI) | 2 | |
| Rating Scale Mental Effort (RSME) | 1 | |
| Scale for Subjectively Experienced Effort (SEA) | 1 | |
| Global Mental Workload Measurement | 1 | |
| Self-Defined Questionnaire (4) | N/D | 4 |
| Secondary Task Performance (4) | NDRT Performance | 2 |
| Twenty Question Task (TQT) | 1 | |
| Surrogate Reference Task (SURT) | 1 | |
| Observation (1) | N/D | 1 |
| Interviews (1) | Semi-Structured Interview | 1 |
| Eye Tracking/Gaze Behavior (1) | Glancing Behavior | 1 |
| Driving Performance (1) | Steering Wheel Angle | 1 |
| Collection Method for General Attitude (n) | Parameter | np |
|---|---|---|
| Self-Defined Questionnaire (15) | N/D | 15 |
| Interviews (5) | Semi-Structured Interview | 4 |
| Unstructured Interview | 1 | |
| Standardized Questionnaire (2) | BIG 5 | 2 |
| Observation (1) | N/D | 1 |
| Collection Method for Situation Awareness (n) | Parameter | np |
|---|---|---|
| Eye Tracking/Gaze Behavior (7) | Gaze Duration | 5 |
| Gaze Number | 4 | |
| Gaze Percentages | 3 | |
| Glancing Behavior | 2 | |
| Blink Behavior | 1 | |
| Reaction Time | 1 | |
| Self-Defined Questionnaire (6) | N/D | 6 |
| Standardized Questionnaire (3) | Situational Awareness Rating Technique (SART) | 3 |
| Probing (2) | Situation Awareness Global Assessment Technique (SAGAT) | 3 |
| TOR Performance (2) | Lateral Position | 2 |
| Reaction Time | 2 | |
| Acceleration | 1 | |
| Time to Collision | 1 | |
| Interviews (2) | Semi-structured Interview | 2 |
| Observation (1) | Accuracy | 1 |
| Reaction Time | 1 | |
| Secondary Task Performance (1) | NDRT Performance | 1 |
| Collection Method for Stress (n) | Parameter | np |
|---|---|---|
| Standardized Questionnaire (6) | Short Stress State Questionnaire (SSSQ) | 3 |
| Dundee Stress State Questionnaire (DSSQ) | 2 | |
| Driver Stress Inventory (DSI) | 1 | |
| Heart Rate Variability (4) | HR (BPM) | 2 |
| Physical Position | 1 | |
| Root Mean Square of Successive Differences (RMSSD) | 1 | |
| GSR (2) | AmpSum | 1 |
| ISCR | 1 | |
| nSCR | 1 | |
| SCR | 1 | |
| PhasicMax | 1 | |
| N/D | 1 | |
| Eye Tracking/Gaze Behavior (1) | Gaze Duration | 1 |
| Gaze Number | 1 | |
| Self-Defined Questionnaire (1) | Other | 1 |
| Observation (1) | Body Pose/m Movements | 1 |
| Interviews (1) | Semi-structured Interview | 1 |
| EMG (1) | N/D | 1 |
| Driving Performance (1) | Automation Enabled/Disabled | 1 |
| Collection Method for Interaction Behavior (n) | Parameter | np |
|---|---|---|
| Observation (6) | Walking Behavior | 2 |
| Automation Enabled/Disabled | 2 | |
| Glancing Behavior | 1 | |
| Pathways | 1 | |
| Reaction Time | 1 | |
| NDRT Engagement | 1 | |
| N/D | 2 | |
| Standardized Questionnaire (3) | Brief Sensation Seeking Scale (BSSS-8) | 1 |
| Pedestrian Behavior Questionnaire (PBQ) | 1 | |
| Theory of Planned Behavior (TPB) | 1 | |
| Self-Defined Questionnaire (2) | N/D | 2 |
| Eye Tracking/Gaze Behavior (1) | Gaze Percentages | 1 |
| Interviews (1) | Semi-structured Interview | 1 |
| Secondary Task Performance (1) | Single-choice Quiz | 1 |
| Collection Method for Drowsiness/Fatigue (n) | Parameter | np |
|---|---|---|
| Standardized Questionnaire (7) | Karolinska Sleepiness Scale (KSS) | 4 |
| Driver Stress Inventory (DSI) | 1 | |
| Multidimensional Fatigue Inventory (MFI) | 1 | |
| Self-Assessment Manikin (SAM) Scale | 1 | |
| Dundee Stress State Questionnaire (DSSQ) | 1 | |
| Self-Defined Questionnaire (2) | Other | 2 |
| Observation (2) | Yawning | 1 |
| Blink Behavior | 1 | |
| N/D | 1 | |
| Driving Performance (1) | Reaction Time | 2 |
| Lateral Position | 1 | |
| Eye Tracking/Gaze Behavior (1) | Glancing Behavior | 1 |
| UX-Curve (1) | N/D | 1 |
| Collection Method for UX | Parameter | np |
|---|---|---|
| Standardized Questionnaire (4) | AttrakDiff | 2 |
| User Experience Questionnaire (UEQ) | 1 | |
| Van der Laan Acceptance Scale | 1 | |
| Hedonia and Eudaimonia (HEMA) Scale | 1 | |
| Sheldon’s Need Scale | 1 | |
| Interviews (4) | Semi-structured interview | 4 |
| Self-Defined Questionnaire (2) | N/D | 2 |
| Driving Performance (1) | Acceleration | 1 |
| Brake | 1 | |
| Speed Parameters | 1 | |
| Number of Lane Changes | 1 | |
| Observation (1) | N/D | 3 |
| Heart Rate Variability (1) | HR (BPM) | 1 |
| UX-Curve (1) | N/D | 1 |
| Think Aloud (1) | N/D | 1 |
| Sorting (1) | N/D | 1 |
| Collection Method for Productivity (n) | Parameter | n |
|---|---|---|
| Secondary Task Performance (6) | NDRT Performance | 8 |
| NDRT Engagement | 3 | |
| Accuracy | 3 | |
| Body Pose/Movements | 1 | |
| N/D | 1 | |
| Driving Performance (1) | Accuracy | 1 |
| Reaction Time | 1 | |
| Observation (1) | Accuracy | 1 |
| Interviews (1) | Semi-structured Interview | 1 |
| Eye Tracking/Gaze Behavior (1) | Gaze Percentages | 1 |
| Collection Method for Comfort (n) | Parameter | np |
|---|---|---|
| Self-Defined Questionnaire (7) | N/D | 7 |
| Standardized Questionnaire (2) | Driving Style Questionnaire (MDSI) | 1 |
| Technology Acceptance Model (TAM) | 1 | |
| Unified Theory of Acceptance and Use of Technology (UTAUT) | 1 | |
| User Experience Questionnaire (UEQ) | 1 | |
| Driving Performance (1) | Acceleration | 1 |
| Collection Method for Emotions (n) | Parameter | np |
|---|---|---|
| Standardized Questionnaire (4) | Positive and Negative Affect Scale (PANAS) | 2 |
| PANAS-X | 1 | |
| Affect Grid | 1 | |
| Multi-Modal Stress Questionnaire (MMSQ) | 1 | |
| Affect Scale | 1 | |
| Self-Defined Questionnaire (4) | N/D | 3 |
| Russel’s Circumplex Model | 1 | |
| Observation (1) | Percentage of Detected Emotions | 1 |
| Facial Expressions | 1 | |
| Interviews (1) | Semi-structured Interview | 1 |
| Think Aloud (1) | N/D | 1 |
| Collection Method for Usability (n) | Parameter | np |
|---|---|---|
| Self-Defined Questionnaire (4) | N/D | 4 |
| Standardized Questionnaire (3) | System Usability Scale (SUS) | 3 |
| Input-Output Questionnaire | 1 | |
| Interviews (2) | Semi-structured Interview | 2 |
| Think Aloud (1) | N/D | 1 |
| Collection Method for Cognitive Processes | Parameter | np |
|---|---|---|
| Self-Defined Questionnaire (3) | N/D | 3 |
| EEG (2) | N/D | 2 |
| Detection Task (1) | Accuracy | 1 |
| Reaction Time | 1 | |
| Driving Performance (1) | Lateral Position | 1 |
| Time Headway | 1 | |
| Standardized Questionnaire (1) | Driver Stress Inventory (DSI) | 1 |
| Collection Method for Motion Sickness (n) | Parameter | np |
|---|---|---|
| Standardized Questionnaire (4) | Sickness Questionnaire (SSQ) | 3 |
| Motion Sickness Assessment Questionnaire (MSAQ) | 1 | |
| Self-Defined Questionnaire (1) | Other | 1 |
| Heart Rate Variability (1) | HR (BPM) | 1 |
| Driving Performance (1) | Motion Sickness Dose Value (MSDV) | 1 |
Publisher’s Note: MDPI stays neutral with regard to jurisdictional claims in published maps and institutional affiliations. |
© 2020 by the authors. Licensee MDPI, Basel, Switzerland. This article is an open access article distributed under the terms and conditions of the Creative Commons Attribution (CC BY) license (http://creativecommons.org/licenses/by/4.0/).
Share and Cite
Frison, A.-K.; Forster, Y.; Wintersberger, P.; Geisel, V.; Riener, A. Where We Come from and Where We Are Going: A Systematic Review of Human Factors Research in Driving Automation. Appl. Sci. 2020, 10, 8914. https://doi.org/10.3390/app10248914
Frison A-K, Forster Y, Wintersberger P, Geisel V, Riener A. Where We Come from and Where We Are Going: A Systematic Review of Human Factors Research in Driving Automation. Applied Sciences. 2020; 10(24):8914. https://doi.org/10.3390/app10248914
Chicago/Turabian StyleFrison, Anna-Katharina, Yannick Forster, Philipp Wintersberger, Viktoria Geisel, and Andreas Riener. 2020. "Where We Come from and Where We Are Going: A Systematic Review of Human Factors Research in Driving Automation" Applied Sciences 10, no. 24: 8914. https://doi.org/10.3390/app10248914
APA StyleFrison, A.-K., Forster, Y., Wintersberger, P., Geisel, V., & Riener, A. (2020). Where We Come from and Where We Are Going: A Systematic Review of Human Factors Research in Driving Automation. Applied Sciences, 10(24), 8914. https://doi.org/10.3390/app10248914