Article

Intelligent Total Transportation Management System for Future Smart Cities

1
Department of Aeronautics, Naval Architecture and Railway Vehicles, Budapest University of Technology and Economics (BME), 1111 Budapest, Hungary
2
Globalization Competence Center, Széchenyi István University, 9026 Győr, Hungary
3
Faculty of Science of Public Governance and Administration, Lajos Lőrinc Institute of Administrative Law, National University of Public Service, 1083 Budapest, Hungary
*
Author to whom correspondence should be addressed.
Appl. Sci. 2020, 10(24), 8933; https://doi.org/10.3390/app10248933
Submission received: 8 November 2020 / Revised: 10 December 2020 / Accepted: 12 December 2020 / Published: 14 December 2020
(This article belongs to the Special Issue Internet of Things (IoT))

Abstract

:
Smart mobility and transportation, in general, are significant elements of smart cities, which account for more than 25% of the total energy consumption related to smart cities. Smart transportation has seven essential sections: leisure, private, public, business, freight, product distribution, and special transport. From the management point of view, transportation can be classified as passive or non-cooperating, semi-active or simple cooperating, active or cooperating, contract-based, and priority transportation. This approach can be applied to public transport and even to passengers of public transport. The transportation system can be widely observed, analyzed, and managed using an extensive distribution network of sensors and actuators integrated into an Internet of Things (IoT) system. The paper briefly discusses the benefits that the IoT can offer for smart city transportation management. It deals with the use of a hierarchical approach to total transportation management, namely, defines the concept, methodology, and required sub-model developments, which describes the total system optimization problems; gives the possible system and methodology of the total transportation management; and demonstrates the required sub-model developments by examples of car-following models, formation motion, obstacle avoidances, and the total management system implementation. It also introduces a preliminary evaluation of the proposed concept relative to the existing systems.

1. Introduction

In December 1959, Richard Feynman (received a Nobel Prize in 1965 for his contribution in the development of quantum electrodynamics) offered a prize of $1000 to the first person to make a motor l/64th of an inch cubed, and to the first person to produce written text at 1/25,000 scale [1]. Soon after, 60 years ago, California Institute of Technology graduate William McLellan designed a motor only 15/1000ths of an inch in diameter. The second prize was won by Tomas Newman, a Stanford graduate student, who used electron-beam lithography in 1985.
During the same period, the development of the computer accelerated, microchips’ capacity increased while their price was cut, and personal computers were designed. In 1975, the first personal computers, MITS Altair 8800, were sold as kits [2]. In 1976, the Apple I and, a year later, Apple II, the first color computer, were created.
Another critical technology, mobile communication, was born in 1899 when Marconi created the practically usable radio. The first cellular mobile phone, weighing 1.1 kg, was introduced by Motorola. Today, 5G mobile phones (like iPhone 11 Pro Max) have about 15–20 million times more capacity and RAM and are around 150 times lighter than the computer of Apollo 11 controlling the first manned mission to land on the Moon [3].
As early as the 1950s, scientists tried to connect their computers and exchange data. The Transmission Control and Internet Protocols (TCPs, IPs) were defined in 1973. These allowed us to develop the Internet. Later, the Domain Name System (1986) and the World Wide Web (1989) were introduced [4]. Finally, the wide band of information transmission, data processing, control theory, and, especially, soft computing (evolved in 1981) resulted in artificial intelligence and the Internet of Things [5,6], and, thus, in large natural technogenic systems [7]. It is a human-made (-genic) technical/technological (techno) system based in nature (ground-soil, water-rivers). This term includes the possible management of transport in emergencies, like a disaster caused by an earthquake [8].
By using the more comprehensive approach, smart city transport is an ecological–socio-technogenic system [9]. The transportation system is a whole complex system, the effective operation (usage) of which becomes top-level tasks.
Technology development briefly characterized above catalyzes the development of operation of cities and transportation on new smart and intelligent, more effective, and greener levels.
Nowadays, society and policymakers are continuously working on smart city developments, while the economy found it a well-explanted future business [10,11,12]. Depending on the researchers’ or developers’ point of view, smart cities have 5–8 significant components as smart infrastructure, transportation, environment, services, governance, people, living, and economy [13]. From these, smart mobility/smart transportation is one of the most important for society and the economy. It uses 30.8% (the year 2017) of energy from total energy consumption in the EU-28 [14].
Transportation is one of the numerous requisite characters of modern society and a vital enabler of the many other notions that define and characterize a smart city. Nikitas et al. [15] presented the six interventions—autonomous and connected vehicles, electro-mobility, bus rapid transit, hyperloop, shared-use mobility, and mobility-as-a-service—which can be in the future part of the smart city’s urban transport system. Autonomous and connected vehicles (ACVs) can be the most robust intervention in the history of mobility and the capacity to transform urban development with a revolution in urban landscape and legislation. ACVs could dramatically change ground transport and have an enormous economic, social, spatial, and mobility impact. Electric vehicles (EVs) play a critical role in how smart cities become more energy-efficient and less polluted because the oil economy’s future is unsustainable and very limited. Although owners do not need to pay carbon-related taxes, EVs require high private costs. With special features, EV technology is expected to change the future cities. Bus rapid transit (BRT), referred to as schemes that apply rail-like infrastructure and operations to bus systems in expectation of offerings, such as high service levels, segregated right-of-way, and station-like platforms, is a mobility revelation that already prospers in 164 cities across the world. Hyperloop is projected to use magnetically levitated pods running inside tunnel systems free of air resistance, which offers services traveling faster than commercial flights. Shared use mobility (SUM) is a way of rethinking and repositioning transport on the urban landscape. In SUM systems, the physical assets, such as cars, bicycles, vans, motorbikes, are accessed sequentially by multiple users on a pay-per-use basis. Mobility-as-a-service (MaaS) is a more radical solution that replaces privately owned transport and optimizes the use of mobility resources. MaaS platforms provide an intermodal journey planner (e.g., car-sharing, car rental, underground, rail, bus, bike-sharing, taxi), a booking system, easy-payment, and real-time information. As MaaS is a new mobility service, and its implementation is limited, there is a lack of research to identify the impact of MaaS on travel behavior.
Smart mobility/intelligent transportation includes (i) smart infrastructure (roads, rails, tracks, waterways, bridges, tunnels, stations); (ii) smart people and smart economy; (iii) smart vehicles; (iv) smart info-communication and control system (from traffic lights, up to operation centers); (v) optimization principles, and (vi) smart policy-making and legislation [16], such as traffic rules, which can solve several transportation problems, such as traffic jams, accidents, pollution, fuel cost, or high insurance costs. According to the investigation of the IDEA-E (Investigation and development of the disruptive technologies for e-mobility and their integration into the engineering education) project [17,18,19], smart transportation is a slightly larger system, including all the transportation means and all infrastructure covering roads, rail tracks, tunnels of underground transportation, bridges, or multimodal transport hubs.
By the analysis of the stakeholders’ interests, the users’ expectations, and the application of the terms (i) connected vehicles (introduced by smart city, smart transportation operators), (ii) non-cooperative and cooperative targets (introduced by the developers of the primary, radar surveillance), and (iii) contract-based service (implemented by air traffic management), the transportation system can be set up as a single system classified in hierarchically structured layers. This paper introduces the term and focuses on the single intelligent transportation system, with seven essential sections: leisure, private, public, business, freight, product distribution, and special transport (e.g., services, emergency cars). From the management point of view, the transportation system is recommended to be classified as (i) passive or non-cooperating, (ii) semi-active or simple cooperating, (iii) active or cooperating, (iv) contract-based, and (v) priority transports, as well as (vi) supporting partners. This approach can also be applied to the passengers of public transportation. For example, an important decision can be made from a statistical or even in-depth learning analysis of smart travel card data [20].
The transportation system can be widely observed, analyzed, and managed using an extensive distribution network of sensors and actuators integrated into a system communicating through the internet, as a real Internet of Things (IoT) system [6,21].
The development of rapid transportation technology, changes in social mobility (e.g., the rise of on-demand transportation), the shift in the economy (globalization–re-industrialization), and the available novel IT technologies (data-driven intelligent systems in the IoT domain) push smart cities to introduce next-generation transportation systems. As known after Cohen [22], three smart city generations are identified as (i) technology-driven, (ii) technology enabling, and (iii) citizen cooperation. A smart city will provide a broader technology context within which connected and autonomous vehicles will operate. From the technology and management point of view, a smart city and its smart transportation generations can be defined as (i) passive (based on the available new technologies like e-cars), (ii) dynamic (using real measured data), and (iii) active (using real data in real-time management). An outstanding EU project, titled SmartSantanders [23,24,25], introduced the last, active management of smart transportation. This project aims to establish a unique world city-scale experimental research facility to investigate and demonstrate a possible Internet-of-things-driven service for future smart cities. They applied more than 12,000 IoT devices integrated into the experimental area. The project developed urban-scale ICT (info-communication technology) platforms with three main core functionalities: (i) urban communication abstraction, (ii) unified urban information models, and (iii) open urban service development. Future Internet in the smart city environment covered three core areas: (i) the Internet of Things (IoT), (ii) the Internet of Services (IoS), and (iii) the Internet of People (IoP). It could introduce two critical abilities of the future smart cities: (i) the use of large sensor and actuator networks integrated into the infrastructure and (ii) the establishment of easy-to-use services by redeveloping new solutions and applications based on collected information.
Due to the numerous benefits that it can offer, the IoT is the most important supporting technology in smart city and smart transportation developments. It, thus, might be a core part of the next generation transportation systems [26], which will be determined by a series of disruptive technologies and social innovation [27], such as social media and digital platforms, big data, artificial intelligence, the Internet of Things, robotics, and drones.
In future transportation systems, connected and autonomous vehicles emerged and, therefore, interest has grown substantially in the IoT. It is viewed as the next generation of the Internet, and it is predicted that it will go beyond connecting computers and smartphones to joining a multitude of different devices [28]. With the IoT and highly automated systems, transportation management is shifting from active control to passive observation. In addition, traffic management to reduce congestion is a crucial topic in the smart city context, and numerous studies related to this topic were published [29,30].
A smart transportation system, or intelligent transportation system (ITS), focuses on economy and society interest, reduced travel times [31], arrival on time [32], fuel consumption, and pollution, as well as improving traffic safety. Several smart transportation system applications rely on the Internet of Things (IoT), including smart roads [33], intelligent parking systems [34,35], and real-world connected vehicle data [36]. The authors of reference [37] summarize the surveyed studies in urban mobility analysis and sensor data type.
Numerous studies deal with the environmental impact of smart cities and smart transportation, including life-cycle analyses [38,39], and the stochastic shortest path problem [40,41], while just a limited number of papers discuss possible environmental harm reduction by optimizing total transportation. Instead, some parts of transportation and optimization are investigated, like the impact of using electric vehicles [42].
This paper aims to deal with traffic as a single system [43,44,45] and considers its total management, including systematic description, hierarchical approach, general optimization method, sensing, technologies, and data processing. Here, single means all types of motion of people (from pedestrian up to luxury car driving) and goods via all types of transport (bicycle, trains, inland water navigation, air transport, emergency transport) working in one single system supported by, e.g., the transportation infrastructure, transportation services, logistics, or controlling elements. The total transportation management controls the defined single transportation system totally by using the described above hierarchically defined interconnected vehicles and predefined optimization rules. According to smart city programs, the transportation system is also smart and/or intelligent. In general, smart and intelligent are similar terms. Smart might solve the problem (as solving the mobility and transportation tasks with the available technologies and theories), while intelligent might provide a different solution to the same problem, depending on the exact circumstances and characteristics.
The paper shows a possible method to link the gap between the solutions developed for the system elements (like control of junction, smart parking, optimization of changing the transport means at multi-modal transport centers) and the management of the total system. The overall objective of this paper is to introduce a vision and a concept of managing the total transportation system by defining the concept, the methodology, and the required sub-model developments for the future intelligent transportation related to smart cities.
The introduced vision to optimize the total transportation management is a novel approach that can be applied already but needs further developments in the observation of the vehicle motions, the evaluation of the transport size and intensity, and the development of new software and management concepts. Due to the length limitations of this paper, several aspects might need further explanation and justifications. However, the implementation of this new approach might be initiated already, even in this limited form.
It (i) gives a short description of the urban total transportation system; (ii) uses a hierarchical approach to the total transportation management; (iii) defines the general optimization task and constraints; (iv) introduces the classification of possible sensors and their integration in the vehicles or infrastructure; (v) shows the role of data processing, applying the big data survey and methods of soft computing and artificial intelligence; (vi) describes some models for safe and optimized transport management; (vii) discusses the possible realization of the highly automated total management; and (viii) makes a preliminary simple evaluation of the proposed total transportation management compared to existing systems.
Generally, the literature dealing with smart and intelligent transportation is very large. Google gives more than 2.5 billion results when searching “smart transport”. This large number of papers demonstrates that developing, planning, constructing, organizing, operating, and managing transportation systems are not solved yet on a generally accepted level. The authors of this paper assessed several hundreds of related articles. The relatively large number of citations listed in this paper must be evaluated as a subjective list of papers that inspired the authors.
The rest of the paper is organized as follows. Section 2 presents the materials and methods with five sub-sections, beginning with a systematic description of the urban transportation system, and ending with the subsection data processing. The solution to the recommended general optimization problem of the total transport system requires a series of sub-models to be applied. Three examples of sub-model developments are provided in Section 3 as the results of this study to demonstrate the possible further research that supports the implementation of the introduced new approach to total transportation management. Some comprehensive discussions are given in Section 4, while Section 5 concludes the paper and states the future works.

2. Materials and Methods

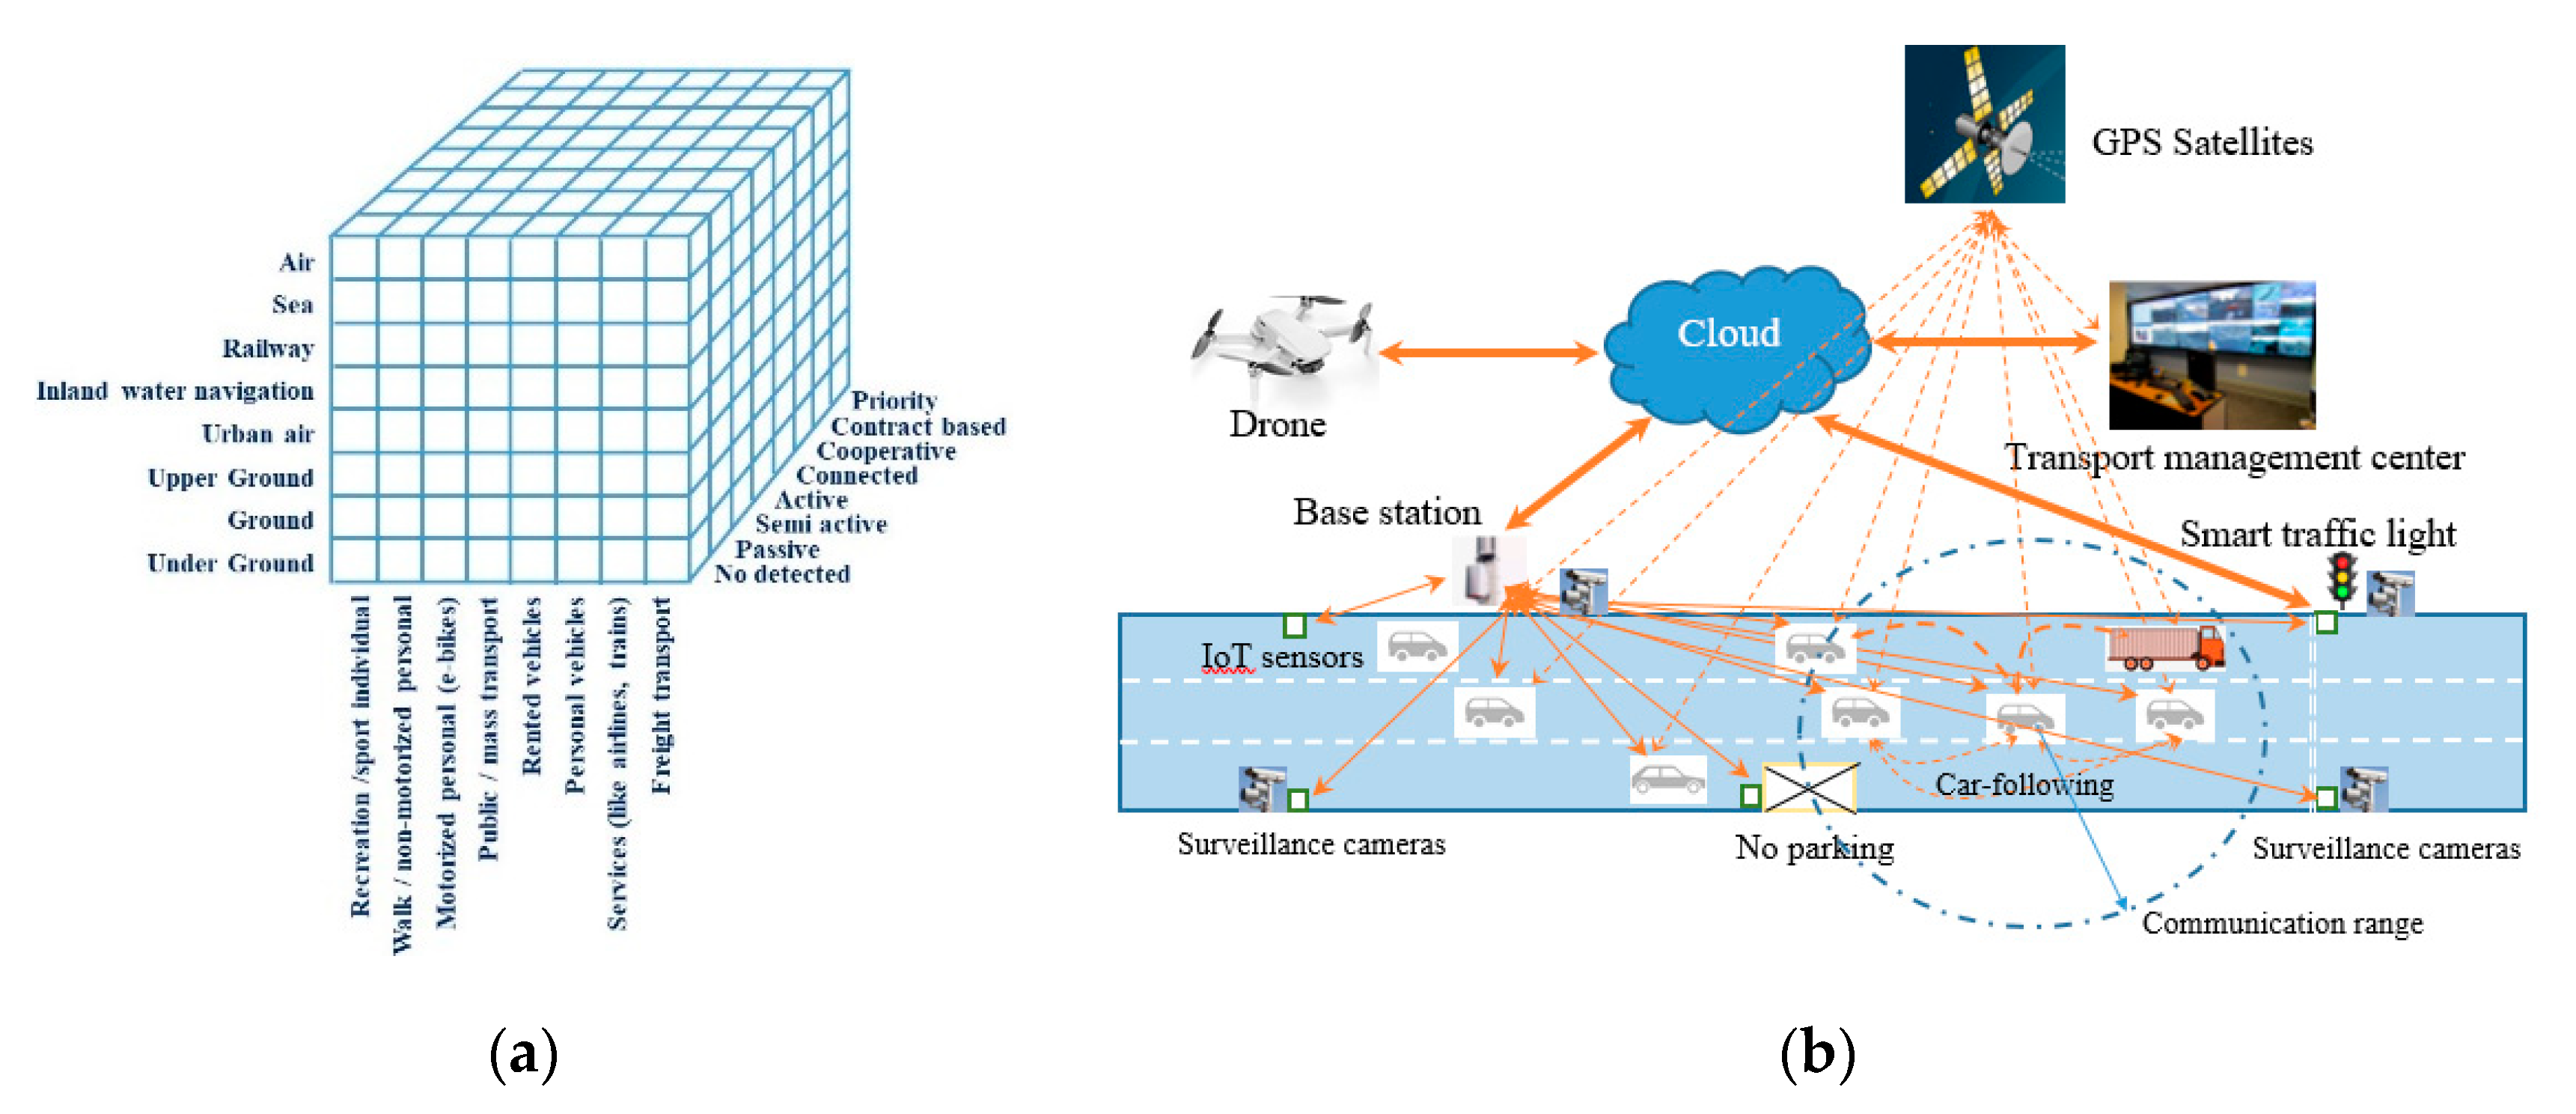
2.1. Systematic Description of the Urban Transportation System

An urban transportation system is a sub-system of the overall transportation system that guarantees the safe, environmentally friendly, effective, and sustainable mobility and transportation of goods in urban/city areas. It is a sub-system, only, but it has fast interconnections with global transportation systems, including, e.g., the highway passing through/nearby the city, railways having a station in the city, and airports connecting to the cities.
Urban transportation might be classified depending on the transportation means and on the observation and management applied.
Figure 1 shows all the transportation means, such as road, rail, water, and air transports, which are operated by cities. The transportation means may include very different transportation vehicles/solutions. For example, rail transportation operates trams, underground, overhead, and cogwheel railways in urban areas; high-speed rail passing in/nearby cities; and trains and rail/magnetic rail connecting the airport with city centers. Nowadays, pedestrian transportation, small personal vehicles (bicycle, scooters, segway), standing vehicle transportation (parking), and new forms of transport such as urban air transportation (drones, air taxies) are the elements of the urban transportation system. Such elements must be integrated into the total transportation/total transportation management.
In future, the introduction of autonomous vehicles in everyday operations and highly automated traffic management systems will mean operator roles will shift from active control to passive observation and require active control in case of special and emergency situations, only. Such management requires the collection of enough data to enable the management of the total transportation system in optimized form. The distributed sensor systems might be organized into a single smart transportation IoT-based system.

2.2. Hierarchical Approach to Total Transportation Management

While this article deals with smart urban transportation as a single significant, ecological–socio-technogenic system, in reality, there are many different types of vehicles/forms of transportation used. Their primary characteristics are distributed in extensive ranges (as significant geometry measures from 20–30 cm up to 50–100 m, mass from 0.5 kg up to hundreds of kg, performance as velocity from 1–2 km/h up to 800 km/h, or fuel consumption from zero up to 30–2000 L/100 km).
There are several classification methods of the transportation systems being used. Figure 2a represents a cube of the transportation system. From a user point of view, transportation might be classified as the following horizontal parts of the total system:
  • leisure transportation—walking, running, using scooters, bicycling in parks, drafting, yachting, riding hot air balloons, parachuting, using a hang glider, using autogyros caravans, etc.
  • private transportation—walking; using scooters; bicycling for traveling; operating personal vehicles, cars, boats, small personal aircraft with well-defined traveling goals
  • public transportation or mass transportation—metro, trams, busses, scheduled boats
  • business travel—taxi cars, boats, air taxi, business air transport
  • freight transportation—lorries, trucks, trailer trucks, container lorries
  • product distribution—pick-ups, fast carriers, drones that distribute goods
  • special transportation—monitoring by drones, emergency cars, fire cars, police, VIP vehicles
Often, the same vehicles might be used for different purposes, in different segments of the transportation system. For example, the same bicycle might be used for leisure or sport as well as traveling to work or carrying bike couriers.
This classification of the transportation segments also uses a hierarchical concept. However, transportation vehicles can be grouped depending on their “participation” in the transportation system (Figure 2a), namely on the level of their cooperation with the operation center (Figure 2b). Six classes can be identified:
(i)
non-detected—objects not appearing on the surveillance screen
(ii)
appearing on the surveillance screens, but it is unknown whether they are passive or non-cooperating vehicles or participants like pedestrians—they have no connection with the operation centers, and they might show up on the monitor of surveillance as unknown objects or non-cooperative targets (generally, it might be humans, animals, vehicles not providing information to the operation centers)
(iii)
semi-active or simple cooperating—objects/participants in city transportation from which at least some information is available at the operation center. For example, by video, the object is identified as a small or medium car or van
(iv)
active or cooperating—vehicles or service providers (city mass transportation company, taxi companies) that report information on the objects/vehicles moving that are operating in the city. The available information should contain data on the type of the vehicle (and of course its performance), its identification number, load, characteristics available in on-board systems, the instantaneous position of the given vehicles (for example by using the GPS positioning data), purpose, and final destination of travel
(v)
connecting vehicles—work together passively (using, for example, sonic or radar measurements to keep the following distance) or actively (exchanging all the available data on board) and they may even harmonize their actions (like moving in formation or using the conflict detection and resolution based on the exchanged information)
(vi)
contract-based vehicles—may have some preferences in the transportation system (like temporary opening the bus lanes or giving them green lights as possible) served on the basis of first come, first served, and they must pay (low fees) for serving
(vii)
priority transport—should have priority lanes/control (as for police, emergency cars, traveling of VIP persons)
(viii)
supporting partners—starting by continuous weather forecast reporting up to emergency management organization having the highest priority.
As in any classification, here, some of the categories could overlap. For example, public transportation may have enormous influence on the other classes. On the other hand, public transportation is partly a prioritized transportation because of the introduction of bus lanes and the control of the traffic lights to reduce the mass transport traveling time.

2.3. General Optimization Method

At first sight, the required optimization methods can be defined simply as a nonlinear optimization problem. The mathematical representation can be given in a simple form:
m i n f ( x ) s u b j e c t   t o :   g i ( x ) 0     for   each   i { 1 ,   2 ,   ,   n } a n d   h j ( x ) = 0     for   each   j { 1 ,   2 ,   ,   m } w h e r e   x X
where x : the vector of variables, f ( x ) : objective function, g i ( x ) : non-equality constraint functions, h j ( x ) : equality constraint functions, and X : space of the variables.
The formulation of this optimization problem dealing with a single total (overall) transportation system seems to be too ambitious. Millions of solutions to such optimization problems are reduced to a part of the transportation systems, to a given type of sub-systems. The main reason for reducing the problem is the use of a fully and well observable system. However, the latest results of sciences and technologies allow solving the optimization of the total transportation system. For example, the Internet of Things, big data analysis, and soft computing make it possible to estimate the sub-systems of transportation being composed of non-cooperative or semi-cooperative vehicles (people) from the external information provided, e.g., by smart cards or video surveillance.
The most important novelties of the introduced optimization problem are not related to the focus of a single transportation system and not to the optimization of the total system. The novelties are caused by the classification of the transportation system. As described in Section 2.2, there are horizontal and hierarchical classifications of the total transportation system. This classification allows us to define special objective functions for a part of the total transportation system and introduce more constraints.
By adapting the total impact concept [39,46,47], the objective function can be defined in several different forms depending on the management’s objectives. One of the most important primary objectives is the minimization of the energy used by transportation. Total energy consumption, E t , used by total urban transport system related an hour or day (or season) can be defined as:
E t = f ( x ) = 1 τ i = 1 N t s i 0 t f i τ w v i e v c i ( r v i , p v i , p v d i , o v i , x v i , z v i , ,   ξ v i ,   t ) d t , x T = [ r v i , p v i , p v d i , o v i , x v i , z v i , ] X
where τ is the time, frame of reference; i = 1, 2, …. N number of vehicles; w, e, r, p, o, x, z, ξ , t are the weighting coefficient, energy consumption, real pathway, parameters, operational characteristics, vehicle motion characteristics/performance, environmental characteristics, noise vector, and time; while the indexes t s i 0 ,   t f i τ mean motion starting and finishing times (forgiven i-th vehicle); v —given vehicle ( v i depicts the i-th vehicle); v c ,   v d are related to the vehicle instantaneous consumption and a human vehicle driver. Here, r v i vector characterizes the real pathway (slopes, curves of the road, track) along which the given i-th vehicle moves during [ t s i 0 ,   t f i τ ] time period. Vectors p v i , p v d i are completed from the vehicle (types, sizes, empty mass, engine, engine performance) and driver characteristics (dynamics, reaction time). The operational characteristics o v i contains all the available real data: the real condition of the given i-th vehicle as load factor, age, used size of tires, and pressure in tires. The real motion of the i-th vehicle is characterized by a vector, x v i . The environment as air temperature, rain, or fog, is defined by the vector z v i according to the i-th given vehicle. Finally, the noise vector contains the random noise as traffic jam, accident, or road reconstruction related to the given i-th vehicle and its pathway.
Equation (2) seems solvable; nevertheless, it deals with a large number of vehicles reaching even some millions in large megacities. A more detailed evaluation of Equation (2) shows that it is nearly impossible to solve Problem (1).
  • At first, the objective function is nonlinear. It is enough to underline that the fuel consumption depends on the vehicle’s drag, which is a function of the vehicle velocity square. Furthermore, the fuel consumption depends, e.g., on the number of stops or accelerations, or the duration of rush hours. Fuel consumption of the same types of cars might differ by 50%–80% depending on the drivers (“young dynamic”- or “old lady”-type drivers).
  • Next, vehicles’ motion might be started and finished in any local places or at the borders of the investigated city areas. The given i-th vehicle may take part in traffic several times (moving–parking–moving).
  • Additionally, the situation may change dynamically because of an accident, tropical rain, or simple traffic conjunction.
  • Finally, demand and demand in given transportation means are changing quickly. Transportation networks planned and built based on demand forecast used available data on a given time of social and economic requirements. Therefore, the networks were planned for mass transportation and motorized vehicles. Nowadays, the system is weak in parking and bicycle or scooter lanes. On the other hand, it is good news that the young generation does not prefer to have a car; young people like to use car-sharing systems, and advanced, e-transportation solutions.
Because of the difficulties in possibly solving the optimization Problem (1), several classes of methods are developed to solve the traffic optimization problem by its simplification and size reduction.
At first, instead of the nonlinear objective Equation (2), a simplified linear function might be applied:
E t = f ( x ) = 1 τ i = 1 N w v i e v i s f
where e v i s f is minimum energy used by i-th vehicle during its move from start to the final position.
Figure 3 shows the possible calculation of e v i s f . It covers a part of the city road system. Ellipses give junctions, and lines show roads between the junctions. The i-th vehicle starts its motion at junction s (red state, j,l − 4 in Figure 3), and finishes at state f (j + 2,l). The energy used for passing the junction (j,l) and moving to next junction (p, r), for example to (p = j + 1 and r = l − 2), is defined as e v i j , l ; p , r = e v i j , l ; j + 1 , l 2 . The red lines show the path from junction s to junction f with minimum energy used. The minimum energy path does not necessarily equal to minimum time, minimum cost, or minimized environmental impact. (For example, electric or electric-hybrid vehicles may even generate energy during the decelerations. Therefore, e v i j , l ; p , r can even be negative.)
In Equation (3), the weighting coefficients, w v i , take into account the real operational conditions as load factors (as how many passengers are in the car). It is clear that the minimum energy used elements, e v i j , l ; p , r , complete a special minimum energy used matrix,   E m i n ,   v i , for each i-th vehicle.
In a very generalized form, instead of a road system network, a grid can be defined for covering the urban area. Of course, the minimum energy used matrices must be determined for the grid representation.
The number of vehicles might be reduced by the definition of a series of standard vehicles. For example, depending on the required accuracy, 10–25 personal cars can be defined with different sizes, engine, and drivers.
The minimum-energy-used matrices must be predetermined for any changes in the environmental (weather) characteristics, z, and the noise vector, ξ (defining the road construction, accident, or traffic jump occurrences).
Traffic intensity and situations change very quickly. Therefore, the minimum energy used matrix must be recalculated at least every minute, depending on the real traffic situation. Most developed traffic management systems may use simulation and forecast of future traffic. It is a short-term forecast that may use the statistical data measured. However, the data provided by the cooperative vehicles might be applied to make a better, more accurate forecast—this approach is required to use the hierarchical approach to monitor and manage the traffic.
Traffic management may use partial optimizations of special parts or sub-system elements like traffic lights or conjunction optimization of the supply chains, optimization of deliveries of goods, and optimization for priority vehicles.
By taking into account all these discussed aspects, the total energy consumption is
E t = f ( x ) = 1 N T i = 1 N s v w s v i k = τ s v i s / T ( τ s v i f / T ) 1 e v i s f ( E m i n , s v i s f [ k ] ) + e [ k ]  
where T is a time step, N T = τ / T number of steps, index sv depicts the standard vehicles, N s v is the number of standard vehicles, τ s v i s ,   τ s v i f time of starting and finishing the motion of the i-th standard vehicle, k is the number of time step ( k = 1 ,   2 ,   ,   N T ) , and e extra energy consumption caused by managing with priority vehicles.
Nevertheless, the optimization problem is reduced in size, and depending on partial objectives, the active and dynamic optimization of the traffic needs real information on the traffic condition. Such information might be measured and collected by widely distributed sensors and integrated into one system as the IoT.
The recommended concept is a total transport and total management system. This means that all motions of people and goods (including walking, sport, travels, freight transport) realized by any type of vehicles (from electric scooters, up to supersonic business jets) as elements of the single transportation system are monitored and controlled by a special hierarchical concept. Such a system (Figure 4) has three levels:
  • physical levels including all the objects, vehicles, and even stakeholders;
  • digital level that transmits the data/information and uses it for multi-directional info-communication; and
  • virtual or computational center, which supports the operation center and situation awareness, evaluation, decision making, and realized active dynamic control.
In such a system, especially nowadays, the sensors and their integration in the transportation system represent a central problem. The digital level realizes the IoT concept, while the third level is fully integrated into the total transportation system, namely, it uses computing and ubiquitous computing (when computing may appear locally anywhere, anytime).

2.4. Sensing and Technologies in Total Transportation Management

Smart city developments are driven by accelerating technology developments, defined by technology laws and studied by technology foresight and forecast techniques, as well as technology identification, evaluation, and selection methods [19,48,49,50,51]. The most crucial future and emerging technologies that enable the development of smart city solutions and especially smart city total transportation management are
  • disruptive technologies including new methods of design and production process planning, new optimized transport network planning, new (lightweight) materials (as full composite vehicles), new solutions as (as electric vehicles), new unconventional solutions (as an autonomous vehicle, pilot-less taxi drones);
  • micro-electric-mechanical-system (MEMS)-based sensors and actuators, enabling traffic monitoring and active control;
  • new info-communication technology based on wireless technology, Internet, cloud, and Internet of Things concepts;
  • including further data processing, situation awareness–evaluation–decision making by the methods of soft computing and artificial intelligence; and
  • improving the new concept of total transportation/total management.
The new and emerging technologies enable the creation of new microsensors that might be integrated into the
  • vehicle structures and systems;
  • operators’ working environment, and more particularly in the drivers’ cockpits and monitoring/control rooms;
  • infrastructure of the transportation system; and
  • general info-communication systems.
The elements of the transportation monitoring and management systems include the sensors, data info-communication, data collection and data processing, situation awareness, and evaluation decision making. Sensors are items providing (mostly electric analog or digital) signals depending on the investigated objects’ condition. They may use physical, chemical, and recently biological principles [52,53]. Sensors are classified [52] as:
  • passive sensors—that do not require own or external power supports (like thermocouple, electric field sensing, piezoelectric sensors, chemical and infrared sensors, or video camera/infrared camera)
  • active sensors—sensing devices that require an external source of power to operate (GPS, radar, ultrasonic detectors, Lidar, blood pressure sensors)
This article recommends using passive and active condition monitoring and detection where
  • passive system uses signals measured by sensors in case of out of control actions, in quasi-steady operation modes and
  • active system applies predefined inputs, trajectories, special loads, or test signals (including, for example, recognition–decision action time for braking or delay in braking, deviation from predefined trajectories as curved lanes).
By implementing this monitoring classification approach, the following methods can be applied.
  • passive monitoring of the operational conditions—built in the environment from a distance to the vehicles or the operators, monitored objects, using passive and active sensors like video cameras, signal transmitters, or eye tracking, infrared cameras, microwave radars
  • passive monitoring by sensors integrated into the working environment for direct sensing of the operators’ behaviors, such as heart rate; skin resistance; built in the operators’ control elements or their clothes; integrated into the infrastructure as road construction, rail tracks, bridges, or tunnels to measure the size of the vehicles, their weight, or to detect the deformation in the structural elements
  • semi-active sensing and monitoring—measuring some characteristics as the reaction of operators on some signals/information, the action of vehicles while passing small obstacles, load, stress and/or deformation of bridges under heavy vehicles
  • active monitoring and detection—passive or active sensors that measure the reactions of the vehicles/operators on the specially generated signals (including signals initiated to test the vehicle systems, transportation infrastructure, or operators).
The challenging scenario has made IoT concepts obligatory to be implemented in smart cities since they create a connection between the objects and intelligently communicate to humans [5,54,55]. The classified monitoring and detection methods must be harmonized with the introduced novel concept of total transportation management (Figure 4). Having some ideas on the size of the system is recommended to study the EU’s research and results supported by the Smart Santander project [23]. This project established a unique world city-scale experimental research facility to investigate and demonstrate the possible Internet-of-Things-driven service for future smart cities [24,25]. A large flexible scale experimental area was set in a city, Santander, in a real environment. More than 12,000 IoT devices were applied and integrated into the experimental area. A special application was developed for users that provides an augmented reality service with information about more than 2700 places in the city of Santander including tourist information offices, shops, monuments, buildings, beaches, parking lots, and bus stops and real-time availability of traffic, weather, short-term demands or even availability of parking places.
Moreover, the users’ mobile phones were included in the information system as other sensing sources. The users’ mobiles transmitted information on, e.g., GPS position, noise, and temperature. By this, the SmartSantander project showed the possible realization of the extensive integrated transportation system management based on the available IoT solutions and real-time information sensed by a large number of distributed sensors providing information on, e.g., the vehicles, the infrastructure, or the operator.

2.5. Data Processing

The total transportation management uses a special data processing and decision support sub-system. It is special because it synthesizes the latest computing methods (artificial intelligence) with ubiquitous computing (locally distributed partially optimized, embedded sub-systems) to reach high ambition goals: operate an effective, sustainable transportation system that meets the needs of society and the economy, and has a minimum impact on the environment, while being safe and secure.
Total transport management uses sensors integrated into the infrastructure, environment, cooperating and contract-based vehicles, drivers, enterprises, institutions, surveillance systems, and technology developments. The information, depending on its value, is used in different management concepts as follows.
  • passive control—applies data provided by the stakeholders (including historical data and transportation system network capabilities)
  • active control—uses the additional information obtained from real traffic measurements (namely passive monitoring, primary surveillance, information available from stakeholders/users like a mobile for positioning)
  • dynamic management—uses information from the secondary surveillance (provided by the cooperative and contract-based vehicles, drivers, companies) for passive and active monitoring.
  • proactive management—top management that uses the results of predictive simulations (on the possible occurrence of the traffic jam caused by accident, weather changes, demonstrations) as feedforward, or internal model control, as well as using free routes for prioritized vehicles or simulating the vehicle motion in exceptional environmental cases.
Generally, such a computing system must solve the following cascade of computing (Figure 4) independently on the role and size of computing being used locally for sub-systems, elements (even to the individual vehicle or cross-section), or the entire system.
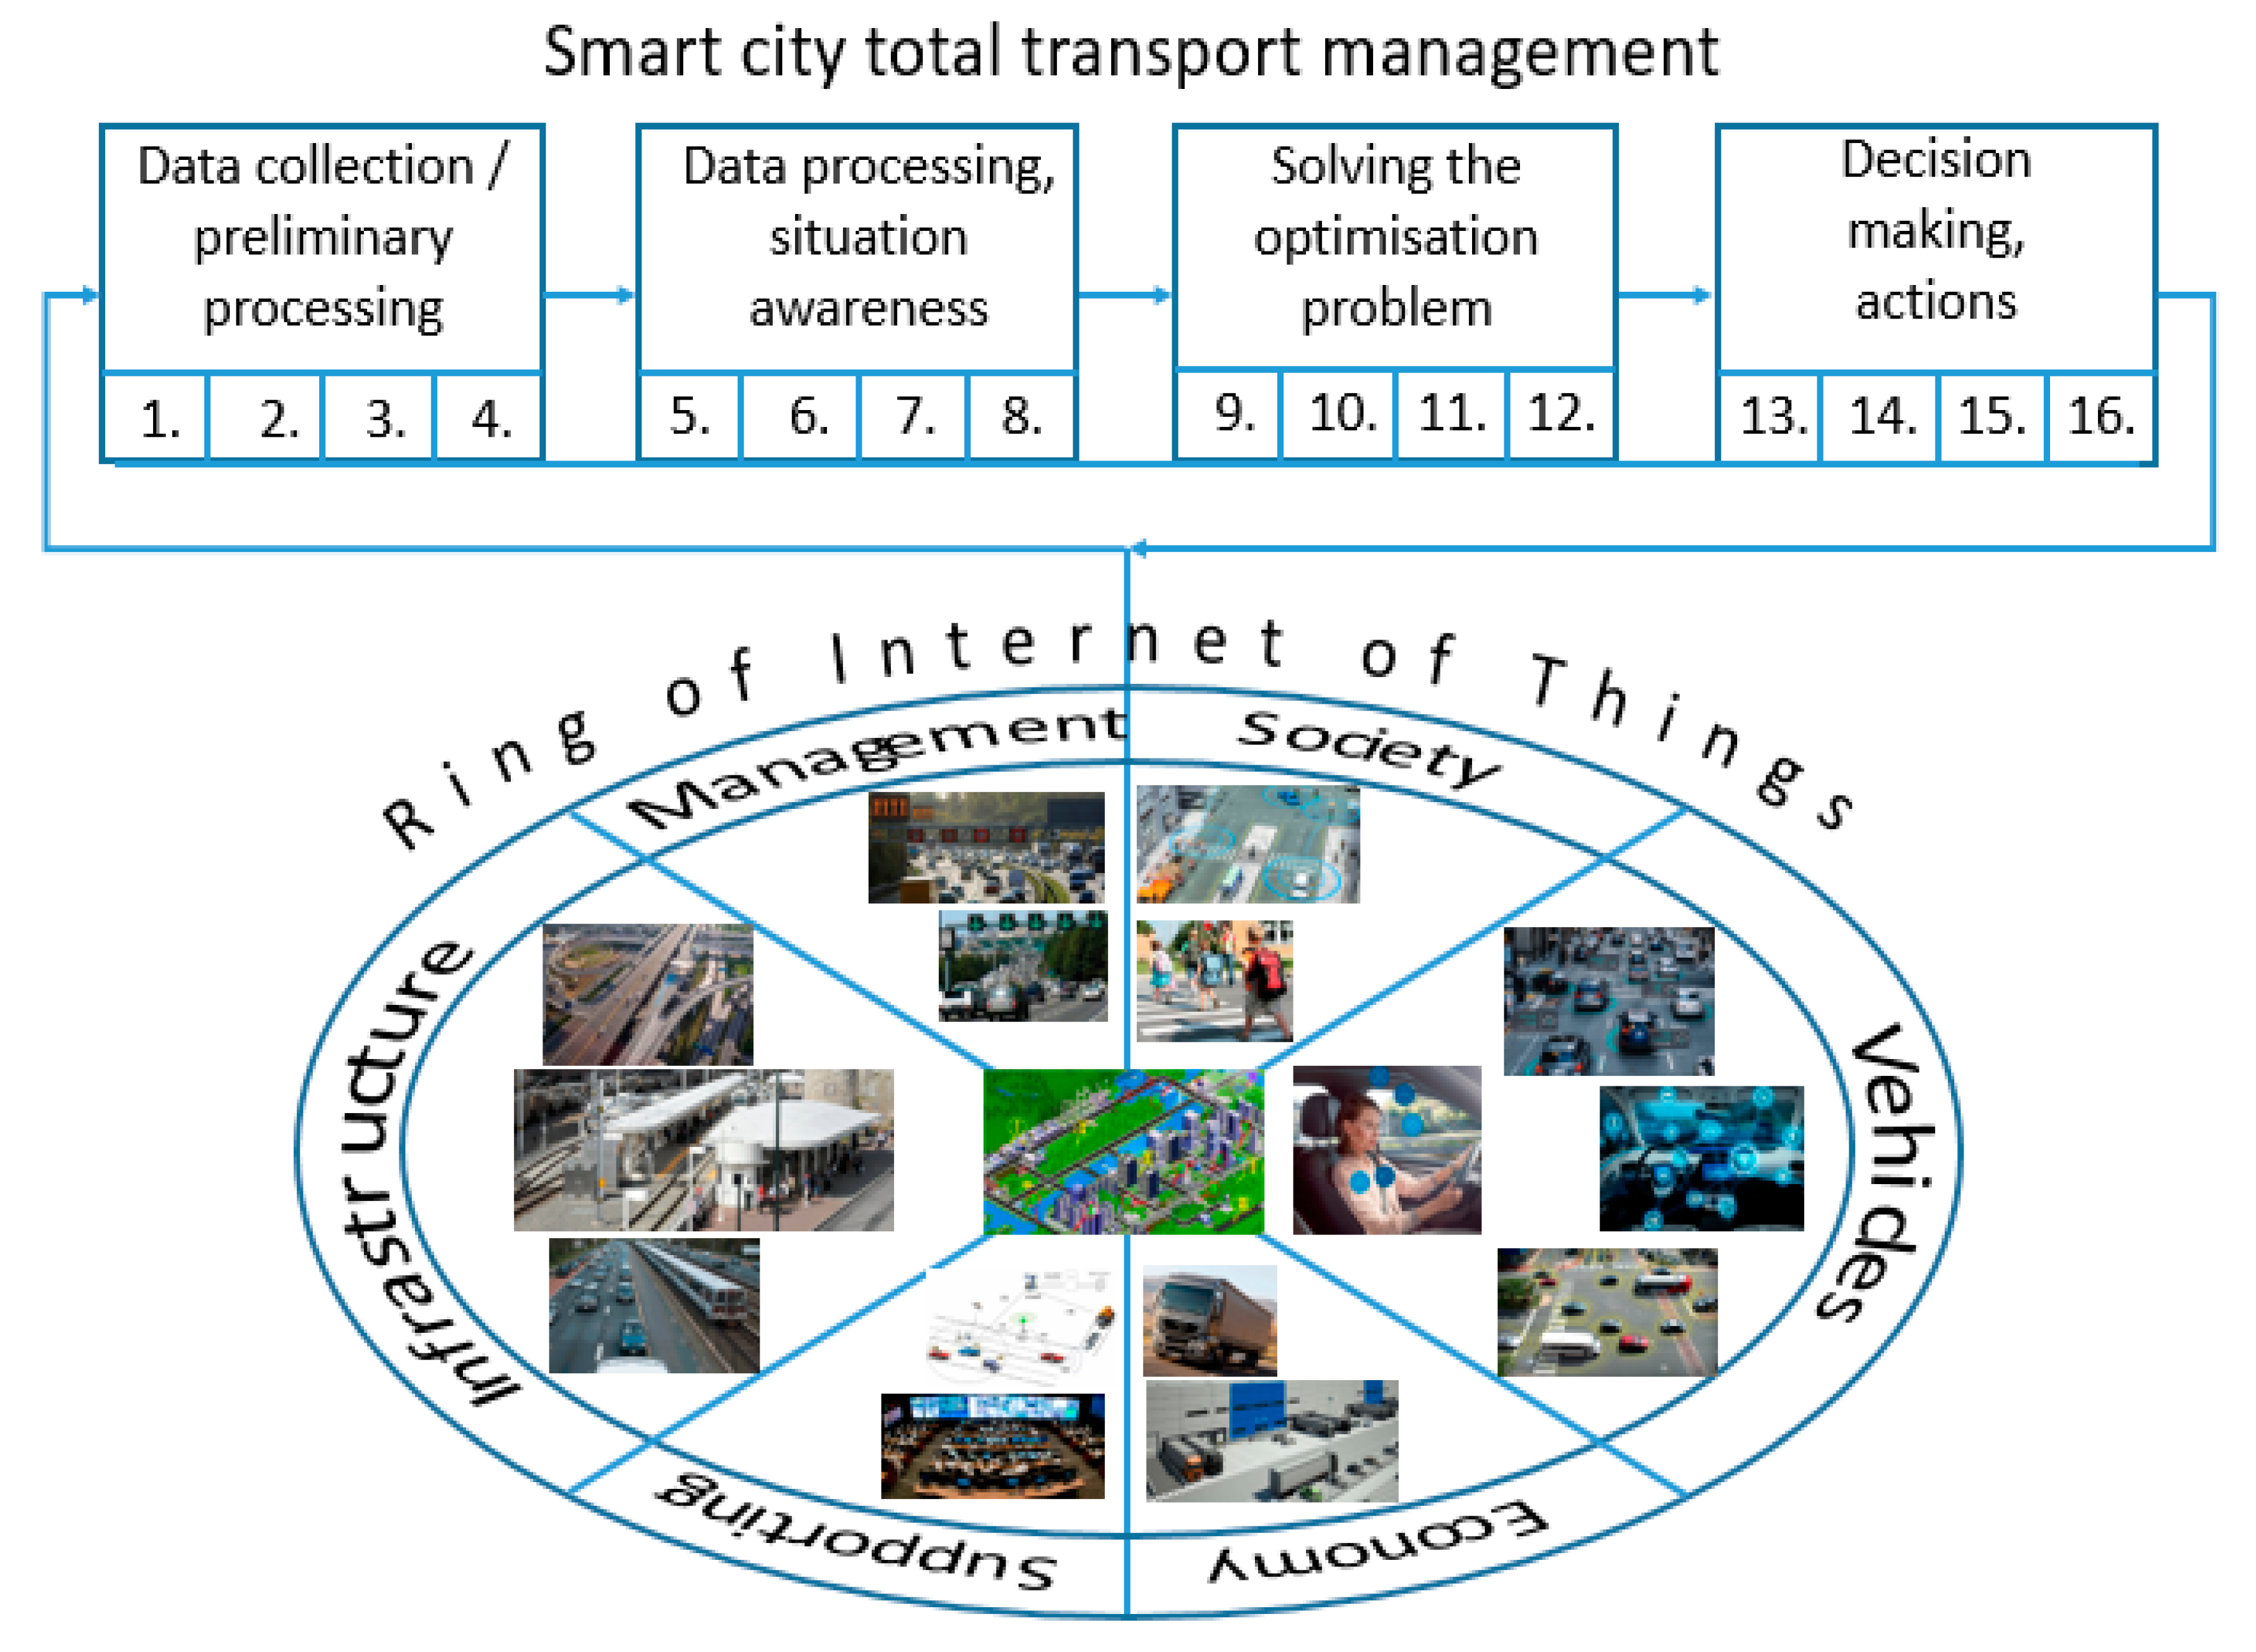
  • data collection/preliminary data processing:
    i.
    data collection and noise filtration—reducing effects of noise on measurements
    ii.
    primary (preliminary) warning—detecting the crosses of signals in their defined borders on tolerance zones, appearing not prescribed situation (that may result in an error, accident)
    iii.
    data harmonization—conversion of the measured records to comparable forms of data, selecting windows on data series with the same time frames
    iv.
    statistical analysis—assessment of the primary statistical values and trends, while saving them to permit further investigations
  • Data processing, situation awareness-simulation-evaluation:
    i.
    automated situation awareness—the perception of the environment with time and space, predicting the state in the near future
    ii.
    study of special situations—situations being out of the normal operational circumstances, like accidents
    iii.
    simulations—using the available simulation software to simulate local event or sub-system operation, or total system
    iv.
    evaluations—study the simulation results, providing inputs for optimization
Situation awareness forms the critical inputs to the operator’s decision making. If situation awareness is incomplete or inaccurate, the decisions will be wrong. Whereas, a drive may accurately understand what is occurring in the environment.
Based on the data collection/preliminary processing, the picture of the environment is assessed, with the comprehensive set of objects and events. Information grouping should tie multiple attributes to each object while minimizing the number of objects presented. For example, the position of the other vehicles and obstacles around the vehicle displayed on the driver’s screen.
The system trains the special situations, which allows it to predict the future state of the environment to ensure focused attention after pre-attentive processing. The design of the information displays should allow reorientation to the situation in the event of real-world information. With advanced technologies, the quality of information has been satisfied, directly providing users with higher-level situation awareness.
Finally, no matter how carefully a given system is designed, evaluations of situation awareness are needed to investigate, based on what was happening in the simulation. The comparison of the real and perceived situations provides an objective measure of system situation awareness.
The optimization problem (as the simulation methods) might be solved for the entire system, sub-system, or elements. However, all the optimization solutions must be harmonized. This goal can be reached by three types of hierarchy: (i) hierarchy in the system (system structure), (ii) hierarchy in transport (vehicle) classification (e.g., first come first serve, prioritization), and (iii) situation prioritization (disaster response, significant accident).
  • Solving the optimization problem:
    i.
    objective function definition—the total system must be optimized for minimum energy consumption (Equations (2)–(4)) or minimum total cost
    ii.
    constraints definition—the constraints might be defined for technical, technological operation, economic, societal, environmental impact, safety, and security aspects (like an actual problem, social distance in mass transport)
    iii.
    optimization problem solution—with linear or non-linear programming or artificial intelligence
    iv.
    result evaluation—check the applicability of the results
The objective function/total energy consumption can be calculated with Equation (2). Based on the traffic condition’s real information and the active and dynamic optimization of the traffic, the objectives were determined. Therefore, the optimization problem, like Equation (4), can be solved. The results should be evaluated by comparing it with the real traffic condition.
  • Decision making and actions:
    i.
    automated decision making—it might be applied to the small optimization problems like the control of traffic lights at given cross-sections, and it can be determined as a recommended decision for the total traffic management
    ii.
    decision making for special situations—caused by unwanted events (accident) of planned situations like protests or an essential sports event
    iii.
    decision making for emergency situations—in case of, e.g., a disaster such as a flood, when lifesaving is the primary objective
    iv.
    actions—the realization of the decision
The results of the optimization problem were considered as an input for the decision-making and action process. In this process, several situations were determined based on situation awareness, including optimal energy consumption, special situations, and emergency situations. Then, the users can usually choose the solution that satisfies the real-traffic environment.

3. Results—Examples of Sub-Model Developments

The implementation of the described approach to smart, intelligent total transportation management requires the integration of a large number of distributed IoT devices in one system and the development, as well as usage, of a series of sub-models and new data processing methods.
The introduced general optimization Problem (1) can be applied after the definition of the objective functions and constraints. Therefore, several sub-models must be developed and applied. For example, the microscopic model as a car-following model determines the vehicle density in lanes/tracks. The integration of drones in the urban transportation system might be supported by the development of formation flights and obstacle-avoiding systems. Similarly, further studies are required for the management of different classes of vehicles/transportation subsystems.
In this section, three primary references as examples demonstrating the further sub-model developments will be presented, which can be applied in the proposed smart intelligence total transportation managing system.

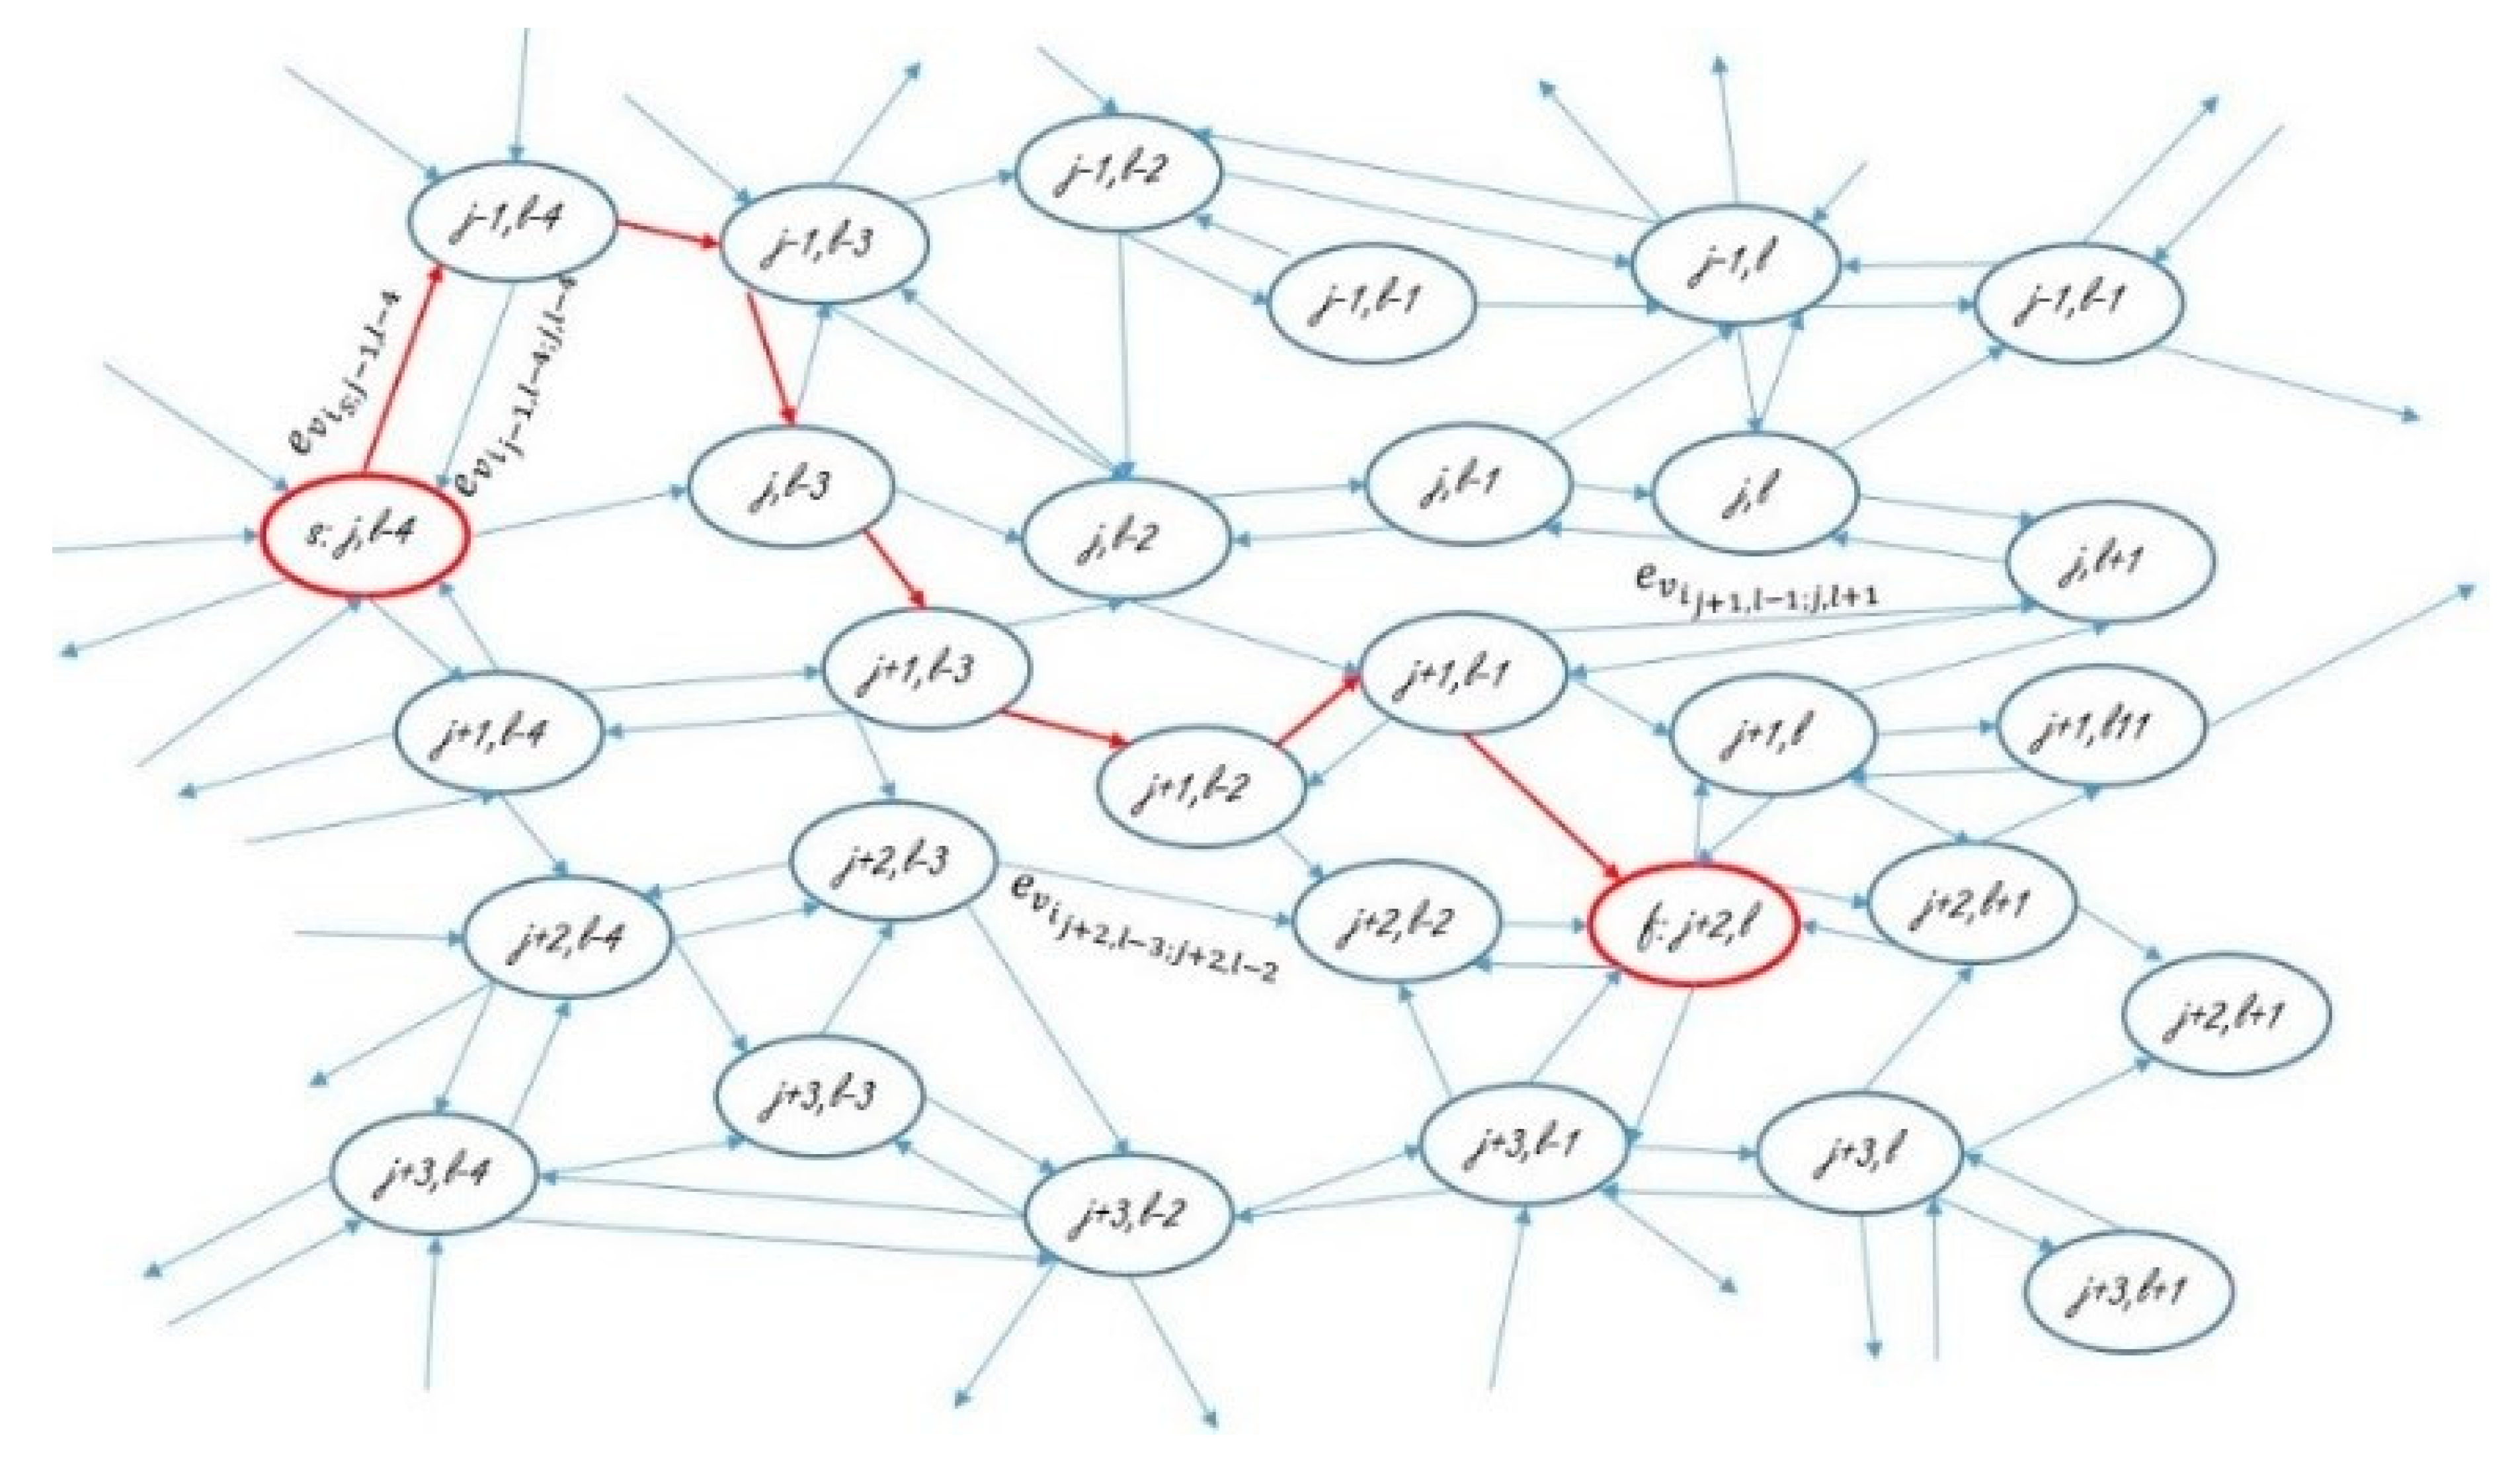
3.1. A New Car-Following Model

One of the essential microscopic models applied by transportation management systems is the car-following model [56,57,58]. It describes the one-by-one following process of vehicles in the traffic flow. The first car-following models were developed in the 1950s [59,60,61]. Several concepts are behind the first applied, classic models [62,63]:
  • stimulus-response model
  • safe distance model
  • psychophysical model
  • cell-based model (cellular automata model)
  • optimum velocity model
  • trajectory-based model
For the last decade, new transfer, stochastic, and intelligent models were developed.
Generally, the vehicle’s motion in traffic flows can be described with active dynamic nonlinear models. The vehicle motions are activated by the drivers’ decisions based on the available traffic information, traffic conditions, situation awareness, and knowledge of the driven cars’ performance, personal practice, skills, and available resources. Principally, the motion of vehicles is disturbed by stochastic effects and drivers reacting on the vehicles depending on their subjective decisions.
After analyzing the drivers’ decision-making processes in selecting their vehicles’ appropriate velocity, we become convinced that the drivers calculate the required changes in speed based on the relative distance and speed between the vehicles. In addition, the driver should also consider the vehicles’ performance. Altogether, these aspects result in a randomly composed real stochastic process that can be represented as a diffusion process:
a = v ˙ = f ( v , t ) + σ ( v , t ) η ( t )
This controlled stochastic process—as known—can be approximated by a Markov chain process that leads to the following simple model
a [ k + 1 ] = b d v ( v n 1 [ k ] v n [ k ] ) + b d x [ ( x n 1 [ k ] x n [ k ] ) x p d n ] + ε [ k ]
where a is the acceleration of the vehicle; η is the noise disturbing the process; ( v n 1 [ k ] v n [ k ] ) and ( x n 1 [ k ] x n [ k ] ) are the relative velocity and relative distance between the two (n − 1)-th and n-th vehicles, respectively; bdv and bdx are the sensitivity coefficient, which can depend on the time and given vehicle and driver behaviors; Δxpdn is the predefined safe distance between the vehicles; k is the number of steps in the chain (t = kΔt); and ε(k) is the random value disturbing the speed decision and maintaining process.
The introduced Markov model can be easily adapted to the real observed traffic by estimating the sensitivity coefficients.
Different approaches can be applied to the calibration and validations [64]. In this study, the concept of the model was validated by comparison evaluation of the Markov car-following model (6) with the Gazis–Herman–Rothery (GHR) model (7) and the S-curve model (8) solved in a simulation environment.
The GHR model was presented by Gazis et al. [65] as follows:
a n ( t + T ) = λ l ,   m [ v n ( t ) ] m [ x n 1 ( t ) x n ( t ) ] l [ v n 1 ( t ) v n ( t ) ]
where, m, l are parameters for speed and distance headway and λl,m is a constant showing the characteristics of the drivers.
Because the driver sensitivity curve is very similar to the Gompertz curve, we decided to use the modified Gompertz curve [63] to define the coefficient λl,m in Equation (8):
a n ( t + T ) = { a 1 e a 2 e a 3 | [ v n 1 ( t ) v n ( t ) ] q [ x n 1 ( t ) x n ( t ) ] l | a 4 } [ v n ( t ) ] m [ x n 1 ( t ) x n ( t ) ] l [ v n 1 ( t ) v n ( t ) ] q
Equation (8) is called the S-curve model.
The simulation results are demonstrated in Figure 5 and Figure 6.
Figure 5 demonstrates the simulation results, e.g., changes in acceleration, velocities, running distances, and relative distances of vehicles in cases of using the described three different models. The model parameters are given in the figures. The reaction time was taken as 0.7 s. The GHR and the Markov models are quite similar. The changes in velocities are nearly the same for each vehicle in the case of using the GHR model. The S-curve model initiates an earlier reaction to the changes in the condition of the first vehicle. Simultaneously, the dynamics of the motion of the following cars lead to slower stabilizing the conditions. Only the Markov model really takes into account the changes in the relative distance between the vehicles. Therefore, the following car’s velocity increases or decreases more than the leader car’s velocity, which means that the changes in relative distances between the vehicles are much (nearly four times) smaller than in cases of the GHR or S-curve models.
Figure 6 shows some exciting results of changes in model parameters. Figure 6a,b illustrates the sensitivity of GHR models to changes in their parameters. The GHR model is not sensitive to the relative distances as visible in Figure 6c. In case of starting the simulation with a car velocity being equal to 30 m/s, beside the eighth vehicle with 25 m/s, only; the velocity of the eighth vehicle quickly increases to 30 m/s, but the relative distance between the seventh and eighth as well as between the eighth and ninth cars also rise quickly.
The Markov model also highly depends on the changes in parameters (Figure 6d–g). Figure 6e demonstrates that the changes in the coefficient take into account the relative distances between the vehicles, which may cause a collision. In the given simulation, at least three cars out of 20 will have accidents. On the other hand, the Markov model has no such significant sensitivity to the changes in initial conditions (Figure 6i).

3.2. Managing Drones as a Formation to Avoid Obstacles in Smart Cities

The future smart city must integrate drones into the smart, intelligent transport system. In our previous studies [66,67], we presented the regulations of the use of drones and proposed the drone-following models to manage drones in traffic flows. These models describe the one-by-one following process of drones in the traffic flow. This approach is based on the determination of the drone acceleration that depends on the differences in velocities and distances between the given drone and its leading one. Although the simulation results show that these models can be applied to develop significant simulation technologies or a new type of control, the equations of motion of drones must be integrated into these models to improve the proposed method. These studies’ results can be applied in the total transportation management system in smart cities, which is used for managing drones in urban areas.
In this section, we present an approach to control and manage a drone formation with avoidance collision, which can be applied in the total transportation management system.

3.2.1. Formation Model

Formation motion means a group of vehicles moving together and following a leader vehicle. In such a case, the motion of the group of vehicles can be managed by only controlling the leader vehicle, as originally developed for advanced air traffic control. The formation flight modes are considered more than relevant for the coordination of drones, as conventional air traffic management techniques and tools are powerless in dealing with such a high number (and complexity) of movements. The model can be relatively easily adapted to the road or urban traffic systems.
Consider a multi-drone system consisting of N drones and a leader. The motion dynamics of each i-th drone can be represented by a simple system of the linearized equation:
s i ˙ = P s i + Q u i
where si ∈ Rn is the drone i’s state, namely it is a state vector, and ui ∈ Rn is the drone i’s input, input vector, which can only use local information from its neighbor drones. Matrix P = [pij] ∈ Rnxn is a diagonally dominant matrix or state transition matrix, which means that
| p i i | j = 1 , j i n | p i j |
for all i = 1, …, N. The matrix Q is of full column rank.
The leader drone, labeled as i = 0, has linear dynamics as follows:
s 0 ˙ = A s 0
where s0 ∈ Rn is the state of the leader drone. It can be noted that the leader’s dynamics is independent from the others.
With the assumption that the pair (P, Q) is stabilizable, the drone Equations (9) and (10) are said to be achieved if, for each drone, i {1, …, N}, there is a local state feedback ui of {xj: j ∈ Ni} such that the closed-loop system satisfies lim t s i ( t ) s 0 ( t ) = 0 for any initial condition si(0), i = 0, 1, …, N.
We use the control law for drone i as follows:
u i ( x ) = j N i s j s i d i j 2
where dij is the desired inter-distance related to the position vector. A drone j is the neighbor of drone i.

3.2.2. Obstacle Avoidance Model

Along with the spreading trend of drone applications, the drone collision’s flight safety with buildings, helicopters, and landscape becomes an urgent issue for civil and defense agencies. A collision avoidance system is a necessary module for drone flights, especially for autonomous drones in dense airspace shared with other aircraft, in order to guarantee airspace security. Conflict detection and collision avoidance are also valuable tools for highly automated and autonomous vehicles.
It can be noted that the research on collision avoidance for drones has a high failure cost because the collision may destroy the drone if the avoidance fails. Therefore, several simulation systems for algorithm testing are designed in laboratories. The obstacle model is one of the critical parts of these systems, described as the following.
Let B be the set of all obstacles for a given drone within its operating space. Assume that each obstacle is prescribed in a cylinder with the center CBl and radius rBl, as shown in Figure 7.
The surfaces of cylinders can then be used to form constraints for obstacle avoidance. Accurately, the safe distance ds,l from the obstacle l is calculated from the cylinder center to its surface at the flying height as follows:
d s , l = { r B l 2 + ( Z M i , k Z C b , l ) 2         i f   Z M i , k   Z m a x , C b l r B l 2 + ( Z m a x , C b l Z C b , l ) 2     i f   Z M i , k >   Z m a x , C b l
where zmax,Cbl is the height of the obstacle l.
To compute the violation cost between each generated path and obstacle centers, we first assumed that the formation is rigid and can be fit within a sphere with the radius:
rs,l = rd + ds,l
where rd is the radius of the drone, including propellers.
The violation cost can be now derived as follows.
For the l-th obstacle, compute the distance from its center CBl to the segment P i , k P i , k + 1 :
d l , k = ( x M i , k x C b l ) 2 + ( y M i , k y C b l ) 2 + ( z M i , k z C b l ) 2
where Mi,k = {xMi,k, yMi,k, zMi,k} is the midpoint of the segment as shown in Figure 8. At a given flying height zMi,k, dl,k is then compared with the safe distance to the obstacle. The comparison results in the following violation function:
This function ensures that the distance dl,k must be larger than the safe distance for obstacle avoidance. The violation cost is then computed for all obstacles as:
V l = 1 B l = 1 B V l , k
For all m segments, the final violation cost on average is represented as:
Q = 1 m l = 1 m V l

3.2.3. Formation Control Strategy

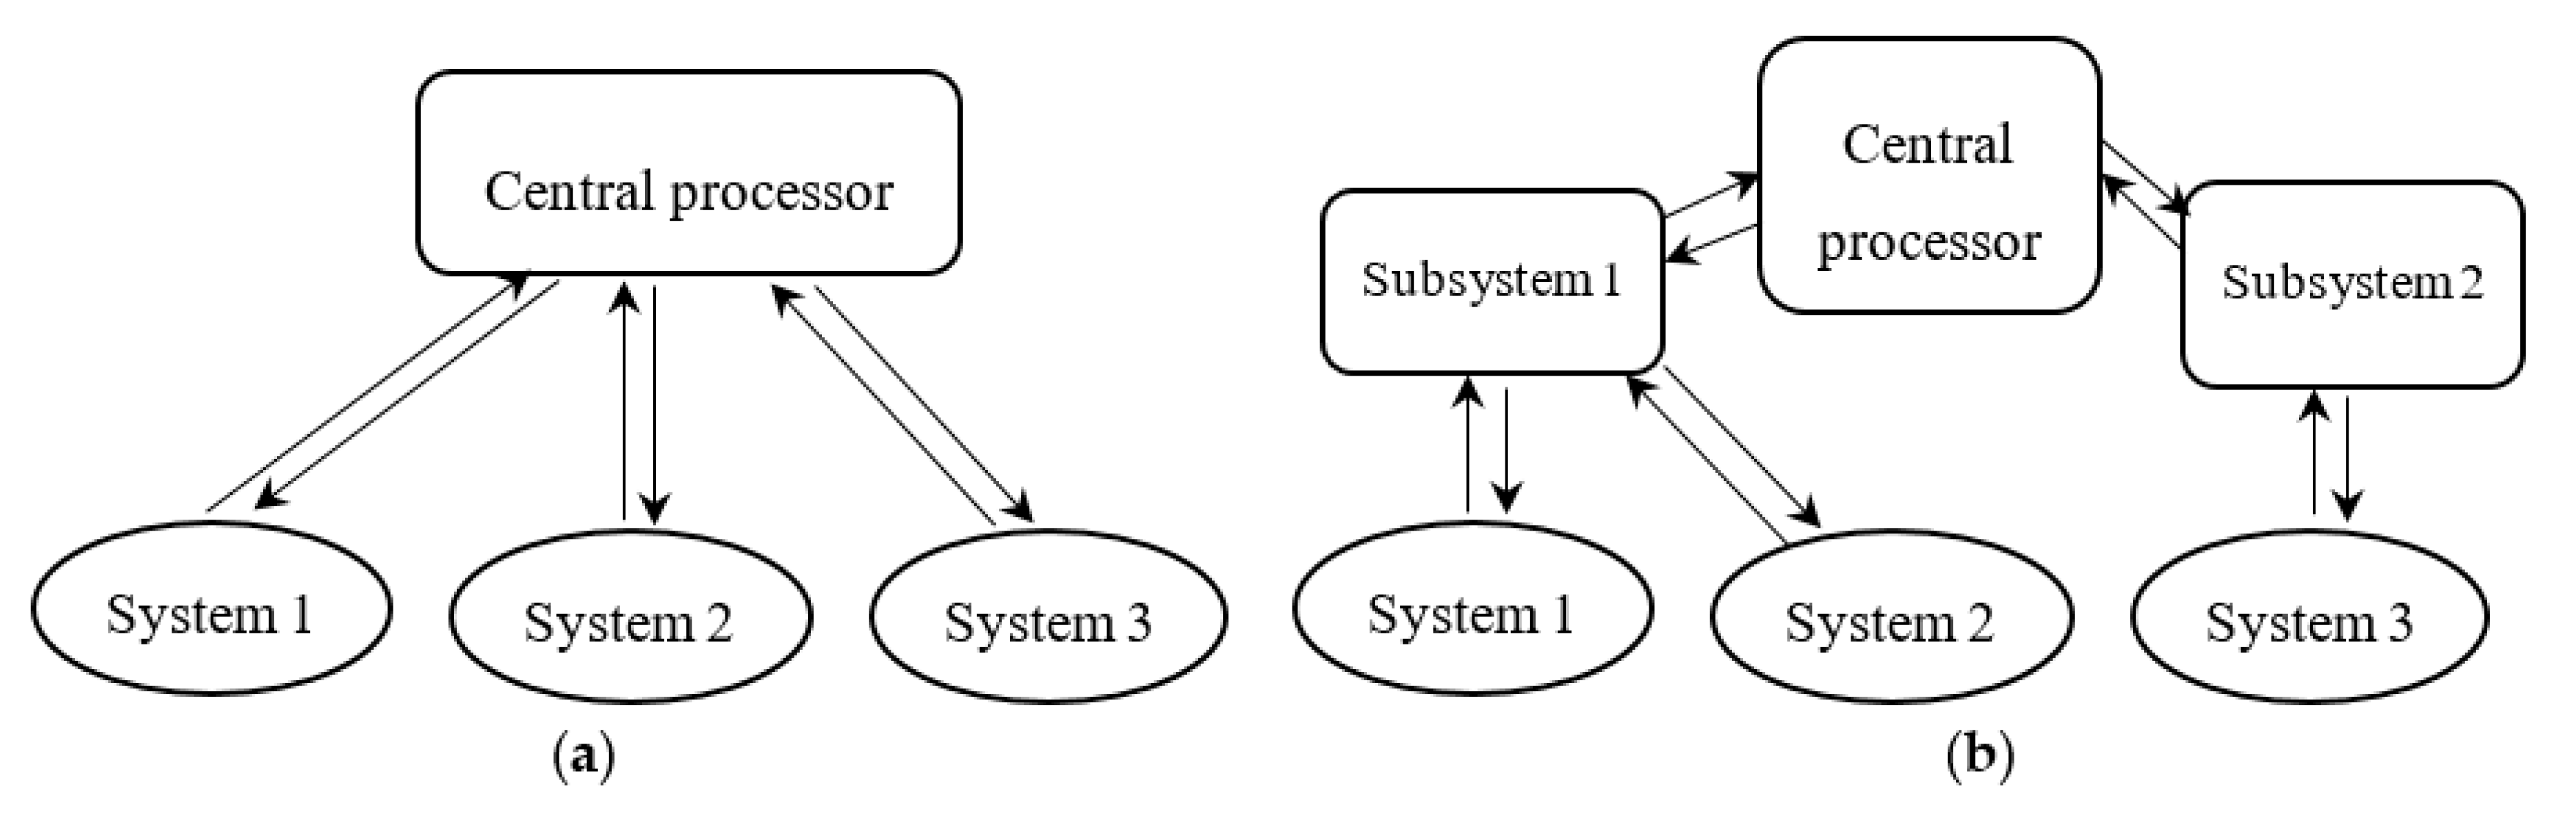
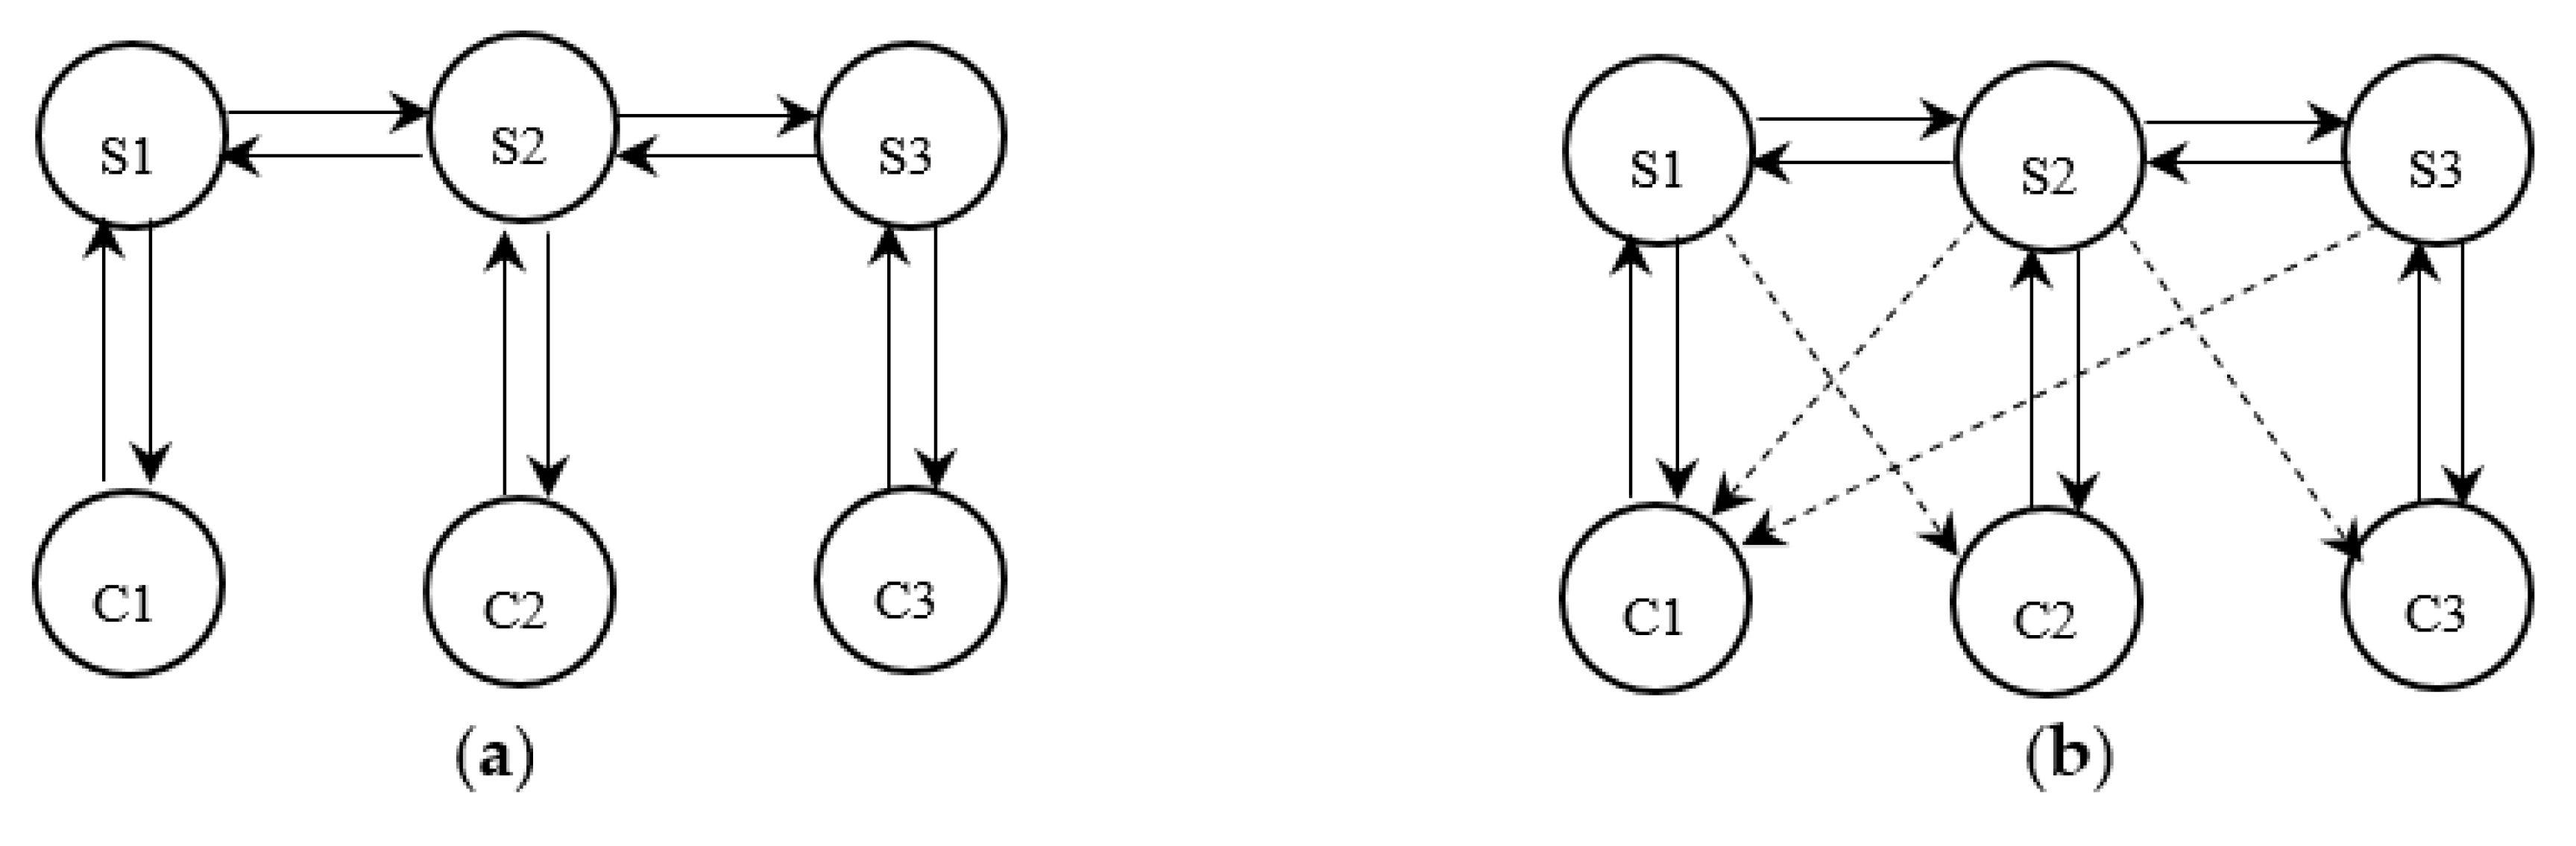
  • The Centralized Control Strategy
This approach is primitively proposed, where a central processor exists (see Figure 8). The central processor is responsible for collecting data of subsystems and return decisions to them. This control strategy is usually considered a simple, easy to implement, and efficient approach, but it has weak robustness for the central processor’s fault. This weakness may cause severe problems in large-scale practical systems. The standard leader–follower formation configuration is intuitively considered a centralized method, where the leader is independent of the followers.
2.
Decentralized Control Strategy
Considering the complexities and difficulties of the research on the overall system, there is more interest in the approach that can divide the analysis and synthesis of the global system into independent or almost independent subsystems (see Figure 9a). The idea is that each subsystem in the whole system has its processing unit and makes its own decisions based on its measurements. Decentralization allows the overall system to take advantage of the division of labor by sharing the subsystems’ decision-making load. In a decentralized control system, the whole system is no longer controlled by a single controller but by several independent controllers, which altogether consist of decentralized controllers implemented on each module. In general, decentralized control is used in a large-scale system, which has a couple of subsystems.
In a drone formation, if each drone has its controller and moves according to its measurement (detection or sensing), the formation control strategy is decentralized.
3.
Distributed Control Strategy
This approach evolves from decentralized control with sharing local information (see Figure 9b). The distributed control is promising to be superior to centralized control when data delays are present. Distributed control is related to the areas of decentralized control and large-scale systems. Distributed control strategies are usually related to a decentralized control design framework with communication issues. Such extensions of decentralized control contain communication among subsystems, local controllers, and communication in the feedback loop.
In the drone formation, if each drone communicates with all the other drones in this formation, the control strategy is not distributed. Therefore, in a multi-drone system, if the communication issues are considered in the decentralized control design framework, the formation control strategy is distributed. The behavior-based formation configuration is regarded as a decentralized method or a distributed method depending on the communications or interactions between drones.

3.3. Intelligent Total Transportation Managing System in Smart Cities

The introduced new concept, addressing the intelligent total transportation management system, has essential novelties related to the hierarchical classification of the transportation system and the application of the own management methodology to each class, as well as to the overall system. Here, a short description of the possible management with the significant classes of vehicles are introduced.
This system was initially presented in our previous studies [18], which uses a vast distributed network of sensors for surveillance and recognition of different vehicle types.

3.3.1. Management of Non-Cooperating Vehicles

The system collects available and measured data on the traffic conditions, vehicles, and weather conditions; such data are used as the primary input for surveillance. The non-cooperating vehicles are identified by sensors such as optical, infrared, ultrasonic, and radar built in the traffic infrastructure. These vehicles are then classified depending on their size and mass predicted performances and predictable goal trips. This information is used in a short time forecast of the traffic intensity and complexity, together with the information provided by the cooperating vehicles. Accordingly, the system evaluates and monitors where/which direction traffic will increase and where a traffic jam might appear, which supports even the drivers of the non-cooperating vehicles.

3.3.2. Management of the Cooperating Vehicles

There are three levels of cooperation, such as follows.
In the first level, called primary cooperation, the cooperating vehicles provide information on the vehicles, motion condition, and actual position using info-communication networks. These vehicles also provide this information to the nearby vehicles and harmonize their motions.
In the second level, called secondary surveillance, the cooperating vehicles send the information on the goal and target of trips to the traffic management center that may directly support these vehicles.
In the third level, these vehicles send data to the traffic management center, e.g., on the nearby vehicles, the infrastructure condition, and traffic situations.

3.3.3. Contract-Based Traffic Management

Contract-based traffic management is a supporting service that increases the efficient operation of both drivers and service providers. Accordingly, drivers are the first receiving the essential information. Service providers might also benefit from this service by gaining profit from this contract, allowing for efficient operation increasing supply competition.
The contract-based traffic management may consist of a “semi-priority” system. In such cases, the drivers will have information from the transport management centers on the recommended shortest ways, and possibly shorten the traveling time while seeing individual commanding signals on the road for a short time.

3.3.4. Priority Transport Management

The total transportation managing system uses passive methods to monitor the non-cooperative vehicles, semi-active methods for the cooperating vehicles, an active approach to support the contract-based transportation, and a proactive approach for managing priority vehicles.
The priority vehicles, such as police, fire machines, and ambulances, might be supported by free lanes/freeways by the total transportation managing system.

4. Discussion on the Possible Use and Preliminary Evaluation of the Concept

4.1. Applicability of the Concept

With the fast development of information technology (IT), the intelligent total transport management (ITTM) concept could be a solution for urban transport management, however, coupled with the efficient application of IoT technologies. The fast development and implementation of smart technologies for various applications are certainly opening new ways towards smart transportation.
The main idea of the ITTM concept is to provide more effective and efficient services in urban transportation, improve safety and security, and enable a general quality of the environment in cities for working and living. The ITTM could increase user comfort and security, reduce traffic jams, and save energy by providing users with real-time data regarding traffic reports, rerouting traffic and adjusting speed limits based on this information. Moreover, drivers will no longer search for vacant parking spots because of smart parking solutions that enable them to visualize this information in real-time through their smartphones.
The intelligent total transport management system (ITTMS) needs the ability to update the traffic information of a single road section in time and provide relevant traffic flow data for the connected signal ports. It must refer to the traffic flow information in the upper-level area to provide an optimal route, which can control the flow of traffic and convert the intersections and other road sections to each other.
The ITTMS will involve many aspects of the design, and all need careful consideration in the design of the city transportation management system. In this way, an ITTMS suitable for the city and the urban area can be designed to play a role in alleviating urban environmental impacts and promoting urban energy management development, for example, a total transportation management system in smart cities being operated as an ITTMS.
The total transportation management system has three layers, including physical, info-communication, and control generation, shown in Figure 10. The system deals with four different tasks: non-cooperating vehicles, cooperating vehicles, contract-based, and priority traffic management.
In such a system, users and service providers achieved satisfaction due to the contract-based management. Contract-based traffic management is a service for users who would like to reduce their traveling time. This system controlled dutifully and monitored disruptions, which identifies the transfer of responsibility areas between partners. By applying this system, the transportation management system may produce benefits such as more punctuality at the destination, improved predictability, reduced overall costs, and reduced environmental impact.
ITTMS was mainly used for urban transport management. It is integrated with drones, which plays a vital role in improving urban transport management, alleviating urban environmental impact, and optimizing urban energy management. Such a system would bring benefits for safety and security areas, and also for the local users with optimal route planning, reduced energy consumption, lower carbon dioxide emissions, and decreased environmental impact.
The research and design of an ITTMS are imperative. It is a necessary guarantee for promoting economic and social development and raising the level of urbanization. Through the extensive application of artificial intelligence technology with an optimization algorithm, smart IoT devices can effectively alleviate the current status of urban transport management, which effectively promotes the coordinated development of the various traffic management departments in the city. It is essential to increase the research and development of the system design and use the combination with the Internet to build a more systematic and comprehensive intelligent traffic control/management system. This is the only technique to further ease the pressure of urban transportation, improve the level of ITTM, and realize the strategic requirements for the sustainable development of the ITTMS. For example, judging from the current development situation, the overall operational level of the ITTMS should be improved, and efforts should be made to achieve the coordinated development of related industries.

4.2. Concept Comparative Evaluation

The proposed total transportation management concept is developed for smart cities as a sub-system being integrated into the city operation management.
The evaluation of the transportation system is a rather complex duty, as all stakeholders (policy makers and regulators, vehicle developers, system developers, system operators, users) have their own preferences. Therefore, hundreds of (performance) indicators can be defined [68,69]. For the entire system evaluation, the transportation system must be classified into several comparable groups and overall indexes should be developed and applied. Because this paper deals with the ICT/IoT-based future transportation system, the transportation system classification is studied from the ICT point of view [70,71]. By using this concept, the transportation system can be classified depending on its monitoring and management as
  • first generation—with minimal data from individual vehicles, interactions of infrastructure and vehicles through the traffic rules, control signals, and management based on empirical models
  • second generation—early intelligent transportation system with some vehicles providing data; maintaining a balance between the supply and demand, using dynamic models and management
  • third generation—rich data exchange, mixed human and automated driving, active management
  • fourth generation—application of wireless technology with full monitoring and active communication between the infrastructure, vehicles, operation center, cloud computing, IoT, and pro-active management
More complex investigations lead to the following alternative classification:
  • transportation with serious limitations—existing in old cities or in cities with large historical centers that generate significant limitations on the transportation systems
  • transportation with passive management—using traffic rules and traffic signals, only, including safe bus lanes, lanes for bicycles; this is a traditional transportation system
  • transportation with semi-dynamic management—implementing dynamic management (as control of the traffic signals depending on real traffic, use of green lane concept, mass traffic control depending on the real passenger demand, changing in traffic direction depending on the traffic intensity, providing free routes for emergency transportation) in dedicated regions of the city; such a system uses remote sensing (like video, sensors being integrated into the infrastructure) and real-time data processing
  • transportation with dynamic and/or semi-active management—at least partly is supported by a transportation system operational center using cloud computing; IoT; dynamic or active control of motion of semi-cooperating, connected, and cooperating vehicles (starting from simple smart parking up to active control on lane directions, multimodal transport hubs, district total transportation)
  • transportation with active management (and partly intelligent)—requires harmonization with the city operation center
  • intelligent total transportation management—as described above
These different transportation systems can be compared by evaluating their performance and/or using indicators or transportation index(es). Based on the general KPIs of innovative transportation systems and the core indicators defined in transportation-related strategic documents/white papers, these indexes could cover the following major areas: (i) vehicle, infrastructure, and transport system performance; (ii) amount and nature of supporting systems; (iii) legal control; (iv) economy; (v) society; (vi) environment; (vii) cultural aspects; and (viii) future generation (future society needs).
Table 1 shows a very simple quantitative comparative analysis of the chosen traditional (passively managed) transport, actively managed transport, and the proposed intelligent total transport management. All these areas are well investigated. For example, society’s needs, demand, and acceptations are studied by numerous references. The general assessments can be studied with an overall sustainable transportation index, which might be defined as total life cycle cost related to the unit of usage, like unit of time. In such an index, all the cost means direct, indirect external cost, and penalties taking into account the interest of the future generation must be evaluated.
The table above gives preliminary expert projections and requires further investigations. For example, the possible evaluation of society needs or expectations: during the last 40–60 years, society’s demand changed considerably. About 50 years ago, society’s needs were mostly focused on safety, while presently with the more complex transportation systems it is extended with, e.g., security, cost-efficiency, sustainability, and on-demand operations with higher door-to-door times.

4.3. Action Made in Concept Implementation

Generally, this paper introduced a new concept related to intelligent total transportation management that needs several studies and developments to improve its effectiveness. The authors of this paper worked in this field and published several scientific reports. Three contributions regarding this study are presented as follows.
A total transport management system in smart cities was proposed [18].
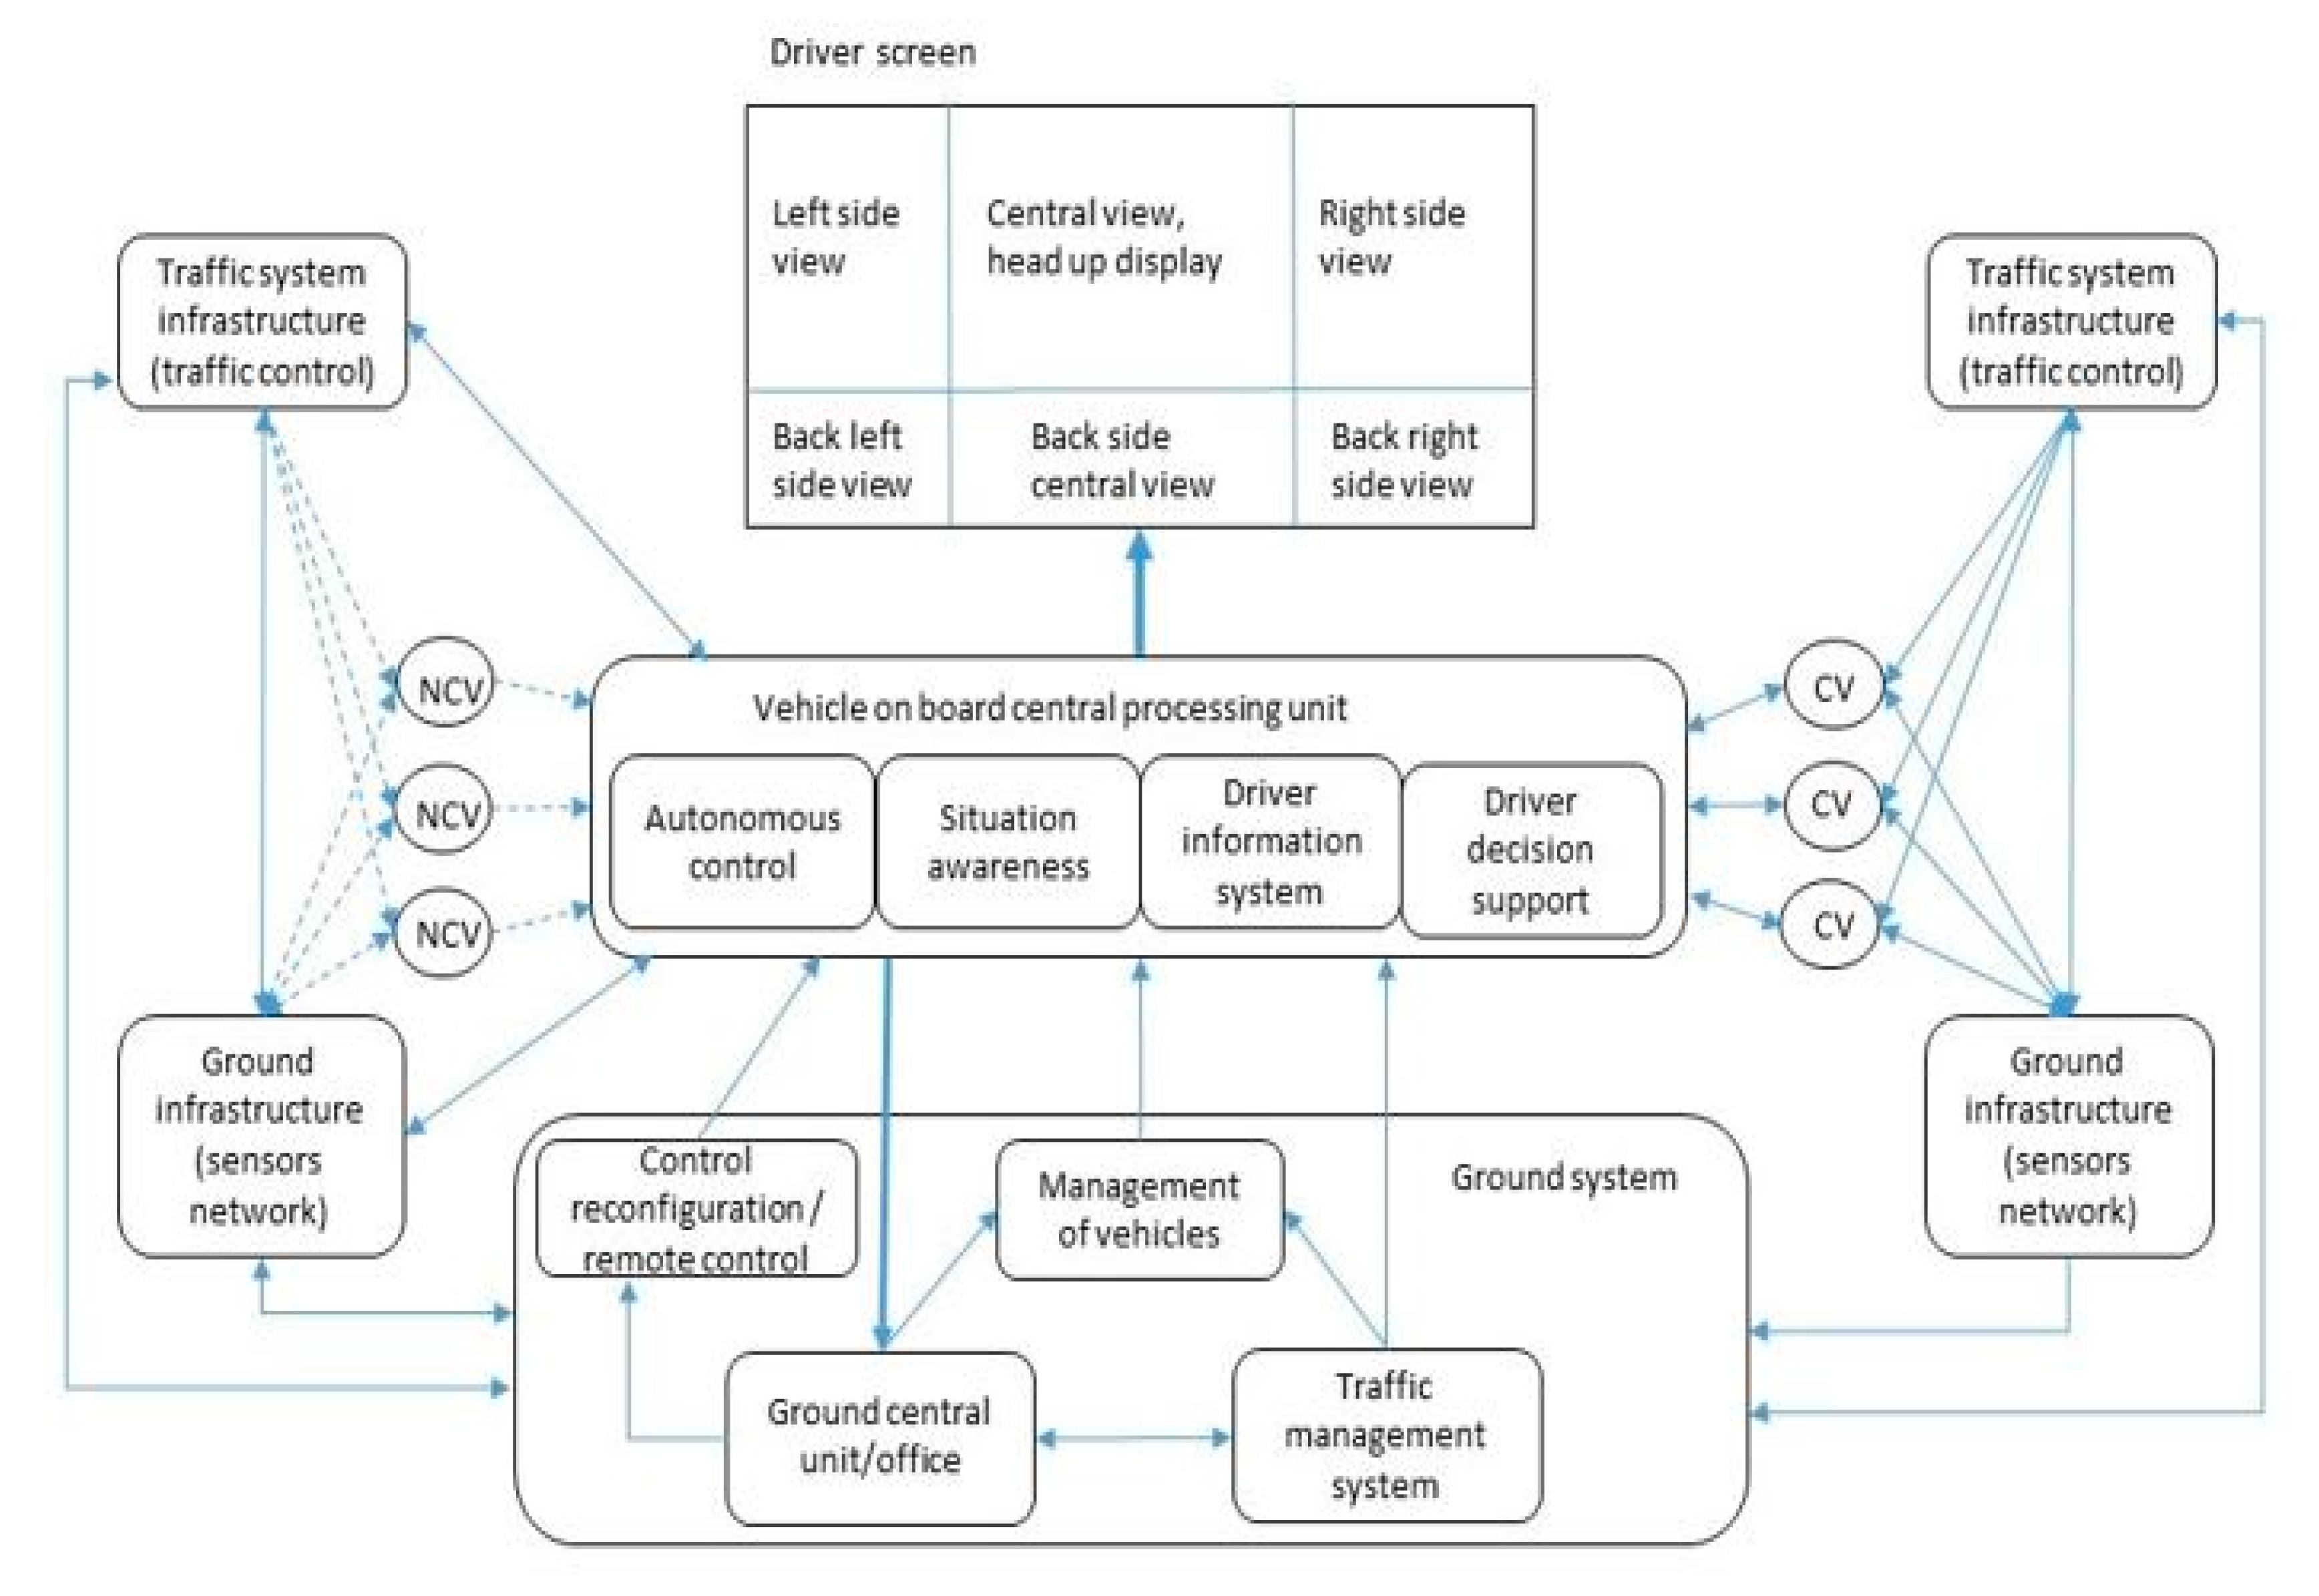
  • The proposed system uses the vast distributed network of sensors for surveillance and recognition of the non-cooperating, cooperating, contract-based, and priority transport vehicles, including three layers: physical, info-communication, and control generation.
  • The ICT concept was analyzed and developed based on the wireless network as distributed sensors and actuators and the Internet as IoT, which integrated into vehicles, infrastructure, individual vehicles, and a conventional single control system.
  • The control layer was a hierarchically organized software set, which was used to recognize and classify vehicles, traffic situation awareness, conflict detection, and resolution, including the sense and avoidance of obstacles, other vehicles, and people.
  • The proposed system allowed us to optimize the total traffic depending on various objectives ranging from effective energy use to environmental impact minimization.
Drone-following models for managing drones in smart city air traffic flow were developed and evaluated [66,67].
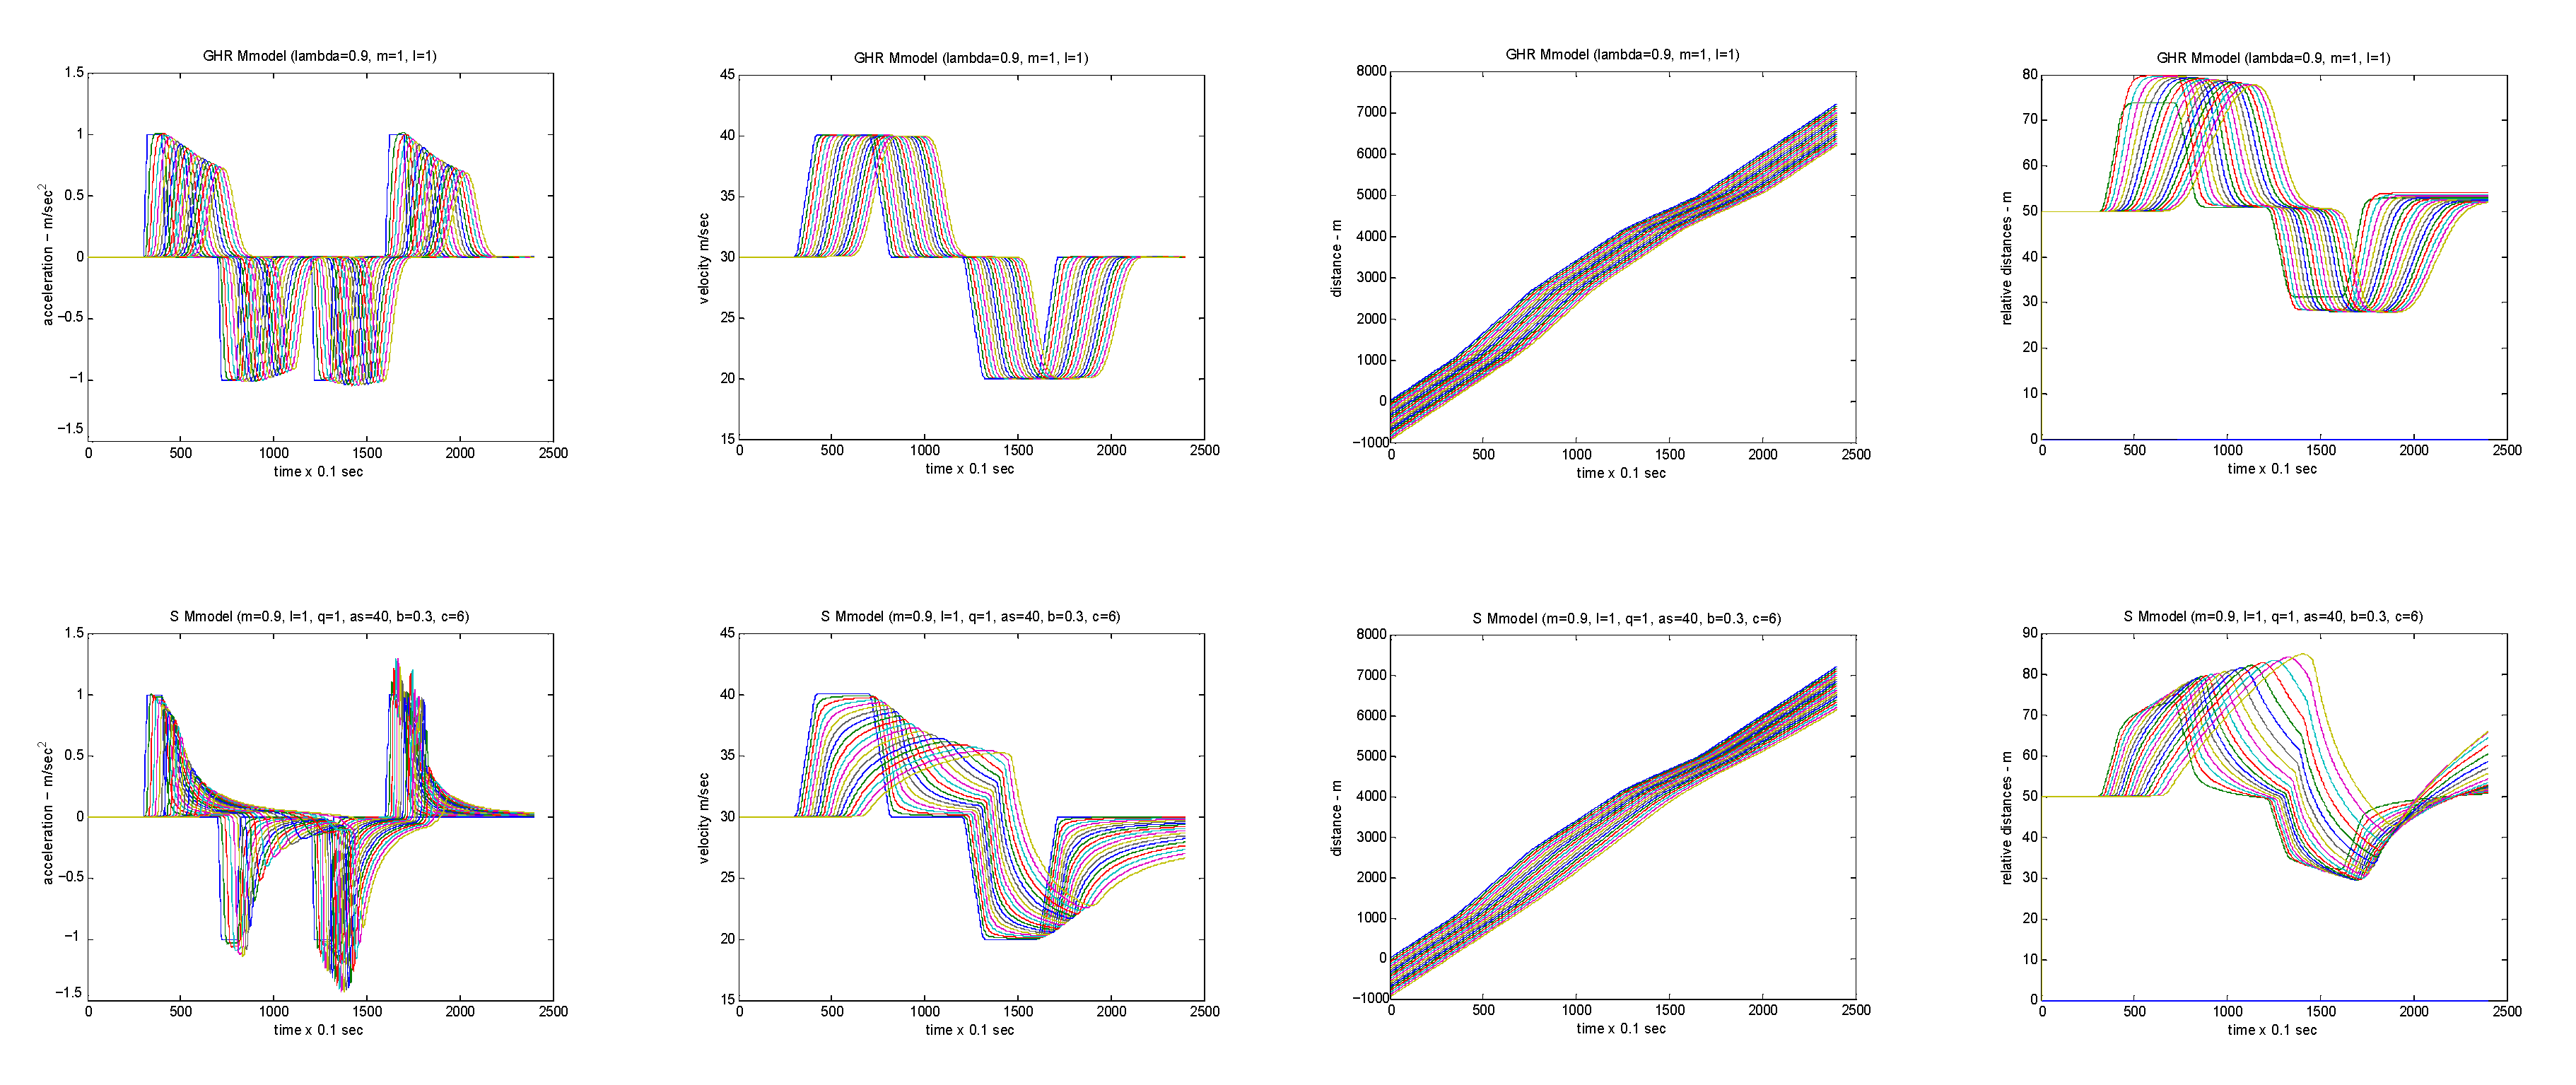
  • The drone-following models are based on the principle that they keep a safe distance based on relative velocity.
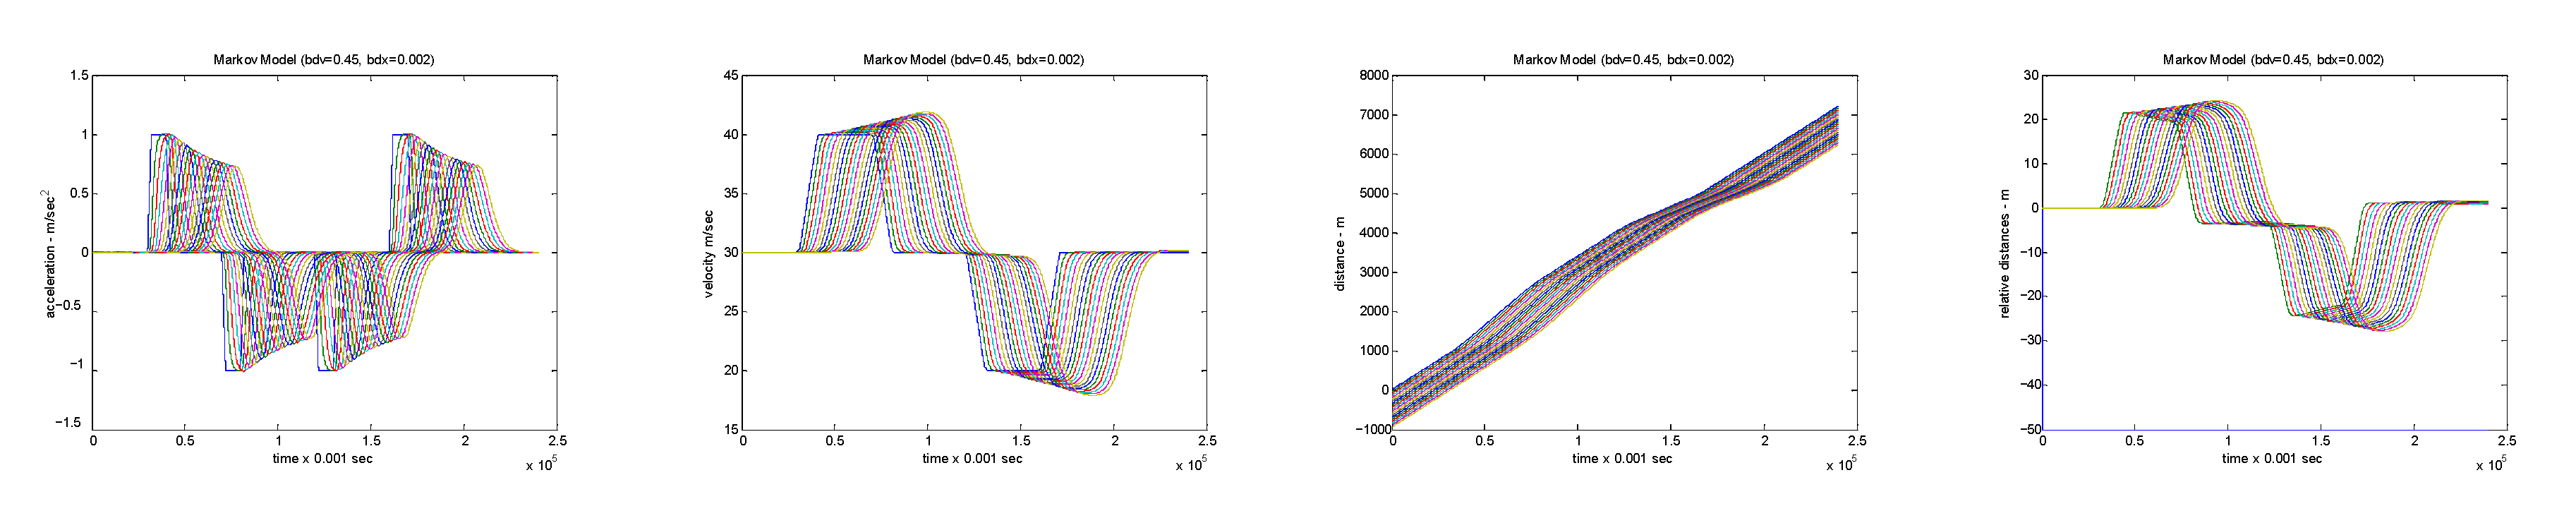
  • Another developed model, called the Markov drone-following model, is based on the approximation with the stochastic diffusion process of speed decision.
  • The numerical simulation results demonstrated that the safe distance between drones is maintained; there was no accident in the traffic flow.
  • This approach can be applied to dense traffic flow. Additionally, the first model can be useful for studies of local stability.
A smart, intelligent total transportation management system coupled with drones was introduced and investigated [72,73].
  • Urban transportation was classified depending on the transportation means and management techniques being applied. Such a system includes users, operators, service providers, transportation management, infrastructure, nature/built environment, regulations, competence and knowledge centers, supporting sub-systems, and passive and active interactions with other essential systems.
  • Obstacles were modeled as cylinders used in the collision avoidance process in the path planning of drone formation operating in smart cities.
  • A methodology to determine and calculate UAVs’ (unmanned aerial vehicles) landing stages was developed and investigated.
  • A cube of a transportation system was introduced and used to identify the urban total transportation system’s classification.
  • A method to optimize the total transportation impact was developed, which can be applied to optimize the energy used by the vehicles over their routes.
With the above comprehensive discussion and experimental results, we could conclude that the proposed system introduced in this paper has numerous advantages compared to the present concepts:
  • it deals with transportation as a single and total system (including the legacy control, vehicles, infrastructure, connecting supply chains),
  • it is multi-layered (dealing separately with the cooperative, prioritized vehicles), and
  • it introduces new solutions (on the system level as active/proactive control and the sub-system levels like smart parking, harmonization of the transportation means on the use of short-term prediction based on transportation monitoring).

5. Conclusions

This study presents an intelligent total transportation management system for future smart cities. Such a system uses the IoT to integrate vehicles with infrastructure, to apply big data survey of demands, to apply required sub-model developments for safe and optimized transport management, and to implement highly automated total management. The urban total transportation system may include very different transportation vehicles and solutions, such as users, service providers, transport managing, infrastructure, nature/built environments, regulations, competence and knowledge centers, supporting sub-systems and passive and active interactions with other essential systems. By introducing the autonomous vehicles in the everyday operations and reaching a highly automated traffic management system, the operator roles will be shifted from active control to passive observation and, thus, only make active control in case of exceptional or emergency cases.
This study presented the classification of the transportation segments which partly used a hierarchical concept, including passive or non-cooperating vehicles, semi-active or simple cooperating, active or cooperating, connecting vehicles, contract-based vehicles, priority transport, and supporting partners. A developed optimization method to solve the traffic optimization problem was also presented in this study. This approach can be applied to optimize the energy used by the vehicles during their operation from the departure till the arrival point.
This research summarizes three essential sub-model developments, including (i) a new car-following model for traffic safety investigation, (ii) a drone formation to avoid obstacles in smart cities, and (iii) a total transportation managing system in smart cities. These sub-models can be applied as solutions for the intelligent total transportation management system operated as a single system.
Although this study presented the intelligent total transportation management system for future smart cities, the development of the concept, the methodology, and the required sub-model, more details and justifications must be provided, especially on the limitations holding back the rapid utilization of this methodology. Seeing this, four classes of limitations could be defined:
  • constraints supporting the solving of the optimization problem (1) even in the case of using a simple and understandable constraint such as a door-door speed for moderate traveling distance, the constraint depends, e.g., on the size of the city, social habits, economic developments. Thus, the constraints must be adapted to the given system
  • system composition—the ratio of non-cooperative vehicles, a lack of sensing sub-system, and insufficiency in supporting systems like energy support or the information on parking vehicles
  • acceptance by the stakeholders—legal control, acceptance of high-level automation, acceptance of control and commands from the operational centers, and acceptance of operating conditions like the delivery of product to shops at night time
  • requirements in further developments—as possible dynamic optimization depending on the real transportation, size, intensity, and disasters or developing a special artificial intelligent classification of the non-cooperative vehicles
The solution to these problems caused by the limitations might generalize the proposed intelligent total transportation management.
The intelligent total transportation management introduced in this paper can be implemented in the described form, while it needs further studies and developments to increase its effectiveness. The authors of this paper continue to work in this field, and besides the papers published and cited by this paper, they are going to publish a special review on the positioning and sense of vehicle motion, the development of supporting systems, the development of demand modeling, the introduction and description of total impact evaluation, the optimization of the sustainable transportation system, and the management of transportation systems in emergency and disaster events.
In addition, future works could be focused on the development of sensing non-cooperating transportation vehicles, the short-term prediction of the future size and intensity of the transportation system (especially including the non-cooperative transportation), and the development of dynamic and adaptive control/management for total transportation. Particular attention should be paid to the infrastructure; supporting sub-systems such as parking, energy supply, and harmonization of connection of different transportation means at multi-modal centers; and the development of operation centers.

Author Contributions

Conceptualization, J.R., D.R., and A.B.; methodology, J.R. and D.R.; formal analysis, J.R. and D.D.N.; investigation, D.R. and D.D.N.; resources, D.R., D.D.N., and A.B.; writing—original draft preparation, J.R. and D.D.N.; writing—review and editing, J.R., D.R., and A.B.; supervision, J.R., D.R., and A.B. All authors have read and agreed to the published version of the manuscript.

Funding

This work was supported by the Hungarian national EFOP-3.6.1-16-2016-00014 project titled by “Investigation and development of the disruptive technologies for e-mobility and their integration into the engineering education”.

Conflicts of Interest

The authors declare no conflict of interest.

References

  1. Nayfeh, M.H. Fundamentals and Applications of Nano Silicon in Plasmonics and Fullerines, Current and Future Trends; Micro and Nano Technologies Series; Elsevier: Amsterdam, The Netherlands, 2018; p. 586. ISBN 978-0-323-48057-4. [Google Scholar]
  2. Daniel, K. Personal Computer History: 1975–1984, at Welcoome to Low End Mac. Available online: https://lowendmac.com/2014/personal-computer-history-the-first-25-years/#:~:text=Personal%20computer%20history%20doesn’t,IMSAI%208080%2C%20an%20Altair%20clone.&text=Both%20used%20the%20Intel%208080%20CPU (accessed on 22 May 2020).
  3. Szondy, D. Apollo’s Brain: The Computer that Guided Man to the Moon, New Atlas. Available online: https://newatlas.com/apollo-11-guidance-computer/59766/ (accessed on 22 May 2020).
  4. Wikipedia: History of Internet. Available online: https://en.wikipedia.org/wiki/History_of_the_Internet (accessed on 22 May 2020).
  5. Mukhopadhyay, S.C.; Suryadevara, N.K. Internet of Things: Challenges and Opportunities. In Internet of Things: Challenges and Opportunities; Springer, series: Smart Sensors, Measurement and Instrumentation 9; Mukhopadhyay, S.C., Ed.; Springer: Berlin/Heidelberg, Germany, 2014; pp. 1–18. ISBN 978-3-319-04222-0. [Google Scholar] [CrossRef]
  6. Li, S.; Xu, L.D.; Zhao, S. The Internet of Things: A Survey, Information Systems Frontiers; Springer: Berlin, Germany, 2015; Volume 17, pp. 243–259. [Google Scholar] [CrossRef]
  7. Aлымов, B.T.; Tарасова, H.П. Tехногенный Риск. Aнализ и Оценка, Mockba, ИКЦ “Aкадемкнига”, 2006-118 с. Available online: https://www.elibrary.ru/item.asp?id=29878837 (accessed on 14 December 2020).
  8. Kinzhikeyev, S. Modeling and Management for Supporting the Recovery of Railway Systems after Earthquakes. Ph.D. Thesis, Budapest University of Technology and Economics, Budapest, Hungary, 2020. [Google Scholar]
  9. Колотвин, A.B.; Зинюхин, Г.Б. Модель городских экосистем. Bестник Оренбургского Государственного Университета 2003, 7, 164–167. [Google Scholar]
  10. Anthopoulos, L.G. Understanding Smart Cities: A Tool for Smart Government or an Industrial Trick? Springer International Publishing: Cham, Switzerland, 2017; Volume 22. [Google Scholar]
  11. Lefèvre, B.; Mainguy, G. Urban Transport Energy Consumption: Determinants and Strategies for its Reduction. In An analysis of the literature. Surveys and Perspectives Integrating Environment and Society (SAPIENS); OpenEdition: Vilnius, Lithuania, 2009; Volume 2, p. 3. [Google Scholar]
  12. Eremia, M.; Toma, L.; Sanduleac, M. The smart city concept in the 21st century, 10th International conference Interdisciplinary engineering, INTER-RNG 2016. Procedia Eng. 2017, 181, 12–19. [Google Scholar] [CrossRef]
  13. Albino, V.; Berardi, U.; Dangelico, R.M. Smart cities: Definitions, dimensions, performance, and initiatives. J. Urban Technol. 2015, 22, 3–21. [Google Scholar] [CrossRef]
  14. Christine, W. Energy, Transport and Environment Statistics, 2019 Edition; Statistical Book; Publications Office of the European Union: Eurostat, Luxembourg, 2019; p. 24. [Google Scholar]
  15. Nikitas, A.; Kougias, I.; Alyavina, E.; Njoya Tchouamou, E. How can autonomous and connected vehicles, electromobility, BRT, hyperloop, shared use mobility and mobility-as-a-service shape transport futures for the context of smart cities? Urban Sci. 2017, 1, 36. [Google Scholar] [CrossRef] [Green Version]
  16. Nikitas, A.; Michalakopoulou, K.; Njoya, E.T.; Karampatzakis, D. Artificial intelligence, transport and the smart city: Definitions and dimensions of a new mobility era. Sustainability 2020, 12, 2789. [Google Scholar] [CrossRef] [Green Version]
  17. European Commission. IDEA-E-Investigation and development of the disruptive technologies for e-mobility and their integration into the engineering education, Hungarian national project supported by the Human Resource Development Operative Programme (EFOP), Contract number: EFOP-3.6.1-16-2016-00014. In Human Resources Development Operational Programme; European Commission: Budapest, Hungry, 2016. [Google Scholar]
  18. Nguyen, D.D.; Rohacs, J. Smart city total transport-managing system: (a vision including the cooperating, contract-based and priority). In Lecture Notes of the Institute for Computer Sciences, Social-Informatics and Telecommunications Engineering; Springer: Cham, Switzerland, 2019; Volume 257, pp. 74–85. [Google Scholar] [CrossRef]
  19. Nguyen, D.D.; Rohacs, J.; Rohacs, D. Total transport management. In Total transport Management in Smart Cities; Rohacs, J., Kale, U., Eds.; Budapest University of Technology and Economics: Budapest, Hungary, 2020; pp. 37–51. [Google Scholar]
  20. Kurauchi, F.; Schmöcker, J.D. (Eds.) Public Transport Planning with Smart Card Data; CRC Press Taylor and Francis Group: Boka Raton, FL, USA, 2017; p. 281. [Google Scholar]
  21. Zanella, A.; Bui, N.; Castellani, A.; Vangelista, L.; Zorzi, M. Internet of Things for Smart Cities. IEEE Internet Things J. 2014, 1, 22–32. [Google Scholar] [CrossRef]
  22. Cohen, B. (2015) The 3 Generation of Smart Cities, Inside the Development of the Technology Driven City. Available online: http://www.fastcoexist.com/3047795/the-3-generations-of-smart-cities (accessed on 5 March 2020).
  23. Smart Santander, EU Supported FP7-ICT Project, 2010–2013. Available online: https://cordis.europa.eu/project/id/257992/results (accessed on 20 May 2020).
  24. Hernández-Muñoz, J.M.; Muñoz, L. The SmartSantander Project. In The Future Internet Assembly. FIA 2013. Lecture Notes in Computer Science; Galis, A., Gavras, A., Eds.; Springer: Berlin/Heidelberg, Germany, 2013. [Google Scholar] [CrossRef] [Green Version]
  25. Gutiérrez, V.; Jose, A.G.; Luis, S.; Luis, M.; Jose, M.; Joao, F.; Mirko, P. SmartSantander: Internet of Things Research and Innovation through Citizen Participation. In The Future Internet assembly. FIA 2013. Lecture Notes in Computer Science; Galis, A., Gavras, A., Eds.; Springer: Berlin/Heidelberg, Germany, 2013; Volume 7858, pp. 173–186. [Google Scholar] [CrossRef] [Green Version]
  26. Park, E.; Del Pobil, A.P.; Kwon, S.J. The Role of Internet of Things (IoT) in Smart Cities: Technology Roadmap-oriented Approaches. Sustainability 2018, 10, 1388. [Google Scholar] [CrossRef] [Green Version]
  27. Rob, D.; Stephen, W. Smart Cities: How Rapid Advances in Technology are Reshaping Our Economy and Society, Deloitte The Netherlands. 2015, p. 86. Available online: https://www2.deloitte.com/content/dam/Deloitte/tr/Documents/public-sector/deloitte-nl-ps-smart-cities-report.pdf (accessed on 20 May 2020).
  28. Sutar, S.H.; Koul, R.; Suryavanshi, R. Integration of Smart Phone and IOT for development of smart public transportation system. In Proceedings of the 2016 International Conference on Internet of Things and Applications (IOTA). IEEE, Pune, India, 22–24 January 2016; pp. 73–78. [Google Scholar] [CrossRef]
  29. Cao, Z.; Jiang, S.; Zhang, J.; Guo, H. A unified framework for vehicle rerouting and traffic light control to reduce traffic congestion. IEEE Trans. Intell. Transp. Syst. 2016, 18, 1958–1973. [Google Scholar] [CrossRef]
  30. Cao, Z.; Guo, H.; Song, W.; Gao, K.; Kang, L.; Zhang, X.; Wu, Q. Improving the Performance of Transportation Networks: A Semi-Centralized Pricing Approach. IEEE Trans. Intell. Transp. Syst. 2020. [Google Scholar] [CrossRef]
  31. Cao, Z.; Guo, H.; Song, W.; Gao, K.; Chen, Z.; Zhang, L.; Zhang, X. Using Reinforcement Learning to Minimize the Probability of Delay Occurrence in Transportation. IEEE Trans. Veh. Technol. 2020, 69, 2424–2436. [Google Scholar] [CrossRef]
  32. Cao, Z.; Guo, H.; Zhang, J.; Fastenrath, U. Multiagent-based route guidance for increasing the chance of arrival on time. In Proceedings of the Thirtieth AAAI Conference on Artificial Intelligence, Phoenix, AZ, USA, 12–17 February 2016. [Google Scholar]
  33. Toh, C.K.; Sanguesa, J.A.; Cano, J.C.; Martinez, F.J. Advances in smart roads for future smart cities. Proc. Math. Phys. Eng. Sci. 2020, 476, 20190439. [Google Scholar] [CrossRef] [PubMed]
  34. Luque-Vega, L.F.; Michel-Torres, D.A.; Lopez-Neri, E.; Carlos-Mancilla, M.A.; Gonzalez-Jimenez, L.E. IoT Smart Parking System Based on the Visual-Aided Smart Vehicle Presence Sensor: SPIN-V. Sensors 2020, 20, 1467. [Google Scholar] [CrossRef] [PubMed] [Green Version]
  35. Lin, T.; Rivano, H.; Le Mouël, F. A survey of smart parking solutions. IEEE Trans. Intell. Transp. Syst. 2017, 18, 3229–3253. [Google Scholar] [CrossRef] [Green Version]
  36. Xie, K.; Yang, D.; Ozbay, K.; Yang, H. Use of real-world connected vehicle data in identifying high-risk locations based on a new surrogate safety measure. Accid. Anal. Prev. 2019, 125, 311–319. [Google Scholar] [CrossRef]
  37. Sobral, T.; Galvao, T.; Borges, J. Visualization of Urban Mobility Data from Intelligent Transportation Systems. Sensors 2019, 19, 332. [Google Scholar] [CrossRef] [Green Version]
  38. Ipsen, K.L.; Zimmermann, R.K.; Nielsen, P.S.; Birkved, M. Environmental assessment of Smart City Solutions using a coupled urban metabolism—Life cycle impact assessment approach. Int. J. Life Cycle Assess. 2019, 24, 1239–1253. [Google Scholar] [CrossRef] [Green Version]
  39. Rohacs, J.; Rohacs, D. Total Impact Evaluation of Transportation Systems. Transport 2020, 35, 193–202. [Google Scholar] [CrossRef]
  40. Cao, Z.; Guo, H.; Zhang, J.; Niyato, D.; Fastenrath, U. Finding the shortest path in stochastic vehicle routing: A cardinality minimization approach. IEEE Trans. Intell. Transp. Syst. 2015, 17, 1688–1702. [Google Scholar] [CrossRef]
  41. Cao, Z.; Guo, H.; Zhang, J.; Niyato, D.; Fastenrath, U. Improving the efficiency of stochastic vehicle routing: A partial lagrange multiplier method. IEEE Trans. Veh. Technol. 2015, 65, 3993–4005. [Google Scholar] [CrossRef]
  42. Muñoz-Villamizar, A.; Montoya-Torres, J.R.; Faulin, J. Impact of the use of electric vehicles in collaborative urban transport networks: A case study. Transp. Res. Part D Transp. Environ. 2017, 50, 40–54. [Google Scholar] [CrossRef]
  43. Batty, M.; Axhausen, K.; Fosca, G.; Pozdnoukhov, A.; Bazzani, A.; Wachowicz, M.; Ouzounis, G.; Portugali, Y. Smart city of the future. Eur. Phys. J. Spec. Top. 2012, 214, 481–518. [Google Scholar] [CrossRef] [Green Version]
  44. US DoD. C4ISR Architecture Working Group (AWG). C4ISR Architecture Framework; Wiley Online Library: Washington, DC, USA, 1997. [Google Scholar]
  45. Schreiner, C. International Case Studies of Smart Cities: Rio de Janeiro, Brazil; Inter-American Development Bank: Washington, DC, USA, 2016. [Google Scholar]
  46. Chester, M.V.; Horvath, A. Environmental assessment of passenger transportation should include infrastructure and supply chains. Environ. Res. Lett. 2009, 4, 024008. [Google Scholar] [CrossRef]
  47. Wangai, A.; Kale, U.; Kinzhikeyev, S. An application of impact calculation method in transportation. Transport 2020, 35, 435–446. [Google Scholar] [CrossRef]
  48. Georgiu, L.; Harper, C.J.; Keenan, M.; Miles, I.; Popper, R. The Handbook of Technology Foresight: Concept and Practice; Edward Elgar Publishing Ltd.: Northampton, MA, USA, 2008. [Google Scholar]
  49. Ajdys, J.; Nazarko, J.; Nazarko, L.; Halicka, K. Foresight application for transport sector chapter No. 17. In Clean Mobility and Intelligent Transport Systems, October 2015; Fiorini, M., Lin, J.-C., Eds.; IET: London, UK, 2015; pp. 374–400. ISBN 978-1-84919-895-0. [Google Scholar]
  50. Baig, Z.A.; Szewczyk, P.; Valli, C.; Rabadia, P.; Hannay, P.; Chernyshev, M.; Johnstone, M.; Kerai, P.; Ibrahim, A.; Sansurooah, K.; et al. Future challenges for smart cities: Cyber-security and digital forensics. Digit. Investig. 2017, 22, 3–13. [Google Scholar] [CrossRef]
  51. Sumalee, A.; Ho, H.W. Smarter and more connected: Future intelligent transportation system, International Association of Traffic and Safety Sciences. IATSS Res. Elsevier 2018, 42, 67–71. [Google Scholar] [CrossRef]
  52. Fraden, J. Handbook of Modern Sensors Physics, Designs, and Applications; Springer: Berlin, Germany, 2016; p. 758. [Google Scholar] [CrossRef]
  53. Estrela, P.; Bhalla, N.; Jolly, P.; Formisano, N.; Estrela, P. Introduction to biosensors. Essays Biochem. 2016, 60, 1–8. [Google Scholar] [CrossRef] [Green Version]
  54. Bansal, S.; Kumar, D. IoT Ecosystem: A Survey on Devices, Gateways, Operating Systems, Middleware and Communication. Int. J. Wirel. Inf. Netw. 2020, 27, 340–364. [Google Scholar] [CrossRef]
  55. Khayyam, H.; Javadi, B.; Jalili, M.; Jazar, R.N. Artificial Intelligence and Internet of Things for Autonomous Vehicles. In Nonlinear Approaches in Engineering Applications; Springer: Cham, Switzerland, 2020; pp. 39–68. [Google Scholar] [CrossRef]
  56. Zhu, M.; Wang, X.; Tarko, A. Modeling car-following behavior on urban expressways in Shanghai: A naturalistic driving study. Transp. Res. Part C Emerg. Technol. 2018, 93, 425–445. [Google Scholar] [CrossRef] [Green Version]
  57. Bécsi, T.; Aradi, S.; Fehér, Á.; Szalay, J.; Gáspár, P. Highway Environment Model for Reinforcement Learning. IFAC-PapersOnLine 2018, 51, 429–434. [Google Scholar] [CrossRef]
  58. Bieker-Waltz, L.; Behrisch, M.; Junghaus, M.; Gimm, K. Evaluation of car-following-models at controlled intersections. Eur. Simul. Model. Conf. 2017, 31, 247–251. [Google Scholar]
  59. Reuschel, A. Vehicle Movements in a Platoon with Uniform Acceleration or Deceleration of the Lead Vehicle. Z. Des Oesterreichischen Ing.-und Archit. Ver. 1950, 95, 50–62. [Google Scholar]
  60. Pipes, L.A. An Operational Analysis of Traffic Dynamics. J. Appl. Phys. 1953, 24, 274–287. [Google Scholar] [CrossRef]
  61. Chandler, R.E.; Herman, R.; Montroll, E.W. Traffic Dynamics: Studies in Car Following. Oper. Res. 1958, 6, 165–184. [Google Scholar] [CrossRef]
  62. Ranjitkar, P.; Nakatsuji, T.; Kawamua, A. Car-Following Models: An Experiment based Benchmarking. J. East. Asia Soc. Transp. Stud. 2005, 6, 1582–1596. [Google Scholar]
  63. Rohacs, J. A new car-following model for highway traffic safety investigation. In Proceedings of the Chaos 2009, The 2nd Chaotic Modelling and Simulation International Conference, Chania, Greece, 1–5 June 2009; p. 8. [Google Scholar]
  64. Markou, I.; Papathanasopoulou, V.; Antoniou, C. Dynamic Car–Following Model Calibration Using SPSA and ISRES Algorithms. Period. Polytech. Transp. Eng. 2019, 47, 146–156. [Google Scholar] [CrossRef] [Green Version]
  65. Gazis, D.C.; Herman, R.; Rothery, R.W. Nonlinear follow-the-leader models of traffic flow. Oper. Res. 1961, 9, 545–567. [Google Scholar] [CrossRef]
  66. Dung, N.D.; Rohacs, J. The drone-following models in smart cities. In Proceedings of the 2018 IEEE 59th International Scientific Conference on Power and Electrical Engineering of Riga Technical University (RTUCON), Riga, Latvia, 12–13 November 2018; pp. 1–6. [Google Scholar]
  67. Dung, N.D. Developing Models for Managing Drones in the Transportation System in Smart Cities. Electrical. Control Commun. Eng. 2019, 15, 71–78. [Google Scholar] [CrossRef] [Green Version]
  68. Buzási, A.; Csete, M. Sustainability Indicators in Assessing Urban Transport Systems. Period. Polytech. Transp. Eng. 2015, 43, 138–145. [Google Scholar] [CrossRef] [Green Version]
  69. Litman, T. Well Measured Developing Indicators for Sustainable and Livable Transport Planning, Viktoria Transport Policy Institute. 2016, p. 107. Available online: http://www.vtpi.org/wellmeas.pdf (accessed on 26 May 2017).
  70. Ran, B.; Jin, P.J.; Boyce, D.; Qiu, T.Z.; Cheng, Y. Perspectives on Future Transportation Research: Impact of Intelligent Transportation System Technologies on Next-Generation Transportation Modeling. J. Intell. Transp. Syst. Technol. Plan. Oper. 2012, 16, 226–242. [Google Scholar] [CrossRef]
  71. Mokkadem, Y.E.; Jawab, F. Researches and Applications of Intelligent Transportations Systems in Urban Area: Systematic Literature Review. ARPN J. Eng. Appl. Sci. 2019, 14, 639–652. [Google Scholar]
  72. Dung, N.D. A developed particle swarm optimization algorithm for managing drones in smart cities. In Proceedings of the International Symposium on Sustainable Aviation (ISSA), Budapest, Hungary, 26–29 May 2019; pp. 81–84. [Google Scholar]
  73. Dung, N.D.; Rohacs, J. Robust planning the landing process of unmanned aerial vehicles. Int. J. Sustain. Aviat. 2019, 5, 1–18. [Google Scholar] [CrossRef]
Figure 1. Urban total transportation system: I—industrial area (factories), II—forest area, III—urban area, IV—airport area, 1—underground, 2—road, 3—upper ground, 4—path, 5—railway, 6—highway, 7—freight transport, 8—urban air transport, 9—water transport.
Applsci 10 08933 g001
Figure 2. Hierarchical classification of the vehicles and primary information transmissions (a) cube of hierarchical structure, (b) system interconnections. IoT—Internet of Things.
Applsci 10 08933 g002
Figure 3. Graph model of a road system fragment.
Applsci 10 08933 g003
Figure 4. Representation of management with smart city total transportation system.
Applsci 10 08933 g004
Figure 5. Simulation results obtained with the Gazis–Herman–Rothery (GHR), S-curve, and Markov car-following models (the horizontal axis is time; the vertical axis is value).
Applsci 10 08933 g005aApplsci 10 08933 g005b
Figure 6. Effects of changes in model parameters on the results (the horizontal axis is time; the vertical axis is value). (a) GHR model with changed m (m = 1.1); (b) GHR model with changed m (m = 0.9); (c) GHR model m = 0.9 and v8 = 25 m/s at the t = 0; (d) Markov model—bdc increased 10 times; (e) Markov model—bdx increased 10 times; (f) Markov Model—bdx = 0; (g) Markov model—bdv = 0; (h) Markov model—random control, bdv = 0.7, bdx = 0.02; (i) Markov model—v8 = 25 m/s at t = 0.
Applsci 10 08933 g006
Figure 7. Obstacle representation and safe distance calculation.
Applsci 10 08933 g007
Figure 8. Centralized control strategy for large-scale systems: (a) pure centralized structure and (b) hierarchical centralized structure.
Applsci 10 08933 g008
Figure 9. Decentralized and distributed control strategies (S-system and C-controller): (a) decentralized control strategy and (b) distributed control strategy.
Applsci 10 08933 g009
Figure 10. The traffic management system architecture (NCV—non-cooperating vehicle, CV—cooperating vehicle).
Applsci 10 08933 g010
Table 1. Simplified comparative analysis of different transportation systems.
Areas and IndicatorsPassiveActiveIntelligent
vehicle, infrastructure, and transportation performance (compared to the traditional transportation)
(e.g., vehicle speed, fuel consumption, operational cost)
100%110%–120%115%–130%
supporting systems (% of vehicles, drivers supported by service providers)
(e.g., mass transport, service provided, energy support system, parking availability, accessibility, multimodal transport hubs, emergency, accident handling)
5%–10%15%–30%95%
legal control (% of regulation the problems, aspects)
(e.g., traffic rules, requirements for infrastructure, legal control of autonomous transport)
35%–50%50%–80%75%–95%
economy (compared to the intelligent system = 100%)
(e.g., supply chain support, just in time arrives, delays)
40%–80%75%–90%100%
society (% of society needs being considered/covered)
(e.g., demand, affordability, door-to-door speed, acceptance, safety, security)
40%–70%60%–90%85%–96%
environment (change in the environmental impact using the recently available vehicles and infrastructures, compared to the traditional transportation solution)
(e.g., emissions, noise, greenhouse impact, energy sources, energy mix in sources)
100%80%–95%70%–85%
cultural aspects (% of service provided for non-business travels)
(e.g., recreation, health, sport, transport)
20%–40%35%–65%60%–80%
future generation (ratio of common solution compared to the solution optimized as a sustainable transport)
(e.g., used materials, used energy)
50%–75%70%–90%85%–95%
Publisher’s Note: MDPI stays neutral with regard to jurisdictional claims in published maps and institutional affiliations.

