Abstract
This study aims to establish a test method to obtain the dynamic characteristics of hydraulic-pneumatic semi-active suspensions used in tractor cabins. Because dynamic characteristics are utilized in simulation models for developing suspension control logic and must be secured to improve control performance, an accurate test method must be established. The dynamic characteristics of the suspension, i.e., the spring constant and damping coefficient, were obtained by changing the current and velocity conditions. An exciter was used as a test device to control the displacement and velocity of the hydraulic cylinder. In order to derive the spring constant of the suspension, a low-speed reciprocating motion test was performed to obtain the force-displacement diagram and to derive the damping coefficient; 48 tests were performed under 6 velocity conditions and 8 current conditions to obtain a force-velocity diagram for each result. The spring constant of the suspension was confirmed using the slope of the trend line in the force-displacement diagram obtained through the low-speed reciprocating motion test of the suspension. In addition, the damping coefficient was calculated using the force-velocity diagram obtained through the reciprocating motion test of the suspension under various current and velocity conditions.
1. Introduction
To reduce ride vibration, existing tractors mainly use rubber mounts between the tractor body and the cabin in which the operator is seated. These rubber mounts have a large spring constant and a small damping coefficient, which makes them suitable for supporting weight but unsuitable for absorbing vibration transmitted to the cabin [1]. Recently developed large tractors are increasingly equipped with cabin suspension instead of rubber mounts to reduce cabin vibration. Because the maximum driving speed of a 100 kW-class tractor recently developed in the Republic of Korea can reach 40 km/h, there has been increasing demand for cabin suspension that reduces the impact from the ground during high-speed driving. Studies have shown that vibration is reduced when rubber mounts are replaced with cabin suspension [2]; however, there has been minimal research analyzing the characteristics of cabin suspension and the optimization of design factors.
Cabin suspension is functionally a combination of a spring that supports the weight by also acting as a low pass filter, and a damper that dissipates energy by reducing motion speed. Springs are divided into mechanical, pneumatic, and hydro-pneumatic types according to their operation method. In general, mechanical springs are used in systems with lighter weights, whereas pneumatic and hydro-pneumatic springs are used in systems with heavier weights. The damper reduces the speed by dissipating kinetic energy into heat energy through resistance generated when hydraulic oil passes through a narrow cross section. Dampers can be classified as passive, semi-active, and active depending on the damping force adjustment function and the presence or absence of an external energy source [3]. Tractor cabin suspensions should be capable of level control in inclined operation environments; further, hydraulic springs are suitable for use in rough terrain because of the heavy load [4].
Tractors perform a wide variety of tasks and can drive at a wide range of speeds, and thus experience varying types of vibrations coming from the ground. Therefore, a semi-active damper is considered suitable for adjusting the damping forces depending on the circumstances. Because of the wide variation in tasks and driving speeds, it is thought that adjusting the damping force according to the operation environment is suitable. In this study, a semi-active hydro-pneumatic suspension was selected as the suspension to be used for the tractor cabin, and the characteristics of the suspension were analyzed through a single unit test.
Zehsaz et al. [5] measured acceleration data while driving a tractor with a passive cabin suspension system according to ISO 2631(1985), and developed a finite numerical analysis model based on the test results in order to perform parameter optimization. Sarami [6] developed a system in which semi-active suspensions were mounted on a tractor’s seat, cabin, and axle in order to improve ride comfort. Virtual ground vibration was applied to the developed tractor using a road simulator, and the effectiveness of the suspension system was verified by measuring the rotational acceleration in the roll and pitch directions and the acceleration in the vertical direction. Recently, owing to the installation of proportional control valves in hydro-pneumatic suspensions, research has been conducted to develop optimal damping force control according to operating conditions. Sim [3] modeled a semi-active hydro-pneumatic suspension system with a simulation program and verified the model by comparing it with actual vehicle test results. The ride comfort was analyzed by applying a suspension system and control logic to a tractor simulation model with 14 degrees of freedom. These previous studies on tractor cabin suspensions analyzed how these suspensions could improve ride comfort and reduce ride vibration, but did not analyze the characteristics of the tractor cabin suspension unit. In addition, the characteristics of a hydro-pneumatic suspension change according to current conditions, owing to the nonlinear characteristics of the hydraulic system. Thus, in order to improve the accuracy of the simulation model, it is necessary to accurately analyze the characteristics of the hydro-pneumatic suspension unit and to construct a model based on the characteristics of the suspension.
Various methods have been used to test the characteristics of suspensions. Omar et al. [7] developed a device that can simultaneously test the performance of active and passive suspensions for automobiles. A suspension was installed on a vertically fixed guide, and sprung mass was added to the upper portion and a motor was installed on the lower portion. This test device made it possible to convert the rotational motion of a disk into vertical reciprocating motion. Konieczny et al. [8] constructed a reciprocating test device by fixing one side of a suspension and then connecting the other side to a rotating crank in order to perform characteristic tests on semi-active suspensions in automobiles. However, using a disk and crank in this manner is problematic because even if the input is rotated at a constant frequency, the output appears as a trigonometric function that reflects the mechanical characteristics; thus, the displacement, velocity, and acceleration of the output must be converted. Giliomee and Els [9] developed a test device equipped with a hydraulic cylinder that can control the displacement, velocity, and acceleration of a suspension. In their tests, the upper end of the suspension was fixed, the lower end was connected to the hydraulic cylinder, and the spring stiffness and damping coefficient were obtained by measuring the low-speed reciprocating motion and high-speed reciprocating motion, respectively. The above-mentioned suspension characteristic tests were mainly performed on automobile suspensions, such as those in passenger cars and commercial vehicles. Because agricultural tractors drive at relatively low speeds under completely different road conditions than automobiles, an automotive suspension cannot be used as a tractor cabin suspension. In addition, an automotive suspension is located between the wheels and the vehicle body, whereas the cabin suspension of an agricultural tractor is located between the tractor body and the cabin. Thus, the operating conditions of the suspension are different, and the results of characteristic tests of automotive suspensions cannot be applied to tractor cabin suspensions. Therefore, in this study, a characteristic test of a tractor cabin suspension was performed according to tractor operating conditions. A high-performance exciter equipped with a servo valve was used for testing; this approach simulated load conditions more accurately than the conventional disk and crank method.
To establish an accurate test method for deriving the spring constant and damping coefficient of a suspension, this study performed a characteristic test on a hydro-pneumatic, semi-active tractor cabin suspension under changing velocity and current conditions. The study also generated force-displacement and force-velocity diagrams of the suspension that can be input into a simulation model for control logic development. The test utilized an exciter with a servo valve for controlling the displacement and velocity of the hydraulic cylinder, and employed a method of fixing one side of the suspension and reciprocating the other side without sprung mass. In order to derive the spring constant of the suspension, a low-speed reciprocating motion test was performed to obtain the force-displacement diagram and to derive the damping coefficient; 48 tests were performed under 6 velocity conditions and 8 current conditions to obtain the force-velocity diagram for each result. The spring constant and damping coefficient derived from the characteristic test can be used as the cabin suspension characteristic values of the simulation model for evaluating the ride vibration of the tractor and developing the control logic of the suspension.
2. Materials and Methods
2.1. Hydro-Pneumatic Semi-Active Suspension Used in the Study
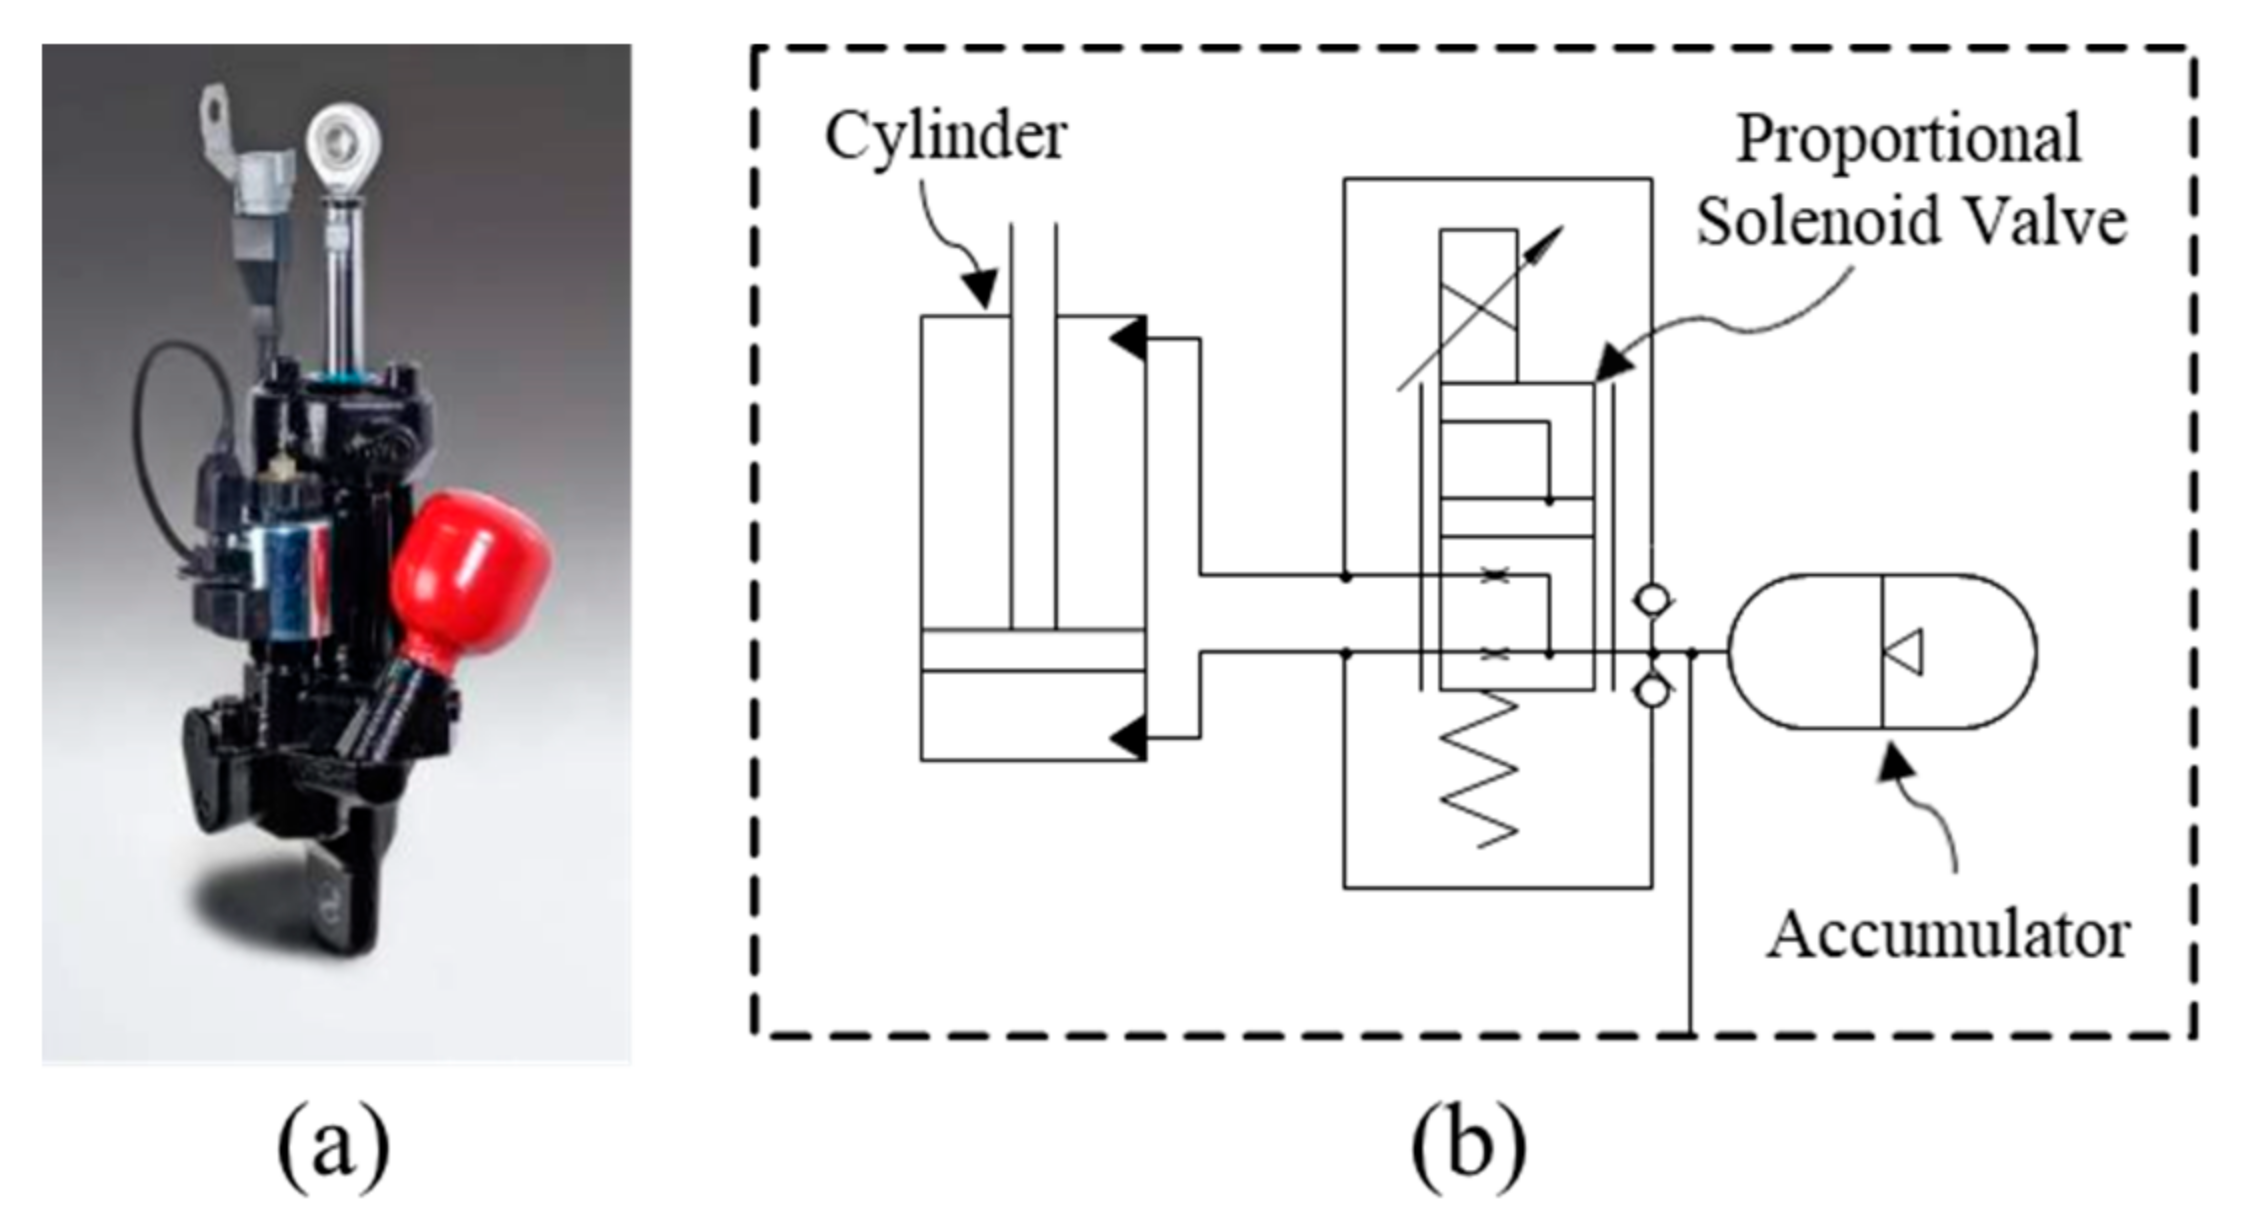
A suspension is composed of a spring that generates a force for displacement, and a damper that generates a damping force for speed. The suspension type can be classified according to the type of spring and the controllability of the damper. The type of suspension used in this study was a semi-active hydro-pneumatic suspension; the product figuration and hydraulic circuit diagram are shown in Figure 1, and the main specifications are listed in Table 1. The main components of the suspension were the cylinder, proportional control valve, and accumulator; the spring constant changed according to the gas charging pressure of the accumulator, and the damping coefficient changed according to the opening of the proportional control valve.
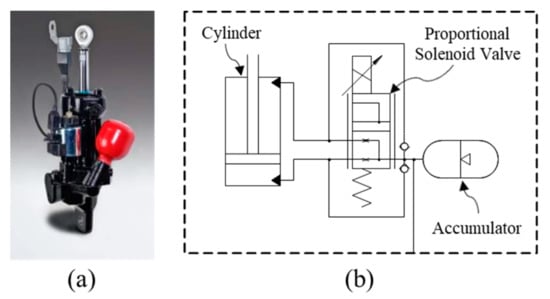
Figure 1.
Hydro-pneumatic semi-active suspension: (a) Figuration and (b) hydraulic circuit diagram.

Table 1.
Specifications of hydro-pneumatic semi-active suspension.
2.2. Theory of Dynamic System
A spring-damper-type suspension expresses its characteristics through the spring constant of the spring and damping coefficient of the damper; the reaction force of the suspension can be expressed as Equation (1). However, because a hydraulic-pneumatic suspension can perform the role of a spring and damper only by combining a cylinder, a proportional control valve, and an accumulator, it is not possible to perform characteristic tests by separating each component in the manner of a spring-damper suspension. Thus, in this study, the test was divided into two conditions to allow the spring constant and damping coefficient to be measured separately in the hydro-pneumatic suspension in which the cylinder, proportional control valve, and accumulator were assembled.
where:
- F: reaction force, ;
- : spring constant, ;
- : damping coefficient, ;
- : displacement, ;
- : velocity, .
2.2.1. Test for Force-Displacement Curve
In order to measure only the spring constant of the suspension, the cylinder piston was moved at a low speed so as not to generate a damping force, and the reaction force in a static state was measured. Assuming that the speed was very low and could be ignored, the suspension reaction force can be expressed as Equation (2).
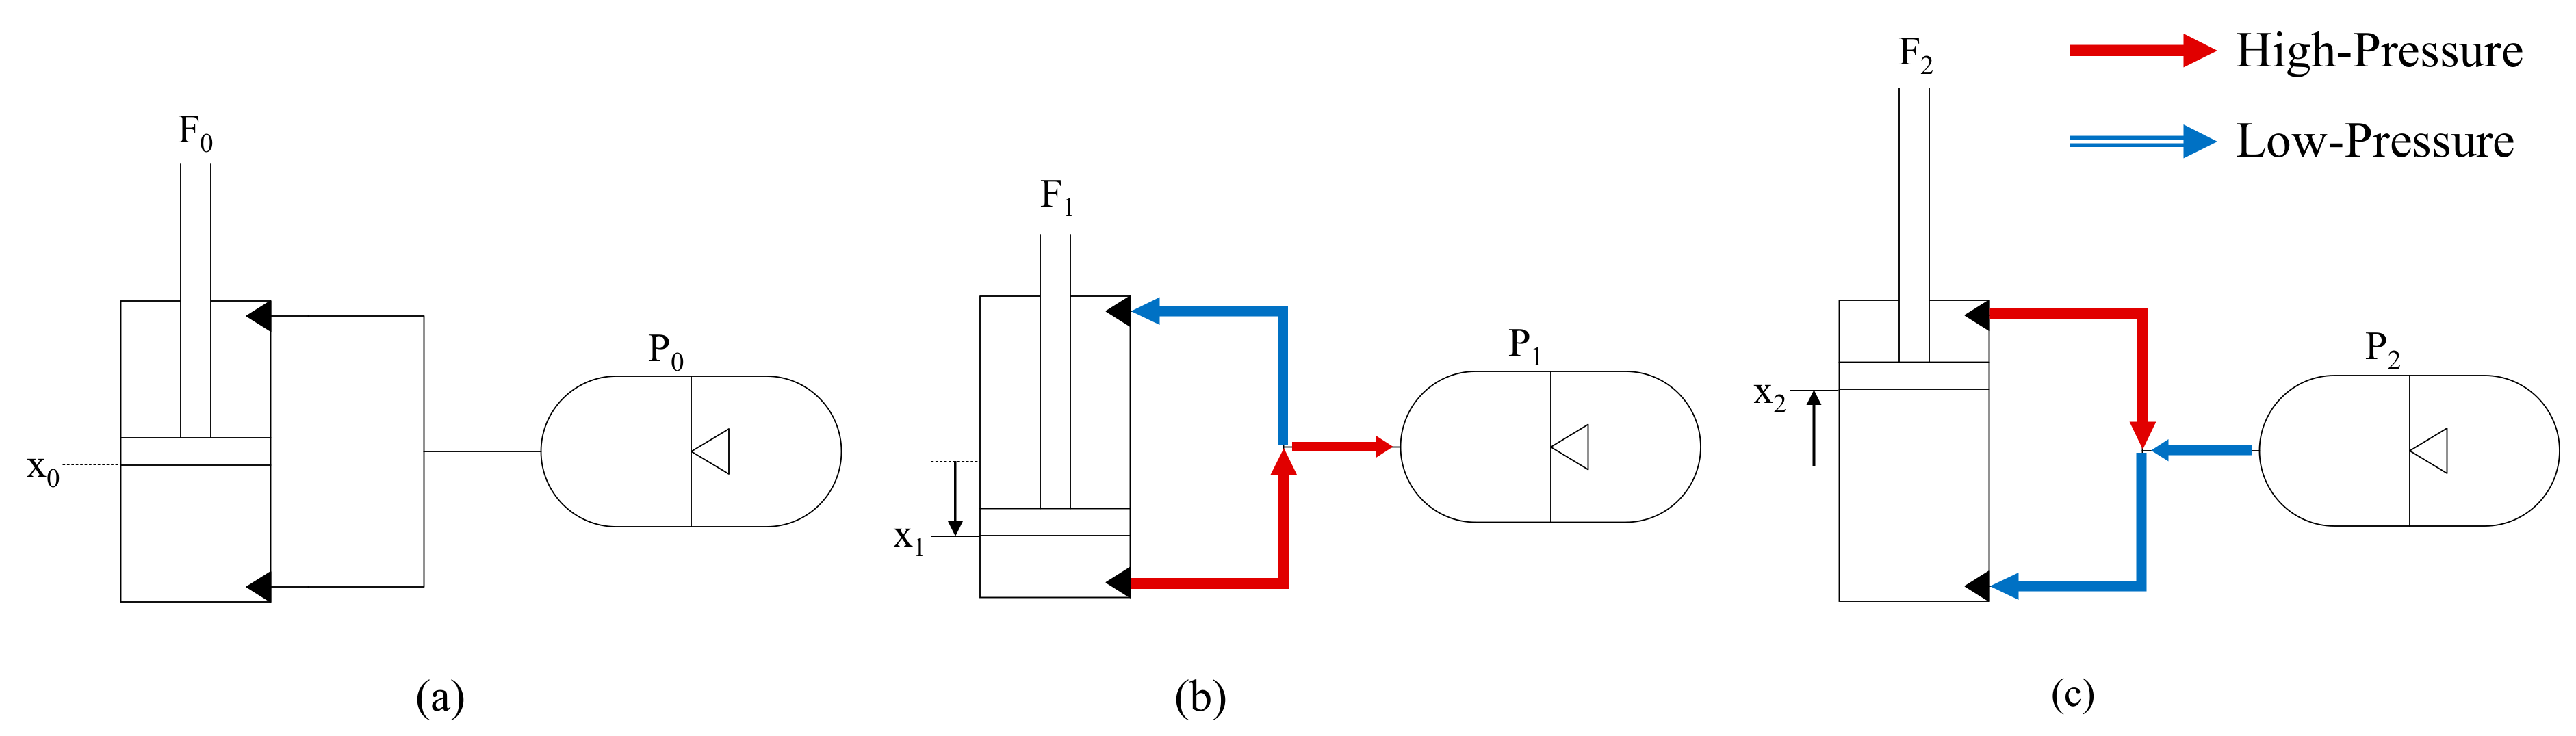
Assuming that there was no damping force () in a hydro-pneumatic suspension, the hydraulic circuit diagram can be expressed as shown in Figure 2a. In a cylinder with a rod connected in one direction, the cross-sectional areas of the head side and rod side was different. When the hydraulic system was in a steady state, the same pressure was formed all over the interior, and the same vertical pressure was applied to all sides by Pascal’s law; thus, the force was generated by the difference in the area of the cylinder. The area of the cylinder is expressed as Equation (3). If the pressure in the hydraulic system was when the initial compression force was and the cylinder was at the initial position , the relationship expressed in Equation (4) could be established.
where:
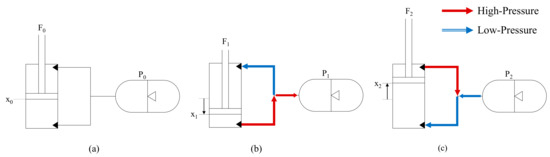
Figure 2.
Conceptual diagram of hydraulic oil movement according to cylinder movement direction: (a) neutral (b) compression and (c) extension.
- : area difference between cylinder head side and rod side, ;
- : area of cylinder head side, ;
- : area of cylinder rod side, ;
- : diameter of cylinder head side, ;
- : diameter of cylinder rod side, ;
- : initial position of cylinder, ;
- : initial compression force, ;
- : initial pressure of hydraulic system, .
When a force in the retraction direction was applied to the suspension, the cylinder moved in the retraction direction, as shown in Figure 2b, and the hydraulic oil escaped from the cylinder head chamber and entered the cylinder rod chamber. Because the amount of space required by the hydraulic oil to move around was less than the volume occupied by the cylinder rod, the remaining hydraulic oil flowed into the accumulator. As the accumulator was filled with hydraulic oil, the gas in the accumulator was compressed and the pressure in the hydraulic system increased, which increased the force to support the weight. This change proceeded until the force to press the suspension and the force supported by the pressure and area difference inside the cylinder were in equilibrium.
When a force in the extension direction was applied to the suspension, the cylinder moved in the extension direction, as shown in Figure 2c, and the hydraulic oil escaped from the cylinder rod chamber and entered the cylinder head chamber. In this case, because the amount of hydraulic oil was less than the volume of the rod, the hydraulic oil in the accumulator escaped and moved to the cylinder head chamber. As the gas inside the accumulator expanded, the pressure in the hydraulic system decreased and then stopped until the force was re-equilibrated.
If the process in Figure 2 is expressed as a force-displacement relationship, the results can be expected, as shown in Figure 3. As shown in Equation (2), the ideal linear system had a straight-lined slope, as shown in Figure 3a, and the slope at this time was defined as the spring constant (). However, the hydro-pneumatic suspension had nonlinear characteristics in the force-displacement relationship, as shown in Figure 3b, owing to the compressibility of air and hydraulic oil. In this case, the spring constant could not be expressed as a constant, and had to be expressed as a function or table. In an actual suspension system, hysteresis occurs because a force that hinders the movement of the piston acts by various friction elements. Therefore, the characteristic diagram depicting when the cylinder of the suspension is retracted and when it is extended can be expressed as a force-displacement diagram including hysteresis, as shown in Figure 3c.
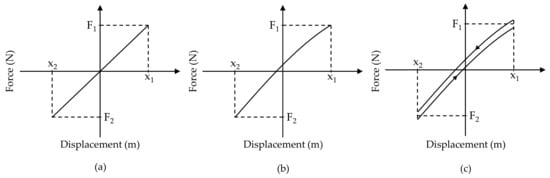
Figure 3.
Examples of force-displacement relationship according to suspension type: (a) ideal (b) non-linearity and (c) hysteresis.
2.2.2. Test for Force-Velocity Curve
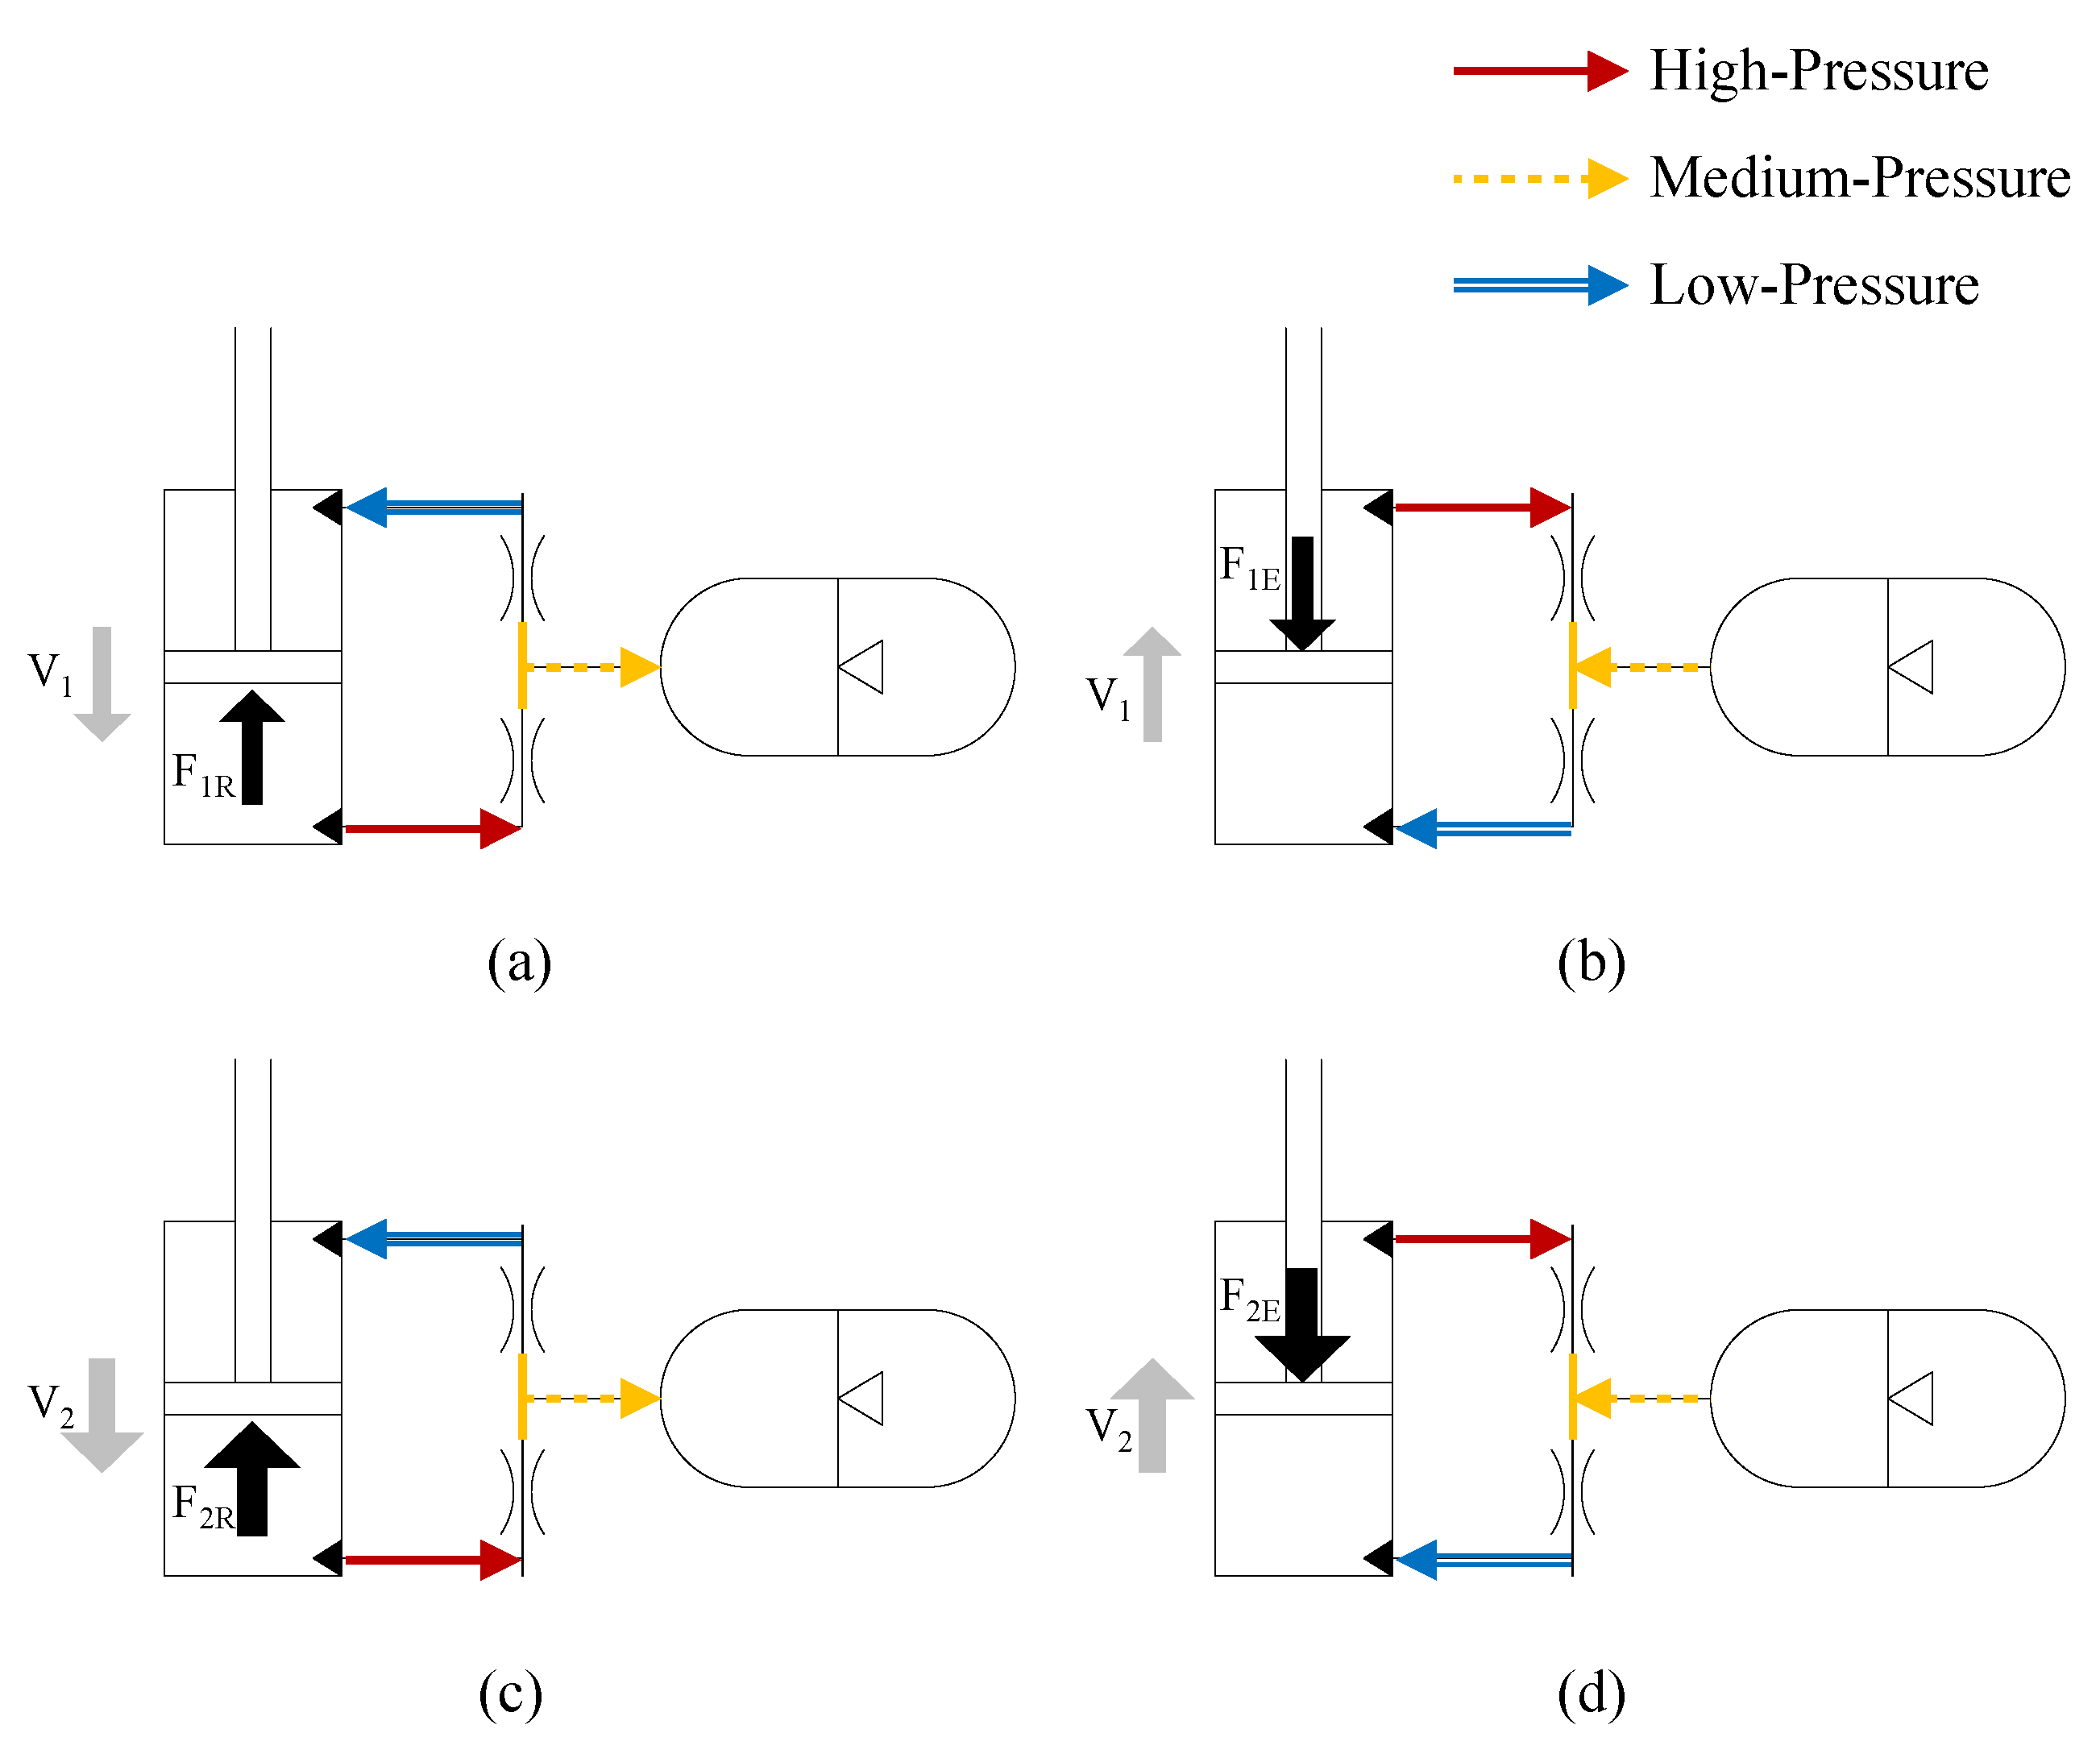
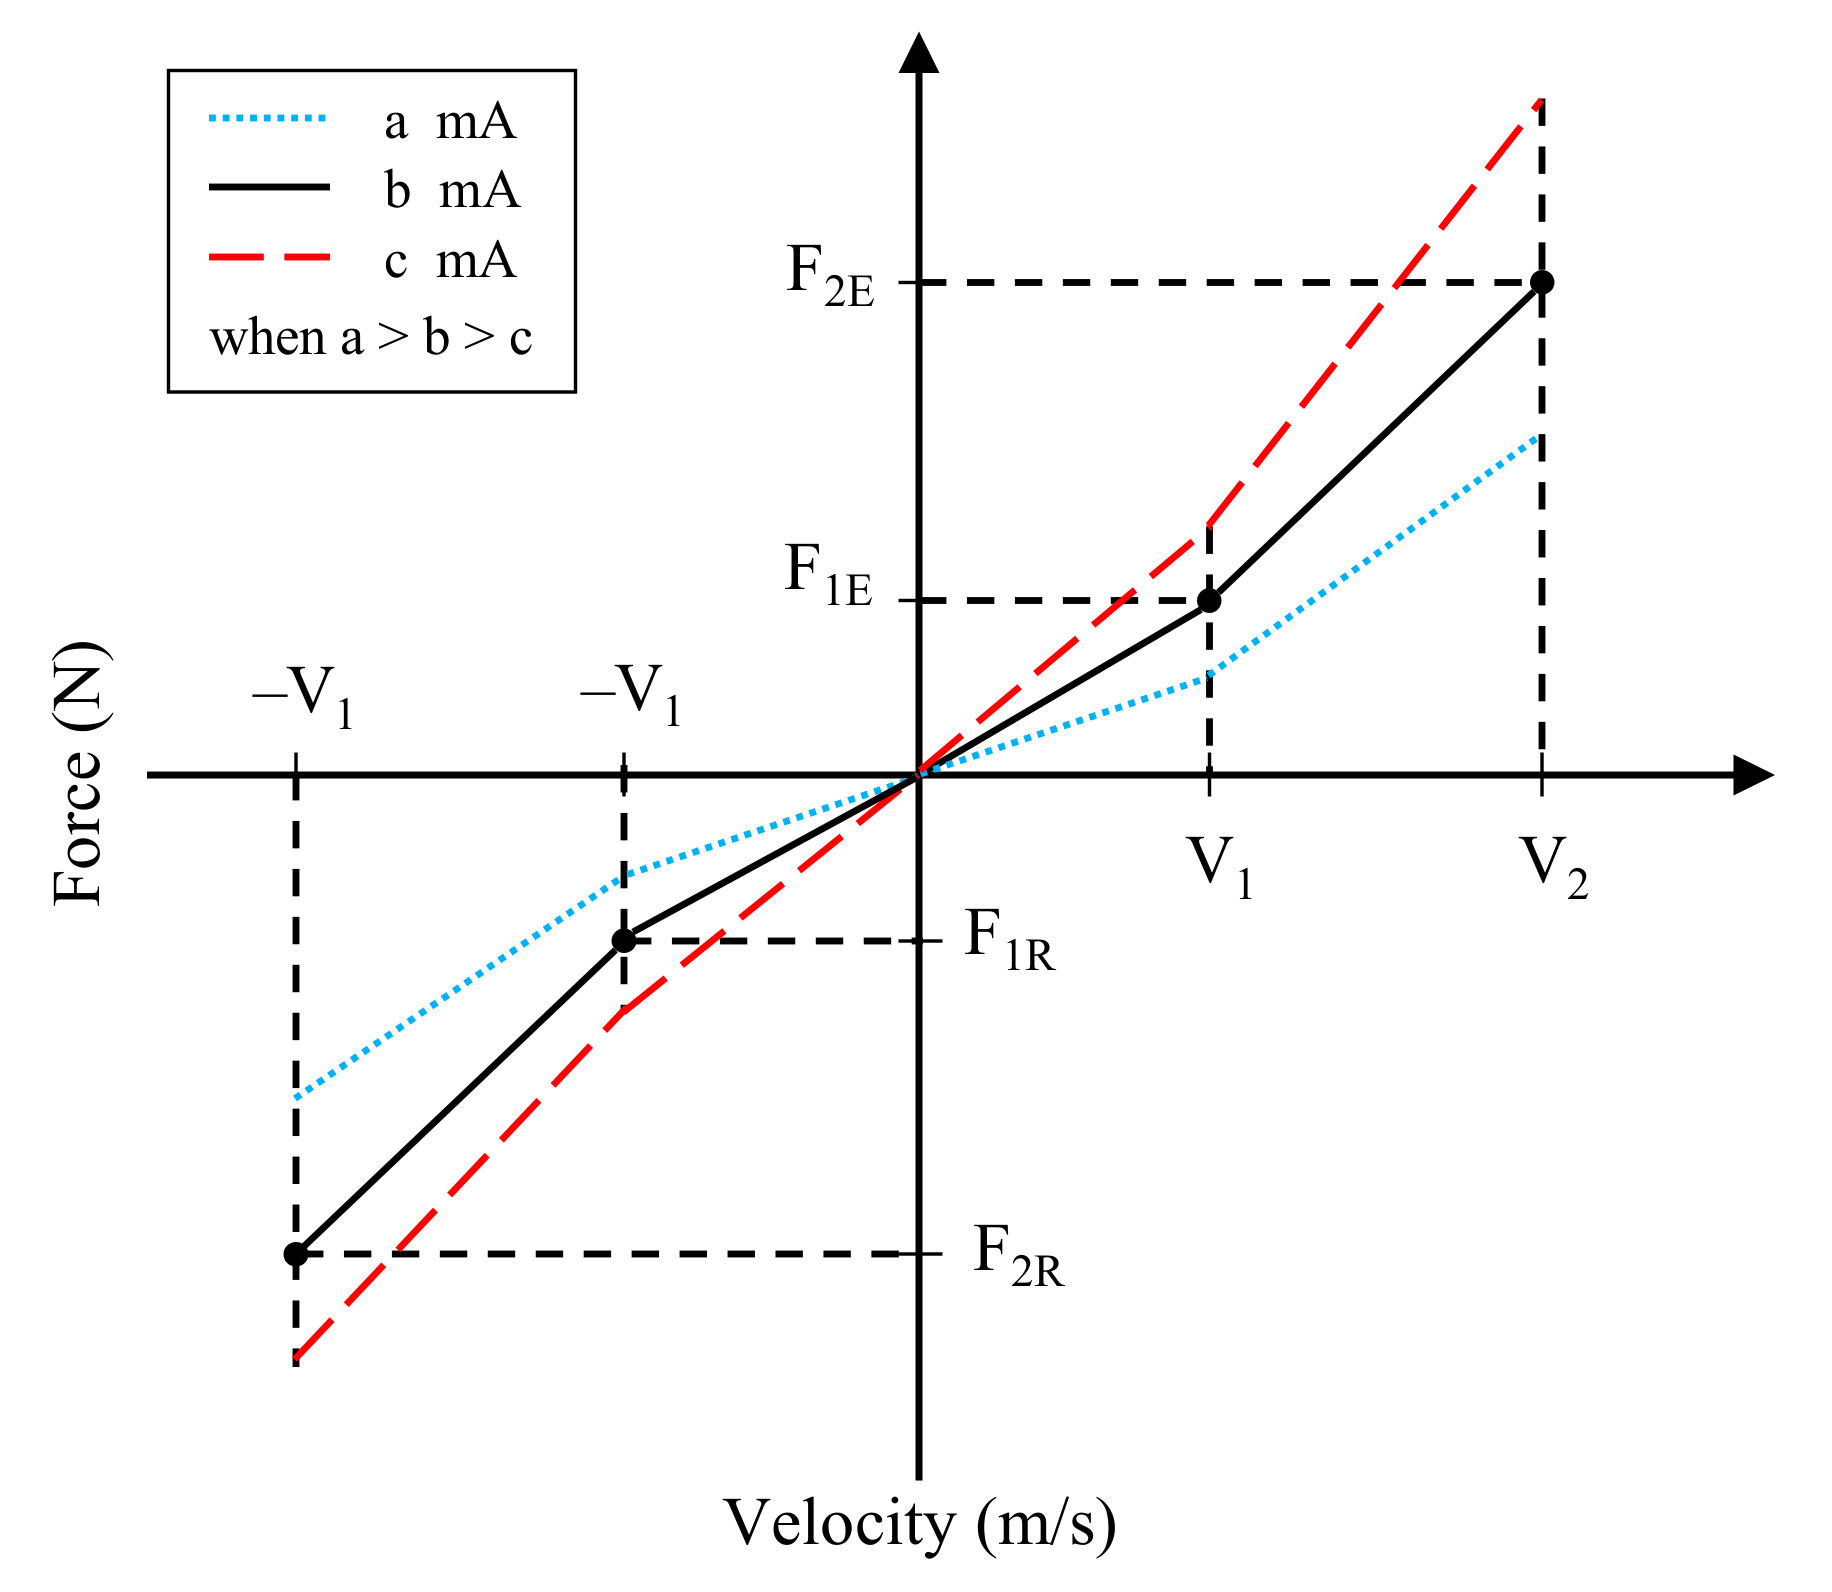
In order to obtain the damping coefficient using the force-velocity diagram, a large damping force had to be generated by moving the suspension at high speed. It was impossible to apply the desired velocity by moving the cylinder in only one direction because the stroke of the cylinder was limited. Therefore, the desired velocity was implemented through a reciprocating motion with sinusoidal displacement. In a suspension moving at high speed, the proportional control valve acted as flow-path resistance, creating high pressure in the chamber in the moving direction and damping force in the opposite direction due to the pressure difference between both chambers. The magnitude and direction of the damping force were determined by the moving speed and direction of the suspension, as shown in Figure 4. In Figure 4, the differences between (a) and (c) and between (b) and (d) express the increase in damping force as the velocity increased. It can be seen that the higher the speed, the greater the reaction force of the suspension, and the higher the pressure applied to the side where the cylinder was compressed, such that the force was generated in the opposite direction of the velocity. As shown in Figure 5, the damping force changed according to the current of the proportional control valve even if the suspension moved at the same speed, and the damping force increased as the input current decreases.
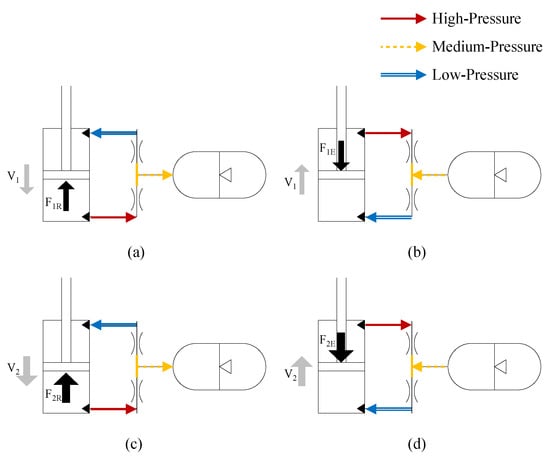
Figure 4.
Conceptual diagram of damping force according to velocity change: (a) low speed-retraction, (b) low speed-extension, (c) high speed-retraction and (d) high speed-extension.
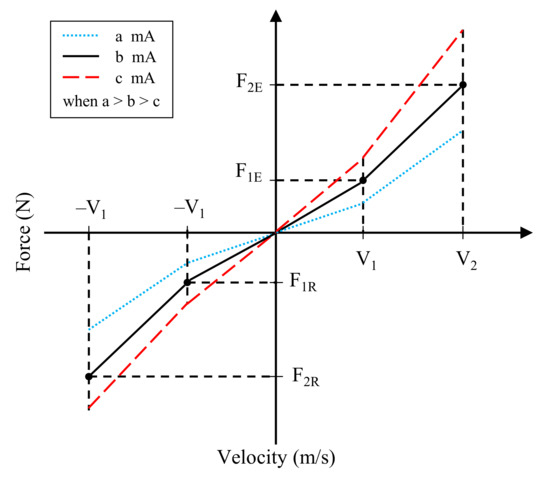
Figure 5.
Example of force-velocity characteristic diagram according to test condition.
Because it is impossible to generate the desired velocity by moving the cylinder in one direction only, owing to the limitation of the cylinder stroke, the desired velocity was implemented through reciprocating motion with sinusoidal displacement. The displacement of the sinusoidal wave with constant amplitude and frequency can be expressed as Equation (5), and the velocity can be obtained using Equation (6) by differentiating Equation (5). Owing to the characteristic of the sinusoidal function, the velocity became maximum when the displacement became zero. The maximum velocity is given by Equation (7). For example, when the amplitude was 35 , in order to generate the maximum velocity 25 at the point where the displacement is zero, according to Equation (7), , thus the frequency had to be 0.114 . Substituting Equation (7) into Equation (1), the relationship between the maximum force and the damping coefficient can be obtained as in Equation (8). If the amplitude of the displacement waveform was constant, the maximum velocity when passing through the point where the displacement was zero could be known, and the damping coefficient could be obtained by measuring the maximum force generated at this time and dividing it by the velocity.
where:
- : amplitude, ;
- : frequency, ;
- : damping coefficient, ;
- : reaction force at , .
2.3. Experimental Conditions
2.3.1. Test Equipment and System Configuration
The test environment was constructed using an exciter to perform the suspension characteristic test. The specifications of the exciter are listed in Table 2, and Figure 6 shows the installation of the suspension in the exciter.
Table 2.
Exciter specifications.
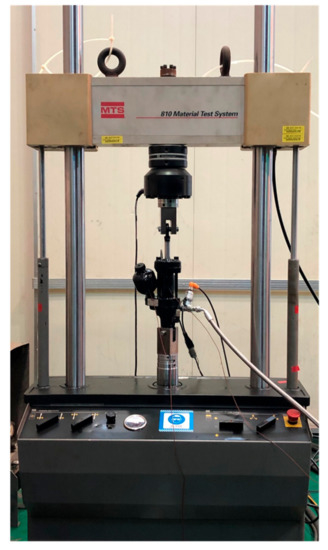
Figure 6.
Installation of suspension characteristic test equipment.
2.3.2. Test Conditions
The test to obtain the force-displacement diagram should be performed at low speed to ensure that the damping force will be negligible. Yin et al. [10] conducted tests using a stroke of 20 and a frequency of 0.5 to derive the spring constant of a pneumatic suspension, and Alonso et al. [11] tested a pneumatic suspension at a frequency of 0.1 . Giliomee and Els [9] used a velocity of 0.01 while testing the spring constant of a pneumatic suspension. In this study, a sine wave with a stroke of ±35 and a frequency of 0.005 was used as the displacement input. It was determined that the damping force would not have occurred because the tests in this study were performed at a much lower frequency or at a lower velocity than in previous studies.
In the test to obtain the force-velocity diagram, the characteristics of the entire section could be obtained by independently changing the opening of the proportional control valve of the suspension and the suspension operating velocity. In this study, 8 conditions were selected for the valve input current by varying the proportional control valve opening from 0 to 100%, and 6 conditions were selected for the operating velocity, resulting in a total of 48 test conditions. Table 3 lists the current conditions used in the test, and Table 4 lists the velocity (frequency) conditions.
Table 3.
Current conditions of test for force-velocity curve.
Table 4.
Velocity conditions of test for force-velocity curve.
3. Results and Discussion
3.1. Results of Force-Displacement Curve
The results of the test for obtaining the force-displacement diagram are shown in Figure 7. It was confirmed that the same trajectory was drawn when the results of tests repeated more than five times were expressed graphically. The values measured when the suspension was extended and when it was retracted were different because resistance forces are generated in the opposite direction of movement, owing to internal friction and fluid viscosity. The suspension characteristic in which this difference occurs is called hysteresis, and when the difference between the upper and lower curves was measured at the point where the displacement was zero, the magnitude of hysteresis was 179.8 . Using the test results, the relationship between force and displacement was obtained using Equation (9), which derives the average trend line of the two curves. The slope of 3.617 N/mm was the spring constant, and the constant −1547 N was the initial retractive force acting by the charging pressure of the accumulator when the displacement was zero. In the initial retractive force, a positive number indicated force in the extend direction and a negative number indicated force in the retract direction.
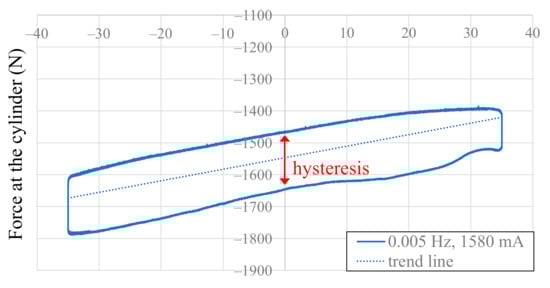
Figure 7.
Force-displacement curve from test results.
3.2. Results of Force-Velocity Curve
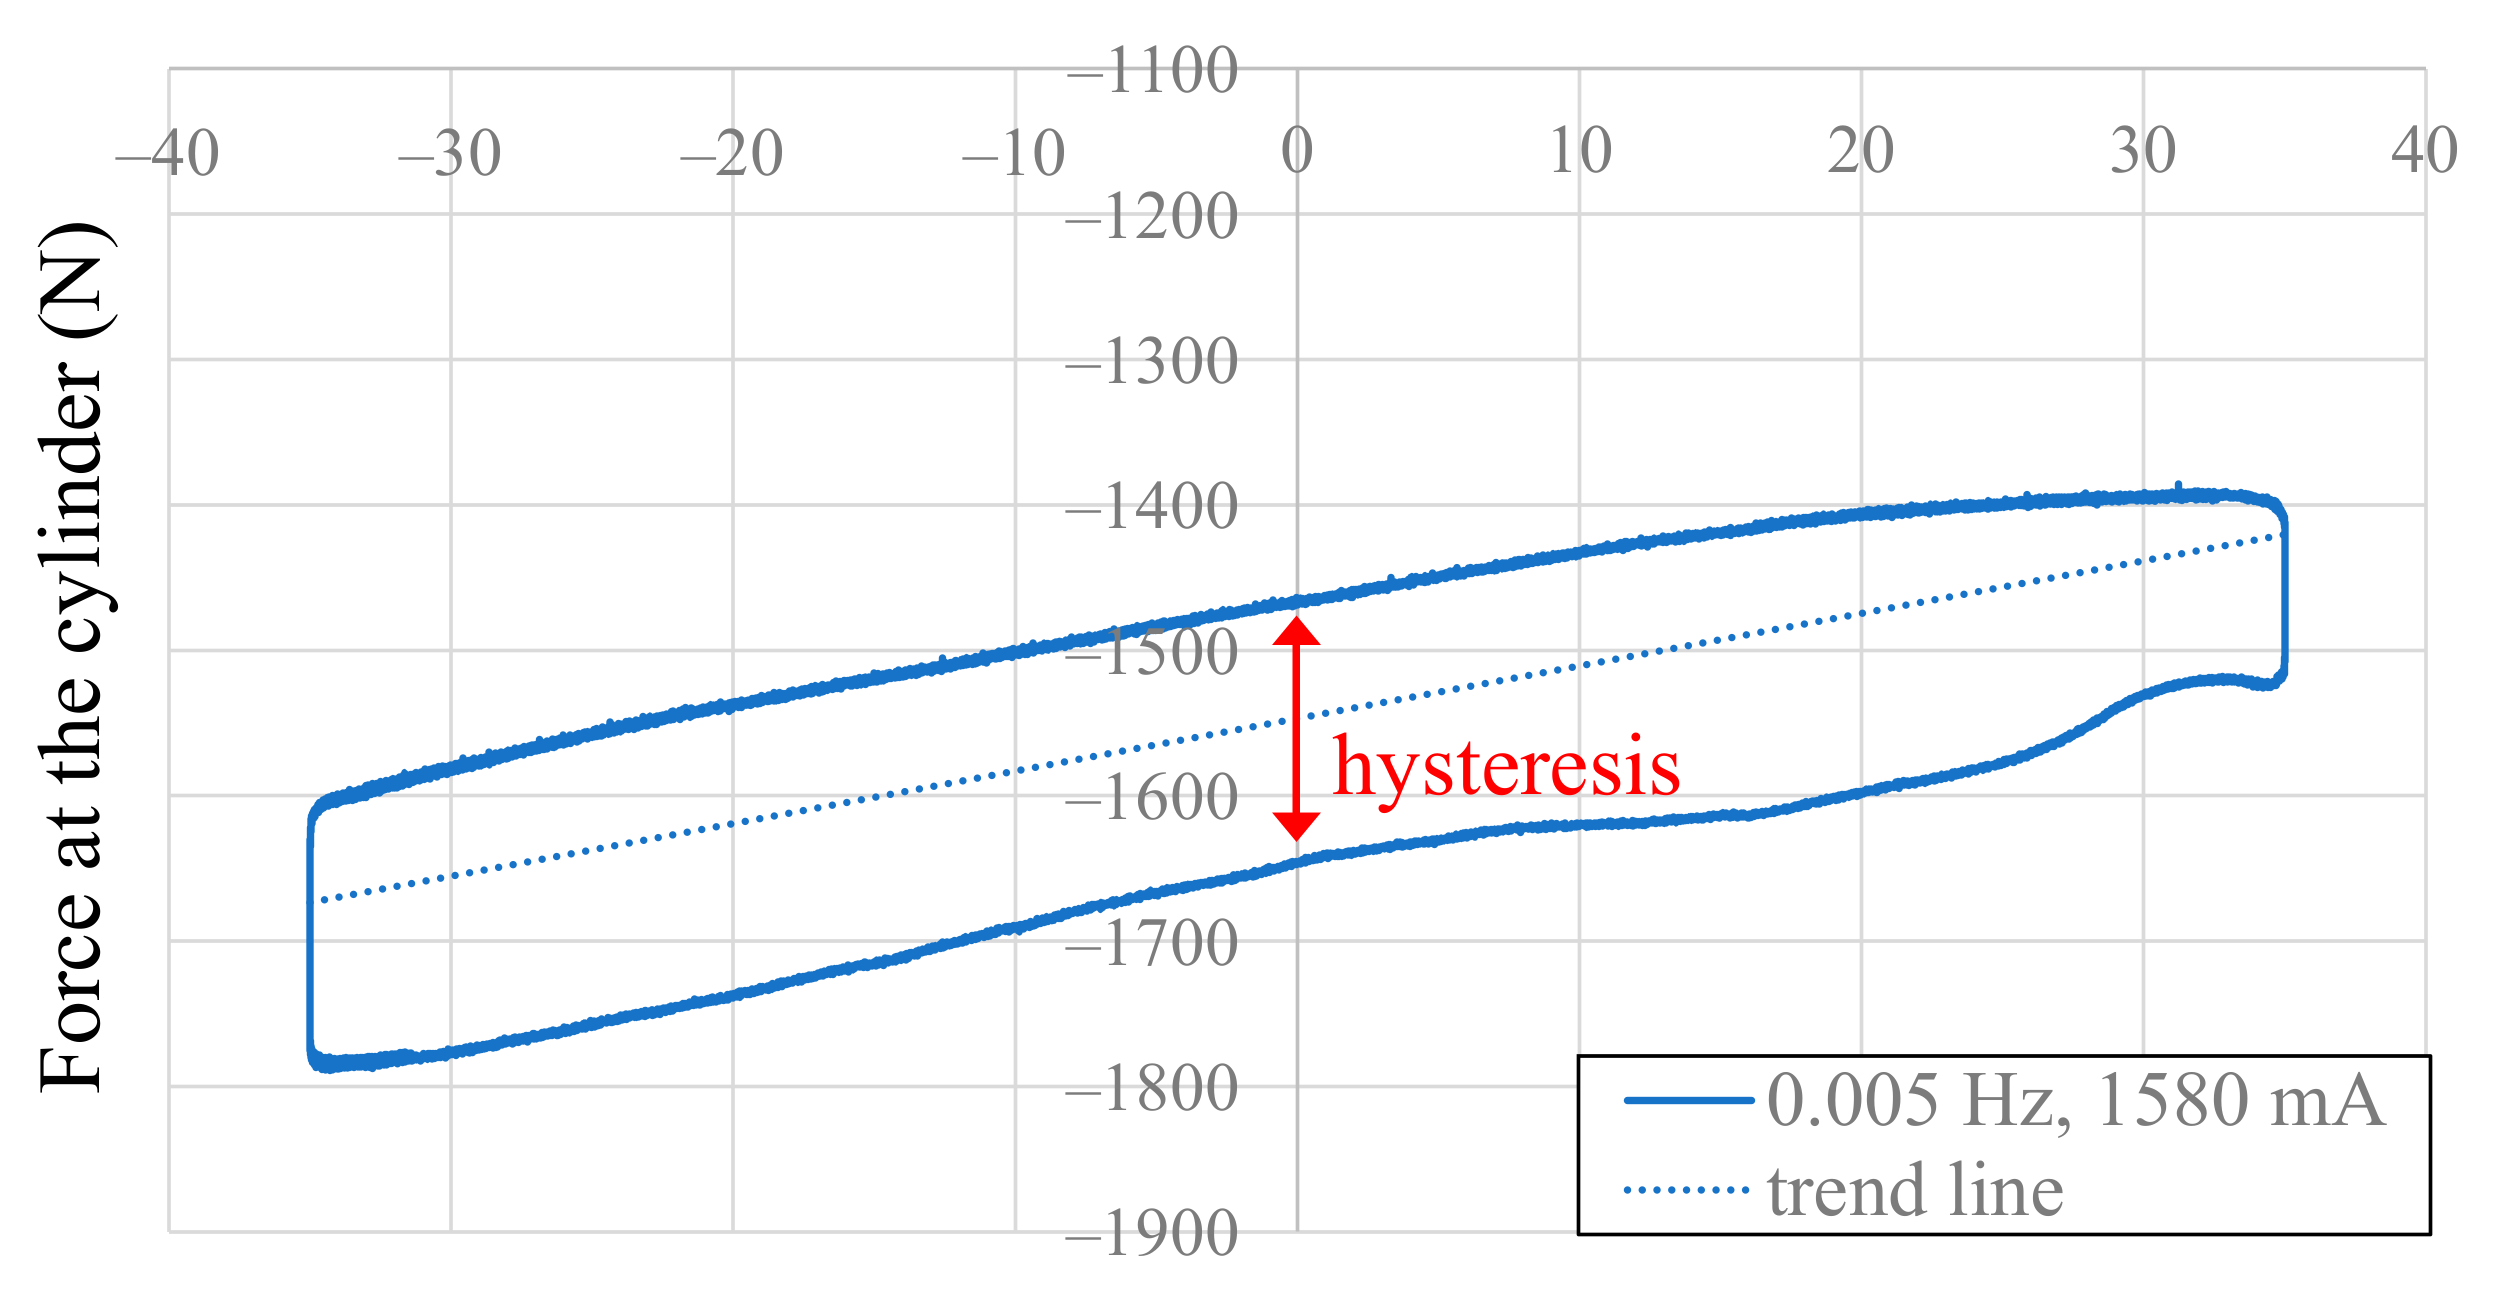
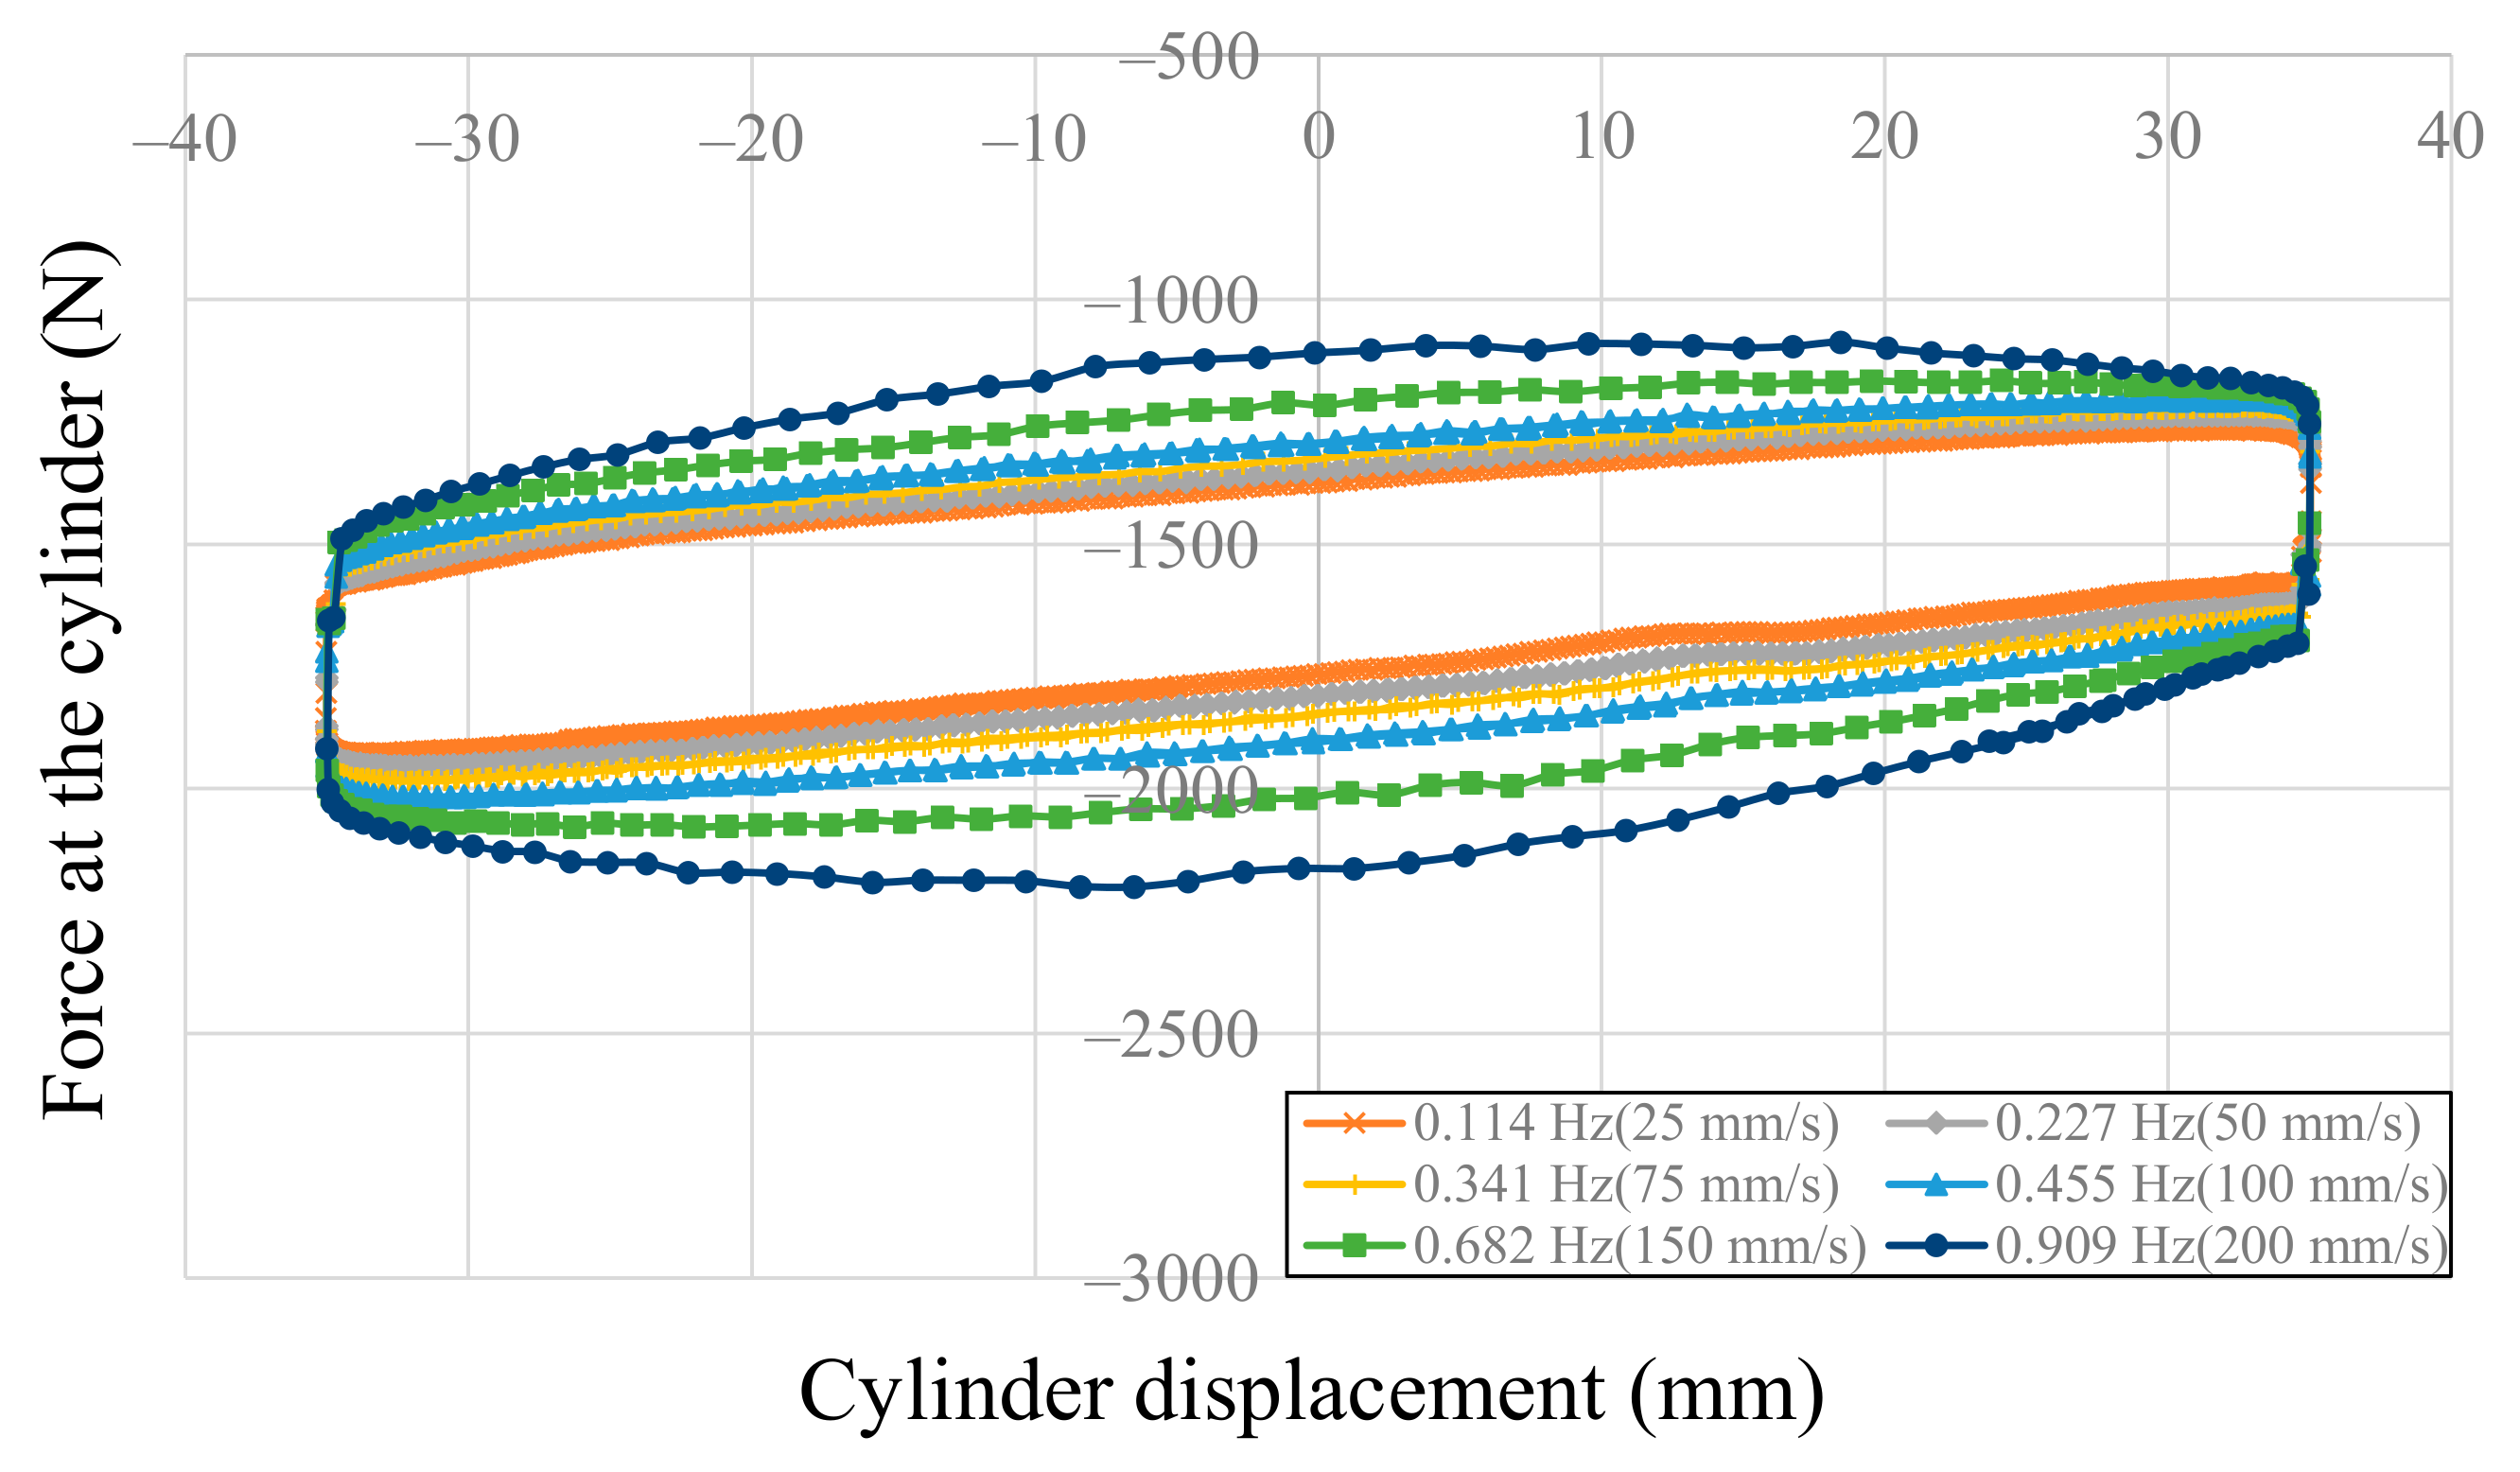
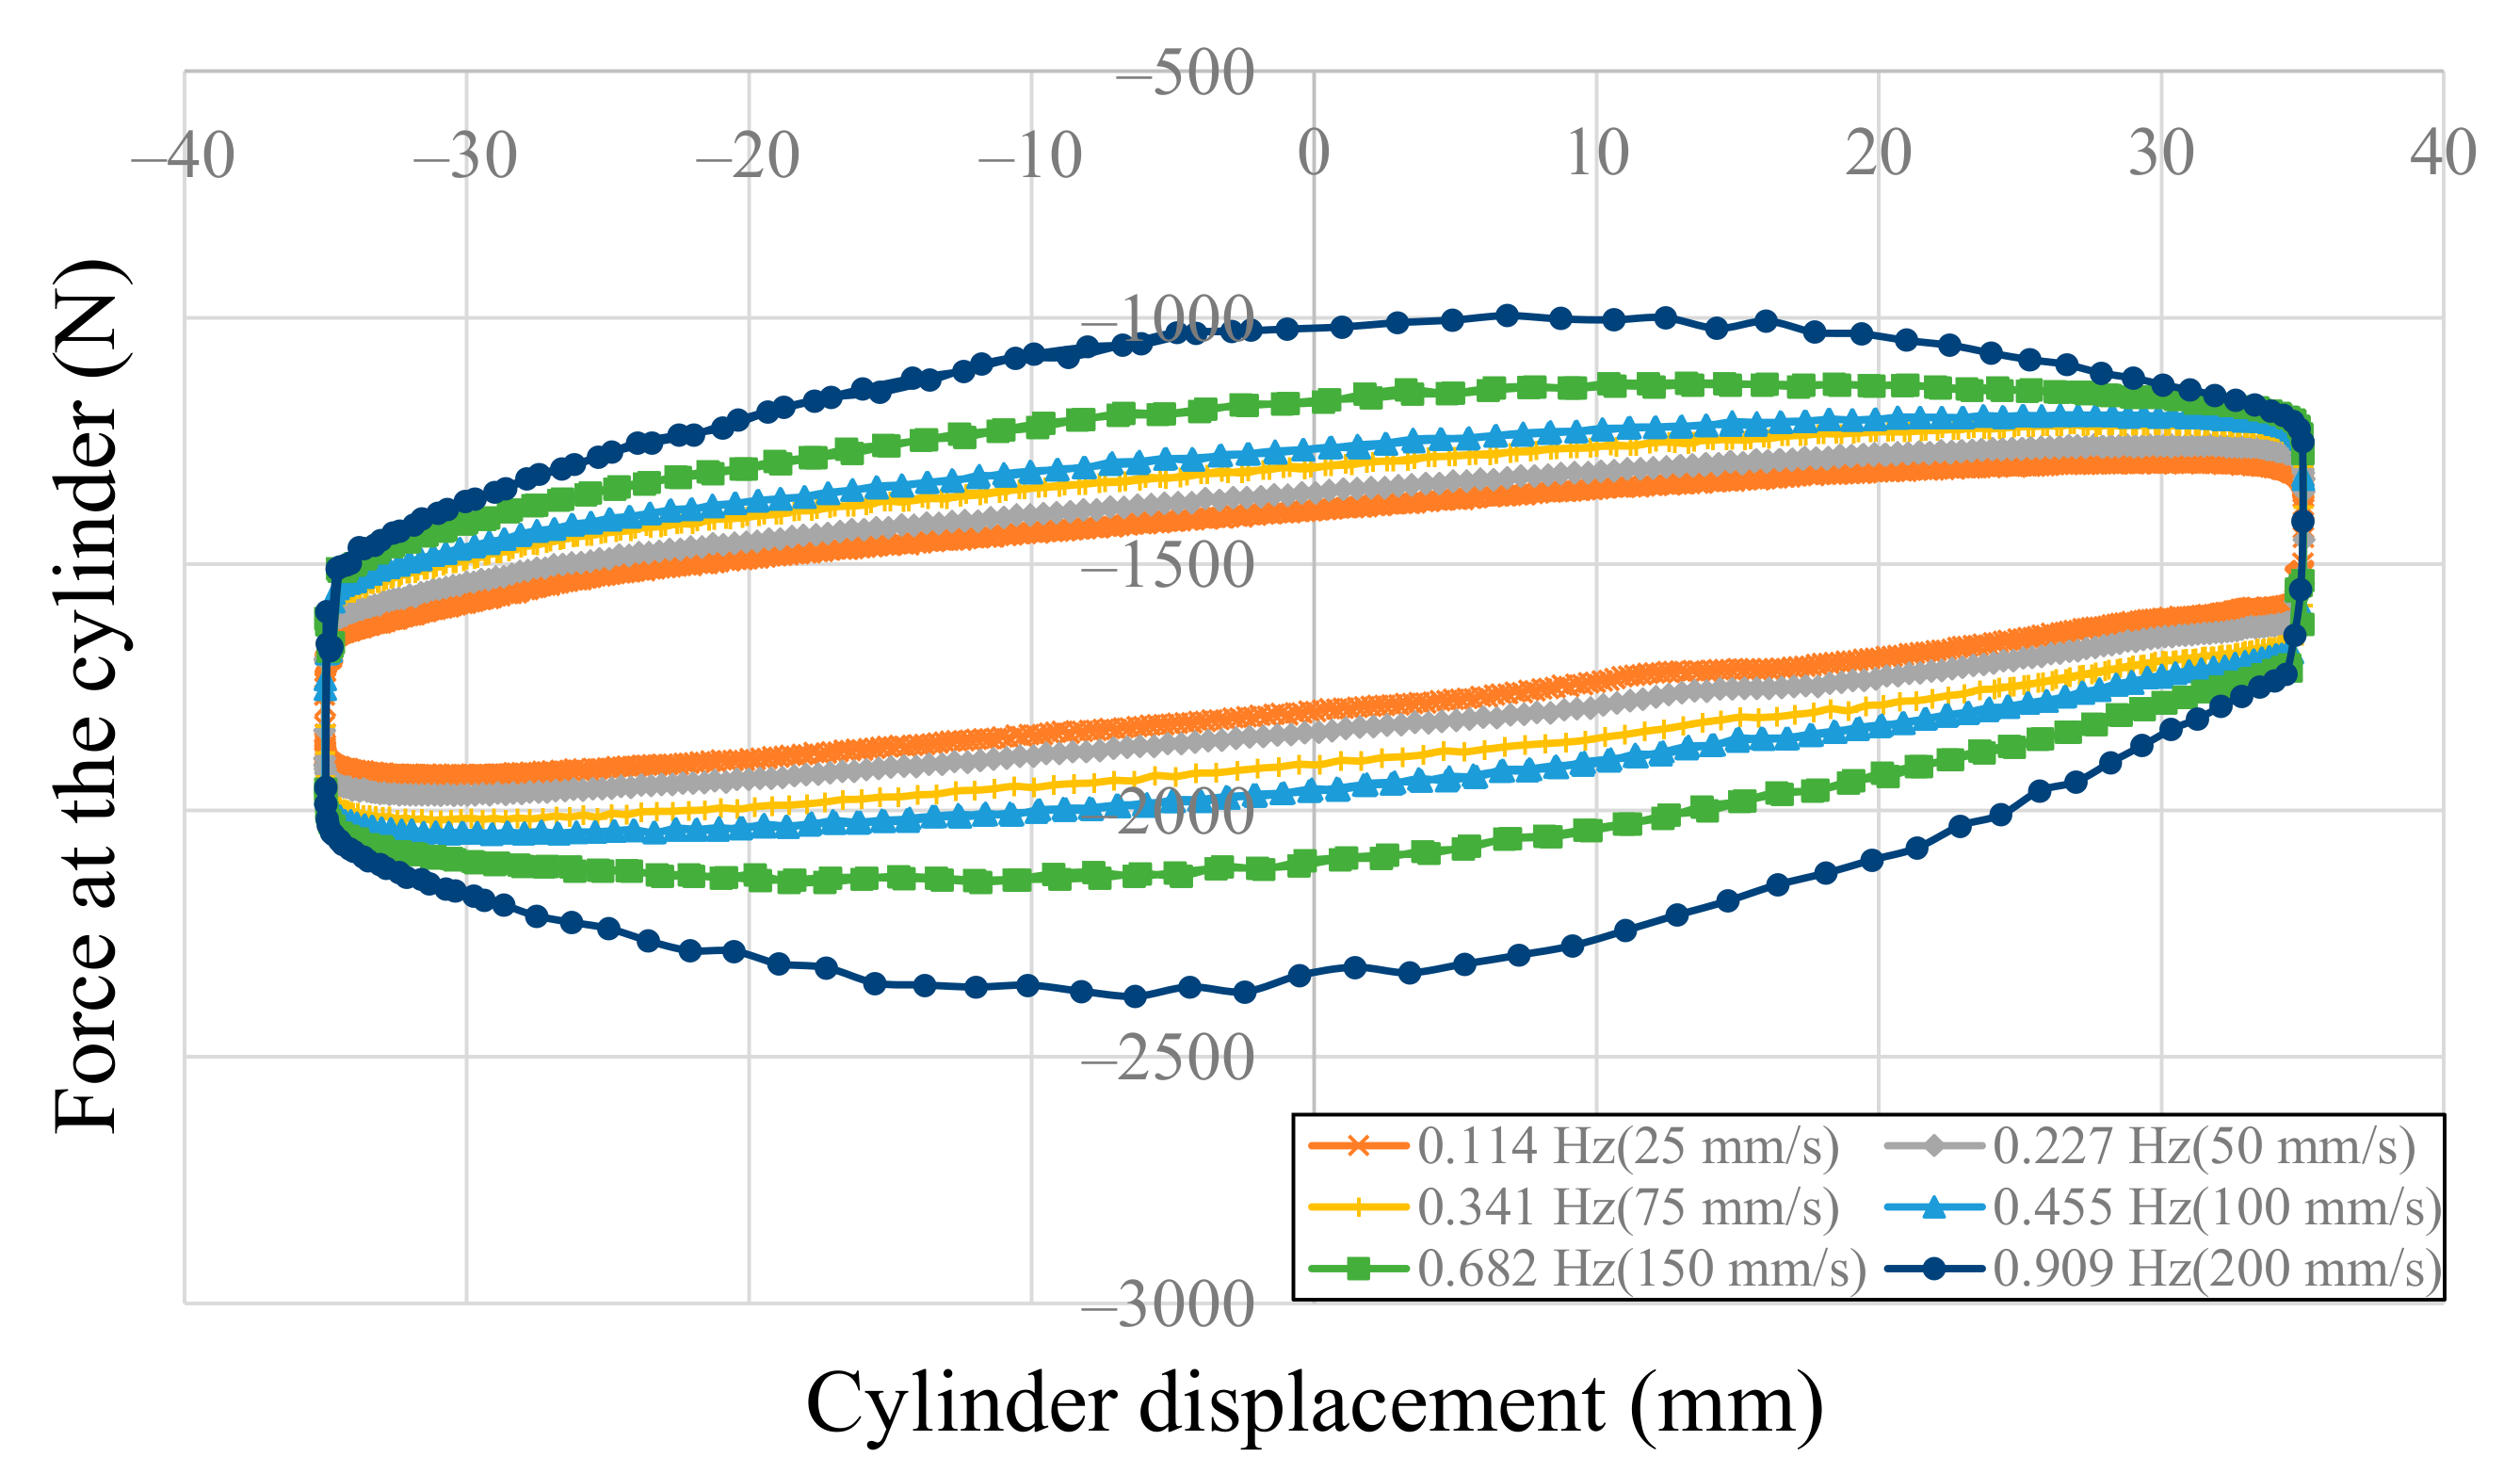
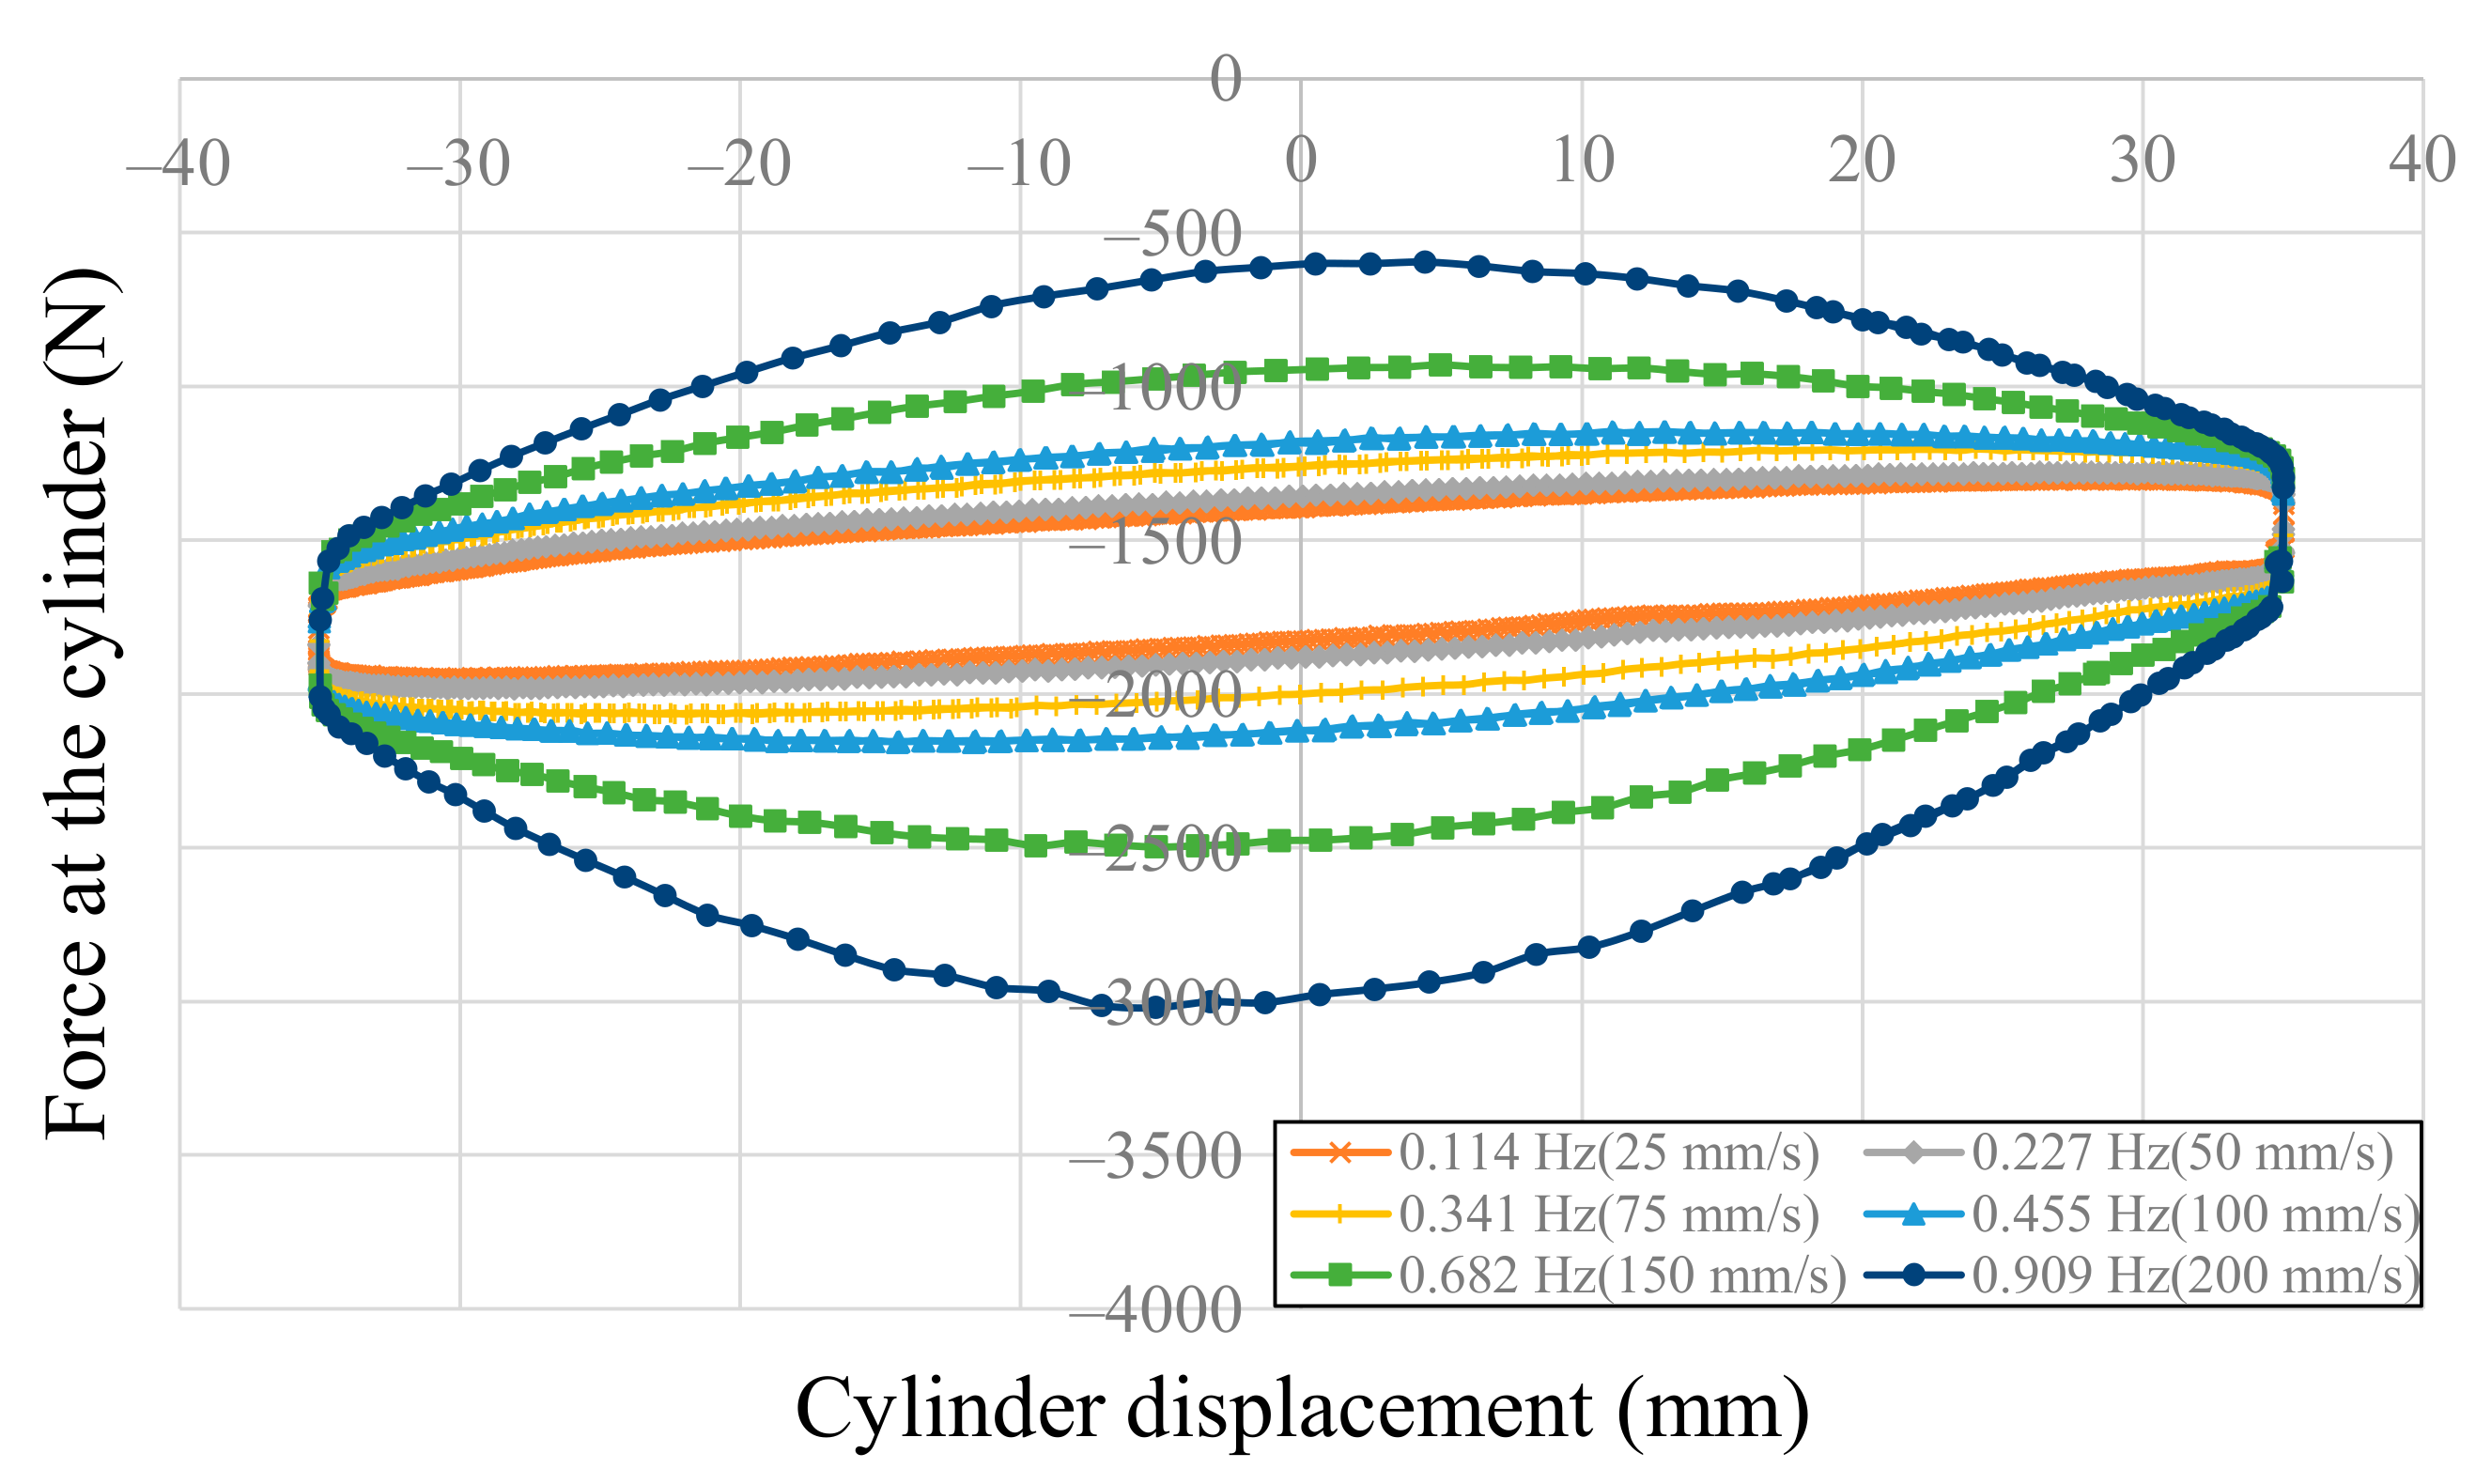
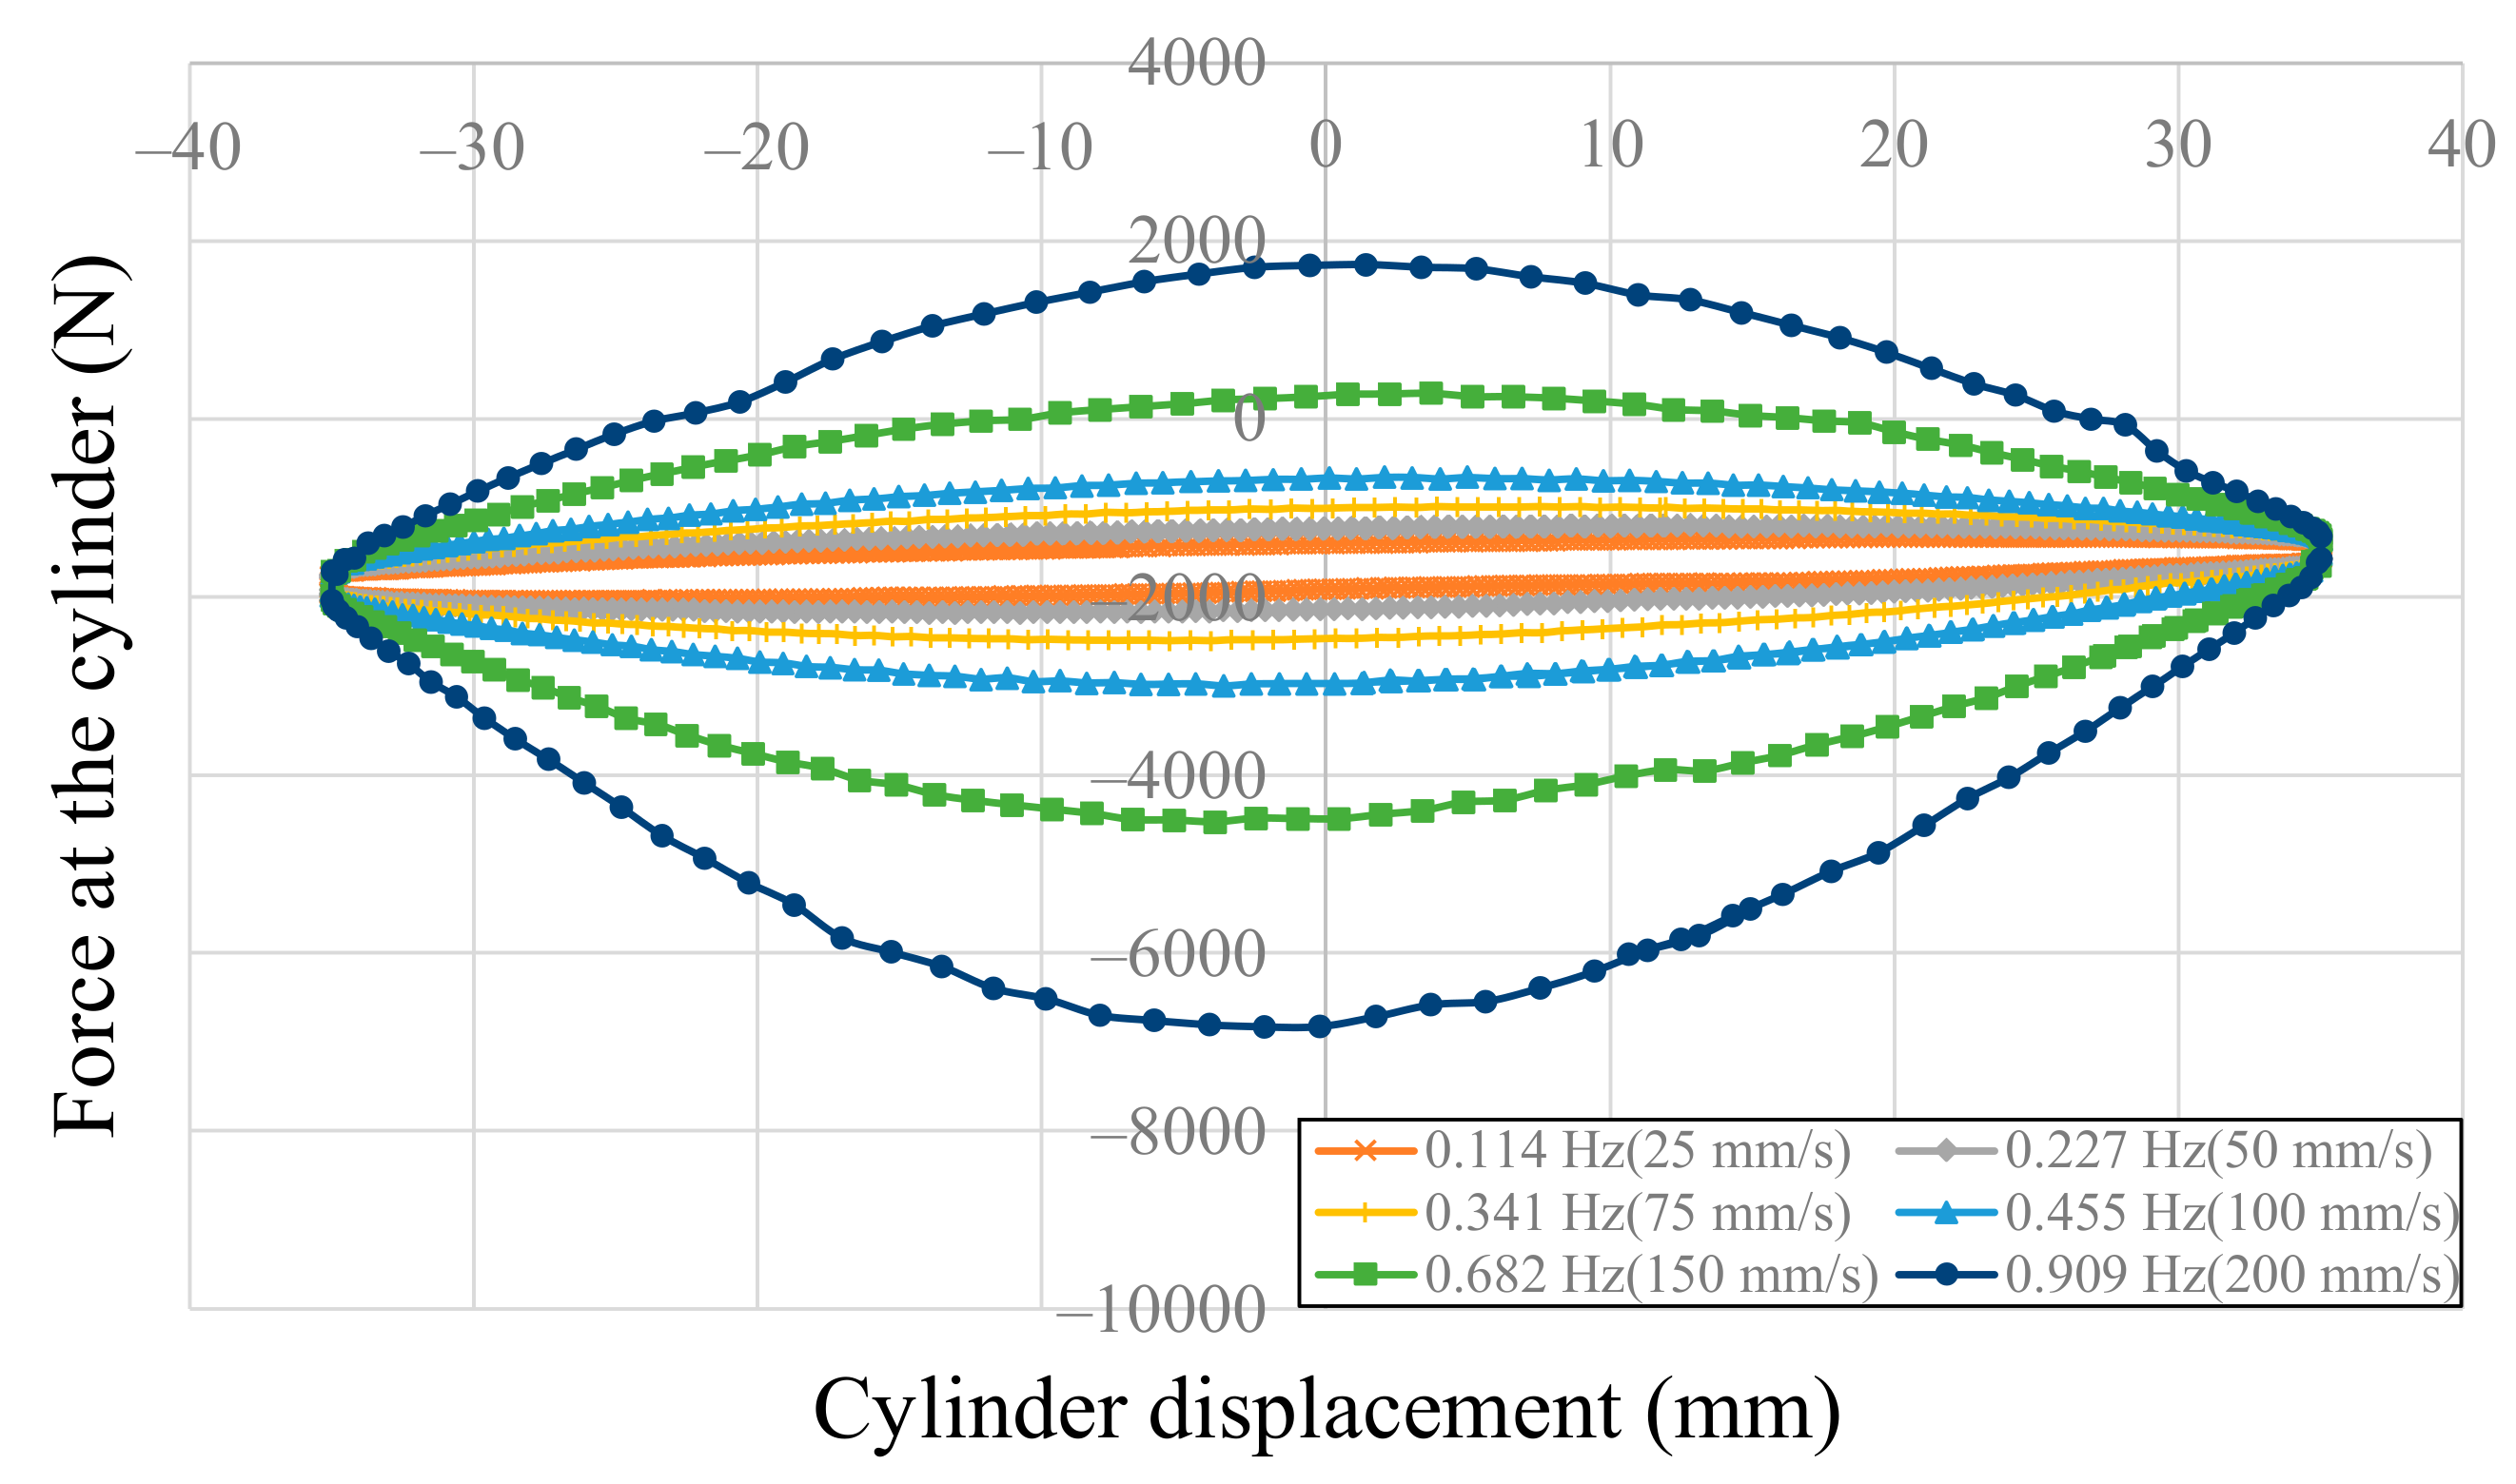
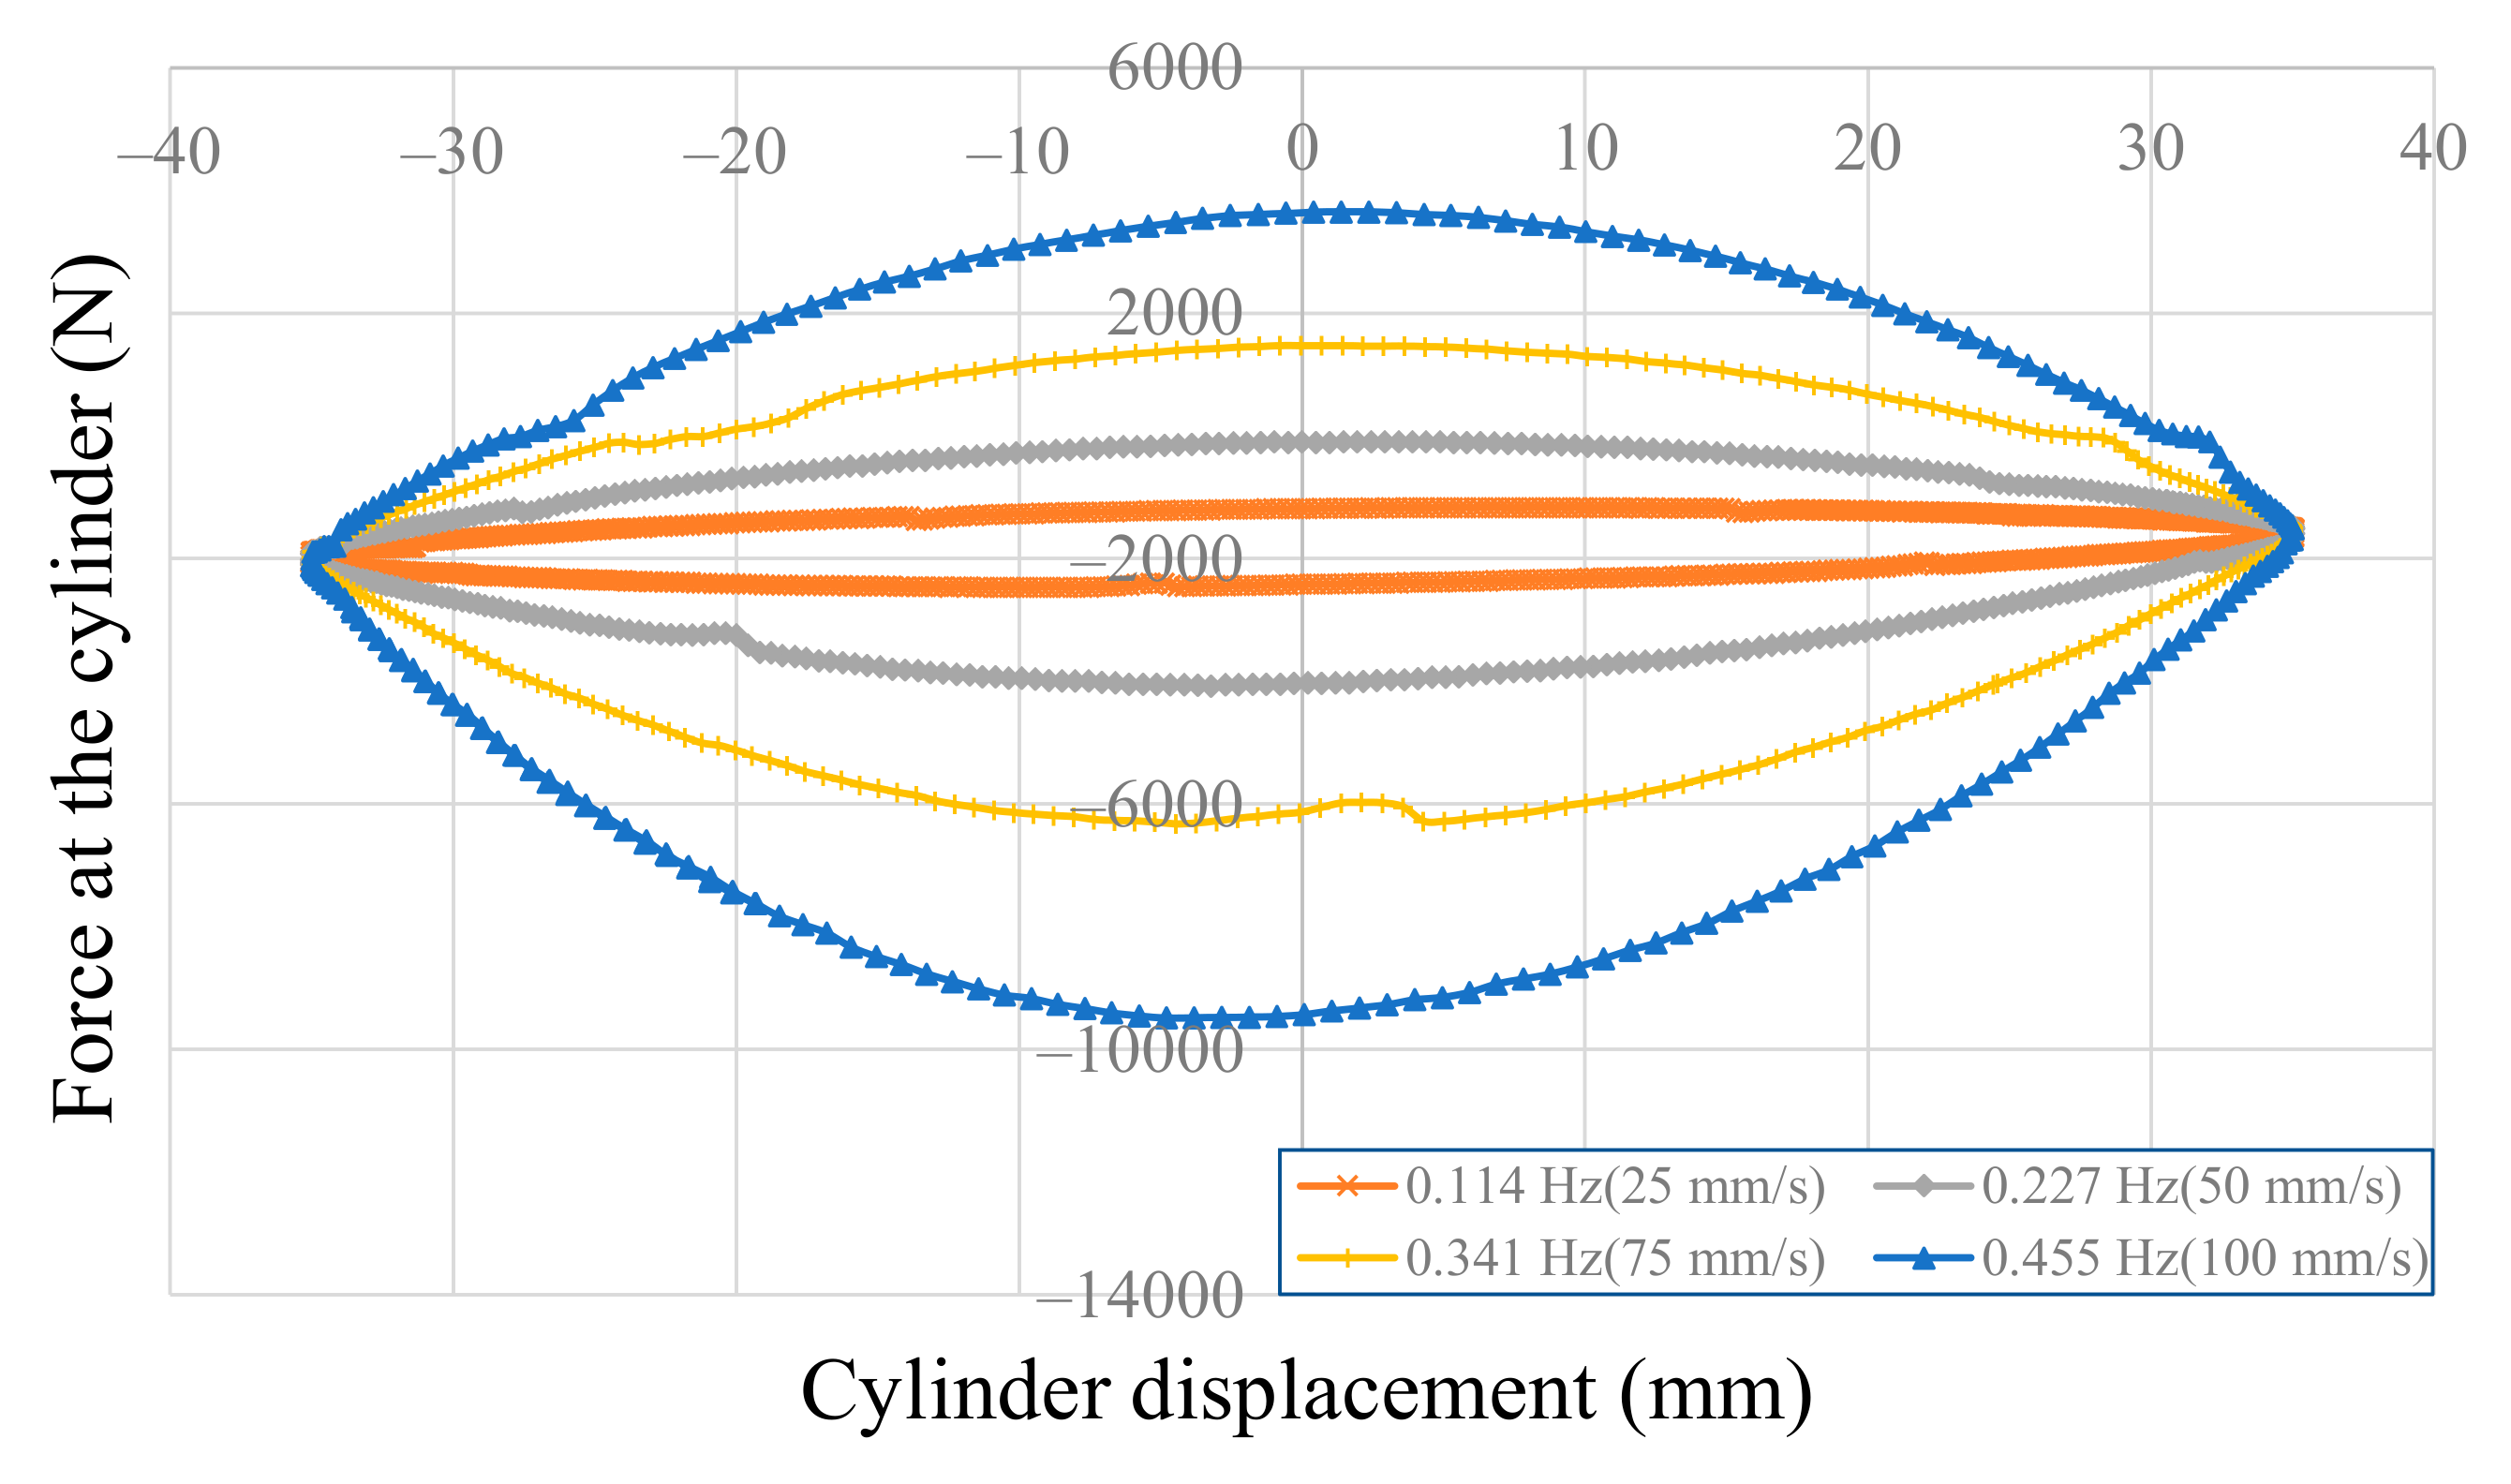
The force-velocity diagram for each current condition can be obtained from the results shown in Figure 8, Figure 9, Figure 10, Figure 11, Figure 12, Figure 13, Figure 14 and Figure 15. Because the proportional control valve of the suspension used in this study was of the normal closed type, the opening decreased as the applied current decreased, and the opening increased as the applied current increased. As the applied current decreased from 1580 to 290 mA, the valve opening decreased, and accordingly, the damping force increased, confirming that the difference in the y-intercept of the graph gradually increased.
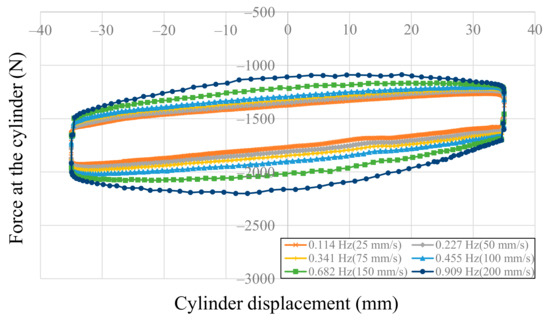
Figure 8.
Force-velocity results from test when applied valve current was 1580 mA (command 100%).

Figure 9.
Force-velocity results from test when applied valve current was 1350 mA (command 75%).
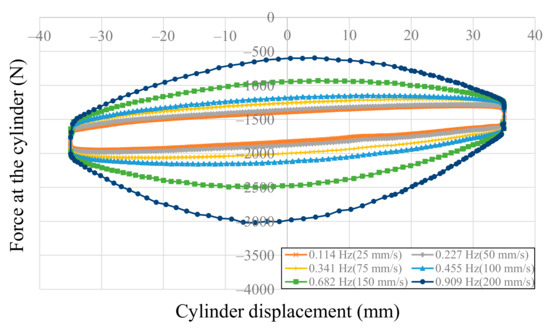
Figure 10.
Force-velocity results from test when applied valve current was 1080 mA (command 60%).
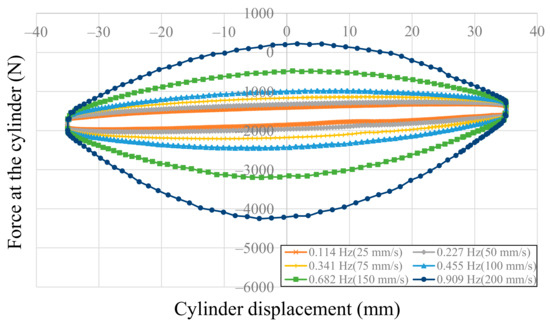
Figure 11.
Force-velocity results from test when applied valve current was 900 mA (command 50%).
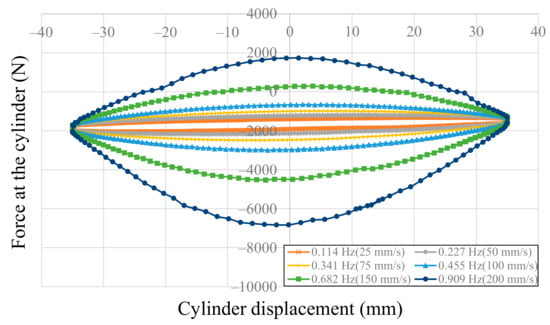
Figure 12.
Force-velocity results from test when applied valve current was 720 mA (command 40%).
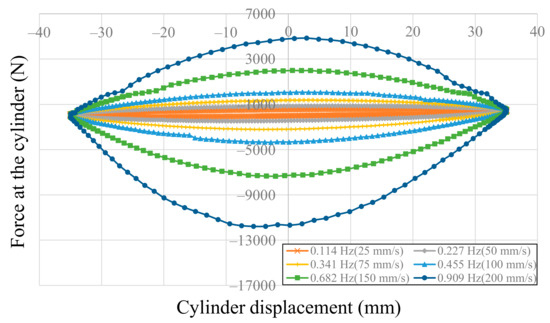
Figure 13.
Force-velocity results from test when applied valve current was 540 mA (command 30%).
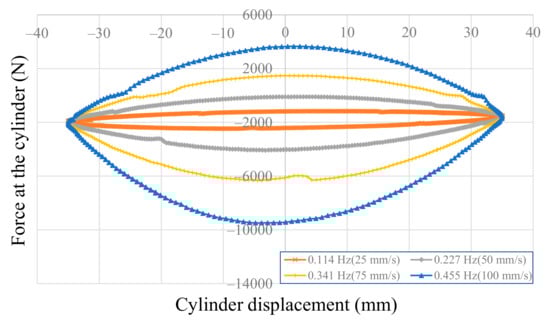
Figure 14.
Force-velocity results from test when applied valve current was 360 mA (command 20%).
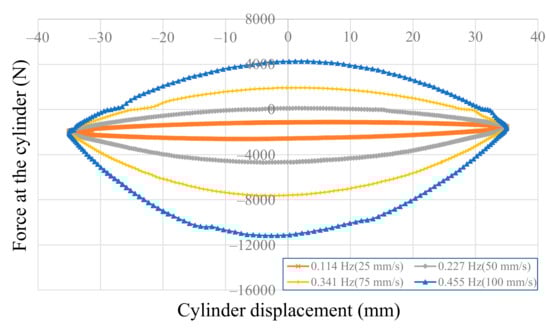
Figure 15.
Force-velocity results from test when applied valve current was 280 mA (command 0%).
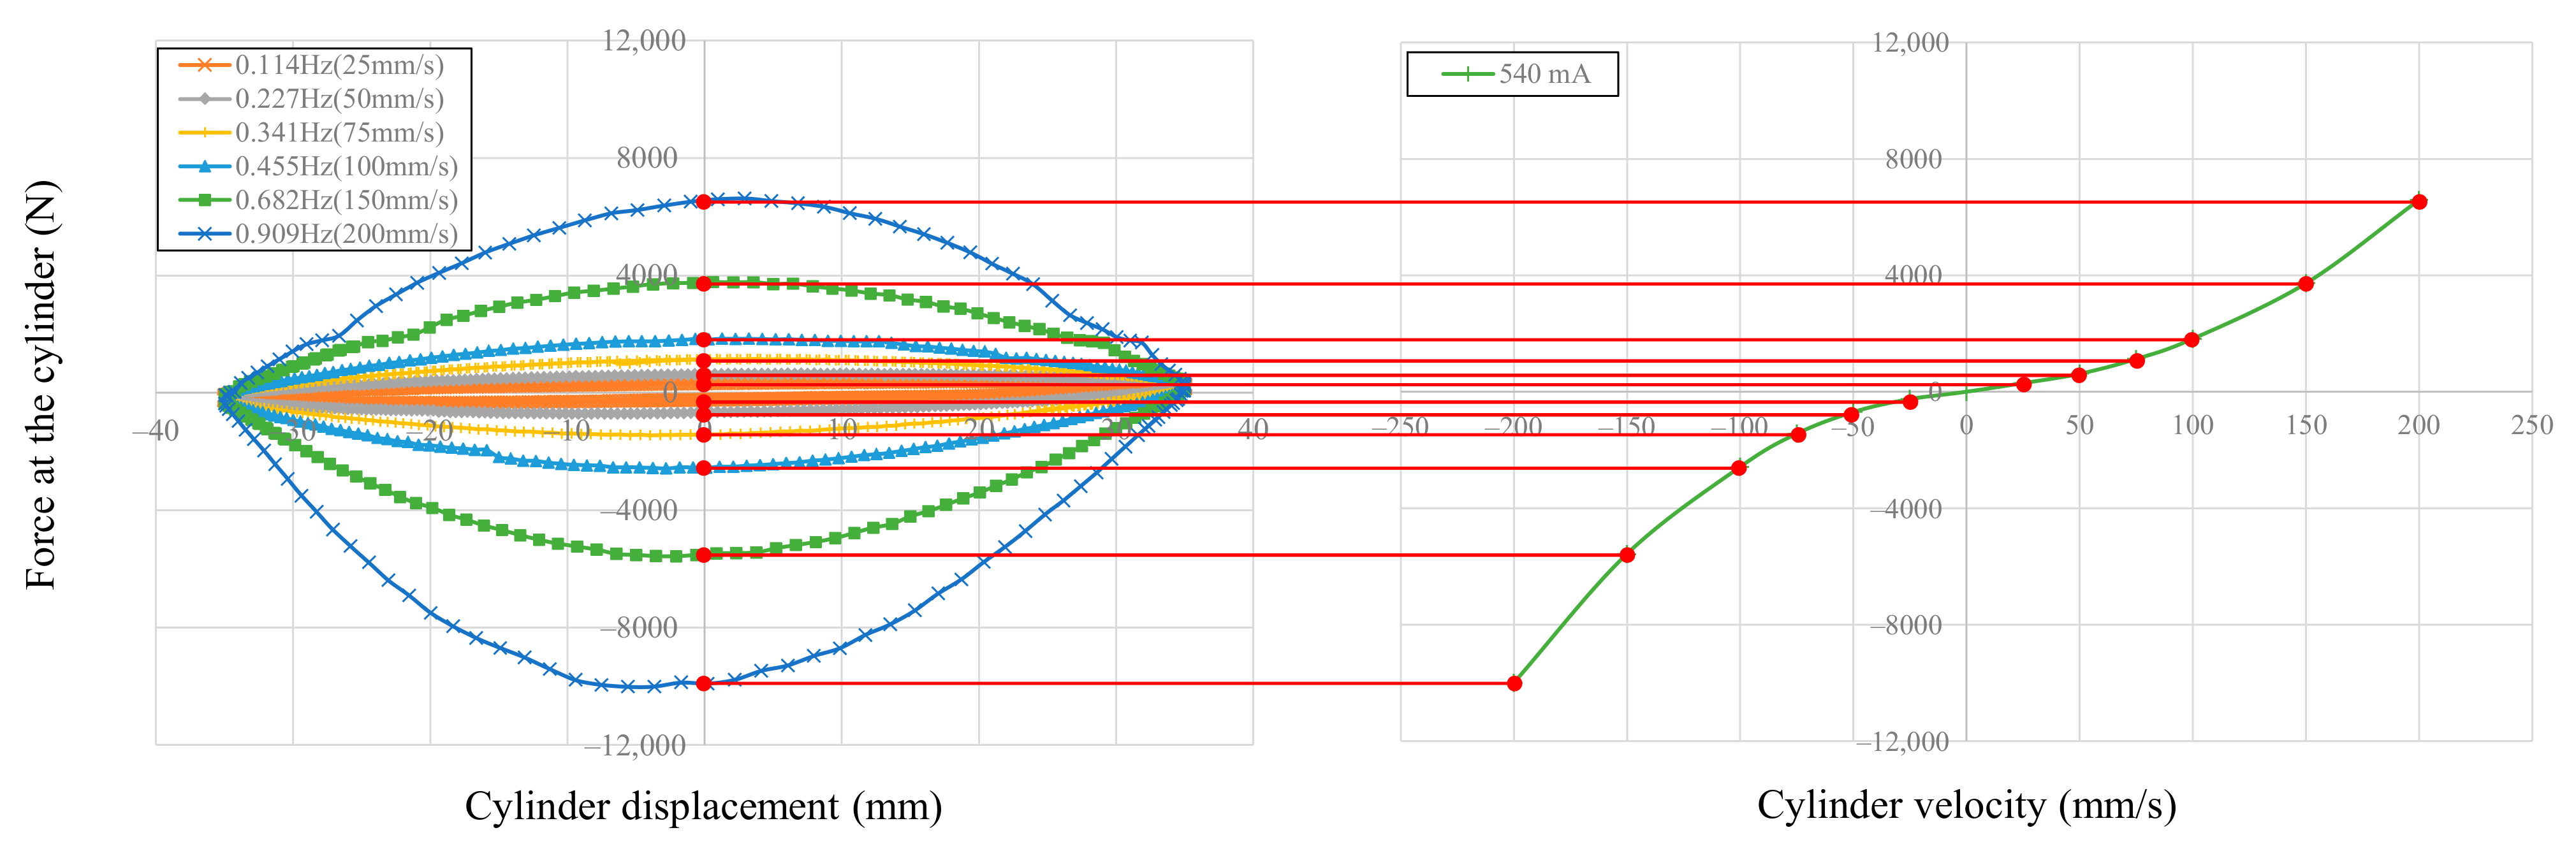
Figure 16 shows how the force-velocity diagram was obtained from the test results for the input current of 540 mA. The y-axis deviation offset in the negative direction caused by the initial retractive force was corrected to the origin, and the y-intercept value measured when the displacement x was zero in the test results for obtaining the force-displacement diagram was moved to the force-velocity coordinate plane. For example, the positive y-intercept is 6596 N and the negative y-intercept is −10,010 N in the graph of the test results reciprocating at 200 mm/s. From these values, two points were obtained in the force-velocity diagram: (200, 6596) and (−200, −10,010). Two points could be obtained in the same way for each velocity condition, and if all points were connected, a force-velocity diagram could be obtained, as shown on the right side of Figure 16.

Figure 16.
Schematic of method for plotting a force-velocity diagram.
Table 5 shows the y-intercept values obtained by repeatedly performing the operation shown in Figure 16 for each test condition. In Table 5, the blank entries correspond to areas where it was impossible to measure the reaction force because the action of the force was greater than the allowable load (10 kN) of the suspension. To express the damping force characteristics of the suspension, a force-velocity diagram was plotted, as shown in Figure 17, which is the result of drawing the results in Table 5 on the force-velocity plane.
Table 5.
Results of damping force for current-velocity.
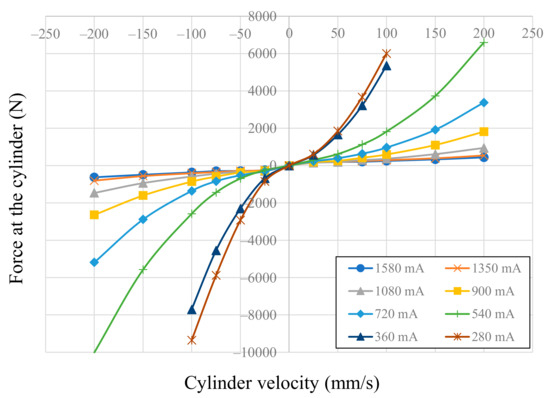
Figure 17.
Force-velocity curve according to applied valve current change.
In Figure 17, it is confirmed that the magnitude of the force at the cylinder increased as the cylinder velocity increased, and that the force and velocity had a nonlinear relationship. In addition, the applied current of the proportional control valve showed a nonlinear characteristic change, and the reaction force changed significantly in the range between 360 and 720 mA; it was confirmed that the reaction force changes were relatively minor below 360 and above 720 mA. Because the unit of the damping coefficient was , the damping coefficient for current and velocity was obtained by dividing the force by the velocity, as shown in Table 6.
Table 6.
Results of damping coefficient for current-velocity.
4. Conclusions
To establish an accurate test method for deriving the spring constant and damping coefficient of a suspension, this study performed a characteristic test on a semi-active hydro-pneumatic suspension under changing velocity and current conditions, and generated force-displacement and force-velocity curves representing suspension characteristics for input into a simulation model for control logic development. A semi-active hydro-pneumatic suspension combines a hydraulic spring whose performance is determined by the characteristics of the accumulator (nitrogen pressure, capacity) and a semi-active damper technology controlled by the flow rate inside the suspension. The test utilized an exciter capable of controlling the displacement and velocity of a hydraulic cylinder, and a method of fixing one side of the suspension and reciprocating the other side. The test was performed under six velocity conditions and eight current conditions.
In order to obtain the spring constant of the hydro-pneumatic suspension, the test configured the piston to move at a low speed to prevent the damping force from occurring and to ensure an accurate spring constant measurement. The reaction force according to the displacement was measured, and the spring constant was obtained. In order to obtain the damping coefficient of the hydro-pneumatic suspension, it had to be moved at a high speed to generate a large reaction force. The reaction force was measured at the point where the displacement was zero, and the damping coefficient was obtained using the force-velocity diagram. The test method used in this study could not fully implement the nonlinear characteristics with hysteresis of the hydro-pneumatic semi-active suspension. However, it was considered to be sufficient for the purpose of creating a simulation model for control logic development.
This study presented a method for accurately testing the dynamic characteristics of a semi-active hydro-pneumatic suspension that could change its performance according to the terrain or the needs of the operator. In future research, if the dynamic suspension characteristics obtained in this study can be applied to a tractor simulation model, the characteristics of tractor ride vibration could be more accurately predicted. Further, by employing the tractor ride vibration model, the findings of this study could be used in the development of control logic to minimize ride vibration.
Author Contributions
Conceptualization, G.-H.L. and Y.-J.P.; methodology, K.C.; validation, K.C. and J.O.; formal analysis, J.O. and H.-W.H.; investigation, H.-S.K., H.-W.H., and J.-H.P.; data curation, J.S.; writing—original draft preparation, K.C.; writing—review and editing, J.S. and Y.-J.P.; visualization, J.-H.P.; supervision, G.-H.L.; project administration, Y.-J.P.; funding acquisition, Y.-J.P. All authors have read and agreed to the published version of the manuscript.
Funding
This work was supported by the National Research Foundation of Korea (NRF) grant funded by the Korea government (MSIT) (grant number: 2019R1F1A1059712).
Conflicts of Interest
The authors declare no conflict of interest.
References
- Choi, K.; Oh, J.; Ahn, D.; Park, Y.-J.; Park, S.-U.; Kim, H.-S. Experimental Study of the Dynamic Characteristics of Rubber Mounts for Agricultural Tractor Cabin. J. Biosyst. Eng. 2018, 43, 255–262. [Google Scholar] [CrossRef]
- Oh, J.; Chung, W.-J.; Han, H.-W.; Kim, J.-T.; Son, G.-H.; Park, Y.-J. Evaluation of Tractor Ride Vibrations by Cabin Suspension System. Trans. ASABE 2020, 63, 1465–1476. [Google Scholar] [CrossRef]
- Sim, K.; Lee, H.; Yoon, J.W.; Choi, C.; Hwang, S.H. Effectiveness evaluation of hydro-pneumatic and semi-active cab suspension for the improvement of ride comfort of agricultural tractors. J. Terramech. 2017, 69, 23–32. [Google Scholar] [CrossRef]
- Bauer, W. Hydropneumatic Suspension Systems; Springer: Berlin/Heidelberg, Germany, 2010. [Google Scholar]
- Zehsaz, M.; Sadeghi, M.H.; Ettefagh, M.M.; Shams, F. Tractor cabin’s passive suspension parameters optimization via experimental and numerical methods. J. Terramech. 2011, 48, 439–450. [Google Scholar] [CrossRef]
- Sarami, S. Development and Evaluation of a Semi-Active Suspension System for Full Suspension Tractors. Ph.D. Dissertation, Berlin Institute of Technology, Berlin, Germany, 2009. [Google Scholar]
- Omar, M.; El-kassaby, M.M.; Abdelghaffar, W. A universal suspension test rig for electrohydraulic active and passive automotive suspension system. Alex. Eng. J. 2017, 56, 359–370. [Google Scholar] [CrossRef]
- Konieczny, Ł.; Burdzik, R.; Folęga, P.; Wieczorek, A. Determination of the damping characteristics of hydro pneumatic suspension strut. J. Meas. Eng. 2013, 1, 155–158. [Google Scholar]
- Giliomee, C.L.; Els, P.S. Semi-active hydropneumatic spring and damper system. J. Terramech. 1998, 35, 109–117. [Google Scholar] [CrossRef]
- Yin, Z.; Khajepour, A.; Cao, D.; Ebrahimi, B.; Guo, K. A new pneumatic suspension system with independent stiffness and ride height tuning capabilities. Veh. Syst. Dyn. 2012, 50, 1735–1746. [Google Scholar] [CrossRef]
- Alonso, A.; Gimenez, J.G.; Nieto, J.; Vinolas, J. Air suspension characterisation and effectiveness of a variable area orifice. Veh. Syst. Dyn. 2010, 48, 271–286. [Google Scholar] [CrossRef]


Publisher’s Note: MDPI stays neutral with regard to jurisdictional claims in published maps and institutional affiliations. |
© 2020 by the authors. Licensee MDPI, Basel, Switzerland. This article is an open access article distributed under the terms and conditions of the Creative Commons Attribution (CC BY) license (http://creativecommons.org/licenses/by/4.0/).