Article

Nickel Binding Affinity with Size-Fractioned Sediment Dissolved and Particulate Organic Matter and Correlation with Optical Indicators

1
Department of Environmental Science and Engineering, National Pingtung University of Science and Technology, Pingtung 91201, Taiwan
2
Department of Applied English, Tainan University of Technology, Tainan 71002, Taiwan
*
Author to whom correspondence should be addressed.
Appl. Sci. 2020, 10(24), 8995; https://doi.org/10.3390/app10248995
Submission received: 10 November 2020 / Revised: 11 December 2020 / Accepted: 13 December 2020 / Published: 16 December 2020
(This article belongs to the Section Environmental Sciences)

Abstract

:
In rivers, the distribution and reactivity of heavy metals (HMs) are affected by their binding affinity with sediment dissolved organic matter (DOM) and particulate organic matter (POM). The HM-OM binding affinity affected by the interaction between DOM and POM is not well studied. This study investigated the Ni binding affinity to size-fractioned overlaying water DOM and alkaline extracted sediment POM solution (AEOM). The DOM/AEOM filtrates (<0.45 μm) were sequentially separated into five nominal molecular weight (MW) solutions. The AEOM optical indicators had lower autochthonous, higher terrestrial sources, and lower aromaticity than the DOM. The Ni mass (72.3 ± 6.4%) was primarily distributed in the low molecular weight DOM (<1 kDa), whereas the Ni (93.5 ± 0.4%) and organic carbon (OC) mass (85.3 ± 1.0%) were predominantly distributed in the high molecular weight AEOM. The Ni and DOM binding affinity, ([Ni]/[DOC])DOM ratio ranging from 0.76 to 27.32 μmol/g-C, was significantly higher than the ([Ni]/[DOC])AEOM ratios, which ranged from 0.64 to 2.64 μmol/g-C. The ([Ni]/[DOC])AEOM ratio correlated significantly with the selected optical indicators (r = 0.87–0.92, p < 0.001), but the ([Ni]/[DOC])DOM ratio correlated weakly with the optical indicators (r = 0.13–0.40, p > 0.05). In the present study, the Ni binding affinity with size-fractioned DOM/AEOM agrees with the hypothesis of the DOM and POM exchange conceptual model in sediment. The POM underwent a hydrolysis/oxidation process; hence, AEOM had a high molecular weight and stable chemical composition and structure. The Ni mainly attached to the high molecular weight AEOM and the ([Ni]/[DOC])AEOM ratios had a strong correlation with the AEOM optical indicators. In contrast, DOM had a high ([Ni]/[DOC])DOM ratio in low molecular weight DOM.

1. Introduction

The sediment organic matter (SOM) includes particulate (POM) and dissolved (DOM) organic matter [1,2,3,4,5]. The distribution of heavy metals in DOM/POM affects heavy metals toxicity to microorganisms and the safety of ecology that has received extensive attention worldwide [6,7,8,9]. The binding affinity between heavy metals and organic matter is affected by the quality and quantity of organic matter, and the type and total concentration of metals [2,6].
Sediment POM and DOM is complex organic mixture; the constituents include monosaccharide, protein, humic acid, and humin [2,3]. The chemical composition and structure of SOM are affected by its sources and environmental processes such as the exchange of POM and DOM as well as biogeochemical processes in an anoxic condition [2,3,10]. Biochemical processes, such as hydrolysis and bio-oxidation, affect the exchange and chemical composition and structure of DOM and POM [2,5]. Moreover, the exchange of DOM and POM alter heavy metals distribution and affinity to DOM/POM [5,11].
Heavy metals bound to DOM/POM may decrease their reactivity and resistance in the environment [6,9,12,13,14]. The metal bound with various molecular weight OM can be used to understand the exchange process of DOM and POM. The [Me]/[DOC] ratios, μmol/g-C, have been used to understand the distribution, bioavailability, and transport potential of metals binding with DOM/POM. The high ratio suggests heavy metals strongly associate with organic matter [6,12,15,16,17].
In aquatic environments, [Ni]/[DOC] ratios showed significant variation with the values, which ranged from 1.6 to 344.1 μmol/g-C [12,13,18,19,20,21,22,23]. The metal and organic matter binding affinity has been affected by many factors such as wastewater treatment processes [18], DOM chemical composition and structure [6,15,16,17,22], DOM molecular weight [18,20,21] and an anthropogenic impact [12,17]. The OM chemical properties are particularly important factors that influence the metal–organic matter binding affinity [12,15,16,17,22].
A widely used analysis methods in previous and our research, the optical method, is a fast, sensitive, non-destructive method that examines OM chemical composition and structures [24,25,26,27,28,29]. Wastewater discharged from the food industry contains high levels and various compositions of organic matter [30,31]. In one study, the deposited POM underwent a biochemical process and the exchange between POM and DOM in an anoxic environment altered the distribution and binding behavior of organic matter and heavy metals [2,5]. In another studies, the wider range molecular weight of DOM and POM had different chemical compositions and structure as well as different metal binding affinities [6,21,22]. Therefore, the [Ni]/[DOC] ratios of size-fractioned DOM and POM are important to understand the Ni binding affinity affected by the chemical properties of DOM/POM as well as the metal distribution in size-fractioned DOM/POM [18,20,21,22].
This study investigated the Ni binding affinity with size-fractioned DOM and POM in the downstream sediment of a food industrial park. The detailed experimental procedures included: (1) Sediment was taken downstream from a food industrial park and separated into a liquid DOM (<0.45 μm) and particulate POM. (2) The POM was extracted with a NaOH solution, which filtrate (<0.45 μm) was designed as AEOM. (3) DOM and AEOM were sequentially separated into five different molecular weight solutions, which measured the DOC and Ni concentrations as well as UV-Vis and fluorescent spectra. (4) The Ni and organic carbon mass fractions and [Ni]/[DOC] ratios in fractioned DOM and AEOM were investigated, and the selected optical indicators were used to examine correlation with [Ni]/[DOC] ratios to find the dominate factors of Ni binding affinity to DOM/AEOM.

2. Methods and Materials

2.1. Sampling Site and Samples Collection

The sampling site (22°37′50.2″ N 120°32′12.1″ E) was downstream from a food industrial park in Pingtung County, Taiwan. The wastewaters from the individual manufacture were collected in a central wastewater treatment plant. The water quality in the effluent of the treatment plant wastewater agreed with the wastewater standard of the Taiwan Environmental Protection Administration (BOD < 30 mg/L, COD < 100 mg/L, and SS < 30 mg/L). The sampling location was about 1000 m downstream of the effluent outlet of the wastewater treatment plant. The samples were collected in triplicate in October 2016. The DOM and POM samples were collected from the surface sediment with a grab method. Five liter samples (including liquid and solid phases) were collected in each capture group. The samples were taken back to laboratory within 4 h. In the laboratory, sediment samples were centrifuged at 4500 rpm for 30 min. The liquid sample was filtered (<0.45μm) to collect the DOM sample and was stored at 4 °C for further separation. The solid phase was air dried for two weeks and then passed through a 2 mm sieve to collect the POM. The POM was stored in a 4 °C for further extraction.

2.2. AEOM Extraction and Separation

We followed Hur et al. [32] where bulk AEOM was extracted with an alkaline solution. Briefly, 5 g air dry sediment was added to 0.1 N NaOH 100 mL solution. The sediment suspension was shaken for 24 h and centrifuged at 4500 rpm for 30 min. Four-liter bulk AEOM and DOM solutions (<0.45 μm) were separated into the five molecular weight AEOM and DOM fractions. A cross-flow ultrafiltration system sequence equipped with 10, 3, 1, and 0.3 kDa nominal molecular weight cutoff ceramic membrane cartridges (Filtanium, France) was used to separate the five molecular weight AEOM/DOM solutions: MW-A (10 kDa–0.45 μm), MW-B (3–10 kDa), MW-C (1–3 kDa), MW-D (0.3–1.0 kDa), and MW-E (<0.3 kDa). The feed flow rate was 1.7–2.0 L/min. In the concentration process, the volume concentration factor (Cf) was kept at 10, the ratio of the sum volume of the retentate and permeate to retentate volume. In each separation process, the retentate flow was sent back to the feed flow container and the permeate flow was collected in another container. The mass balances (R%) of the DOC and Ni were calculated by Equation (1). The mass percentages (Mi) of organic carbon and Ni in each fractioned DOM/POM were calculated following Equation (2).
R % = C i × C i C b u l k × V b u l k × 100
M i % = C i × V i C i × V i × 100
where R(%) is percentage of mass balances for DOC, and Ni. Mi(%) is mass percentages for individual size-fractioned DOC and Ni. Ci and Vi were the concentrations and volumes for each size-fraction in the separation processes for DOC and Ni. The volume ratios for the study were 1.0, 0.1, 0.09, 0.081, 0.0729, and 0.6561 for bulk and the five size-fractioned solutions: MW-A, MW-B, MW-C, MW-D, and MW-E, respectively. In the separated process the membranes were carefully cleaned following the suggestion by the manufacture.

2.3. UV/Vis and Fluorescent Measurement

When the UV-Vis and fluorescent spectra were measured, the bulk and fractioned AEOM and DOM solutions were diluted to 5.0 and 1.0 mg-C/L, respectively, with ultrapure water. The absorbance was measured with an ultraviolet/visible spectrophotometer (Hitachi, U-2900) and fluorescence spectra were recorded on a fluorescence spectrometer (Hitachi F-7000). The absorbance at 700–800 nm was set as the background value. The absorbance of the sample was subtracted from the average of the absorbance at 700–800 nm per Helms et al. [33]. The UV-Vis spectrophotometric scanning wavelength was 800–200 nm. The excitation/emission matrixes (EEMs) were generated by recording emission spectra from 250 to 550 nm at 2.0 nm steps for an excitation wavelength between 200 and 450 nm at 5 nm increments. The scanning rate was 2400 nm/min. The value of the blank sample was subtracted from the sample fluorescent data.

2.4. Optical Indicator

Three widely used optical indicators were selected to qualify and quantify the chemical properties of bulk and fractioned DOM/AEOM. SUVA254 (L/mg-C/m) was the absorption coefficient (cm−1) at 254 nm divided by DOC concentration (mg-C/L) times 100 following Weishaar et al. [34]; Matilainen et al. [27]. The fluorescence index (FI) was calculated as the intensity ratio of emission at 450 nm over 500 nm with an excitation at 370 nm per Hansen et al. [24]; Birdwell and Engel [28]; Derrien et al. [25]. The Biological index (BIX) was calculated as the intensity ratio at emission wavelength 380 nm over 430 nm with an excitation of 310 nm as was done by Huguet et al. [29]; Birdwell and Engel [28]. Nickle binding affinity to DOM/AEOM was calculated as the Ni concentration divided by DOC concentration ([Ni]/[DOC], μmol/g-C) per Baken et al. [12]; Kikuchi et al. [17]; Hsieh et al. [22].

2.5. Statistical Analysis

In this study, linear correlation, and the difference tests used the S-Plus software (V 6.2) at significance levels at p < 0.05. Two group difference tests between AEOM and DOM (such as concentration, mass fraction, [Ni]/[DOC] ratio, and optical indicators) were used in the t-test method. The three group difference tests used the ANOVA test method such as fraction difference of mass fractions, [Ni]/[DOC] ratios, and optical indicators for DOM/AEOM. Fluorescence indicators were calculated at R script as developed by Lapworth and Kinniburgh [35].

3. Results and Discussion

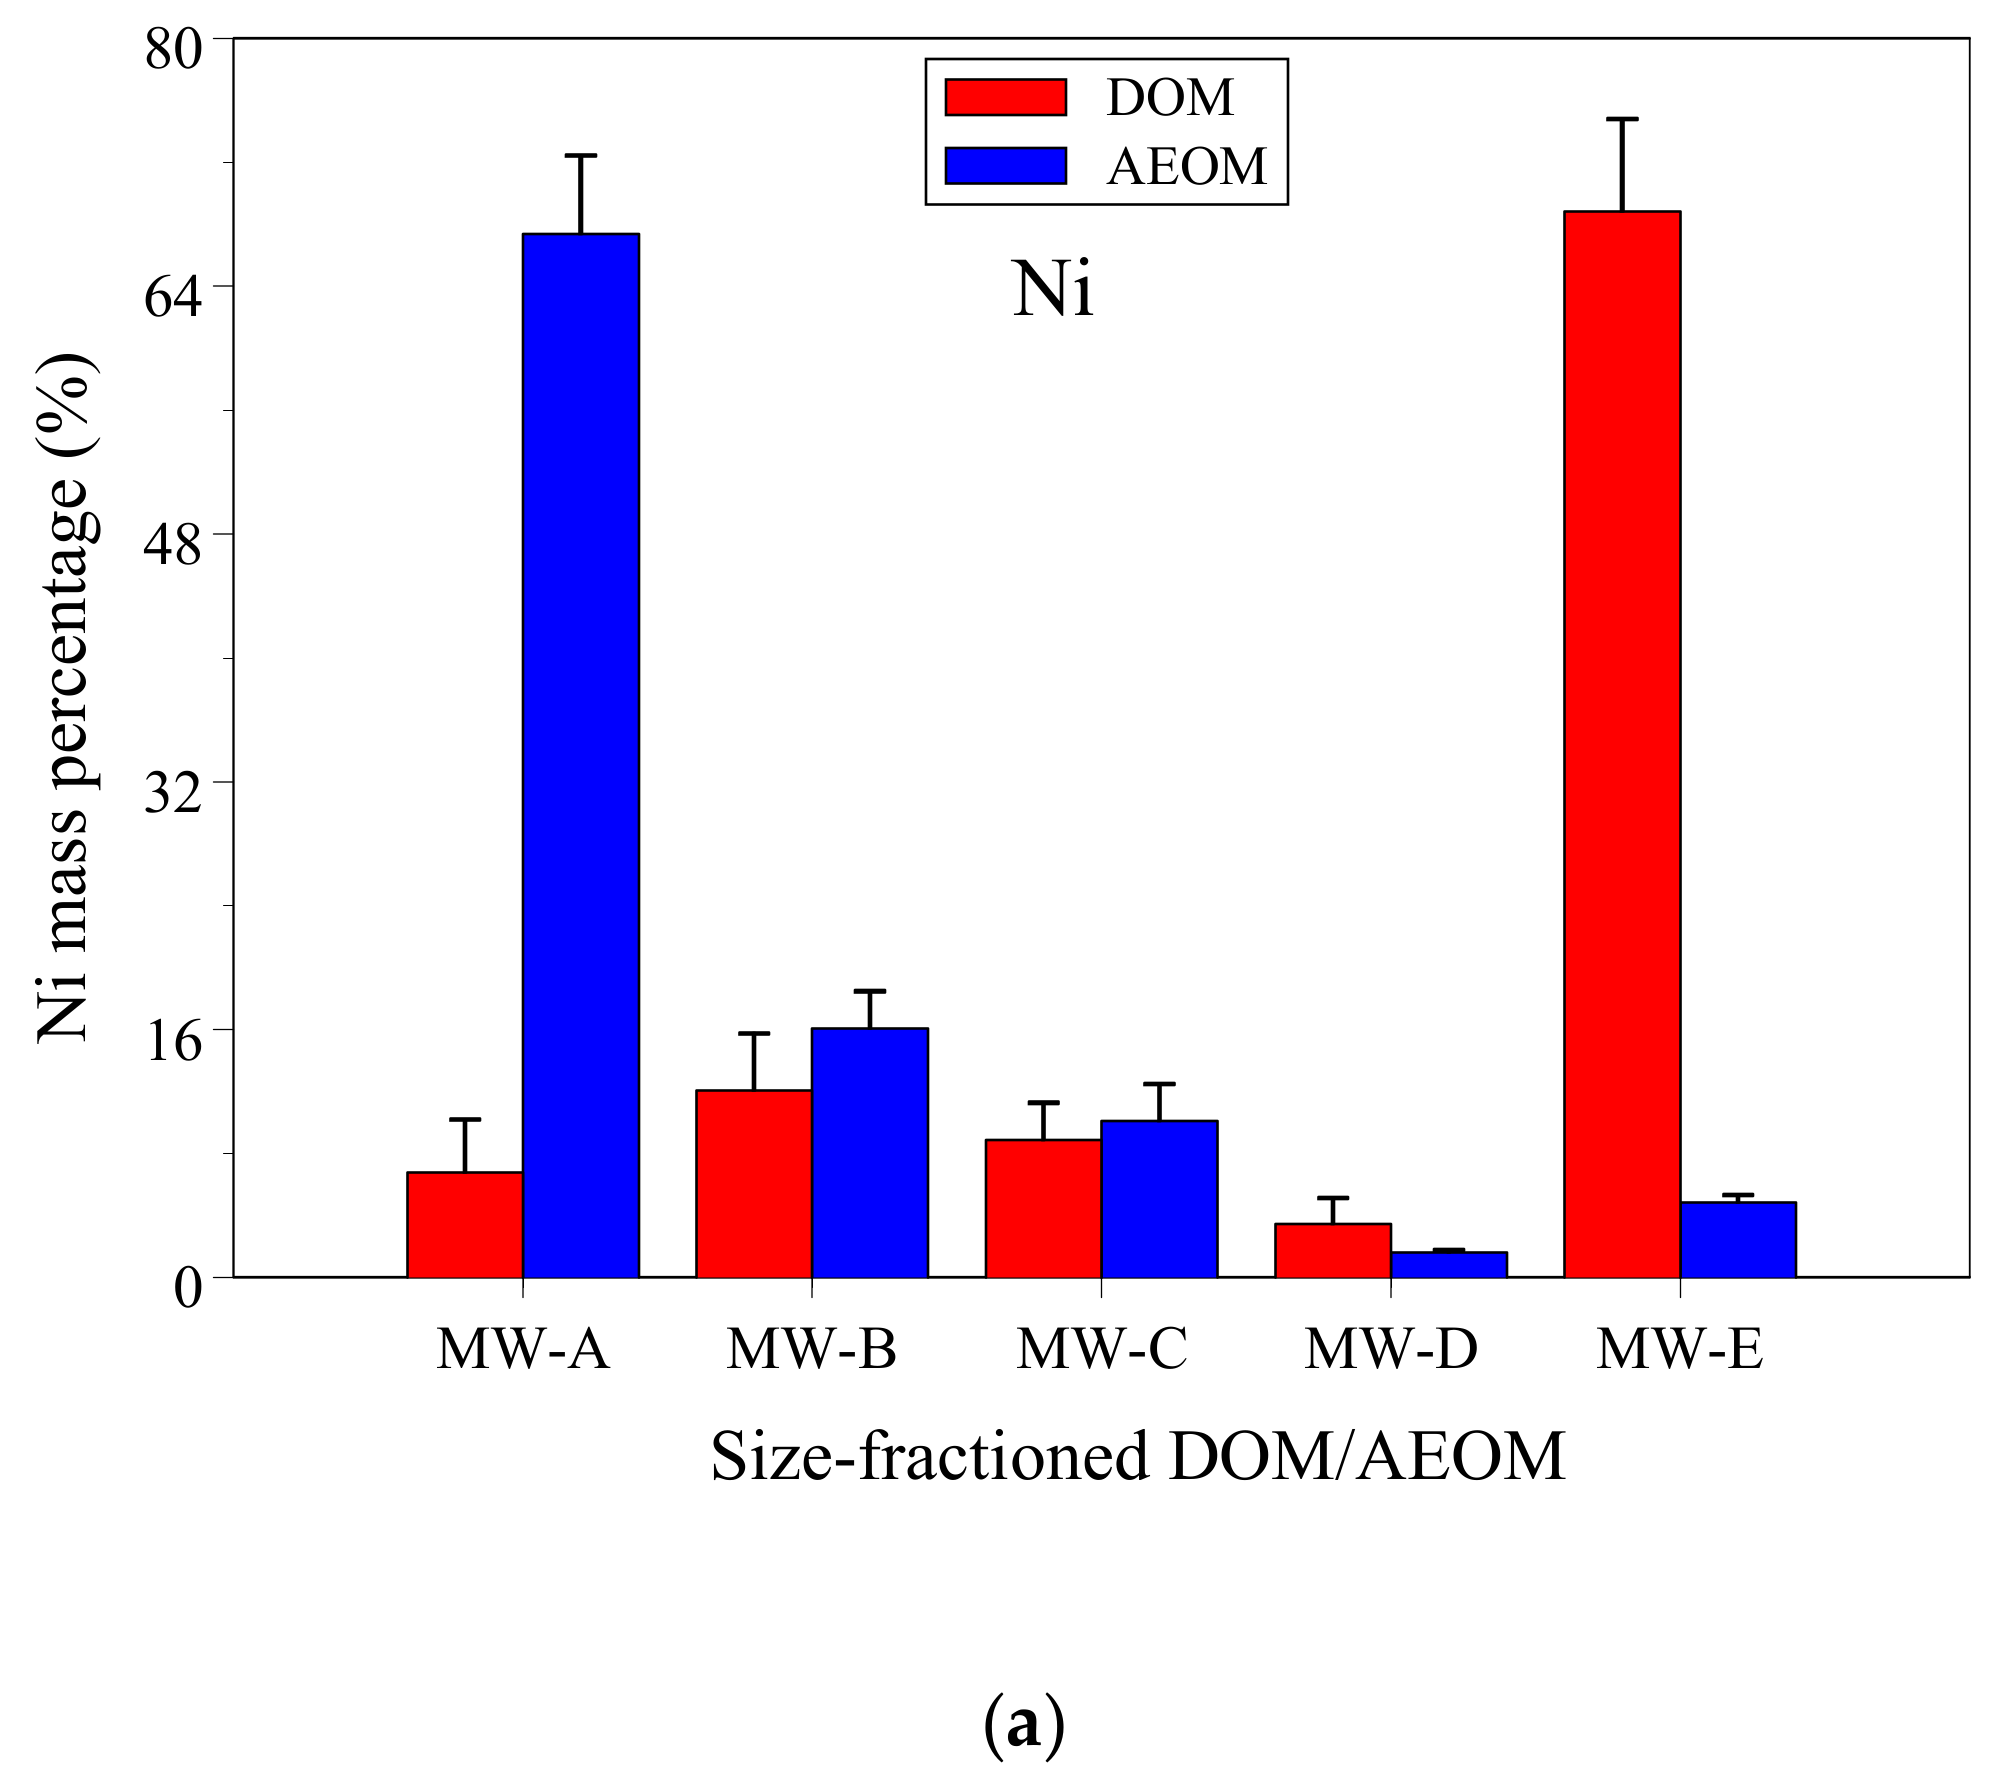
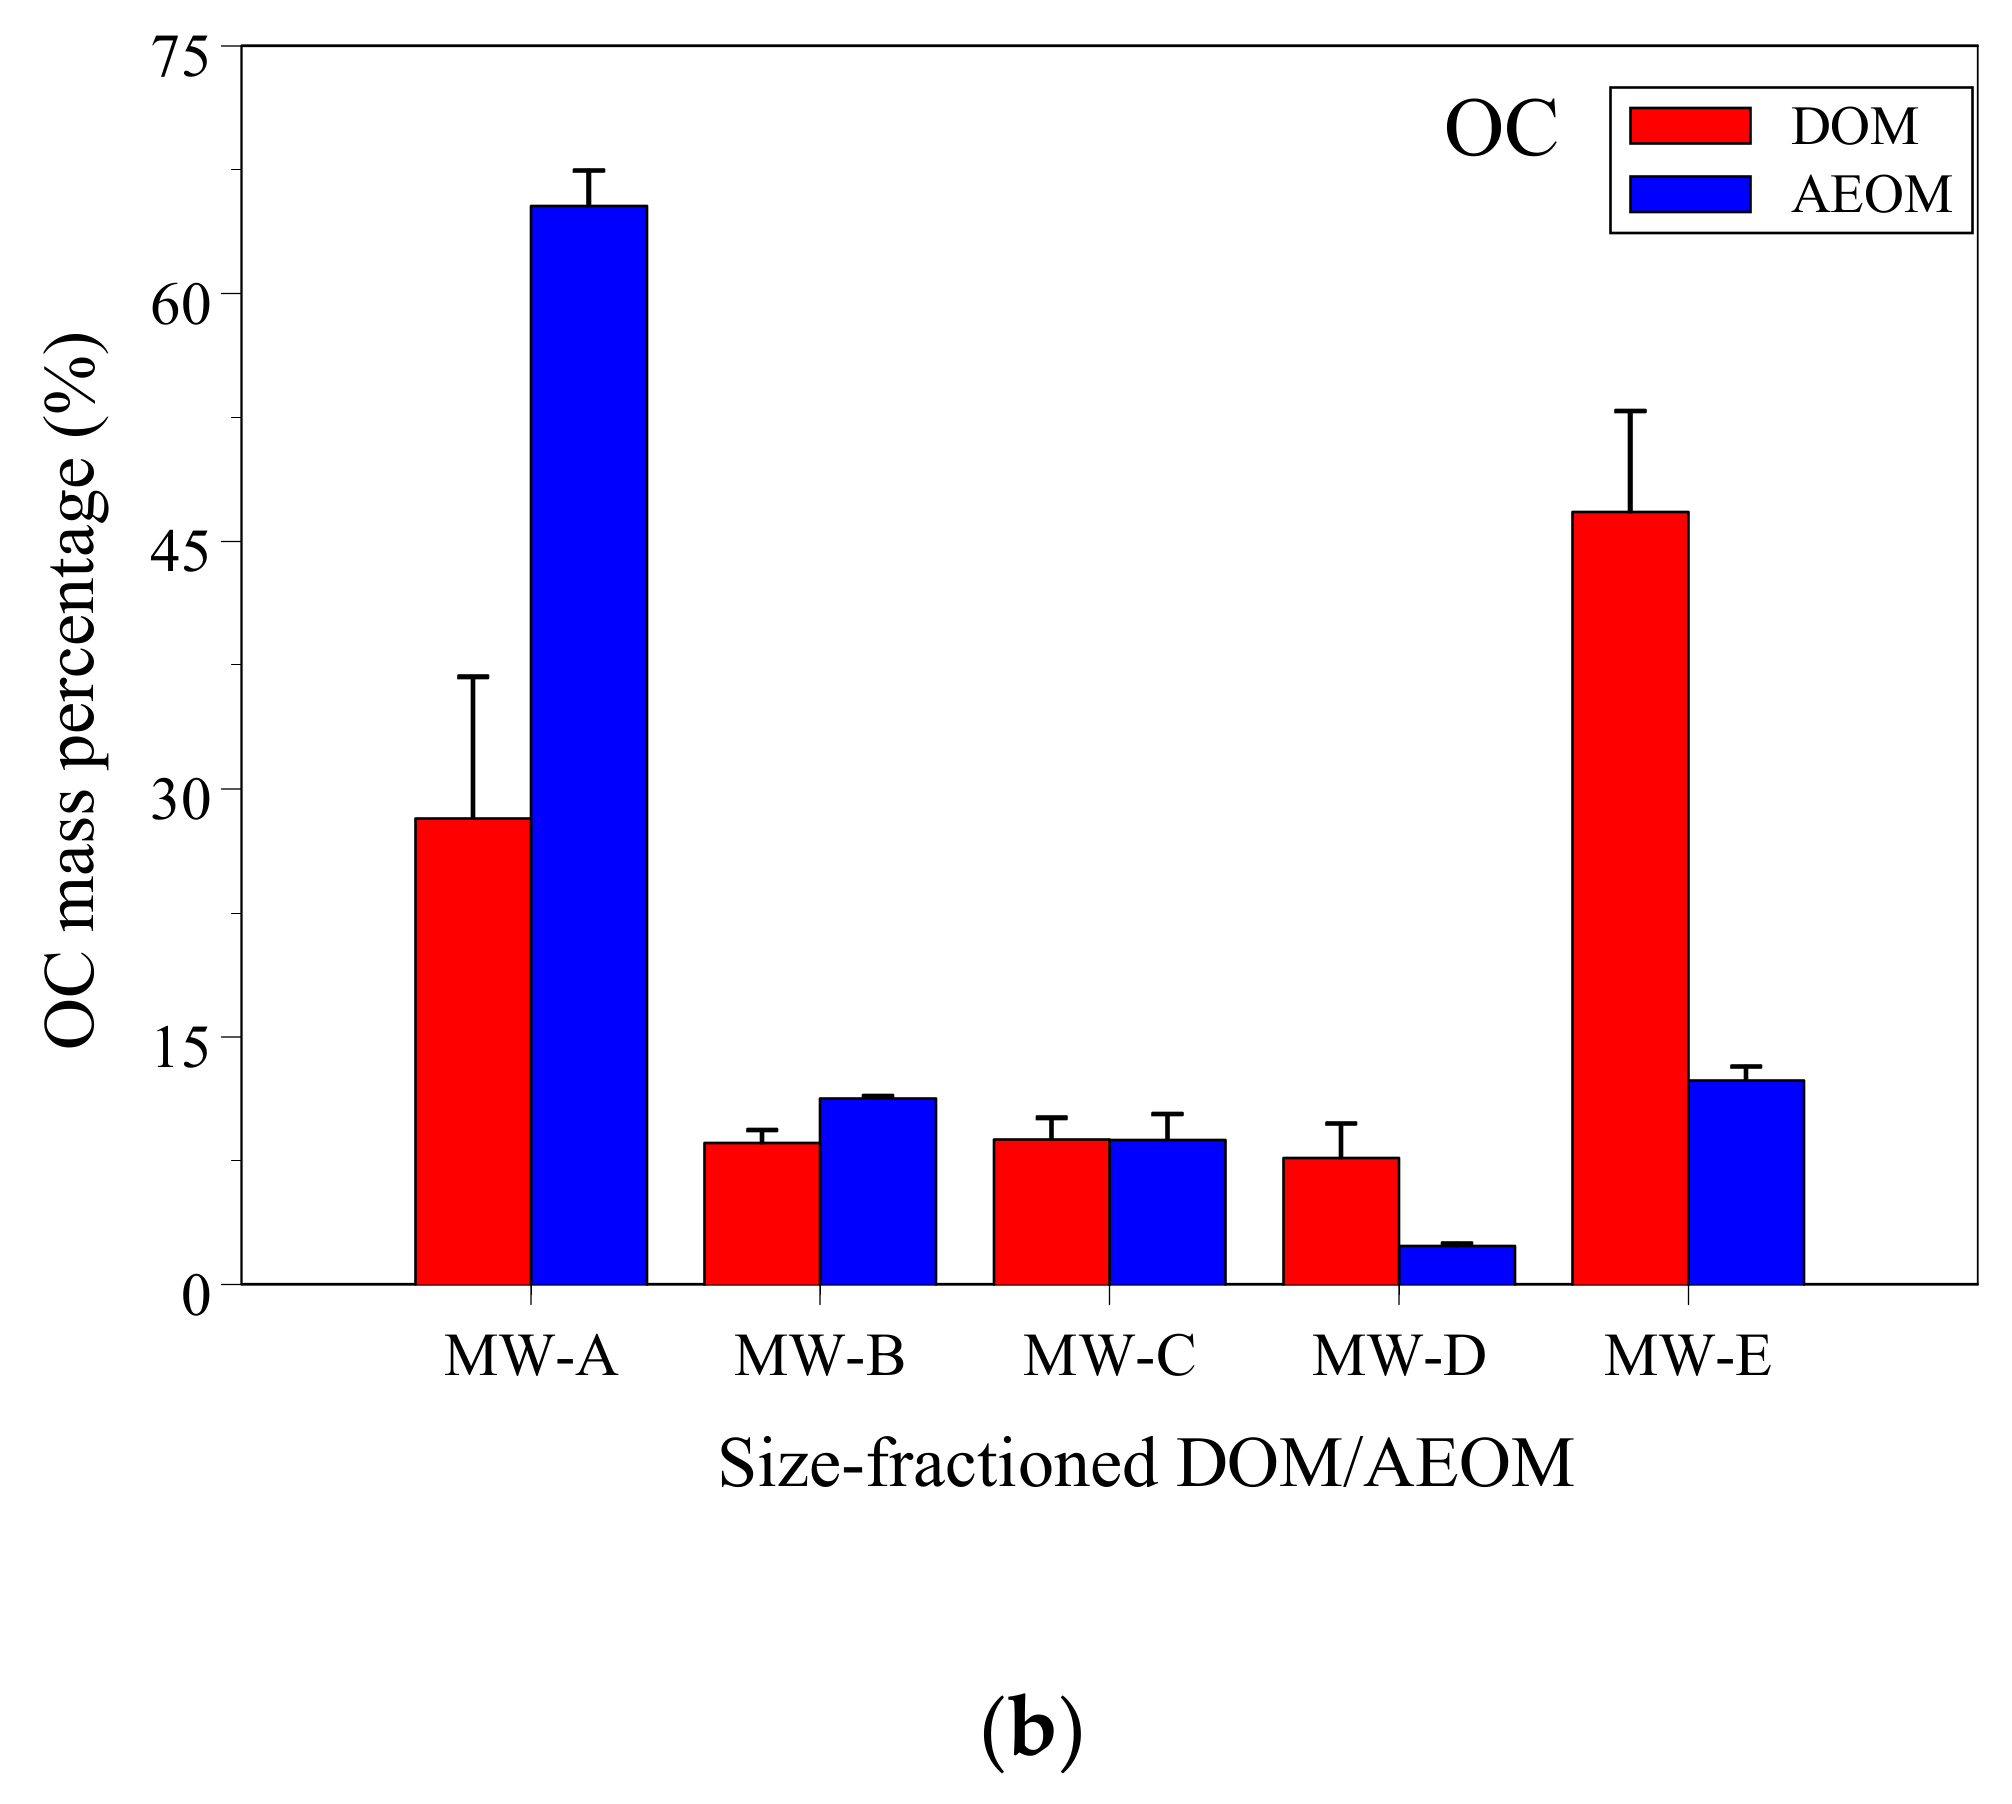
3.1. DOC and Ni Concentrations and Mass Fractions in DOM and AEOM

DOC concentration represents the abundances of dissolved organic matter [3,36]. The mass fractions of Ni and DOC in size-fractioned DOM and AEOM were important to understand the Ni and DOC distribution between DOM and POM. Table 1 lists DOC and Ni concentrations of bulk and fractioned DOM and AEOM. In two other studies, concentrations of DOC in bulk DOM were similar to river water, which ranged from 1.3 to 20 mg/L with an average of 6 mg/L for DOC [12] but lower than sediment pore water, which ranged from 15–28 mg/L [37].
In our research, bulk alkaline extracted organic carbon (AEOC) averaged 14.78 g-C/kg and total organic carbon was 73.1 g-C/kg based on sediment mass. The AEOC/TOC ratio was 20.2%. The AEOC content in present study was higher than water extracted sediment organic carbon, which averaged 226 and 828 mg-C/kg [38] and alkaline extracted organic carbon from sediment, which averaged 5.94 ± 0.56–6.40 ± 0.96 g-C/kg [39]. The AEOC/TOC ratios in this study were higher than the WEOC/TOC ratios extracted from soil reported by Hsieh et al. [22], and Xu et al. [38] and comparable to the AEOC/TOC ratio, which averaged 23.7% from sediment [39]. The high AEOC concentration in this study suggested the sediment contained highly extractable organic matter, which could be discharged from food wastewater.
The concentration of Ni in DOM was higher than river water and sediment pore water in other studies, which ranged from 1.05 to 7.52 μg/L [14,23,37,40]. In present study, the average Ni concentration of bulk AEOM was 1.70 mg/kg and the total Ni concentration averaged 33.0 mg/kg, based on the sediment mass. The AEOM-Ni accounted for 5.2% of the total Ni. The AEOM-Ni concentration in the present study was higher than the water and NaOH-extracted Ni concentrations 0.21–1.21 mg/kg from soil [19,22]. In addition, the ratio of AEOM-Ni/total Ni was higher than the ratio 1.07%, as reported by Hsieh et al. [22]. The ratio of extracted organic carbon was higher than the Ni ratio, which suggested the organic matter was more readily extracted by alkaline solution than the Ni.
The average mass balances ranged from 105 to 107% for OC and 91 to 111% for Ni in DOM/AEOM, which were within reasonable ranges (100 ± 25%, Dabrin et al. [37]). For example, Shi et al. [39] separated the sediment alkaline-extracted organic matter into three size-fractioned AEOM, 10 kDa–0.45 μm, 1–10 kDa, and <1 kDa, where the organic carbon mass balances were 92 ± 15% to 95 ± 8%. Hsieh et al. [22] separated 24 soil alkaline extracted solutions into 1 kDa–0.45 μm and <1 kDa fractions and the organic carbon mass balances were averaged 90 ± 26% and mass balances for Ni were averaged 83 ± 14%. Dabrin et al. [37] separated five-sediment pore water DOM into 5 kDa–0.45 μm and <5 kDa fractions and the Ni mass balances were 100–280%.
In Table 1, the DOC and Ni concentrations of size-fractioned DOM/AEOM were the measured concentrations. The mass fractions, in each fractioned DOM/AEOM, were calculated by Equation (2). Figure 1a,b shows DOC and Ni mass percentages of size-fractioned DOM/AEOM. In most of the separation studies, molecular weight 1 kDa was a common size to distinguish high and low molecular weight DOM/AEOM [21,22,38,39,41]. In the DOM solution, the Ni mass percentage (27.7 ± 6.4%) of high molecular weight DOM (HMW, >1 kDa) was significantly lower than the percentage (72.3 ± 6.4%) of low molecular weight DOM (LMW, < 1 kDa, p = 0.001). The HMW DOM organic carbon (OC) mass percentage (45.5 ± 6.7%) was insignificantly different to the LMW DOM OC percentage (54.5 ± 6.7%) (p = 0.18). In the AEOM solutions, the mass distribution of OC and Ni had similar patterns. The HMW AEOM mass percentages (85.3 ± 1.0% for OC and 93.5 ± 0.4% for Ni) were significantly higher than the LMW AEOM (p < 0.001). The results suggested that Ni preferred binding with LMW DOM, but Ni preferred binding to HMW AEOM. Moreover, AEOM had a high fraction of organic carbon.
The mass fractions of fractioned OC and heavy metal in DOM were varied, which depended on the DOM sources and type of heavy metals. In addition, when metal and OC are extracted from soil and sediment, the fractions may depend on the matrix, type of metal, extraction solvent, extraction method and solid/liquid ratio, and the separation method and conditions [41,42]. For example, in one study, Ilina et al. [43] size-fractioned soil solution, lake water, and river water, where the HMW Ni percentages were 83%, 55%, and 43%, respectively. In other studies, the HMW OC percentage was 44.1% for soil AEOM solution [22] and 81% for sediment AEOM solution [39]. In a municipal wastewater treatment plant study, Hargreaves et al. [21] reported the HMW fractions were 67–75% for Ni and 58% for OC.

3.2. [Ni]/[DOC] Ratio

The metal and organic matter binding affinity, [Me]/[DOC] ratio, has been used to understand the binding ability of metals to organic matter in the environment [12,15,16,17,18,20,21,22,23]. Figure 2 shows the [Ni]/[DOC] ratios in the fractioned AEOM and DOM solutions, in our study. The ([Ni]/[DOC])DOM ratio was significantly higher than ([Ni]/[DOC])AEOM (p < 0.001). The ([Ni]/[DOC])DOM ratios were higher than natural water DOM samples, which ranged from 1.6 ± 0.0 to 4.1 ± 1.5 μmol/g-C [12]. The ratios were comparable to those impacted by anthropogenically-influenced DOM samples, which ranged from 5.8 ± 1.3 to 14.7 ± 0.2 μmol/g-C [12]. The ([Ni]/[DOC])AEOM ratios were lower than the alkaline extracted soil solution 5.81 ± 2.38 μmol/g-C [22] and water extracted soil solution, which ranged from 11.3 to 75.4 μmol/g-C [19]. The low ([Ni]/[DOC])AEOM could be due to high organic carbon concentration extracted by alkaline solution and the chemical properties of AEOM, which had a low binding affinity with Ni.
The DOM fractioned <10 kDa had ([Ni]/[DOC])DOM ratios 13.16±7.18 μmol/g-C, which was significantly higher than ratios of fractioned DOM >10 kDa (3.26 ± 2.46 μmol/g-C, p = 0.003) (Figure 2). In the AEOM, the ratios had a different trend; the ([Ni]/[DOC])AEOM ratios of molecular weight <1 kDa (0.94 ± 0.34 μmol/g-C) were significantly lower than ratios of fraction >1 kDa (2.04 ± 0.33 μmol/g-C, p < 0.001).
Hargreaves et al. [21] reported that the different molecular weight DOM had different ([Ni]/[DOC])DOM ratios. The ([Ni]/[DOC])DOM ratios were 4.6 and 8.3 μmol/g-C for the LMW (<1 kDa) and HMW (1 kDa–0.45 μm) DOM, respectively in a WWTP final effluent. In 24 soil AEOM solutions, the HMW ([Ni]/[DOC])AEOM ratios 7.29 ± 2.27 μmol/g-C were significantly higher than the LMW ([Ni]/[DOC])AEOM ratios 4.22 ± 2.38 μmol/g-C [22]. In the present study, the ([Ni]/[DOC])DOM of molecular weight <10 kDa was significantly higher than molecular weight >10 kDa but LMW ([Ni]/[DOC])AEOM (<1 kDa) was significantly lower than HMW ([Ni]/[DOC])AEOM (>1 kDa). The ratio difference followed the different molecular weights in the present study, which may be caused by the exchange of POM and DOM in sediment.

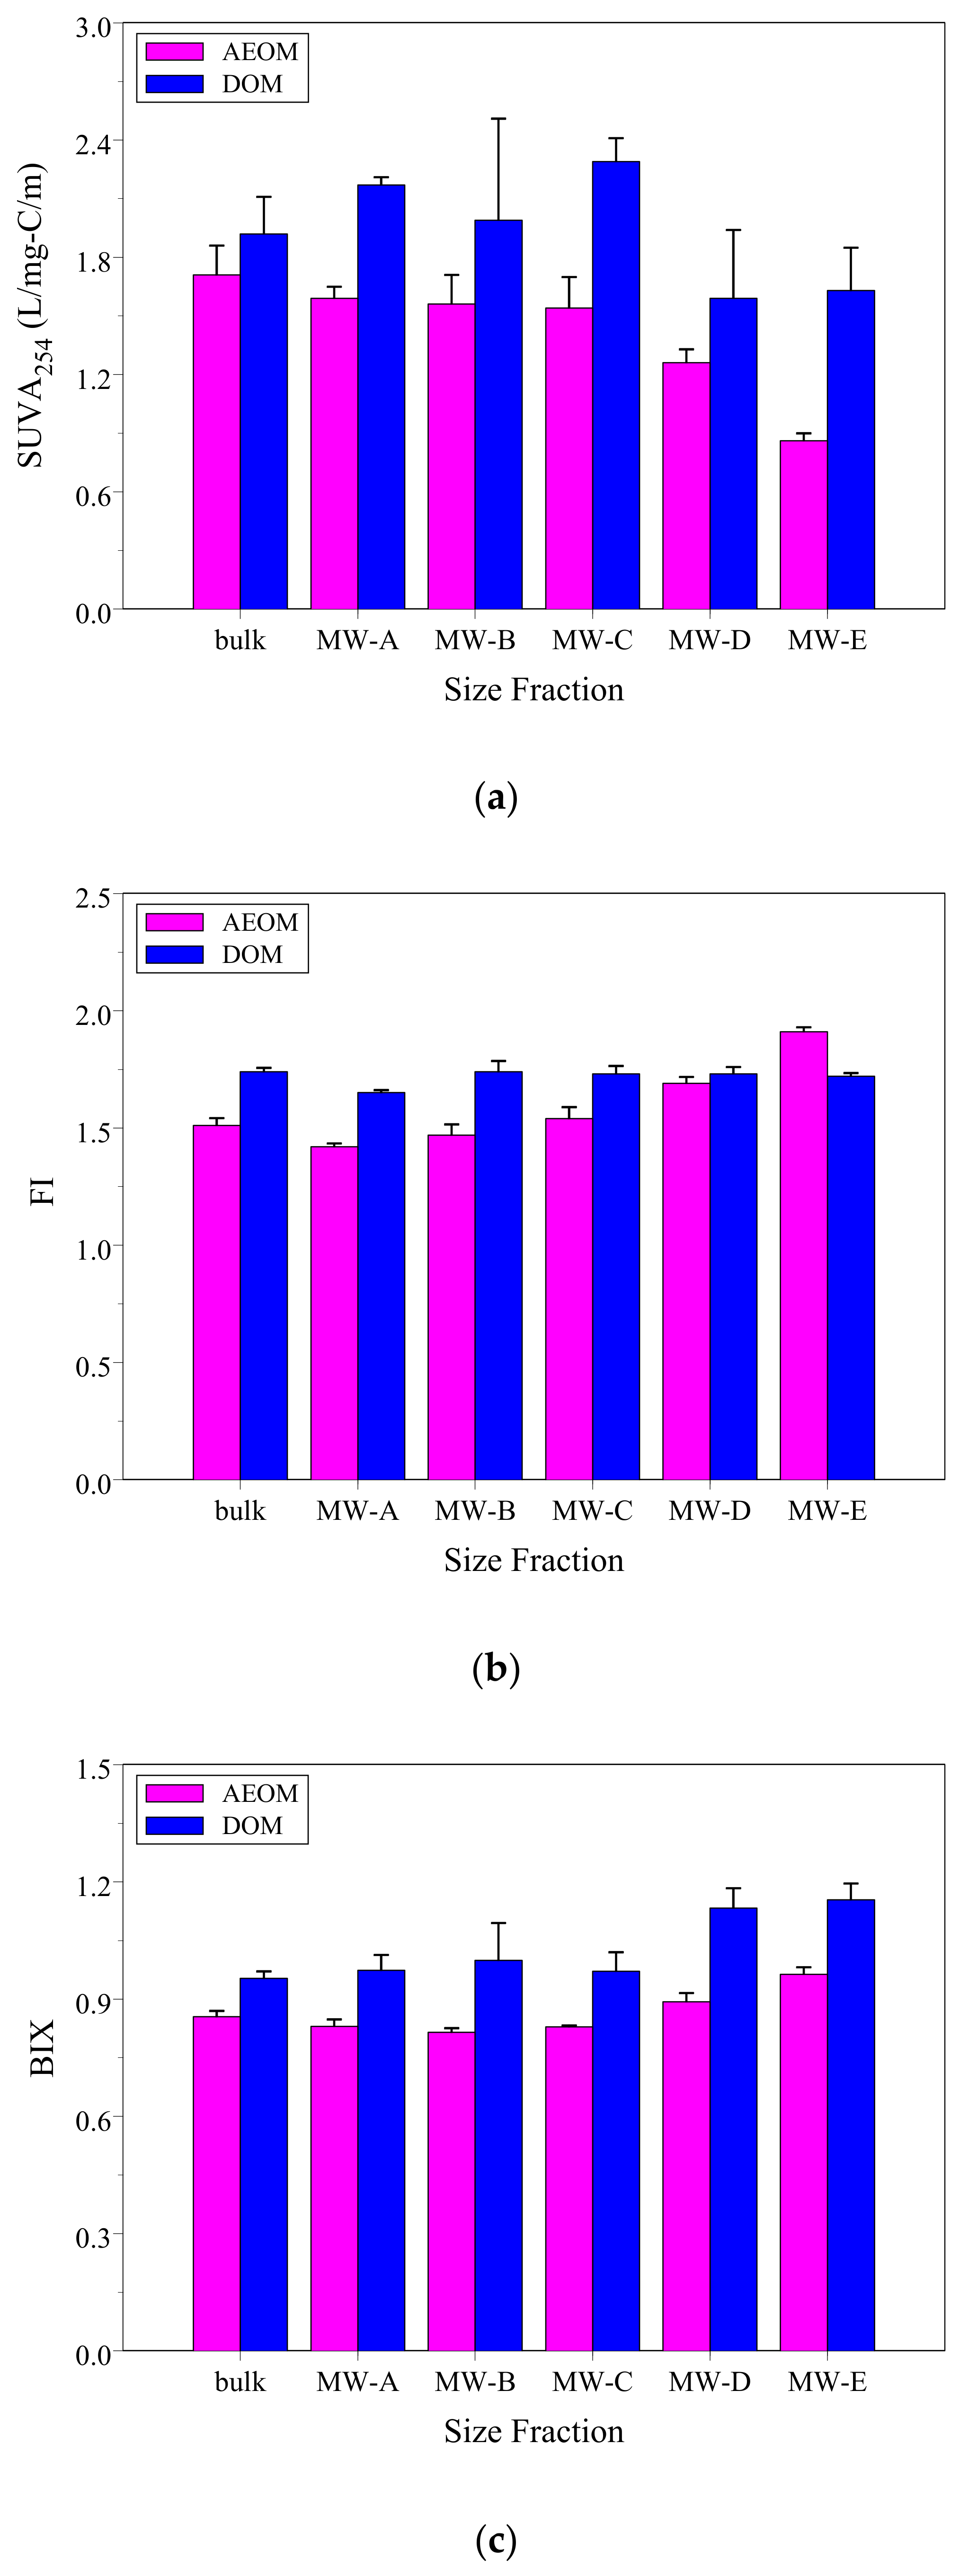
3.3. DOM and AEOM Optical Indicators

Figure 3a–c show the optical indicators of fractioned DOM and AEOM. SUVA254 is positively correlated with aromaticity, molecular weight, and hydrophobicity of DOM/AEOM [24,25,27,34]. SUVA254 values of AEOM was significantly lower than values of DOM (Figure 3a). SUVA254 values of HMW were significantly higher than the LMW DOM/AEOM, respectively. However, all SUVA254 values of DOM and AEOM were <3.0, which suggested that the chemical properties of DOM/AEOM attributed to the hydrophilic compounds and poor aromaticity [27].
FI is an indicator that describes the relative contribution of terrestrial and microbial sources to the DOM/AEOM pools [24,28]. Figure 3b shows the FI values of DOM/AEOM. The FI values of DOM/AEOM increased following the decreased molecular weight of fractioned DOM/AEOM. DOM FI values of MW-A (>10 kDa) were significantly lower than the LMW fractioned DOM (p = 0.02). The FI value of HMW AEOM (1.48 ± 0.06, >1 kDa) was significantly lower than the LMW AEOM (1.80 ± 0.12, p < 0.001). The low value of FI in the HMW AEOM may be generated by the lignin phenolic compounds when labile POM was hydrolyzed/oxidized [2,5].
BIX is an indicator used to assess the relative contribution of autochthonous DOM in water and soil samples [28,29]. Figure 3c shows BIX values with size-fractioned AEOM/DOM. The BIX values of total and bulk AEOM were significantly lower than the BIX values of DOM (p < 0.001). The AEOM autochthonous sources were lower than the DOM sources. BIX values of HMW AEOM/DOM were significantly lower than LMW AEOM/DOM, respectively (p = 0.001). Bulk AEOM contained median autochthonous sources but bulk DOM contained strong autochthonous sources. The high BIX value (>1.0) corresponded to recently produced DOM of autochthonous origin [29]. In our study, the BIX values of fractioned DOM ranged from 1.04 to 1.10, which indicated the DOM contained a strong autochthonous source [25,29].
In present study, the selected indicators suggested that AEOM had higher terrestrial and allochthonous sources than DOM. However, the aromaticity of DOM was higher than AEOM. Other work has shown that generally, the high terrestrial and low autochthonous sources have high aromaticity of DOM [10,44]. The low SUVA254 values in this study attributed to hydrophilic substances and poor aromatics. The hydrophilic substances may not fully develop the aromaticity in DOM and AEOM. In addition, the DOM had a complex composition where the three selected indicators had an insignificantly correlation with each other. Nevertheless, the POM underwent a hydrolysis/bioxidation process where the three selected indicators had a significant correlation with each other in AEOM (Table 2). The correlation suggested the extracted AEOM had more stable and uniform chemical properties.

3.4. Correlation between [Ni]/[DOC] Ratios and Optical Indicators

Table 3 shows the correlation coefficients between [Ni]/[DOC] ratios and selected indicators for AEOM and DOM solutions, respectively. The ratios of ([Ni]/[DOC])AEOM had a significant correlation with the indicators SUVA254, FI, and BIX (p < 0.001). However, ([Ni]/[DOC])DOM ratios had a weak correlation with the optical indicators. Baken et al. [12] studied natural and anthropogenically- influenced DOM water. The DOM tests demonstrated that the SUVA254 values of the natural water DOM had a significant positive correlation with the ratios of [Ni]/[DOC]; however, the anthropogenic-affected DOM SUVA254 values had no correlation with the [Ni]/[DOC] ratios. In the soil AEOM solutions [22], the LMW ([Ni]/[DOC])AEOM had a positive correlation with the SUVA254 values and molecular weight index (SR). The HMW ([Ni]/[DOC])AEOM was insignificantly correlated with the AEOM indicators due to complex composition of HMW AEOM.
The ratios of ([Ni]/[DOC])DOM were insignificantly correlated with the indicators, which implied a complex composition of DOM, with aromatic content (SUVA254); sources of DOM (FI and BIX) cannot predict the Ni and DOM binding affinity. The indicators had a strong correlation with ([Ni]/[DOC])AEOM ratios, which suggested the AEOM chemical properties have the potential to represent the binding affinity of Ni. One investigation showed that the exchange conceptual model assumed that the POM in the sediment underwent hydrolysis and oxidation cleavage started from low molecular weight POM [2,5]. The decomposed POM dissolved into the liquid phase becoming DOM. The exchange between DOM and POM in sediment may result in Ni and OC being distributed in the LMW fractions and the LMW DOM had high [Ni]/[DOC] ratios. The optical indicators were poor correlated with ([Ni]/[DOC])DOM ratios. However, the LMW POM had decomposed, which resulted in the Ni and OC being predominantly distributed in the HMW AEOM. The HMW AEOM had a higher [Ni]/[DOC] ratio than LMW AEOM. In addition, the hydrolyzed POM yield had stable chemical properties of AEOM solution. The optical indicators of AEOM had a strong correlation with each other as well as with the([Ni]/[DOC])AEOM ratios.

4. Conclusions

In this study, we studied OC and Ni distribution and Ni binding affinity on size-fractioned DOM/AEOM. The Ni and OC mass distribution in the DOM and AEOM was significantly different. The HMW AEOM had higher [Ni]/[DOC] ratios than the LMW AEOM, but the LWM DOM had higher ratios than the HMW DOM. The ([Ni]/[DOC])AEOM ratios had a significant correlation with the optical indicators, but the ([Ni]/[DOC])DOM ratios correlated weakly with the optical indicators. These results are in agreement with the exchange process between the DOM and POM in sediment. The present study suggests the exchange between the DOM and POM might play an essential role in understanding Ni and organic matter binding affinity in sediment.

Author Contributions

C.T.-C. and C.C.-W. conceived and designed the experiments; T.H.-C.; L.Y.-Y.; and H.W.-S. performed the experiments; T.H.-C.; L.Y.-Y.; and H.W.-S. analyzed the data; C.C.-W.; T.H.-C.; L.Y.-Y. and H.W.-S. contributed reagents/materials/analysis tools; C.T.-C., H.L.-F. and C.C.-W. wrote the paper. All authors have read and agreed to the published version of the manuscript.

Funding

This research received no external funding.

Conflicts of Interest

The authors declare no conflict of interest.

References

  1. Yu, Y.; Wan, Y.; Camara, A.Y.; Li, H. Effects of the addition and aging of humic acid-based amendments on the solubility of Cd in soil solution and its accumulation in rice. Chemosphere 2018, 196, 303–310. [Google Scholar] [CrossRef] [PubMed]
  2. He, W.; Chen, M.; Schlautman, M.A.; Hur, J. Dynamic exchanges between DOM and POM pools in coastal and inland aquatic ecosystems: A review. Sci. Total Environ. 2016, 551–552, 415–428. [Google Scholar] [CrossRef] [PubMed]
  3. Chen, M.; Hur, J. Pre-treatments, characteristics, and biogeochemical dynamics of dissolved organic matter in sediments: A review. Water Res. 2015, 79, 10–25. [Google Scholar] [CrossRef] [PubMed]
  4. Wang, Y.; Zhang, D.; Shen, Z.; Chen, J.; Feng, C. Characterization and spacial distribution variability of chromophoric dissolved organic matter (CDOM) in the Yangtze Estuary. Chemosphere 2014, 95, 353–362. [Google Scholar] [CrossRef]
  5. Burdige, D.J.; Komada, T. Sediment pore waters. In Biogeochemistry of Marine Dissolved Organic Matter, 2nd ed.; Chapter 12; Academic Press: Burlington, VT, USA, 2015; pp. 535–577. [Google Scholar]
  6. Aiken, G.R.; Hsu-Kim, H.; Ryan, J.N. Influence of Dissolved Organic Matter on the Environmental Fate of Metals, Nanoparticles, and Colloids. Environ. Sci. Technol. 2011, 45, 3196–3201. [Google Scholar] [CrossRef]
  7. Feng, C.; Guo, X.; Yin, S.; Tian, C.; Li, Y.; Shen, Z. Heavy metal partitioning of suspended particulate matter–water and sediment–water in the Yangtze Estuary. Chemosphere 2017, 185, 717–725. [Google Scholar] [CrossRef]
  8. Ahmed, I.A.; Hamilton–Taylor, J.; Bieroza, M.; Zhang, H.; Davison, W. Improving and testing geochemical speciation predictions of metal ions in natural waters. Water Res. 2014, 67, 276–291. [Google Scholar] [CrossRef]
  9. Xu, H.; Houghton, E.M.; Houghton, C.J.; Guo, L. Variations in size and composition of colloidal organic matter in a negative freshwater estuary. Sci. Total Environ. 2018, 615, 931–941. [Google Scholar] [CrossRef]
  10. Hur, J.; Lee, B.-M.; Shin, K.-H. Spectroscopic characterization of dissolved organic matter isolates from sediments and the association with phenanthrene binding affinity. Chemosphere 2014, 111, 450–457. [Google Scholar] [CrossRef]
  11. Jiang, T.; Bravo, A.G.; Skyllberg, U.; Björn, E.; Wang, D.; Yan, H.; Green, N.W. Influence of dissolved organic matter (DOM) characteristics on dissolved mercury (Hg) species composition in sediment porewater of lakes from southwest China. Water Res. 2018, 146, 146–158. [Google Scholar] [CrossRef]
  12. Baken, S.; Degryse, F.; Verheyen, L.; Merckx, R.; Smolders, E. Metal complexation properties of freshwater dissolved organic matter are explained by its aromaticity and by anthropogenic ligands. Environ. Sci. Technol. 2011, 45, 2584–2590. [Google Scholar] [CrossRef] [PubMed] [Green Version]
  13. Park, J.H.; Lee, J.H.; Kang, S.Y.; Kim, S.Y. Hydroclimatic controls on dissolved organic matter (DOM) characteristics and implications for trace metal transport in Hwangryong River Watershed, Korea, during a summer monsoon period. Hydrol. Process. Int. J. 2007, 21, 3025–3034. [Google Scholar] [CrossRef]
  14. Yan, M.; Ma, J.; Zhang, C.; Zhou, Y.; Liu, F.; Han, X.; Li, M.; Ni, J. Optical property of dissolved organic matters (DOMs) and its link to the presence of metal ions in surface freshwaters in China. Chemosphere 2017, 188, 502–509. [Google Scholar] [CrossRef] [PubMed]
  15. Amery, F.; Degryse, F.; Degeling, W.; Smolders, E.; Merckx, R. The copper-mobilizing-potential of dissolved organic matter in soils varies 10-fold depending on soil incubation and extraction procedures. Environ. Sci. Technol. 2007, 41, 2277–2281. [Google Scholar] [CrossRef]
  16. Amery, F.; Degryse, F.; Cheyns, K.; De Troyer, I.; Mertens, J.; Merckx, R.; Smolders, E. The UV-absorbance of dissolved organic matter predicts the fivefold variation in its affinity for mobilizing Cu in an agricultural soil horizon. Eur. J. Soil Sci. 2008, 59, 1087–1095. [Google Scholar] [CrossRef]
  17. Kikuchi, T.; Fujii, M.; Terao, K.; Jiwei, R.; Lee, Y.P.; Yoshimura, C. Correlations between aromaticity of dissolved organic matter and trace metal concentrations in natural and effluent waters: A case study in the Sagami River Basin, Japan. Sci. Total Environ. 2017, 576, 36–45. [Google Scholar] [CrossRef] [Green Version]
  18. Li, R.; Yue, D.; Liu, J.; Nie, Y. Size fractionation of organic matter and heavy metals in raw and treated leachate. Waste Manag. 2009, 29, 2527–2533. [Google Scholar] [CrossRef]
  19. Liu, X.; Zhang, S.; Wu, W.; Liu, H. Metal sorption on soils as affected by the dissolved organic matter in sewage sludge and the relative calculation of sewage sludge application. J. Hazard. Mater. 2007, 149, 399–407. [Google Scholar] [CrossRef]
  20. Chon, K.; Chon, K.; Cho, J. Characterization of size fractionated dissolved organic matter from river water and wastewater effluent using preparative high performance size exclusion chromatography. Org. Geochem. 2017, 103, 105–112. [Google Scholar] [CrossRef]
  21. Hargreaves, A.J.; Vale, P.; Whelan, J.; Constantino, C.; Dotro, G.; Campo, P.; Cartmell, E. Distribution of trace metals (Cu, Pb, Ni, Zn) between particulate, colloidal and truly dissolved fractions in wastewater treatment. Chemosphere 2017, 175, 239–246. [Google Scholar] [CrossRef]
  22. Hsieh, S.-H.; Chiu, T.-P.; Huang, W.-S.; Chen, T.-C.; Yeh, Y.-L. Cadmium (Cd) and Nickel (Ni) Distribution on Size-Fractioned Soil Humic Substance (SHS). Int. J. Environ. Res. Public Health 2019, 16, 3398. [Google Scholar] [CrossRef] [PubMed] [Green Version]
  23. Yi, Y.; Xiao, M.; Mostofa, K.M.; Xu, S.; Wang, Z. Spatial Variations of Trace Metals and Their Complexation Behavior with DOM in the Water of Dianchi Lake, China. Int. J. Environ. Res. Public Health 2019, 16, 4919. [Google Scholar] [CrossRef] [PubMed] [Green Version]
  24. Hansen, A.M.; Kraus, T.E.; Pellerin, B.A.; Fleck, J.A.; Downing, B.D.; Bergamaschi, B.A. Optical properties of dissolved organic matter (DOM): Effects of biological and photolytic degradation. Limnol. Oceanogr. 2016, 61, 1015–1032. [Google Scholar] [CrossRef] [Green Version]
  25. Derrien, M.; Yang, L.; Hur, J. Lipid biomarkers and spectroscopic indices for identifying organic matter sources in aquatic environments: A review. Water Res. 2017, 112, 58–71. [Google Scholar] [CrossRef]
  26. Li, P.; Hur, J. Utilization of UV-Vis spectroscopy and related data analyses for dissolved organic matter (DOM) studies: A review. Crit. Rev. Environ. Sci. Technol. 2017, 47, 131–154. [Google Scholar] [CrossRef]
  27. Matilainen, A.; Gjessing, E.T.; Lahtinen, T.; Hed, L.; Bhatnagar, A.; Sillanpää, M. An overview of the methods used in the characterisation of natural organic matter (NOM) in relation to drinking water treatment. Chemosphere 2011, 83, 1431–1442. [Google Scholar] [CrossRef]
  28. Birdwell, J.E.; Engel, A.S. Characterization of dissolved organic matter in cave and spring waters using UV–Vis absorbance and fluorescence spectroscopy. Org. Geochem. 2010, 41, 270–280. [Google Scholar] [CrossRef]
  29. Huguet, A.; Vacher, L.; Relexans, S.; Saubusse, S.; Froidefond, J.-M.; Parlanti, E. Properties of fluorescent dissolved organic matter in the Gironde Estuary. Org. Geochem. 2009, 40, 706–719. [Google Scholar] [CrossRef]
  30. Aderibigbe, D.O.; Giwa, A.-R.A.; Bello, I.A. Characterization and treatment of wastewater from food processing industry: A review. Imam J. Appl. Sci. 2017, 2, 27. [Google Scholar]
  31. Rajagopal, R.; Saady, N.M.C.; Torrijos, M.; Thanikal, J.V.; Hung, Y.-T. Sustainable agro-food industrial wastewater treatment using high rate anaerobic process. Water 2013, 5, 292–311. [Google Scholar] [CrossRef] [Green Version]
  32. Hur, J.; Lee, D.-H.; Shin, H.-S. Comparison of the structure, spectroscopic and phenanthrene binding characteristics of humic acids from soils and lake sediments. Org. Geochem. 2009, 40, 1091–1099. [Google Scholar] [CrossRef]
  33. Helms, J.R.; Stubbins, A.; Ritchie, J.D.; Minor, E.C.; Kieber, D.J.; Mopper, K. Absorption spectral slopes and slope ratios as indicators of molecular weight, source, and photobleaching of chromophoric dissolved organic matter. Limnol. Oceanogr. 2008, 53, 955–969. [Google Scholar] [CrossRef] [Green Version]
  34. Weishaar, J.L.; Aiken, G.R.; Bergamaschi, B.A.; Fram, M.S.; Fujii, R.; Mopper, K. Evaluation of specific ultraviolet absorbance as an indicator of the chemical composition and reactivity of dissolved organic carbon. Environ. Sci. Technol. 2003, 37, 4702–4708. [Google Scholar] [CrossRef] [PubMed]
  35. Lapworth, D.J.; Kinniburgh, D. An R script for visualising and analysing fluorescence excitation–emission matrices (EEMs). Comput. Geosci. 2009, 35, 2160–2163. [Google Scholar] [CrossRef] [Green Version]
  36. Her, N.; Amy, G.; McKnight, D.; Sohn, J.; Yoon, Y. Characterization of DOM as a function of MW by fluorescence EEM and HPLC-SEC using UVA, DOC, and fluorescence detection. Water Res. 2003, 37, 4295–4303. [Google Scholar] [CrossRef]
  37. Dabrin, A.; Roulier, J.-L.; Coquery, M. Colloidal and truly dissolved metal (oid) fractionation in sediment pore waters using tangential flow filtration. Appl. Geochem. 2013, 31, 25–34. [Google Scholar] [CrossRef]
  38. Xu, H.; Zou, L.; Guan, D.; Li, W.; Jiang, H. Molecular weight-dependent spectral and metal binding properties of sediment dissolved organic matter from different origins. Sci. Total Environ. 2019, 665, 828–835. [Google Scholar] [CrossRef]
  39. Shi, M.-S.; Huang, W.-S.; Hsu, L.-F.; Yeh, Y.-L.; Chen, T.-C. Fluorescence of Size-Fractioned Humic Substance Extracted from Sediment and Its Effect on the Sorption of Phenanthrene. Int. J. Environ. Res. Public Health 2019, 16, 5087. [Google Scholar] [CrossRef] [Green Version]
  40. Duc, T.A.; Loi, V.D.; Thao, T.T. Partition of heavy metals in a tropical river system impacted by municipal waste. Environ. Monit. Assess. 2013, 185, 1907–1925. [Google Scholar] [CrossRef]
  41. Wang, W.; Wen, B.; Zhang, S.; Shan, X.-Q. Distribution of heavy metals in water and soil solutions based on colloid-size fractionation. Int. J. Environ. Anal. Chem. 2003, 83, 357–365. [Google Scholar] [CrossRef]
  42. Wenming, X.; Zhang, S.; Lin, R.; Mingyue, Y.; Weiming, S.; Zhang, H.; Weihua, L. Evaluating soil dissolved organic matter extraction using three-dimensional excitation-emission matrix fluorescence spectroscopy. Pedosphere 2017, 27, 968–973. [Google Scholar]
  43. Ilina, S.M.; Lapitskiy, S.A.; Alekhin, Y.V.; Viers, J.; Benedetti, M.; Pokrovsky, O.S. Speciation, size fractionation and transport of trace elements in the continuum soil water–mire–humic lake–river–large oligotrophic lake of a Subarctic watershed. Aquat. Geochem. 2016, 22, 65–95. [Google Scholar] [CrossRef]
  44. Xu, H.; Yu, G.; Yang, L.; Jiang, H. Combination of two-dimensional correlation spectroscopy and parallel factor analysis to characterize the binding of heavy metals with DOM in lake sediments. J. Hazard. Mater. 2013, 263, 412–421. [Google Scholar] [CrossRef] [PubMed]
Figure 1. (a) Ni percentages for size-fractioned DOM/AEOM. (b) Organic carbon percentages for size-fractioned DOM/AEOM.
Applsci 10 08995 g001aApplsci 10 08995 g001b
Figure 2. [Ni]/[DOC] ratios with size-fractioned DOM and AEOM.
Applsci 10 08995 g002
Figure 3. Optical indicators of size-fractioned DOM and AEOM: SUVA254 (a), fluorescence index (FI) (b), and Biological index (BIX) (c).
Applsci 10 08995 g003
Table 1. The measured DOC and Ni concentrations for size-fractioned dissolved organic matter (DOM) and alkaline extracted sediment POM solution (AEOM) *.
SamplesDOMAEOM
DOC (mg/L)Ni (μg/L)DOC (mg/L)Ni (µg/L)
Bulk8.3 ± 0.4 a5.56 ± 2.16739 ± 3385 ± 7
MW-A24.8 ± 6.94.49 ± 3.775040 ± 231520 ± 82
MW-B8.4 ± 0.87.56 ± 1.75966 ± 3137 ± 12
MW-C9.6 ± 1.66.23 ± 1.49834 ± 14195 ± 19
MW-D9.3 ± 2.43.46 ± 3.44247 ± 1617 ± 3
MW-E6.3 ± 1.06.71 ± 3.96145 ± 96.0 ± 0.0
* Separation volume ratios for each size-fractioned solution are molecular weight (MW)-A (0.1), MW-B (0.09), MW-C (0.081), MW-D (0.0729), and MW-E (0.6561). a the standard deviation value for n = 3.
Table 2. Correlation coefficients of optical indicators for DOM/AEOM (right upper triangular for AEOM; left bottom triangular for DOM).
SUVA254FIBIX
SUVA254 −0.93 ***−0.85 ***
FI−0.41 0.92 ***
BIX−0.31−0.03
*** p < 0.001.
Table 3. Correlation coefficients between [Ni]/[DOC] ratios and optical indicators DOM and AEOM.
SamplesSUVA254FIBIX
[Ni]/[DOC]AEOM0.87 ***−0.87 ***−0.92 ***
[Ni]/[DOC]DOM−0.130.400.17
*** p < 0.001.
Publisher’s Note: MDPI stays neutral with regard to jurisdictional claims in published maps and institutional affiliations.

