1. Introduction
The arresting hook is a significant difference between the carrier-based aircraft and the land-based aircraft. Its main function is to hook the arresting cable after the aircraft enters the landing area on the aircraft carrier smoothly, transfer the arresting force to the fuselage, and force the aircraft to decelerate [
1]. Generally, the arresting hook firstly collides with the deck when the carrier aircraft lands, and the bounce in limited height occurs under the action of the arresting hook longitudinal damper [
2]. When the arresting hook collides with the deck, both the arresting hook assembly and its connection are in the working environment of dynamic impact load, and the loading form becomes very complex, which makes the load analysis of the arresting hook very difficult. In order to study and test the bounce height and impact load when the arresting hook collides with the deck in the landing process, it is necessary to conduct a comprehensive assessment of the collision dynamic performance of the arresting hook in the laboratory environment through the collision rebound test of the arresting hook.
The theoretical research on the collision dynamics of the arresting hook has been very mature. Thomlinson [
3] has made a detailed study on the movement of the arresting hook after hitting the deck in the symmetry plane. Assuming that the carrier aircraft is centering arrested with no eccentricity, the differential equation of motion is established by analyzing the trigonometric relationship among the aircraft, the deck, and the arresting hook. A report published by the National Engineering Corporation [
4] analyzes the collision of the arresting hook with the suspension support. On the basis of Thomlinson’s research, Gao [
5], Liu [
6,
7], Zhu [
8], Fan [
9], and others have improved the collision dynamics model of the arresting hook, making the model more accurate. However, the assumptions of these theoretical models are too ideal, which cannot reflect the actual situation of the aircraft landing. In order to obtain more accurate data, it is necessary to simulate the real landing conditions and test the dynamic performance of the collision of the arresting hook through the test method.
Due to the reasons of confidentiality, the relevant literature available is very limited, and there is no relevant report on the collision rebound test of the arresting hook. From the public research on the arresting hook, it is mostly about the actual measurement of the arresting load [
10,
11] or the fatigue life of the arresting hook [
12]. Yang [
13] carried out the actual measurement and research on the load of the arresting hook when the carrier aircraft stops landing on the ship; Chen [
14] designed a set of testing machine to simulate the interaction effect between the arresting hook and the deck coating when the carrier aircraft lands on the aircraft carrier, which is mainly used for testing the load in the process of impact. All of these researches focus on the load and do not test the dynamic characteristics of the collision such as bounce height and the bounce distance of the arresting hook.
In this paper, the collision and rebound dynamics test of the arresting hook of a certain type of carrier aircraft is carried out, and the landing condition is accurately simulated in the laboratory environment, and the validity of the test method is verified. In the test, the bounce height, the bounce distance, and the stroke of the arresting hook damper are measured, which provides a feasible method for the rebound test of other types of arresting hooks, and provides reliable test data for the research of the rebound dynamics and the design of the arresting hook.
2. Test Method for Collision Rebound of Arresting Hook
The collision rebound test of the arresting hook is a test of the collision dynamic performance in the laboratory environment. During the test, it is necessary to simulate the actual landing conditions, including landing attitude, landing gear cushioning performance, sinking velocity, horizontal velocity, and deck coating. In order to record the dynamic response of the arresting hook during the test, the collision rebound test of the arresting hook is carried out under the condition of the landing boundary.
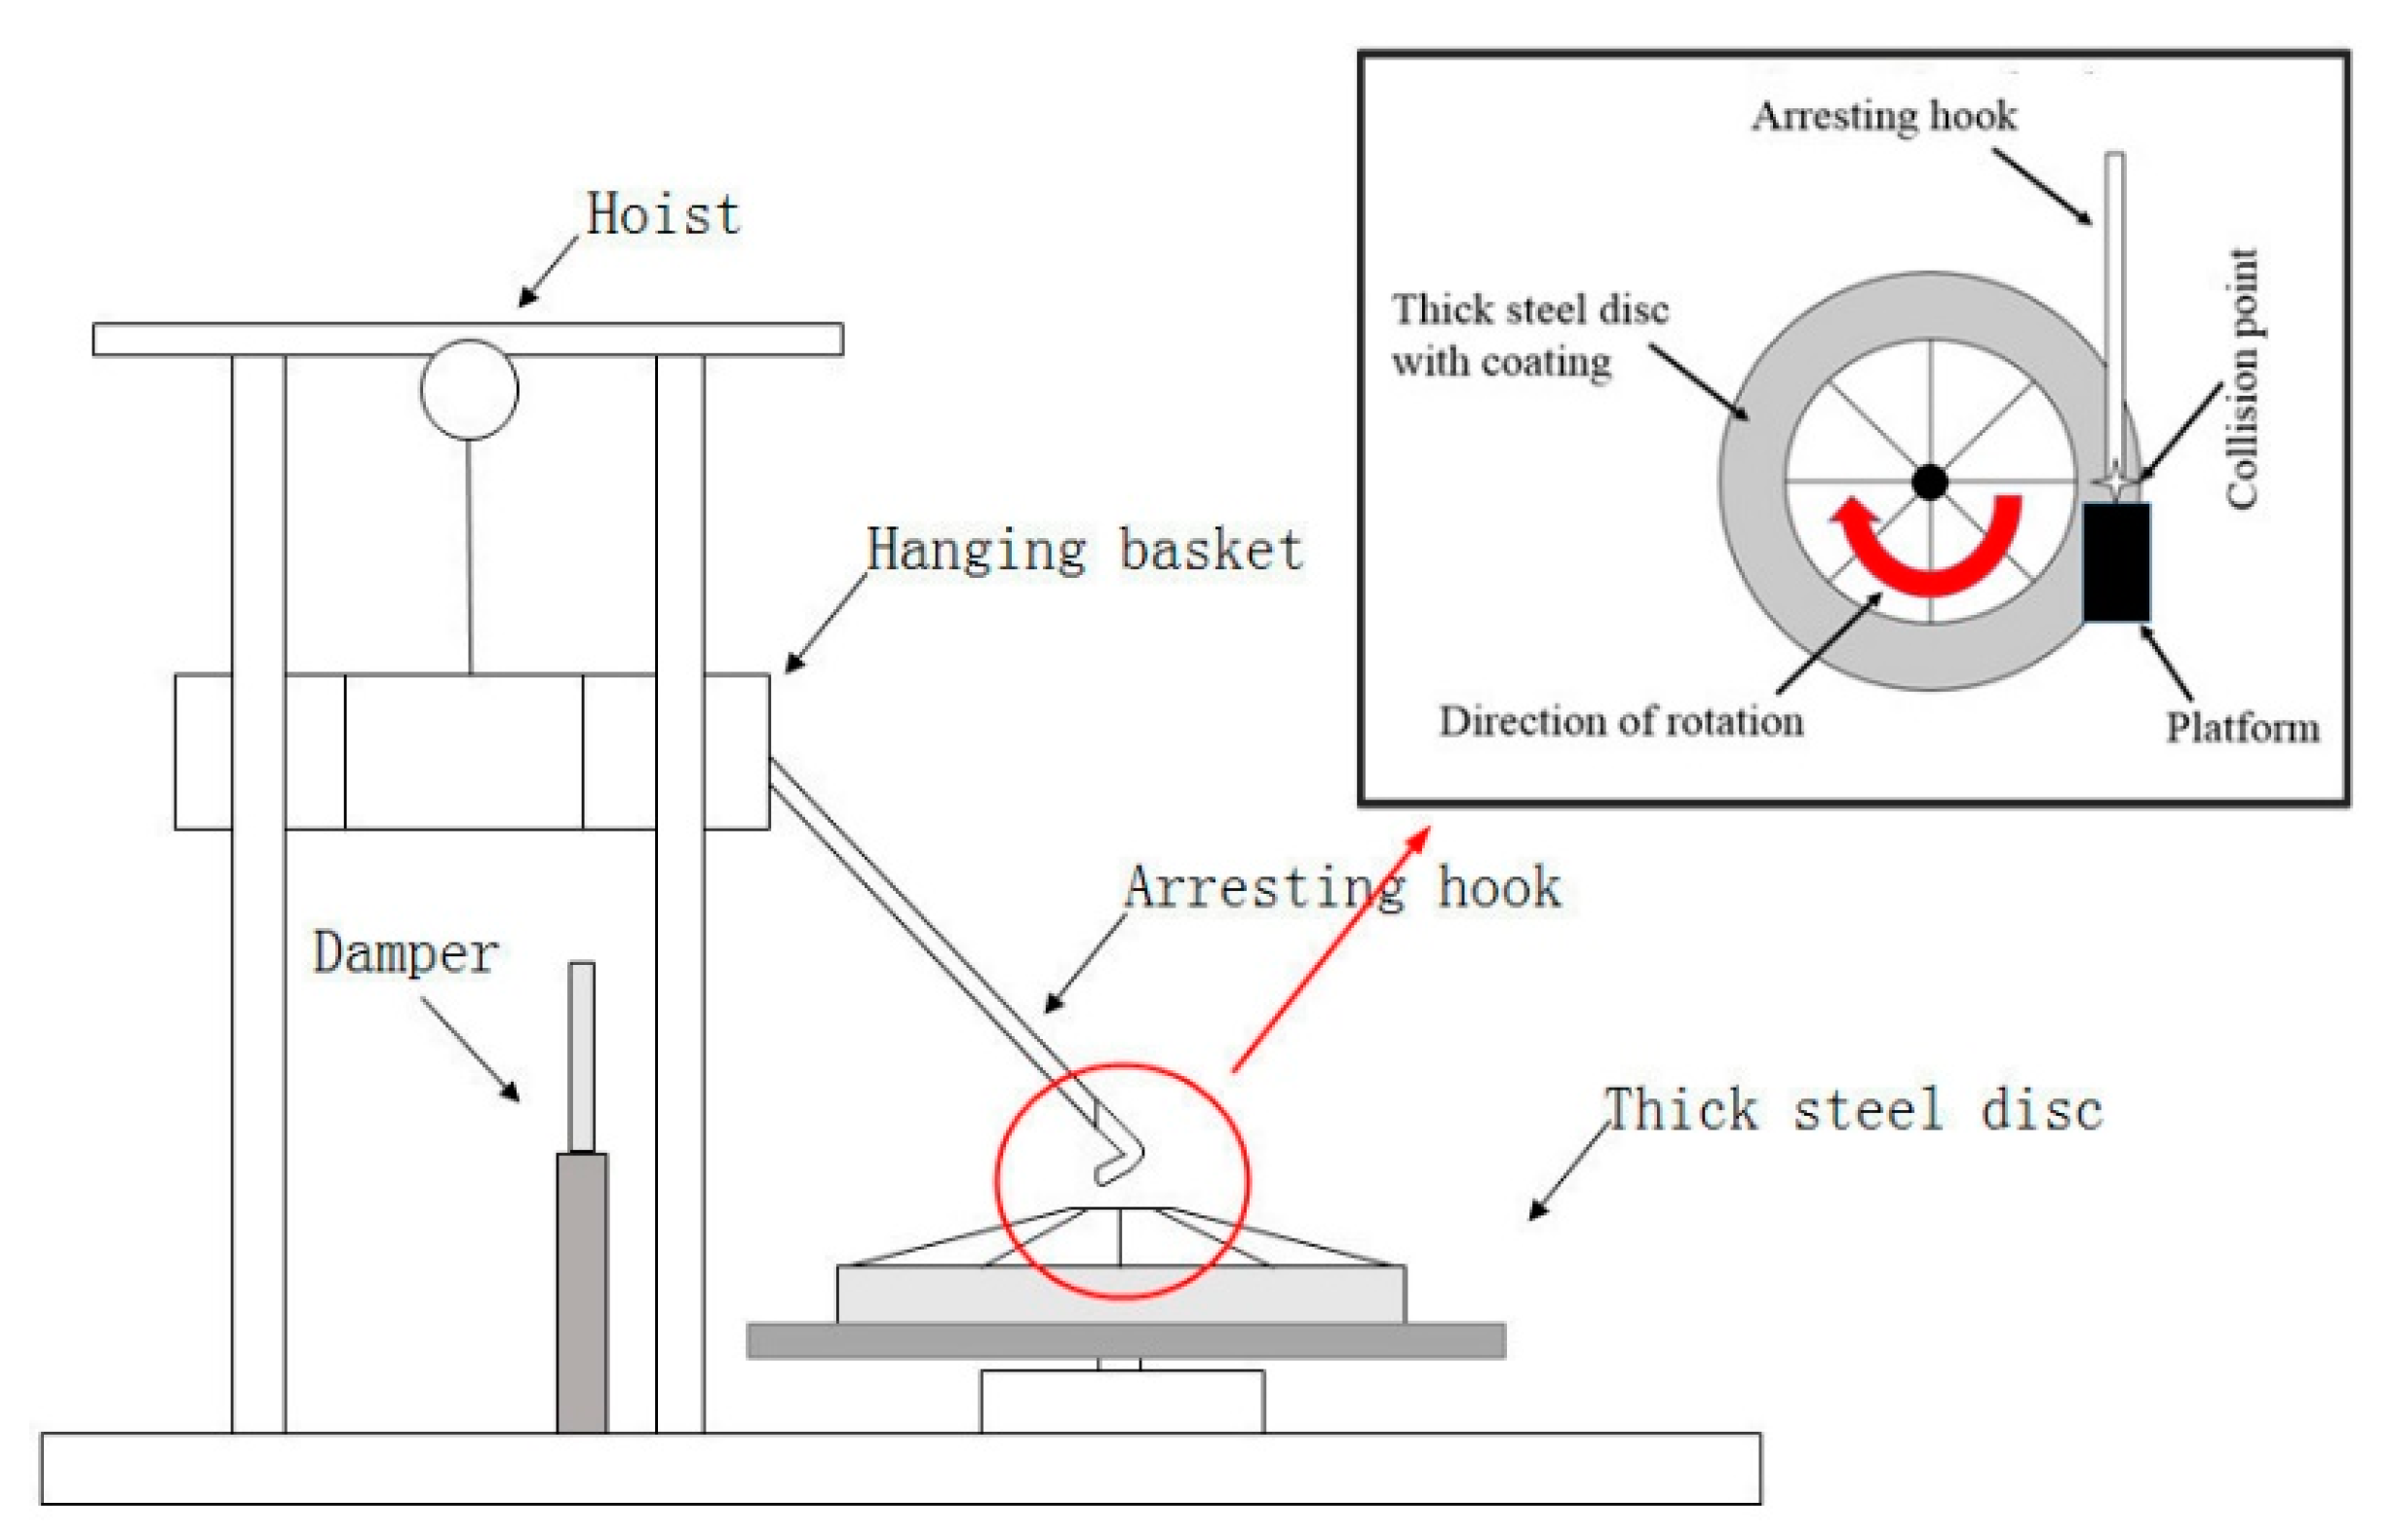
The collision and rebound test system of the arresting hook is refitted from the drop test system of the landing gear. The arresting hook is installed on the side of the basket, the buffer device is fixed on the ground below the basket, and the large disc used to simulate the deck of aircraft carrier is installed at the drop point of the arresting hook. In order to ensure that there is no lateral load when the arresting hook collides with the disc, the tangential velocity direction of the collision point is in the same line with the arresting hook, and the schematic diagram of the test system is shown in
Figure 1.
The construction principle of the test system is as follows:
1. In order to achieve the landing attitude required by the test, that is, to achieve the required deck angle of the arresting hook, the attitude of the disc is adjusted according to the relative motion principle;
2. The sink velocity of the aircraft is achieved by the fixed height of the basket. Before the test, the basket is raised to the predetermined height, so that the vertical velocity of the basket and the buffer when they contact is the same as the sinking velocity of the aircraft;
3. The landing horizontal velocity of the aircraft is achieved by the relative motion of the arresting hook head and the rotating collision disc. When the arresting hook head contacts the collision disc, the corresponding points on the collision disc move at high velocity, simulating the relative motion between the arresting hook and the aircraft carrier deck;
4. The buffer effect of the landing gear is simulated by the buffer system installed under the basket.
During the test, firstly check the state of the test piece to ensure that the balance of the whole basket remains level, and check the filling parameters of the arresting hook damper and the basket buffer device. Lift the basket to the specified height, confirm the height of the basket through the displacement sensor, start the aircraft horizontal velocity simulation device, rotate the large disc along the reverse direction of the aircraft, and confirm the rotation velocity of the disc through the rotation velocity sensor. When the rotation velocity of the disc reaches the predetermined value, the basket is released by the remote-control device which can release and lock repeatedly, and the arresting hook drops down with the basket to impact the disc. There is a platform in front of the impact point. After collision and rebound, the arresting hook jumps onto the platform to avoid repeated bouncing and colliding with the disc. A high-speed camera is used to observe the rebound process and record the test data.
3. Test Key Technology
3.1. Simulation of Cushioning Performance of Main Landing Gear
When the carrier-based aircraft lands, the arresting hook head usually touches the deck firstly, followed by the main landing gear tire. According to the dynamic simulation of the whole aircraft landing, the time gap between the contact of arresting hook, tires of main landing gear, and deck of aircraft carrier is in magnitude of 0.01 s, but no more than 0.1 s. Through the dynamic simulation of the carrier aircraft’s landing, the curve of bounce height of the arresting hook and the stroke curve of the main landing gear buffer are obtained, as shown in
Figure 2. It can be seen from the
Figure 2 that the main landing gear buffer starts to compress after the arresting hook touches the deck in about 0.035 s. The time of the first positive stroke of the main landing gear buffer is 0.18 s, while the process of the first bounce of the hook is 0.08 s, and the time of the second bounce is 0.115 s. In the process of the first bounce and the second bounce of the hook, the aircraft is moving with the compression of the main landing gear buffer. The involved movement of the arresting hook with the fuselage has a certain influence on the whole bounce process, which cannot be ignored.
In the collision rebound test system of the arresting hook, the buffer performance of the main landing gear is simulated by installing a buffer under the basket. The buffer mainly needs to meet two requirements: first, the time of the first positive stroke should be consistent with that of the main landing gear in the simulation results; second, the compression of the first positive stroke should be consistent with that of the main landing gear in the simulation results. In this way, it can be ensured that the trajectory of the collision rebound of the arresting hook obtained in the test is closer to the actual situation.
According to the total weight of the basket and the arresting hook, considering the friction and aerodynamic resistance when the basket falls freely, an oil–gas buffer is designed, which is installed under the basket to cushion the basket, and its internal structure is shown in
Figure 3.
Through the one-dimensional simulation platform Siemens LMS Imagine. Lab AMESim, the hydraulic system model of the buffer is established and the dynamic simulation of the basket falling is carried out. The simulation model is shown in
Figure 4. With the aid of simulation, the filling parameters of buffer are optimized, and the simulation results are verified and corrected by using the real basket drop test to determine the filling parameters used in the final test.
As the weight of the basket and the arresting hook is determined, the buffer performance is consistent with that of the main landing gear during landing by changing the filling of the buffer. The main performance indicators are the maximum buffer stroke and the time required for the first positive stroke. Carry out dynamic simulation on buffer performance, obtain a set of preliminary filling parameters, change the amount of filling oil and filling pressure of buffer, carry out multiple drop tests of the basket, and iteratively modify the filling parameters, so that its buffer performance is consistent with that of the main landing gear in the dynamic simulation of the whole aircraft landing at the same sinking velocity. The flow diagram of the determination of the damper filling is shown in
Figure 5.
3.2. Simulation of Aircraft Sinking Velocity
The sinking velocity of the carrier aircraft when it touches the deck directly affects the bounce height of the arresting hook and the impact load. In the laboratory environment, the sinking velocity of the aircraft is determined by the height of the test piece, and the calculation formula of the sinking velocity
is
where:
is the height of dropping,
is the weight of the basket and the arresting hook,
is the acceleration of gravity, and
is the resistance of the basket when it falls freely.
In the limited laboratory space, it is necessary to reduce the resistance when the basket falls as much as possible, to save the vertical space, and make the testable range of the sinking velocity wider. When the basket falls, the resistance mainly comes from the air resistance and the friction of the slide rail. The basket is designed as a truss structure to reduce the air resistance, and the polytetrafluoroethylene shaft sleeve is used to connect the basket and the slide rail to reduce the friction.
When landing, the arresting hook impacts the deck at a certain deck angle. During the test, the arresting hook also collides with the large disc at a certain angle. Therefore, the connection between the basket and the slide rail would be loaded in multiple directions. In this case, the linear rolling bearing with small friction cannot be used, and the friction coefficient of the metal shaft sleeve is relatively large, generally between 0.15 and 0.2. In the test, the polytetrafluoroethylene shaft sleeve is selected to connect the basket and the slide rail, and the friction coefficient is about 0.04 [
15], and the clearance matching is used to make the friction smaller.
Due to the effect of resistance, the sinking velocity would be reduced when the arresting hook collides. In order to ensure that the sinking velocity meets the requirements, the height of dropping must be increased. Taking the test condition of sinking velocity of 3.6 m/s in the test as an example, the theoretical value of dropping height is 0.66 m, and finally the dropping height is 0.75 m through several pretest iterations. Before the formal test, the drop height corresponding to different sinking velocity must be determined to meet the test sinking velocity requirements.
3.3. Simulation of Aircraft Horizontal Velocity
The landing horizontal velocity of the carrier-based aircraft is an important input parameter in the test. In the laboratory environment, the simulation of the landing horizontal velocity of the aircraft is realized by the relative motion principle [
16]. By using the rotating device, the large disc can be pre-rotated. The rotating direction is opposite to the aircraft heading, and the rotating velocity can be adjusted to control the horizontal velocity. The simulation scheme of horizontal velocity adopts the mode of motor driving with rotation, and the schematic diagram of the system with rotation is shown in
Figure 6. The asynchronous motor is fixed on the ground, the motor drives the driving wheel to rotate, the driven wheel connected with the large disc is pulled by the driving belt to realize the rotation of the large disc, and the aircraft horizontal velocity is adjusted by adjusting the motor velocity.
Inquire the mechanical design manual [
17], confirm that the transmission ratio of driving wheel and driven wheel is 2:1, and the conversion formula is
where
is the transmission ratio,
is the velocity of the driving wheel,
is the velocity of the belt wheel.
The schematic diagram of the control scheme of the rotating system is shown in
Figure 7. The rotating velocity of the large disc is monitored by the rotating velocity sensor and fed back to the main control computer. At the same time, the rotating velocity is displayed on the display screen. The main control computer controls the vector control converter to change the motor velocity. Due to the large mass, large volume, and large inertia of the large disc, the angular acceleration cannot be too large when the disc is rotating. It is controlled by the frequency converter to accelerate to the predetermined velocity within 2~3 min. At the same time, the emergency braking device needs to be installed.
The motor adopts asynchronous motor, and the motor velocity is controlled by frequency converter. The velocity of large disc is monitored by laser velocity sensor. The tangent velocity of the impact point of the large disc driven by the rotating device is adjusted within the range of 0 km/h~250 km/h, and the velocity control error is less than 2%.
3.4. Simulation of Collision and Bounce of Arresting Hook
The difficulty in the study of the collision dynamics of the arresting hook lies in the establishment of the collision model between the hook and the deck. Many scholars [
2,
8,
9] have made reasonable assumptions and improvements on the collision model, but have not acquired the relevant test data to verify the model. The accurate simulation of the deck is the basis of the accurate test of the collision dynamics performance of the arresting hook.
The simulation of the deck mainly includes the simulation of unevenness, stiffness, and roughness of the deck. The disc is cut from the whole steel disc without weld, with a thickness of 50 mm and unevenness of less than 5 mm/m. In order to improve the rigidity of the disc, eight stiffeners are added in the axial direction of the disc, with the axial height of the stiffeners as high as possible and the radial length as long as possible, as shown in
Figure 8.
The simulation of deck roughness is mainly through painting the real deck coating on the surface of the disc. The coating is resin-based anti-skid coating for aircraft carrier flight deck [
18], which is formed on the collision area of the disc by roll coating method, and its surface is even and smooth into wave shape [
19], which is consistent with the coating on the surface of aircraft carrier flight deck in terms of material, process, and using mode. The coating has the advantages of a short construction period, simple operation, and convenient maintenance. It can be repaired many times during the test period to ensure that the hook head collides with the disc with coating during each test and keep the consistency of the test environment.
In the process of landing, the head of the arresting hook may collide with the deck once or several times, and then the arresting hook hooks the cable and the aircraft decelerates to stop. Generally, there is only one collision rebound before the arresting hook hooks the cable. Therefore, relevant military standards and research work only focus on the first collision [
6,
7].
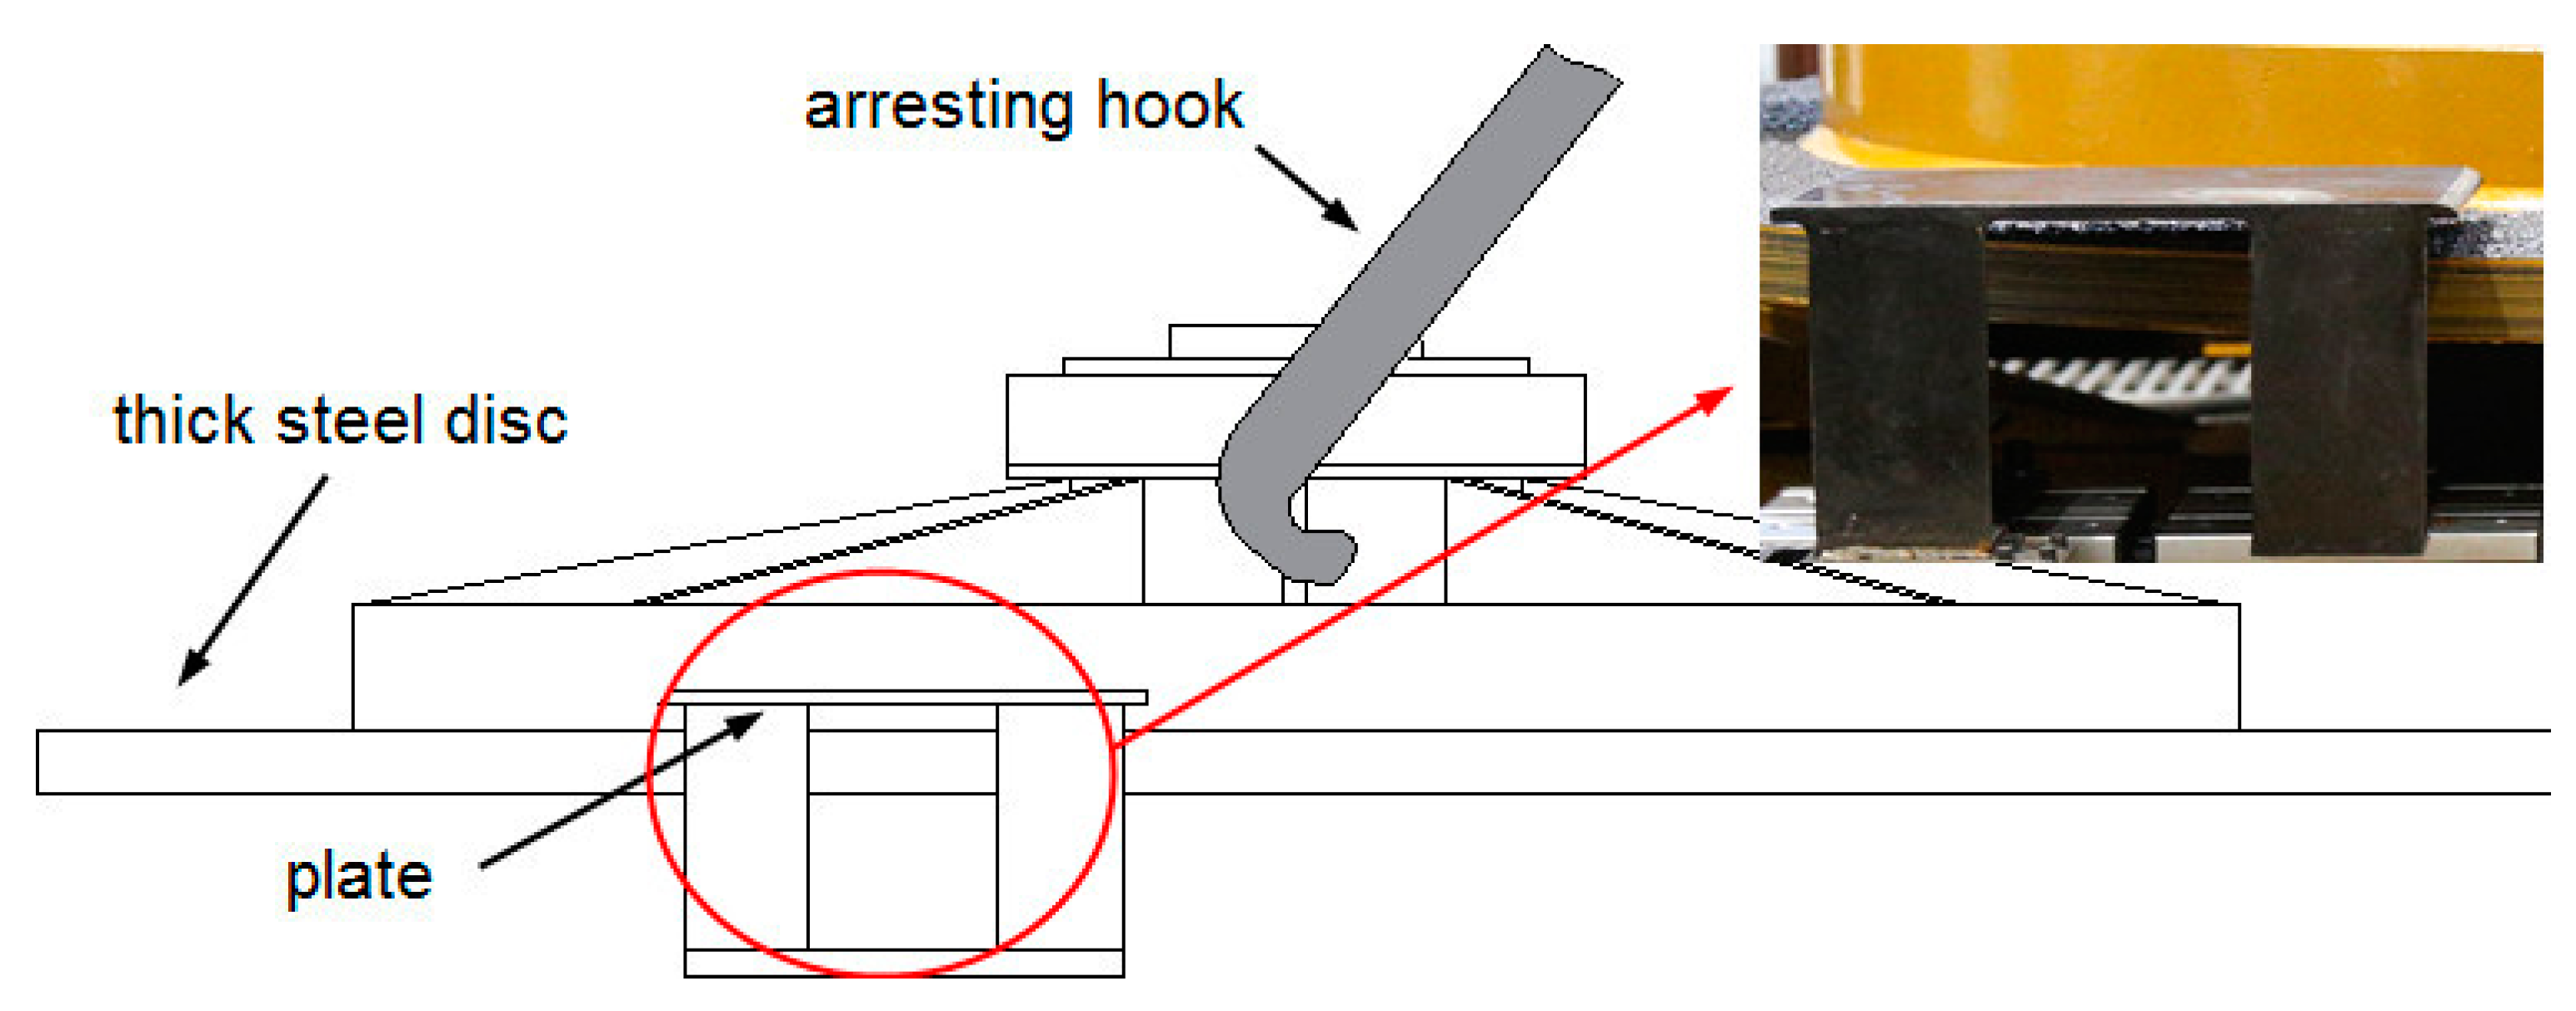
The research object of this paper is also the first collision between the head and the disc. In order to avoid the collision and friction between the head and the disc after the first collision, a platform is set in front of the collision point, which is close to the disc but does not contact, as shown in
Figure 9. After the collision of the hook head, it will bounce back to the platform and separate from the disc, avoiding the serious wear of the hook head and the damage of the coating.
3.5. Simulation of Cushioning Performance of Longitudinal Damper of Arresting Hook
In the test the longitudinal damper of arresting hook is used, and the rebound diagram of the arresting hook is shown in
Figure 10.
In the figure, is the hook, is the longitudinal buffer, is the hinge point of the two, , are connection points between the hook bar and the fuselage. The length and angle of each segment are shown in the figure, is the angle between the axis of the arresting hook and the vertical direction, is the angle between the line of hook bar and fuselage and the vertical direction. The length of is , and the length of is , and the length of is . is the cushioning force of longitudinal buffer acting on , and is the gravity of the arresting hook acting on centroid .
From the geometric relations in the graph, we can get the following conclusions:
where
is stroke of longitudinal damper,
is initial value of angle between arresting hook axis and vertical direction,
is angular velocity of arresting hook rotating with the center of
.
According to the theorem of moment of momentum, it can be concluded that
The principle of the longitudinal damper of the arresting hook is similar to that of the landing gear buffer. Here, it is a single buffer type, and its force
is mainly composed of air spring force and oil damping force. The internal structure of longitudinal buffer is shown in
Figure 11.
For single cavity buffer, the calculation formula of air spring force is
where
is the compressed air area,
is the initial filling pressure of the buffer,
is the initial inflation volume of the buffer,
is the gas polytropic index,
is the local atmospheric pressure,
is the damper stroke.
The calculation formula of oil damping force is as follows:
where
is density of the oil,
is the effective oil pressure area of the arresting hook damper,
is area of the damper oil hole,
is contraction coefficient of the oil hole.
The final bouncing height of hook head is
where
is the deck angle of aircraft when touching the deck,
is angle of the glide path of aircraft.
The heading displacement of hook head is
4. Test Verification
The proposed test method is verified by a real test. The test system mainly collects data of the sinking velocity, horizontal velocity, hook head bounce height, hook head bounce distance, buffer stroke, arresting hook damper stroke, and so on. The validity of the test method mainly focuses on three aspects: whether the buffer simulation is effective, whether the sinking velocity meets the requirements, and whether the horizontal velocity meets the requirements.
4.1. Verification of Buffer Performance
Take the sinking velocity of 3.6 m/s, 5 m/s, and 6.4 m/s as typical conditions for landing dynamics simulation, and get the buffer stroke curve of the main landing gear under three conditions, as shown in
Figure 12. It can be seen from the figure that the first positive stroke compression is 399.5 mm, 423.5 mm, and 443.5 mm, respectively, and the experienced time is 0.25 s, 0.21 s, and 0.18 s, respectively. With the increase of sinking velocity, the first positive stroke decreases obviously and the time of the process of positive compression increases with good following.
The buffer is filled with the final filling parameters determined in
Section 3.1, and the buffer is used for the test, as shown in
Figure 13. The measured buffer compression and compression time under different sinking velocities are compared with buffer performance results of the main landing gear in the simulation of the whole aircraft, as shown in
Table 1. Different sinking velocity is obtained by different sinking height.
From
Table 1 it can be seen that the test results of buffer are consistent with the simulation results of landing dynamics of the whole aircraft. The error between the first positive stroke and the first positive stroke of main landing gear is within 4%, and the error of the experienced time is within 6%, which meets the test requirements. Furthermore, the stroke length of the simulation is larger than that in the test generally, which may be due to a slight difference in the acceleration of gravity.
4.2. Verification of Sinking Velocity
According to the content specified in GJB 67.4a-2008 [
20], the calculation formula of the average sinking velocity of the carrier aircraft is
where
is the approach velocity,
is the average ground limiting velocity,
is the average aircraft carrier joining velocity,
is the average sinking velocity, and
,
and
are in km/h, and
is in m/s,
is the standard tolerance of the probability distribution of sinking velocity.
The calculation formula of the maximum sinking velocity [
21,
22] is
The approach velocity of the carrier aircraft is 197 km/h, the average sinking velocity is 3.6 m/s, and the maximum sinking velocity is 6.4 m/s calculated by Formulas (9)–(13), and the middle value of the two sinking velocities is 5 m/s. These three sinking velocities are taken as typical test conditions in the collision rebound test of the arresting hook.
In the experiment, the vertical displacement of the basket is measured in real time by the displacement sensor, and the sinking velocity is obtained by the differential processing of its displacement curve. The theoretical value and measured value of the test piece sinking velocity are shown in
Table 2, and the time curve of sinking velocity of the typical working condition is shown in
Figure 14. From the test results, it can be seen that as one of the important control indexes for the test success, the error between the test piece sinking velocity and the theoretical required value is within 2%, and the control method of sinking velocity of the test piece is feasible and meets the test requirements. Moreover, we can see that the sinking velocity of test result is larger than that of the theoretical value, which can also explain how the result in
Table 1 works.
4.3. Verification of Horizontal Velocity
The verification of horizontal velocity is mainly based on the comparison between the velocity input by the main control computer and the velocity displayed on the display screen. The velocity input by the main control computer is the target velocity, and the velocity displayed on the display screen is the actual velocity, as shown in
Figure 15.
The radius of the large disc is 1 m. Considering that the hook head has a certain width, the impact point is 0.95 m away from the center of the disc, so the rotation radius of the impact point is 0.95 m. The calculation formula of the linear velocity at the collision point is
It can be seen from Formula (3) and Formula (4) that the average on-board joint velocity of the aircraft
is 169.8 km/h, and its standard tolerance of probability distribution
is 9.26 km/h [
20]. Therefore, the maximum joint velocity of the aircraft
is 198.4 km/h, and the minimum
is 142 km/h. In the experiment, the average joint velocity, the maximum joint velocity, and the minimum joint velocity are taken as the horizontal velocity for comparative test, and the collision rebound performance of the arresting hook under different horizontal velocity is analyzed.
The target value and measured value of the linear velocity at the collision point are shown in
Table 3. From the data in the table, it can be seen that the error between the test value and the target value of the horizontal velocity is within 1%. The slight difference is due to the motor speed control, but the results are within the acceptable range, thus the motor can accurately simulate the horizontal velocity of the aircraft and meet the test requirements.
5. Test Results and Analysis
The parameters changed during the test mainly include the sinking velocity (dropping height), horizontal velocity (rotating velocity of the disc), and the inflation pressure of the arresting hook damper. Different combinations of parameters are used to test and record the test results.
5.1. The Influence of Sinking Velocity on the Collision Rebound of Arresting Hook
The inflation pressure of the arresting hook damper is kept constant at 2 MPa, and the target input of horizontal velocity is 198.4 km/h. The impact rebound test of different sinking velocity is carried out. The target value of sinking velocity is 3.6 m/s, 5 m/s, and 6.4 m/s, respectively. Each sinking velocity is tested for three times. The average value of three test results is taken as the test result. The bounce height and distance of the arresting hook under different sinking velocity are shown in
Table 4, and the stroke curve of the arresting hook damper is shown in
Figure 16.
It can be seen from
Table 4 that with the increase of sinking velocity, the bounce height increases significantly, and the first bounce height is 50.6 mm when the sinking velocity is 6.45 m/s. The bounce distance is almost not affected by the sinking velocity, because the bounce time of the hook head and the rotating velocity of the disc are basically unchanged. In conclusion, the bounce distance of hook is irrelevant to the sinking velocity.
It can be seen from
Figure 16 that the stroke of the damper of the arresting hook increases with the increase of the sinking velocity, and the maximum stroke of the damper is 57.7 mm when the sinking velocity is 6.45 m/s. The curve of the damper stroke is basically a straight line in the latter half, which is because the platform will not bounce or rub with the deck coating after the collision of the hook head.
5.2. The Influence of Horizontal Velocity on the Collision Rebound of Arresting Hook
The inflation pressure of the arresting hook damper is kept at 2 MPa, and the target value of the sinking velocity is 6.4 m/s. The collision rebound test of different horizontal velocity is carried out. The target value of horizontal velocity is taken as 0 km/h, 198.4 km/h, 169.8 km/h, and 142 km/h, respectively. Each horizontal velocity is tested for three times, and the average value of the three test results is taken as the test result. The bounce height and distance of the arresting hook under different horizontal velocities are shown in
Table 5, and the stroke curve of the arresting hook damper is shown in
Figure 17.
It can be seen from
Table 5 that with the increase of horizontal velocity, the change of bounce height is very small, indicating that the horizontal velocity has little influence on the bounce height which is easy to understand because the horizontal velocity contains no component in the vertical direction. The bounce distance increases with the increase of horizontal velocity, and it is 3.54 m when the horizontal velocity is 141.7 km/h.
It can be seen from
Figure 17 that with the increase of horizontal velocity, there is no obvious change in the damper stroke of the arresting hook. When the horizontal velocity is 198 km/h, the maximum stroke of the damper is 57.7 mm. With the increase of horizontal velocity, the acting force of the arresting hook damper which is irrelevant to horizontal velocity basically has no change, which can easily explain why the stroke of arresting hook damper is almost the same in different conditions.
5.3. The Influence of Inflation Pressure of Arresting Hook Damper on the Collision Rebound of Arresting Hook
The target value of sinking velocity is 6.4 m/s, the target input of horizontal velocity is 198.4 km/h, and the impact rebound test of different inflation pressure is carried out. The target value of inflation pressure is 1 MPa, 1.5 MPa, 2 MPa, and 3 MPa, respectively. Each inflation pressure is tested for three times, and the average value of three test results is taken as the test result, as shown in
Table 6.
It can be seen from
Table 6 that with the increase of inflation pressure, the bounce height decreases significantly. When the inflation pressure is 1 MPa, the first bounce height is 66 mm. The bounce distance is almost unaffected by the inflation pressure.
It can be seen from
Figure 18 that the stroke of the arresting hook damper also decreases with the increase of the inflation pressure. When the inflation pressure is 3 MPa, the maximum stroke of the damper is 52.7 mm.
From the point of view of arresting hook bounce, the larger the inflation pressure of arresting hook damper is, the lower the bounce height is, and the higher the success rate of engagement of arresting cable is. However, the arresting hook will be pulled up quickly after it is suspended. At this time, the load in the arresting hook buffer will increase with the increase of the inflation pressure, which may lead to the buffer overload. This part cannot be tested in the test system of this paper for the time being, so it is suggested to select a smaller buffer inflation pressure when the bounce height meets the requirements.
6. Conclusions
1. Aiming at the arresting hook of a certain type of carrier-based aircraft, the collision rebound test of the arresting hook is carried out in the laboratory environment, and the test method is verified. The test results show that the test method described in this paper is feasible and the test data obtained are reliable, which can meet the requirements of the collision rebound test of the arresting hook. At the same time, it provides the test research method for the collision rebound dynamics of the arresting hook and provides the experimental research method for the collision rebound dynamics of the arresting hook. Reliable test data are provided for the design of the hook. In follow-up experiments, we will take more key factors into consideration to improve the test and make the consequence more accurate. In addition, we will consider taking other aircrafts as test objects such as the newest UAV and adopt latest parameters.
2. This paper presents a simulation method of the main landing gear’s buffering performance when the carrier aircraft lands. It designs an oil–gas buffer to realize the buffering of the basket, so that the buffering performance of the first positive stroke is consistent with the buffering performance of the main landing gear when landing. The test results show that the error between the first positive stroke of the buffer and the simulation results is less than 4%, the error between the experienced time and the simulation results is less than 6%, which meets the requirements for the buffer in the collision rebound test of the arresting hook.
3. The simulation of the sinking velocity of the aircraft is realized by placing the basket at a fixed height. The basket adopts the truss structure to reduce the air resistance, and the polytetrafluoroethylene shaft sleeve clearance is used between the basket and the slide rail to reduce the friction. The test results show that the error between the measured value and the theoretical value of the sinking velocity is within 2%, which meets the requirements of simulating the sinking velocity of the aircraft in the laboratory environment.
4. After the collision and rebound of the arresting hook, the bounce height, the bounce distance, and the damper stroke are measured. Through the comparative tests under different working conditions, it is concluded that with the increase of the sinking velocity, the bounce height and the damper stroke increase, and the bounce distance is basically unchanged; the horizontal velocity has little influence on the bounce height and the damper stroke; with the increase of inflation pressure of the damper, the bounce height and the stroke of the damper decrease, and the bounce distance is basically the same. For further research, in follow-up experiments we will set a force sensor to acquire the acting force of longitudinal buffer of arresting hook in the collision rebound test to make the experiment more comprehensive.
Author Contributions
Conceptualization, X.W. and H.N.; data curation, Y.P.; formal analysis, Y.P.; investigation, Y.P. and P.X.; methodology, Y.P.; project administration, X.W. and H.N.; resources, X.W. and H.N.; software, P.X.; supervision, X.W. and H.N.; validation, Y.P.; visualization, P.X.; writing—original draft, Y.P.; writing—review & editing, Y.P. All authors have read and agreed to the published version of the manuscript.
Funding
This work was financially supported by China Postdoctoral Science Foundation (2019M651827), Jiangsu Planned Projects for Postdoctoral Research Funds (2018K042B), the National Defense Excellence Youth Science Fun of China (2018-JCJQ-ZQ-053), the Fundamental Research Funds for the Central Universities of China (NP2017401), the Research Fund of State Key Laboratory of Mechanics and Control of Mechanical Structures (Nanjing University of Aeronautics and astronautics) (MCMS-0217G01). A Project Funded by the Priority Academic Program Development of Jiangsu Higher Education Institutions.
Conflicts of Interest
The authors declare no conflict of interest.
References
- Nie, H.; Peng, Y.M.; Wei, X.H. Overview of carrier-based aircraft arrested deck-landing dynamics. Acta Aeronaut. Astronaut. Sin. 2014, 35, 1–12. [Google Scholar]
- Liu, G. Investigation on Arresting Dynamics for Carrier-Based Aircraft with Consideration of Arresting Hook Bounce. Ph.D. Thesis, Nanjing University of Aeronautics and Astronautics, Nanjing, China, 2009. [Google Scholar]
- Thomlinson, J. A Study of the Aircraft Arresting-Hook Bounce Problem, R. & M. No. 2980; Her Majesty’s Stationery Office: London, UK, 1957.
- Engineered Arresting Systems Corporation. Safety Bulletin; Engineered Arresting Systems Corporation: Plaisir, France, 2004. [Google Scholar]
- Gao, Z.J. A discussion of bounce kinematics of air-craft arresting hook and cable dynamics. Acta Aeronaut. Astronaut. Sin. 1990, 11, B543–B548. [Google Scholar]
- Liu, G.; Nie, H. Dynamics of arresting hook bounce after initial touchdown and impacting with deck. Acta Aeronaut. Astronaut. Sin. 2009, 9, 1672–1677. [Google Scholar]
- Liu, G.; Nie, H. Dynamics of bounce of aircraft arresting hook impacting with deck and performance of arresting hook longitudinal damper. Acta Aeronaut. Astronaut. Sin. 2009, 11, 2093–2099. [Google Scholar]
- Zhu, Q.D.; Meng, X.; Zhang, Z. Simulation research on motion law of arresting hook during landing. Appl. Mech. Mater. 2013, 300–301, 997–1002. [Google Scholar] [CrossRef]
- Fan, X.W.; Wu, Y.K.; Wu, S.B.; Du, S. A research on collision process of arresting hook and cushioning properties of the buffer. Aircr. Des. 2015, 35, 6–12. [Google Scholar]
- Jones, L.W. Development of Curves for Estimating Aircraft Arresting Hook Loads, AD-A119551; Air Force Flight Test Center: Edwards Air Force Base, CA, USA, 1982.
- Naval Air Engineering Center. Military Standard: Catapulting and Arresting Gear Forcing Functions for Aircraft Structural Design; MIL-STD-2066 (AS); Navy Air Systems Command: Lakehurst, NJ, USA, 1981. [Google Scholar]
- Rusk, D.T.; Pierce, J.; Hoppe, W.; Lancaster, B. Analysis and Testing of Fleet Corroded F/A-18C/D Arrestment Shanks, ADA489911; Naval Air Warfare Center Aircraft Division: St. Mary’s County, MD, USA, 2008. [Google Scholar]
- Yang, Q.W. Research on flight measurement method of a carrier-based aircraft hook loads. Acta Aeronaut. Astronaut. Sin. 2015, 36, 1162–1168. [Google Scholar]
- Chen, H. Design and Simulation of an Impact Testing Machine. Master’s Thesis, Harbin Institute of Technology, Harbin, China, 2014; pp. 21–27. [Google Scholar]
- Shen, J.T.; Pei, Y.T.; Top, M.; Hosson, D.J. Wear and friction performance of PTFE filled epoxy composites with a high concentration of SiO2 particles. Wear 2015, 322–323, 171–180. [Google Scholar] [CrossRef]
- Dod, Q.B.; Yang, Z.C.; Liu, X.C.; Mu, R. Test method for full scale drop of carrier-based aircraft. Acta Aeronaut. Astronaut. Sin. 2017, 38, 175–183. [Google Scholar]
- Wittel, H.; Jannasch, D.; Voßiek, J.; Spura, C. Roloff/Matek Maschinenelemente; Springer: Berlin, Germany, 2017. [Google Scholar]
- Zhu, W.Z. Friction and anti-slip coatings. Tuliao Gongye 2002, 32, 34–37. [Google Scholar]
- Siparsky, G.; Luebben, S. Non-Skid, Non-Flammable Coating for Navy Applications; TDA Research, Inc.: Wheat Ridge, CO, USA, 1998. [Google Scholar]
- The PLA General Armament Department. Military Airplane Structural Strength Specification Part 4: Ground Loads: GJB 67.4A―2008; The PLA General Armament Department: Beijing, China, 2008. [Google Scholar]
- Wang, Q.S. A preliminary research of sinking velocity for carrier-based aircraft. Aircr. Des. 2007, 27, 1–6. [Google Scholar]
- Li, B.; Shen, H. Determination to maximum aircraft sinking velocity. Chin. J. Appl. Mech. 2008, 25, 168–171. [Google Scholar]
Figure 1.
Schematic diagram of the test of arresting hook bounce.
Figure 1.
Schematic diagram of the test of arresting hook bounce.
Figure 2.
Curves of hook bounce height and main landing gear stroke length.
Figure 2.
Curves of hook bounce height and main landing gear stroke length.
Figure 3.
Structure chart of damper.
Figure 3.
Structure chart of damper.
Figure 4.
Dynamic model of hanging basket drop.
Figure 4.
Dynamic model of hanging basket drop.
Figure 5.
Flow diagram of determination of damper filling parameters.
Figure 5.
Flow diagram of determination of damper filling parameters.
Figure 6.
Schematic diagram of belt system.
Figure 6.
Schematic diagram of belt system.
Figure 7.
Schematic diagram of belt system control.
Figure 7.
Schematic diagram of belt system control.
Figure 8.
Practicality picture of thick steel disc.
Figure 8.
Practicality picture of thick steel disc.
Figure 9.
Design rendering and material object of disc.
Figure 9.
Design rendering and material object of disc.
Figure 10.
Rebound diagram of the arresting hook.
Figure 10.
Rebound diagram of the arresting hook.
Figure 11.
Internal structure of longitudinal buffer.
Figure 11.
Internal structure of longitudinal buffer.
Figure 12.
Changes of stroke length of main landing gear at different sinking velocity.
Figure 12.
Changes of stroke length of main landing gear at different sinking velocity.
Figure 13.
Practicality picture of arresting hook bounce test.
Figure 13.
Practicality picture of arresting hook bounce test.
Figure 14.
Curves of time history of hanging basket sinking velocity.
Figure 14.
Curves of time history of hanging basket sinking velocity.
Figure 15.
Control cabinet and display.
Figure 15.
Control cabinet and display.
Figure 16.
Changes of stroke length of arresting hook at different sinking velocity.
Figure 16.
Changes of stroke length of arresting hook at different sinking velocity.
Figure 17.
Changes of stroke length of arresting hook at different horizontal velocity.
Figure 17.
Changes of stroke length of arresting hook at different horizontal velocity.
Figure 18.
Changes of stroke length of arresting hook at different inflation pressure.
Figure 18.
Changes of stroke length of arresting hook at different inflation pressure.
Table 1.
Comparison of simulation and test results.
Table 1.
Comparison of simulation and test results.
| No. | VV (m∙s−1) | Stroke Length | Time |
|---|
| Simulation (mm) | Test (mm) | Error (%) | Simulation (s) | Test (s) | Error (%) |
|---|
| 1 | 6.4 | 443.5 | 433 | −2.4 | 0.18 | 0.19 | 5.5 |
| 2 | 5.0 | 423.5 | 410 | −3.2 | 0.21 | 0.2 | −4.8 |
| 3 | 3.6 | 399.5 | 395 | −1.1 | 0.25 | 0.24 | −4 |
Table 2.
Comparison of theoretical value and test result of hanging basket sinking velocity.
Table 2.
Comparison of theoretical value and test result of hanging basket sinking velocity.
| No. | Sinking Velocity |
|---|
| Theoretical Value (m·s−1) | Test Result (m·s−1) | Error (%) |
|---|
| 1 | 3.6 | 3.65 | 1.4 |
| 2 | 5.0 | 5.08 | 1.6 |
| 3 | 6.4 | 6.45 | 0.8 |
Table 3.
Comparison of target value and test result of horizontal velocity.
Table 3.
Comparison of target value and test result of horizontal velocity.
| Horizontal Velocity (km·h−1) | Rotational Velocity of Thick Steel Disc |
|---|
| Target Value (r·min−1) | Test Value (r·min−1) | Error (%) |
|---|
| 198.4 | 554.3 | 549.8 | −0.8 |
| 169.8 | 474.4 | 478.9 | 0.9 |
| 142 | 396.7 | 397.1 | 0.1 |
Table 4.
Test result of bounce height and bounce distance with different sinking velocity.
Table 4.
Test result of bounce height and bounce distance with different sinking velocity.
Sinking
Velocity (m∙s−1) | Horizontal Velocity (km∙h−1) | Bounce Height (mm) | Bounce Distance (m) |
|---|
| 3.65 | 198.4 | 27.5 | 4.96 |
| 5.08 | 198 | 40 | 4.95 |
| 6.45 | 198 | 50.6 | 4.95 |
Table 5.
Test result of bounce height and bounce distance with different horizontal velocity.
Table 5.
Test result of bounce height and bounce distance with different horizontal velocity.
Sinking
Velocity (m∙s−1) | Horizontal Velocity (km∙h−1) | Bounce Height (mm) | Bounce Distance (m) |
|---|
| 6.45 | 198 | 50.6 | 4.95 |
| 6.43 | 170.2 | 51 | 4.26 |
| 6.45 | 141.7 | 50.2 | 3.54 |
Table 6.
Test result of bounce height and bounce distance with different inflation pressure.
Table 6.
Test result of bounce height and bounce distance with different inflation pressure.
| Inflation Pressure (MPa) | Bounce Height (mm) | Bounce Distance (m) |
|---|
| 1 | 66 | 4.96 |
| 1.5 | 55 | 4.92 |
| 2 | 50.6 | 4.92 |
| 3 | 43 | 4.95 |
| Publisher’s Note: MDPI stays neutral with regard to jurisdictional claims in published maps and institutional affiliations. |
© 2020 by the authors. Licensee MDPI, Basel, Switzerland. This article is an open access article distributed under the terms and conditions of the Creative Commons Attribution (CC BY) license (http://creativecommons.org/licenses/by/4.0/).


