Abstract
Organic matter, nutrients, and chemicals are some of the waste materials found in most domestic wastewaters. The purpose of this research was to evaluate the potentials of Pistia stratiotes, Salvinia molesta, and Eichhornia crassipes aquatic weed plants in the tertiary treatment of secondary domestic wastewater using hydroponic systems. Physicochemical analysis that considered turbidity, phosphate, ammoniacal nitrogen, and nitrate was conducted on the wastewater samples at different retention times of 6, 12, and 24 h for 14 days. The best performance was observed for a 24 h retention treatment system, with up to 91% (P. stratiotes), 94% (S. molesta), and 89.3% (E. crassipes) reduction for turbidity; 81.2% (P. stratiotes), 82.7% (S. molesta), and 88.5% (E. crassipes) for phosphate reduction; 88.66% (P. stratiotes), 90.47% (S. molesta), and 89.11% (E. crassipes) for ammoniacal nitrogen reduction; 83.6% (P. stratiotes), 92.1% (S. molesta) and 93% (E. crassipes) for nitrate reduction. Hence, the application of hydroponic systems in cultivation of the macrophytes proved to be effective in the phytoremediation process by removing the residual nutrients present in the treated secondary domestic wastewater. Additionally, this method can be used for the cultivation of plant-based biomass and other non-edible useful crops using the free nutrients content of the wastewater before its discharge into the natural environment.
1. Introduction
The utilization and quest for clean renewable energy have become critical due to the growing interest in clean energy and water sources [1,2]. Environmental problems can be caused by organic and inorganic compounds found in wastewater [3]. However, conventional wastewater treatment methods, which consist of several treatment processes, are not always effective toward the complete removal of water contaminants. Thus, a small quantity of these contaminants, such as ammonia, nitrate, and phosphorous, are discharged into river bodies, which can lead to the pollution of groundwater. This can affect human health, disrupt the aquatic ecosystem, kill aquatic animals, and stimulate the growth of aquatic weed plants in rivers, streams, or lakes [4,5]. The high growth of these aquatic weed plants forms thick mats in water systems that stagnate the movement of water, harbor dangerous insects, such as mosquitoes, and cause detrimental effects to aquatic life and blockage of water channels and hydroelectric turbines [6]. Hence, tertiary treatment is required to remove all the residual organic and inorganic pollutants. Tertiary treatment of wastewater can be established through chemical or plant-based methods. As a comparison between biological and chemical treatment processes, plant-based treatment methods, such as phytoremediation, have proved to be more feasible and effective in most cases [7,8]. Phytoremediation is a plant-based process that involves the use of plant species, such as aquatic weed plants, to absorb or degrade excess nutrients in terrestrial and aquatic environments. Furthermore, the phytoremediation process is cost-effective, sustainable, and environmentally friendly, and can be employed either in constructed wetlands or hydroponic systems. Macrophytes, such as Eichhornia crassipes, Pistia stratiotes, Ceratophyllum dermesum L., Potamogeton perfoliatus, Lemna minor, Limnobium laevigatum, Typa orientalis, Vertiveria zizaniodes, common reed, manna grass, Virginia mallow, Salvinia molesta, Stuckenia pectinate, Phragmites australis, Alternanthera, Arundo donax, Mentha aquatica, Nelumbo nucifera, and Nymphaea have been utilized in the phytoremediation of wastewater [9,10].
In recent years, there has been an increasing number of studies on the applications of phytoremediation techniques in wastewater treatment. For instance, Qin et al. [11] examined the efficiency of water lettuce and water hyacinth in the biological treatment of an open pond polluted by household drainage for a duration of one month with a 24 h retention time. In the research, the phosphorous and nitrogen, as well as physicochemical changes of the plants and water samples, were investigated. The result of the study showed that water hyacinth exhibited a higher nitrogen reduction (58.64%) than water lettuce, which is suitable for the intensive purification of domestic sewage with high nitrogen concentrations. Furthermore, Jehawi et al. [12] evaluated the potentials of Scirpus grossus in the excretion of PO4-P, NH4-N, and NO3-N from domestic wastewater using a constructed hybrid reed bed for a duration of 120 days and a hydraulic retention time of 3 days. The study attained a mean removal of 84.7% and 71% for NH4-N and PO4-P, respectively. Nizam et al. [13] studied the capability of P. stratiotes, Ipomoea aquatica, S. molesta, Centella asiatica, and E. crassipes in the uptake of total suspended solids (TSSs), PO4-P, and NH4-N from aquaculture wastewater. The sampling study was conducted for a duration of two weeks at a retention time of 2 days. The outcomes demonstrated a radical reduction in pollutants by P. stratiotes (phosphate (89%), TSS (98%), and NH3-N (78%)), I. aquatica (phosphate (50%), TSS (73%), and NH3-N (73%)), S. molesta (phosphate (88.6%), TSS (89.3%), and NH3-N (63.9%)), C. asiatica (phosphate (64%), TSS (90%), and NH3-N (98%)), and E. crassipes (phosphate (98%), TSS (96%), and NH3-N (74%)).
However, prior studies have reported that the different types and characteristics of wastewater used in the study also affect the capability of the plant in nutrient removal. In light of the above, the purpose of this research was to evaluate the potentials of P. stratiotes, S. molesta, and E. crassipes aquatic weed plants in the tertiary treatment of secondary domestic wastewater using hydroponic systems. Physicochemical analysis of turbidity, phosphate, ammoniacal nitrogen, and nitrate was conducted on the wastewater samples for different retention times of 6, 12, and 24 h for 14 days. Furthermore, Pistia stratiotes, known as water lettuce, belongs to the Araceae family. The genus name “Pistos” is a Greek word that means water, which refers to the aquatic characteristics of the plants [10]. Salvinia molesta D. S Mitch., also known as kariba weed or giant salvinia, belongs to the Salviniaceae family [10,14]. Eichhornia crassipes (Mart.), also known as water hyacinth, belongs to the Pontederiaceae family and it has been classified as one of the most notorious weed plants in the world [15].
2. Materials and Methods
2.1. Description of the Study Area and Samples Collection
This research was performed using a transparent lab-scale hydroponic cultivation system under canopy shade conditions at a local Sewage Treatment Plant (STP). The STP mainly receive domestic sewage from the University community. The STP is situated around Kajang, Selangor, Malaysia. The average annual natural surrounding temperature is 27.2 °C. A map of Malaysia showing the location of the study area is illustrated in Figure 1. ArcGIS (California, CA, USA) 10.4.1 software (source) was used to generate the map.
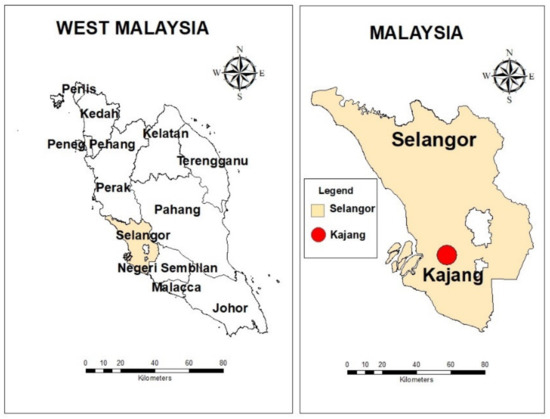
Figure 1.
Map of West Malaysia showing the location of the study area.
2.2. Methodology
The selected plant samples (P. stratiotes, S. molesta, and E. crassipes) were collected from within the premises of Universiti Tenaga Nasional (UNITEN). The research was performed as described by [16], but with adjustments in the acclimatization period and retention time. Eighty grams of the fresh P. stratiotes, S. molesta, and E. crassipes was cultivated in three separate hydroponic ponds filled with the treated secondary domestic wastewater from the STP as shown in Figure 2. The plants were allowed to acclimatize in the system for 5 days prior to the start of the sampling study. Sampling was carried out for a period of 14 days with an interval of 2 days for each retention time (6, 12, and 24 h). The influent wastewater samples were collected directly from the STP secondary treatment point. Similarly, the effluent samples were collected from each of the hydroponic tanks. The collected wastewater samples were transferred to the environmental laboratory for water quality analysis in terms of turbidity, phosphate, ammoniacal nitrogen, and nitrate according to standard methods for the scrutiny of water and wastewater. The procedures used for carrying out the analysis are described in the subsequent section. The readings were recorded in triplicates and the average results obtained were expressed as mean ± standard deviation. Analysis of variance (ANOVA) IBM SPSS (New York, NY, USA) version 25 package was used to evaluate the significance of the differences and the t-test. Furthermore, a p-value of less than 0.05 was considered statistically significant, which indicates strong evidence against the null hypothesis, as there was less than a 5% probability the null was correct; in contrast, a p-value greater than 0.05 was considered statistically insignificant, indicating strong evidence for the null hypothesis [17]. The dilution factor and percentage reduction efficiency was calculated using the following equations [18]:
where Ci is the influent concentration and Ce is the effluent concentration
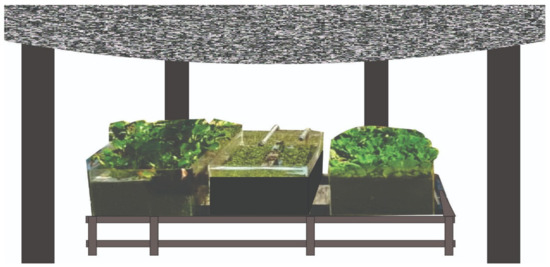
Figure 2.
Diagram of the hydroponic cultivation setup.
2.2.1. Determination of the Turbidity of the Wastewater Samples
The turbidity analysis of the samples was performed in accordance with the ISO 7027 International Standard [19]. The turbidity of the wastewater samples was evaluated by using a HANA HI 93703 microprocessor turbiditimeter that peaked at 890 nm with a range of 0–1000 NTU and filling 25 mL of each of the samples into separate sample cells.
2.2.2. Determination of the Phosphate Concentration of the Wastewater Samples
The phosphate analysis was performed following United States Environmental Protection Agency (USEPA) method 365.2 and standard method 4500-P-E for wastewater. The ascorbic acid method (HACH method 8084) was performed using Phosver 3 Phosphate Reagent Powder Pillows with a HACH DR3900 spectrophotometer at 830 nm that allows for the detection in a high range (0.02–2.50 mg/L PO43−) programmed on a 490 P React. PP [20].
2.2.3. Determination of the Ammoniacal Nitrogen Concentration
The ammonia test of the wastewater samples was analyzed in accordance with USEPA 350.2 wastewater analysis using the Nessler method (HACH 8038) with a HACH DR3900 spectrophotometer (program 380 N, Ammonia Ness) at a wavelength of 425 nm and a noticeable range of 0.02–2.50 mg/L NH3-N [21].
2.2.4. Determination of the Nitrate Concentration of the Wastewater Samples
The nitrate test of the influent and effluent wastewater samples was obtained using the cadmium reduction method (HACH method 8039) using NitraVer 5 Nitrate Reagent Pillows with a HACH DR3900 spectrophotometer using program 355 N and Nitrate HR PP at a measurement wavelength of 500 nm and a range of 0.3–30.0 mg/l NO3-N [22].
3. Results
This section presents and discusses the outcome of the water quality analysis carried out on the influent and effluent wastewater samples.
3.1. Turbidity Reduction Analysis
The results of the turbidity analysis obtained from the evaluation of P. stratiotes, S. molesta, and E. crassipes in a tertiary treatment of secondary treated domestic wastewater for two weeks with a retention time of 6, 12, and 24 h are presented in Figure 3, Figure 4 and Figure 5, respectively.
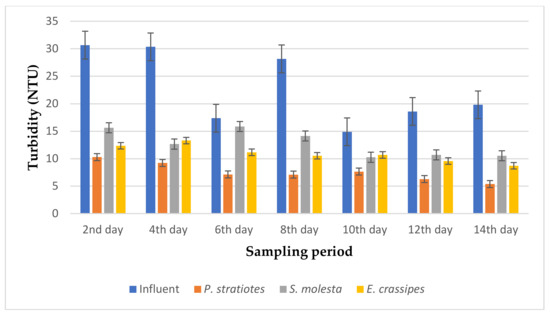
Figure 3.
Bar plot of the average turbidity vs. the sampling period with a 6 h retention time.
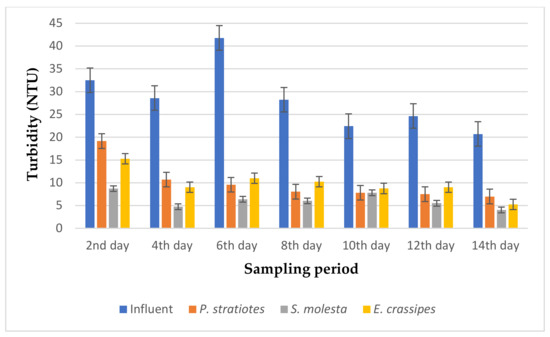
Figure 4.
Bar plot of the average turbidity vs. the sampling period with a 12 h retention time.
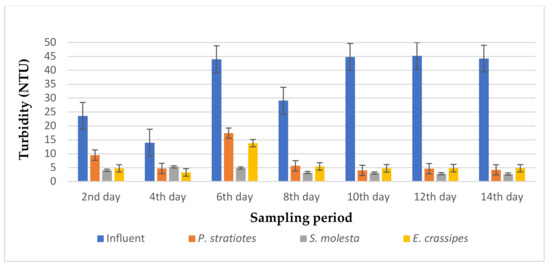
Figure 5.
Bar plot of the average turbidity vs. the sampling period at 24 h retention time.
As seen in Figure 3, the turbidity level of the influent wastewater samples collected from STP varied throughout the sampling period and ranged from 14.9–30.6 NTU. It was observed that the reduction of the turbidity level for the influent wastewater samples by the test plants was obvious from the beginning to the end of the sampling duration. On the second day of the sampling period, the test plants lowered the turbidity value of the influent wastewater sample from 30.66 ± 2.12 NTU to 10.3 ± 0.1 (P. stratiotes), 15.63 ± 0.06 (S. molesta), and 12.36 ± 0.05 NTU (E. crassipes). The reduction efficiency ranges for the P. stratiotes, S. molesta, and E. crassipes wastewater treatment systems were found to be 48–72.7%, 10.19–58.3%, and 28.3–58.88%, respectively. However, these results show that P. stratiotes exhibited better absorption of the suspended particles at a short retention time of 6 h. Similarly, the average performance demonstrated by the S. molesta can be attributed to the slow growth and shrinking of the leaves observed from the sixth day of the sampling period. Furthermore, a substantial variance (p < 0.05) was observed between the average initial wastewater samples and the individual effluent wastewater samples.
From Figure 4, it is evident that the selected test plants were effective in polishing the influent wastewater samples with a 12 h retention time. However, the turbidity level of the influent wastewater samples collected from STP varied throughout the sampling period and ranged from 20.7–41.8 NTU. It can be noticed that a high turbidity concentration of the influent wastewater samples was recorded on the second and sixth day of the sampling period with a value of 32.5 ± 1.85 NTU and 41.8 ± 0.37 NTU, respectively. Nevertheless, the introduction of the test plants in the influent wastewater samples led to the improvement of the effluent wastewater samples from 28.6 ± 0.45 NTU to 10.7 ± 0.2 NTU (P. stratiotes), 4.74 ± 0.12 NTU (S. molesta), and 9.02 ± 0.69 NTU (E. crassipes) on the fourth day of the sampling study. Furthermore, reduction efficiencies of 41.0% and 77.1%, 73.2% and 84.6%, and 53.0% and 73.6% for P. stratiotes, S. molesta, and E. crassipes, respectively, were observed for the same sampling periods (second and sixth day). Similarly, a turbidity value of 20.72 ± 0.06 NTU was obtained for the influent sample on the 14th day, which was reduced to 7.0 ± 0.1 NTU, 4.03 ± 0.055 NTU, and 5.27 ± 0.27 NTU by P. stratiotes, S. molesta, and E. crassipes, respectively. Finally, maximum reduction efficiencies of 66.2%, 84.6%, and 74.6% were obtained for P. stratiotes, S. molesta, and E. crassipes, respectively. A significant variance (p < 0.05) was observed between the influent and effluent wastewater samples.
From Figure 5, it is obvious that the three test plants polished the influent wastewater samples, thereby showing a remarkable improvement in the effluent wastewater samples when compared with the influent sample during the 14-day sampling study with a retention time of 24 h. It can be observed that the influent turbidity varied throughout the sampling period, as this was determined from the operation of the STP. The average turbidity level of the influent wastewater samples was lowered from the second day of the sampling period: from 23.63 ± 0.18 to 9.5 ± 1.32 NTU, 4.06 ± 1.45 NTU, and 4.72 ± 0.03 NTU by P. stratiotes, S. molesta, and E. crassipes, respectively. This led to reduction efficiencies of 58% (P. stratiotes), 82.8% (S. molesta), and 80% (E. crassipes), respectively. Similarly, as the sampling days increased, a steady pattern of reduction in the turbidity level was observed for the three aquatic plant treatment systems. Meanwhile, the E. crassipes treatment system demonstrated a slight fluctuation on the fourth and sixth day of the sampling, followed by an onward increase in the reduction efficiency up to the 14th day of the sampling period. Furthermore, it was observed that a maximum removal efficiency of 94% was obtained from S. molesta, while the P.-stratiotes-treated samples showed a maximum removal efficiency of 91% and the E.-crassipes-treated samples resulted in a maximum removal efficiency of 89.3%. However, the ANOVA test indicated that a significant change was observed between the influent and the effluent samples.
3.2. Phosphate Reduction Analysis
The results of the phosphate analysis obtained during the phytoremediation of domestic wastewater using three selected aquatic weed plants for two weeks with varying retention times of 6, 12, and 24 h are represented in Figure 6, Figure 7 and Figure 8.
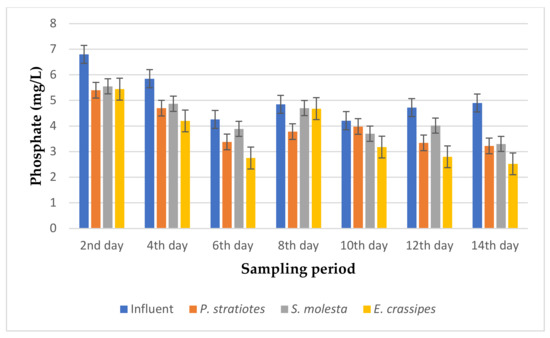
Figure 6.
Bar plot of the average phosphate vs. the sampling period with a 6 h retention time.
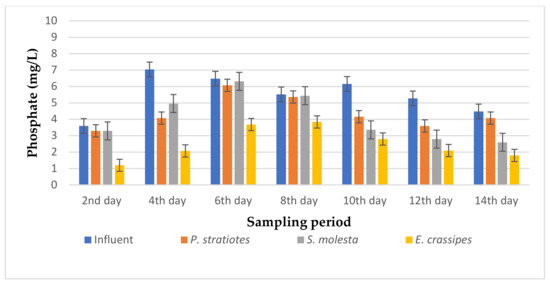
Figure 7.
Bar plot of the average phosphate vs. the sampling period with a 12 h retention time.
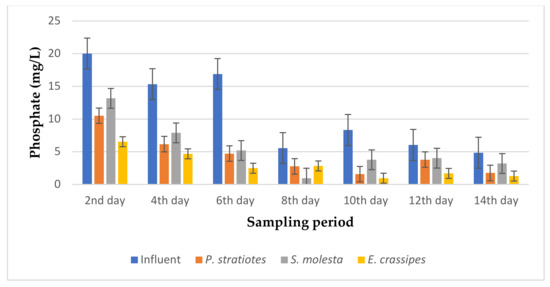
Figure 8.
Bar plot of the average phosphate vs. the sampling period with a 24 h retention time.
From Figure 6, the phosphate concentration of the influent wastewater samples obtained from the STP varied throughout the sampling period and ranged from 4.21–6.8 mg/L. The initial average phosphate concentration of the influent samples gradually decreased across the 14-day sampling period, except for the P.-stratiotes- and S.-molesta-treated water samples on the 10th day of the sampling period. Similarly, on the second day of the sampling period, the phosphate level of the influent wastewater samples was decreased from 6.8 ± 0 mg/L to 5.40 ± 0.02 mg/L, 5.55 ± 0.01 mg/L, and 5.44 ± 0 mg/L by the P. stratiotes, S. molesta, and E. crassipes plants, respectively. This reduction led to a change of 20.58%, 18.67%, and 20% phosphate removal efficiency for the P. stratiotes, S. molesta and E. crassipes treatment systems, respectively. Furthermore, on the sixth day, the influent phosphate values were lowered from 4.26 ± 0 mg/L to 3.38 ± 0 mg/L, 3.89 ± 0 mg/L, and 2.75 ± 0 mg/L by P. stratiotes, S. molesta, and E. crassipes, respectively. However, the maximum phosphate removal efficiencies of P. stratiotes (34.28%), S. molesta (32.04%), and E. crassipes (48.7%) were achieved on the 14th day of the sampling period. Furthermore, a significant change (p < 0.05) was detected between the influent and the effluent wastewater samples. Finally, a slow reduction performance by the three test plants in reducing the phosphate concentration of the domestic wastewater samples was observed as a removal efficiency of below 50% was obtained in the 14-day treatment period with a 6 h retention time.
From Figure 7, it can be seen that the phosphate concentration of the influent wastewater samples from the STP varied throughout the sampling period. However, on the second day of the sampling period, the three test plants reduced the influent phosphate concentration from 3.6 ± 0.04 mg/L to 3.3 ± 0.04 mg/L, 3.3 ± 0 mg/L, and 1.2 ± 0.04 mg/L for P. stratiotes, S. molesta, and E. crassipes, respectively. On the eighth day, the test plants lowered the influent phosphate concentration from 5.56 ± 0.05 mg/L to 5.36 ± 0.04 mg/L (P. stratiotes), 5.44 ± 0 mg/L (S. molesta), and 3.84 ± 0 mg/L (E. crassipes). Furthermore, the maximum phosphate removal percentage was noted for E. crassipes (70.45%) on the 2nd day, followed by S. molesta (46.96%) on the 12th day, and P. stratiotes (32.36%) on the 10th day of the sampling period. Therefore, in this present study, E. crassipes exhibited the highest phosphate removal percentage, trailed by S. molesta and P. stratiotes aquatic weed plants, for a 12 h retention time. A below-average reduction performance was observed in the S.-molesta- and P.-stratiotes-treated wastewater samples. This can be attributed to the 12 h retention time, as up to an 82% phosphate reduction was achieved in the 24 h treatment system of the two plants. Furthermore, a significant reduction (p < 0.05) was observed between the influent samples’ phosphates values and the treated wastewater samples.
From Figure 8, the phosphate values of the influent wastewater samples from the STP were observed to be inconsistent throughout the sampling period and fell within the 4–20.1 mg/L range. A steady decrease was observed in the results throughout the sampling days, with slight inconsistencies observed in the pattern of phosphate level reduction of the effluent samples. Similarly, on the second day of the sampling period, a phosphate concentration of 20.01 ± 0.01 mg/L was recorded for the influent sample. However, the test plants were able to reduce the influent phosphate values from 20.01 ± 0.01 mg/L to 10.50 ± 0.01 mg/L, 13.16 ± 0.01 mg/L, and 6.53 ± 0.15 mg/L for P. stratiotes, S. molesta, and E. crassipes, respectively. On the eighth day, the test plants lowered the influent phosphate concentration from 5.56 ± 0.05 mg/L to 2.76 ± 0.05 mg/L (P. stratiotes), 0.96 ± 0.01 mg/L (S. molesta), and 2.83 ± 0.05 mg/L (E. crassipes). The highest phosphate reduction efficiencies for the P. stratiotes and E. crassipes treatment systems were observed on the 10th day, with values of 81.2% and 88.5%, respectively. The maximum percentage reduction efficiency for S. molesta was found to be 82.7% on the eighth day of the sampling period. In this present work, a more advanced phosphate removal by E. crassipes was recorded compared to the P. stratiotes and S. molesta plant treatment systems. The short roots of P. stratiotes played a vital part in the uptake of phosphate from the treatment system. However, the ANOVA test demonstrated a significant difference (p < 0.05) in the phosphate reduction values obtained between the influent and the effluent wastewater treatment systems, except for S. molesta, which was found to be not significant (p > 0.05).
3.3. Ammoniacal Nitrogen Reduction
The results of the ammoniacal nitrogen analysis obtained from the biological treatment of domestic wastewater using P. stratiotes, S. molesta, and E. crassipes aquatic weed plants for a 14-day duration with different retention times of 6, 12, and 24 h are represented in Figure 9, Figure 10 and Figure 11, respectively.
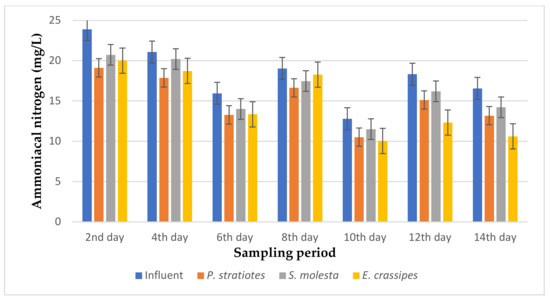
Figure 9.
Bar plot of the average ammoniacal nitrogen vs. the sampling period with a 6 h retention time.
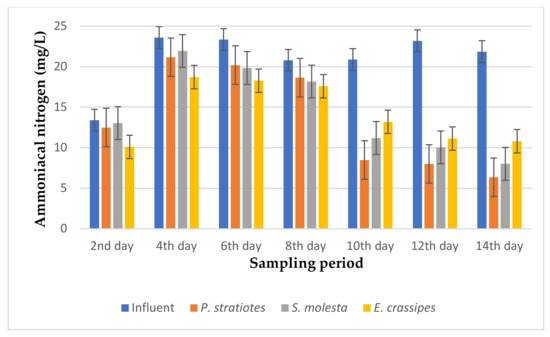
Figure 10.
Bar plot of the average ammoniacal nitrogen vs. the sampling period with a 12 h retention time.
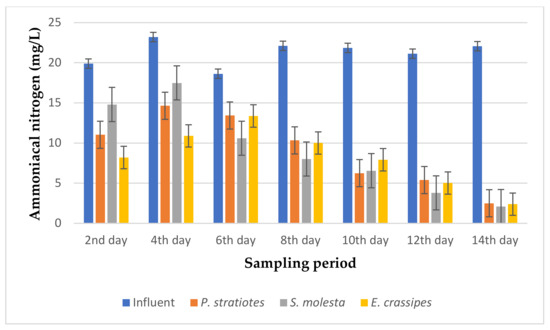
Figure 11.
Bar plot of the average ammoniacal nitrogen vs. the sampling period with a 24 h retention time.
From Figure 9, the ammoniacal nitrogen concentration of the influent wastewater samples from the STP was observed to be inconsistent throughout the sampling period and ranged from 12.8–23.89 mg/L. The results presented demonstrated that a slow reduction of the influent ammoniacal nitrogen level was recorded during the 14-day treatment. The ammoniacal nitrogen removal efficiencies with a 6 h retention time for P. stratiotes, S. molesta, and E. crassipes were within the ranges of 12.86–20.41%, 4.17–14.07%, and 4.04–35.92%, respectively. However, the S.-molesta-treated effluent samples showed a lower ammoniacal nitrogen concentration compared to the P.-stratiotes- and E.-crassipes-treated wastewater samples. The performance of the influent samples compared to the individual test plants was found to be significant (p < 0.05).
Based on the results presented in Figure 10, it was found that the ammoniacal nitrogen concentration of the influent wastewater samples fell within the range of 13.4 to 21.86 mg/L. A gradual decrease was observed in the ammoniacal nitrogen reduction of the influent samples throughout the 14-day treatment process. Similarly, the ammoniacal nitrogen level of the influent sample was recorded as 13.4 ± 0.1 mg/L on the second day, which was slightly reduced to 12.5 ± 0.1 mg/L, 13.04 ± 0.01 mg/L, and 10.1 ± 0 mg/L by P. stratiotes, S. molesta, and E. crassipes, respectively. The changes showed small reduction efficiencies of 6.71% for P. stratiotes, 2.68% for S. molesta, and 24.6% for E. crassipes. However, after 10 days, a significant reduction in the influent ammoniacal nitrogen concentration was observed. On the 12th day of the sampling period, the initial ammoniacal nitrogen value of 23.2 ± 0.04 mg/L was drastically reduced to 8.0 ± 0 mg/L, 10.04 ± 0.01 mg/L, and 11.13 ± 0.05 mg/L by P. stratiotes, S. molesta, and E. crassipes, respectively. On the 14th day, the three test plants improved the concentration of the influent wastewater sample from 21.86 ± 0 to 6.36 ± 0.05 mg/L (P. stratiotes), 8.01 ± 0.02 mg/L S. molesta), and 10.8 ± 0.1 mg/L (E. crassipes). Furthermore, the ammoniacal nitrogen removal efficiencies with a 12 h retention time for P. stratiotes, S. molesta, and E. crassipes were estimated to be in the ranges of 60–71%, 45–65%, and 36–50%, respectively, at the end of the 14-day treatment. P. stratiotes performed better than S. molesta and E. crassipes at lowering the ammoniacal nitrogen concentration of the influent wastewater samples. Moreover, the performance of the influent samples compared to the individual test plants was found to be significant (p < 0.05).
Based on the results presented in Figure 11, it can be seen that the concentration of ammoniacal nitrogen in the influent samples varied during the sampling period. However, the effluent samples indicated a constant rate of reduction in the ammoniacal nitrogen compared to the influent samples from the beginning to the last day of the sampling period with a little inconsistency on the fourth day of the sampling period. Similarly, it was observed that P. stratiotes reduced the ammoniacal nitrogen values from 19.9 ± 0.17 mg/L, 23.2 ± 0.2 mg/L, 18.63 ± 0.15 mg/L, 22.1 ± 0.1 mg/L, 21.86 ± 0.05 mg/L, 21.13 ± 0.08 mg/L, and 22.05 ± 0.01 mg/L of the influent wastewater samples to 11.04 ± 0.25 mg/L, 14.65 ± 0.14 mg/L, 13.43 ± 0.05 mg/L, 10.34 ± 0.02 mg/L, 6.26 ± 0.057 mg/L, 5.4 ± 0.17 mg/L, and 2.5 ± 0.08 mg/L, respectively, from the 2nd day to the 14th day of the sampling period at 2-days intervals. Meanwhile, S. molesta decreased the ammoniacal nitrogen values from 19.9 ± 0.17 mg/L, 23.2 ± 0.2 mg/L, 18.63 ± 0.15 mg/L, 22.1 ± 0.1 mg/L, 21.86 ± 0.05 mg/L, 21.13 ± 0.08 mg/L, and 22.05 ± 0.01 mg/L of the influent samples to 14.8 ± 0.1 mg/L, 17.49 ± 0 mg/L, 10.60 ± 0.1 mg/L, 8.02 ± 0.01 mg/L, 6.56 ± 0.06 mg/L, 3.80 ± 0.1 mg/L, and 2.1 ± 0 mg/L, respectively. E. crassipes lowered the ammoniacal nitrogen values of the influent samples from 19.9 ± 0.17 mg/L, 23.2 ± 0.2 mg/L, 18.63 ± 0.15 mg/L, 22.1 ± 0.1 mg/L, 21.86 ± 0.05 mg/L, 21.13 ± 0.08 mg/L, and 22.05 ± 0.01 mg/L to 8.2 ± 0.1 mg/L, 10.89 ± 0.16 mg/L, 13.37 ± 0.20 mg/L, 10.01 ± 0.01 mg/L, 7.92 ± 0.06 mg/L, 5.02 ± 0.01 mg/L, and 2.4 ± 0.17 mg/L, respectively, during the 14-day phytoremediation process. The maximum ammoniacal nitrogen reduction percentage for the P. stratiotes, S. molesta, and E. crassipes effluent samples was found to be 88.66%, 90.47%, and 89.11%, respectively, on the 14th day of the experiment. However, the performances of the three plants showed significant differences (p < 0.05) when compared to the values of the influent samples.
3.4. Nitrate Reduction Analysis
The average nitrate values obtained from the tertiary treatment of domestic wastewater using P. stratiotes, S. molesta, and E. crassipes plants for a duration of two weeks with varying retention times of 6, 12, and 24 h are represented in Figure 12, Figure 13 and Figure 14, respectively.
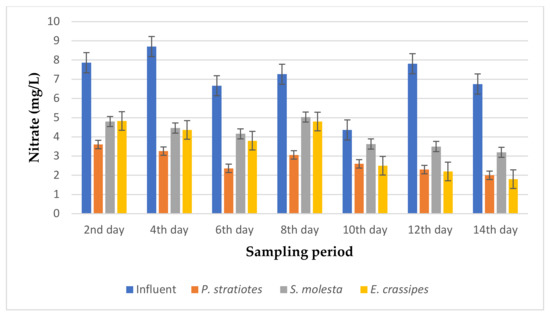
Figure 12.
Bar plot of the average nitrate vs. the sampling period with a 6 h retention time.
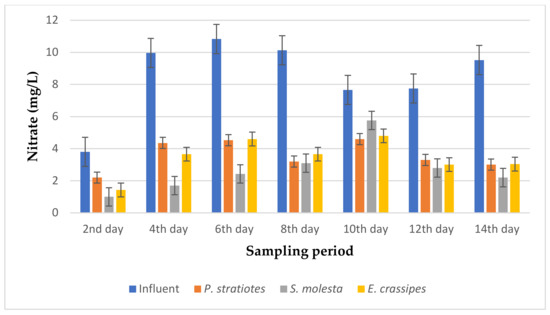
Figure 13.
Bar plot of the average nitrate vs. the sampling Period with a 12 h retention time.
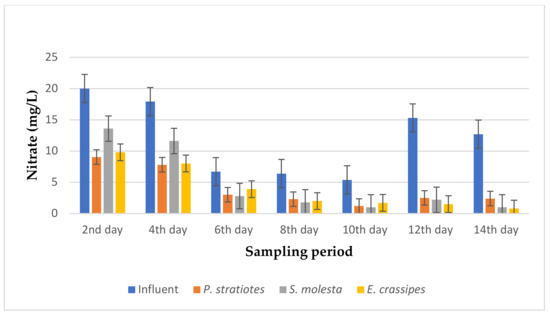
Figure 14.
Bar plot of the average nitrate vs. the sampling period with a 24 h retention time.
From the results presented in Figure 12, it can be observed that the average nitrate concentration of the influent samples from the STP varied throughout the sampling period and fell within the range of 4.36–8.7 mg/L. However, the uptake rate of nitrate by the three test plants increased across the 14-day sampling period. An initial nitrate value of 7.86 ± 0.05 mg/L was obtained for the influent sample on the second day of the experiment, which was reduced to 3.6 ± 0 mg/L, 4.8 ± 0 mg/L, and 4.83 ± 0 mg/L by P. stratiotes, S. molesta, and E. crassipes, respectively. On the 14th day, the nitrate concentration of the influent sample before treatment was 7.81 ± 0.02 mg/L, but after the phytoremediation process, the nitrate concentrations of the treated wastewater samples were reduced to 2.3 ± 0.1 mg/L by P. stratiotes, 3.5 ± 0.1 mg/L by S. molesta, and 2.2 ± 0 by E. crassipes. Furthermore, the highest reduction efficiency of 77.55% was recorded for the P. stratiotes treatment systems on the 12th day. At the same time, the maximum reduction efficiencies of 55.29% and 73.33% were obtained for the S. molesta and E. crassipes treatment systems on the 14th day of the sampling period. Additionally, the ANOVA test indicated a significant difference (p < 0.05) between the influent and effluent wastewater samples with a 6 h retention time.
Based on the results presented in Figure 13, the average nitrate values of the influent samples from the STP varied throughout the duration of the research and ranged from 3.8–10.83 mg/L. According to the analysis that was carried out, the results obtained show that the average nitrate value of the influent wastewater sample obtained on the second day of the experiment was lowered from 3.8 ± 0 mg/L to 2.2 ± 0 mg/L, 1.0 ± 0 mg/L, and 1.43 ± 0.05 mg/L by the P. stratiotes, S. molesta, and E. crassipes plants, respectively. However, as the sampling period continued, a significant decrease in the initial nitrate values of all the influent samples continued onward up to the last day of the sampling period. Similarly, the nitrate concentration of the influent sample on the 14th day of the phytoremediation process was recorded as 9.52 ± 0.10 mg/L, but after the treatment with the test plants, the nitrate concentrations were reduced to 3.01 ± 0.02 mg/L, 2.2 ± 1 mg/L, and 3.04 ± 0.01 mg/L by the P. stratiotes, S. molesta, and E. crassipes treatment systems, respectively. The highest removal efficiencies of 68.38% and 68.06% were recorded for the P. stratiotes and E. crassipes effluent samples, respectively, on the 14th day. At the same time, the highest removal efficiency of 82.9% was recorded for the S. molesta effluent samples on the fourth day of the sampling period. Furthermore, a significant variance (p < 0.05) was found between the average values of the influent and the individual effluent wastewater samples.
From Figure 14, the average nitrate level of the influent samples obtained from the STP varied throughout the sampling period and ranged from 5.4–20 mg/L. However, it was observed that the three test plants efficiently decreased the initial nitrate concentration throughout the sampling period. Similarly, on the second day of the experiment, the test plants decreased the nitrate concentration of the influent samples from 20 ± 0.1 mg/L to 9.05 ± 0.01 mg/L, 13.6 ± 0 mg/L, and 9.8 ± 0.17 mg/L for P. stratiotes, S. molesta, and E. crassipes, respectively. On the 10th day of the study period, the initial nitrate value recorded for the influent samples (5.4 ± 0.1 mg/L) was lowered to 1.2 ± 0.1 mg/L, 1.0 ± 0 mg/L, and 1.7 ± 0.1 mg/L by the P. stratiotes, S. molesta, and E. crassipes plants, respectively. Furthermore, it was observed that the minimum and maximum nitrate reduction efficiencies for the P. stratiotes effluent samples were obtained on the 2nd and 12th days of the sampling period with values of 54.75% and 83.6%, respectively. The minimum and maximum reduction efficiencies for the S. molesta effluent samples were found to be 32% and 92.1% on the 2nd and 14th days of the experiment, and for E. crassipes, the minimum and maximum percentage reduction efficiencies of the effluent samples were recorded as 41% and 93% on the 6th and 14th days of the experiment, respectively. Moreover, the ANOVA test indicated that the difference between the influent and the effluent samples was significant (p < 0.05).
4. Discussion
Turbidity is the cloudiness of water [23] that occurs as a result of suspended materials, such as clay, silt, organic material, plankton, and additional particulate materials found in water [24]. The present study evaluated the turbidity reduction efficiency in the phytoremediation process of domestic wastewater using P. stratiotes, S. molesta, and E. crassipes aquatic plants for a duration of 2 weeks with different retention times of 6, 12, and 24 h. After the 14-day phytoremediation process, the overall average turbidity values for the P.-stratiotes-, S.-molesta-, and E.-crassipes-treated wastewater samples with a 6 h retention time were recorded as 7.58 NTU (P. stratiotes), 12.82 NTU (S. molesta), and 9.61 NTU (E. crassipes) relative to the overall average influent turbidity value of 22.8 NTU. The overall average turbidity values for P. stratiotes, S. molesta, and E. crassipes with a 12 h retention time were found to be 9.97 NTU, 6.17 NTU, and 9.80 NTU, respectively, relative to the overall average influent turbidity value of 28.9 NTU. Furthermore, the average turbidity values for the P.-stratiotes-, S.-molesta-, and E.-crassipes-treated water samples with a retention time of 24 h were found to be 7.1 NTU, 3.7 NTU, and 5.93 NTU, respectively, relative to the overall average influent turbidity value of 34.9 NTU. In the overall experiment, a turbidity reduction efficiency of the influent wastewater samples of up to 93.9% was attained in the course of this study. These findings showed that P. stratiotes, S. molesta, and E. crassipes plants were effectual at refining the water quality properties of the secondary treated domestic wastewater. The ideal conditions for the effective reduction of the turbidity level for this present study were found in the S. molesta treatment systems with a retention time of 24 h; it was observed that the strength of the S. molesta plants regarding absorbing the excess nutrient declined when the retention time was decreased to 12 and 6 h. Furthermore, during the 14-day sampling period, the roots were observed to hold and filter the suspended solids through a process known as rhizofiltration. This action was possible due to the long hairy roots of the selected test plants. Root hairs carry an electrical current that draws in suspended solids, resulting in them being committed to the roots, where they are gradually digested and assimilated by the plants [25]. Furthermore, the shallow system of the hydroponic method of phytoremediation process used in this study played a key role in improving the clarity of the wastewater because it provided a conducive environment for the trapped suspended particle sediment at the ground level of the pond. At the same time, the polished/filter water stayed at the upper level of the pond. These findings showed that the selected plants were efficient at refining the water properties of the secondary treated domestic wastewater to the permissible Malaysian water standard of class I (5 NTU) from the 10th day to the final day of the sampling period with a retention time of 24 h. Aswathy [26] reported up to an 85.66% improvement of turbidity in the phytoremediation of kitchen wastewater by P. stratiotes after 10 days of retention time. Furthermore, Parwin and Paul [27] indicated that E. crassipes improved the wastewater quality significantly, as up to an 86.75% turbidity reduction was achieved in the treatment of kitchen wastewater samples during the 4-week study period.
For the phosphate reduction analysis, with a 6 h retention time, overall average phosphate reductions of 3.97 mg/L (P. stratiotes), 4.29 mg/L (S. molesta), and 3.65 mg/L (E. crassipes) were obtained relative to the average phosphate level of 5.08 mg/L of the influent wastewater samples. For the 12 h retention time, overall average phosphate concentrations of 4.38 mg/L (P. stratiotes), 4.11 mg/L (S. molesta), and 2.5 mg/L (E. crassipes) were recorded relative to the average phosphate level of 5.50 mg/L of the influent wastewater samples. Similarly, overall average phosphate reductions of 4.46 mg/L, 5.45 mg/L, and 2.92 mg/L were observed for the 24 h treatment systems relative to the average phosphate level of 11.01 mg/L of the influent wastewater samples. These results proved that the plants reduced the phosphate concentration of the influent samples to varying degrees. The intrinsic variances in macronutrient requirements for physiological processes may have attributed to the alterations detected by the three plants [28]. Similarly, a rise in phosphate levels during the sampling period was observed on the 10th day with a 6 h retention time. However, the findings of this present study demonstrated that the treatment systems with 6 and 12 h retention times did not provide favorable conditions for the plant roots to absorb and assimilate the phosphates present in the wastewater samples. Thus, these findings strongly agree that retention time is a fundamental factor that determines and controls the rate at which nutrient absorption and assimilation by plants takes place in plant-based wastewater treatment systems.
Furthermore, the overall results obtained from the three treatment systems (6, 12, and 24 h retention times) show that E. crassipes displayed better properties regarding absorbing the excess phosphate concentration in the wastewater samples than the P. stratiotes and S. molesta plants. Furthermore, phosphorous is a macronutrient of plants. It is also a chief constituent in adenosine diphosphate (ADP) and adenosine triphosphate (ATP), which is critical for energy storage. It also aids in energy transfer in photosynthesis and respiration, and is essential in the formation of ADP and ATP, and the building of their biochemical structural components, such as the nucleic acids, nucleotides, and sugar building up their biomass [28]. Hence, a significant quantity of phosphate, or more precisely, free orthophosphate was taken up from the wastewater throughout the 14 days. Therefore, the phytoremediation systems helped to reduce the phosphate concentration in the water body significantly and steadily. Additionally, the reduction of phosphorous was similarly testified by many authors in other research works that found effective nitrogen and phosphorous removal by E. crassipes [29]. Furthermore, the results obtained from this study corroborate with the report of Nizam et al. [13], who stated that to treat phosphate in wastewater; E. crassipes was the best plant among five species (P. stratiotes, I. aquatica, S. molesta, C. asiatica, and E. crassipes). Aquatic plant species have long fibrous roots that have the ability to provide an extensive surface area for the plant to carry out physical, chemical, and microbial processes for nutrient absorption and nitrification processes [30]. Henry-Silva et al. [31] reported up to 82%, 83.3%, and 72.1% reductions in phosphorous by E. crassipes, P. stratiotes, and S. molesta from Nile tilapia pond wastewater.
For ammoniacal nitrogen reduction, the overall results demonstrated that an up to 80–90% ammoniacal nitrogen reduction was achieved by the cultivation of the test plants in wastewater samples. Similarly, overall average ammoniacal nitrogen reductions of 15.10 mg/L (P. stratiotes), 16.33 mg/L (S. molesta), and 14.76 mg/L (E. crassipes) were achieved relative to the average ammoniacal nitrogen of 18.23 mg/L of the influent wastewater samples with a 6 h retention time. For the 12 h retention time, overall average ammoniacal nitrogen reductions of 13.62 mg/L (P. stratiotes), 14.60 mg/L (S. molesta), and 14.26 mg/L (E. crassipes) were recorded relative to the average ammoniacal nitrogen concentration of 20.01 mg/L of the influent wastewater samples. Similarly, overall average ammoniacal nitrogen concentrations of 9.08 (P. stratiotes) mg/L, 9.05 mg/L (S. molesta), and 8.25 mg/L (E. crassipes) were observed for the 24 h treatment systems relative to the average ammoniacal nitrogen level of 21.26 mg/L of the influent wastewater samples. Additionally, the maximum ammoniacal nitrogen reduction percentages for the P. stratiotes, S. molesta, and E. crassipes treatment systems were found to be 88.66%, 90.47%, and 89.11%, respectively, on the 14th day of the experiment with a 24 h retention time. Therefore, the overall trend of the reduction efficiency for the three treatment systems was in the pattern of 24 h > 12 h > 6 h. As such, the findings obtained from this present indicated that the 6 h retention treatment was not ideal or efficient for the selected test plants to take up a substantial amount or break down the ammoniacal nitrogen present in the influent wastewater samples. This could be attributed to the short contact time observed in the 6 h treatment systems. Furthermore, plants take up nutrients through both direct (i.e., plant uptake) and indirect (microbial activity at rhizosphere) ways; plants play a significant role in absorbing ammoniacal nitrogen from wastewater. For plant uptake to support biomass growth and development, ammoniacal nitrogen present in wastewater can be directly absorbed by roots, either via accumulation in the plant parts or assimilation by the plant in nitrogen-transported amino acids [32,33]. By way of the acceleration of nitrogen decomposition in the rhizosphere, an enhancement of other elements’ activity, and an improvement in bioavailability, microbial activity is another major route to remove nitrogen through plant uptake [34]. Additionally, the results obtained from the 12 and 24 h retention time scenarios corroborates with the findings reported by Nivetha et al. [35], who reported an up to 84.8% ammoniacal nitrogen reduction from sewage wastewater by P. stratiotes. Furthermore, Parwin and Paul [27] recorded an up to 94.36% removal of ammoniacal nitrogen from kitchen wastewater samples using E. crassipes.
For the nitrate analysis, the overall results showed that the three tested aquatic plants were effective at removing nitrate from the wastewater samples. For the 6 h retention time, overall average nitrate reductions of 2.74 mg/L (P. stratiotes), 4.1 mg/L (S. molesta), and 3.47 mg/L (E. crassipes) were found relative to the average nitrate level of 7.05 mg/L of the influent samples. For the 12 h retention time, the overall average nitrate concentrations of 3.6 mg/L (P. stratiotes), 2.71 mg/L (S. molesta), and 3.45 mg/L (E. crassipes) were recorded relative to the average nitrate concentration of 8.52 mg/L of the influent samples. Overall average nitrate reductions of 4.03 mg/L (P. stratiotes), 4.85 mg/L (S. molesta), and 3.95 mg/L (E. crassipes) were observed for the 24 h treatment systems relative to the average nitrate concentration of 12.05 mg/L of the influent samples. Among the three wastewater treatment (6, 12, and 24 h) systems, the 24 h retention system showed a better performance in the nitrate uptake compared to the 6 and 12 h retention time treatment systems. Furthermore, the outcome of this research demonstrated that E. crassipes and S. molesta plants exhibited higher efficiencies regarding nitrate uptake relative to P. stratiotes plants at 12 and 24 h retention times. Similarly, rapid growth was observed in all three test plants, which contributed to the high nitrate uptakes into the plant roots in the 12 and 24 h treatment systems. For the 12 h treatment system, S. molesta (82.90%) performed better than E. crassipes (68.38%) and P. stratiotes (68.06%). The trend of the nitrate reduction efficiency for the three test plants with a retention time of 6 h was in the order of P. stratiotes > E. crassipes > S. molesta. Furthermore, it was observed that the water quality of the influent nitrate concentration was improved to class I by the test plants from the 6th day to the 14th day of the sampling period with a 24 h retention time. Additionally, the findings obtained by the 24 h treatment systems agrees with the nitrate reduction results reported by [35]. Ingersoll and Baker [36] recorded up to 90%, 51%, and 36% nitrate removals in the phytoremediation of synthetic wastewater using E. crassipes, P. stratiotes, and S. molesta, respectively. Ayyasamy et al. [37] reported an up to 61–83% nitrate removal by E. crassipes from a synthetic medium. Ng and Chan [38] reported that the phytoremediation of synthetic wastewater by S. molesta plants yielded up to 36%, 19%, and 31% removal of phosphate, nitrate, and ammonia, respectively.
5. Conclusions
The present study evaluated the potentials of Pistia stratiotes, Salvinia molesta, and Eichhornia crassipes aquatic weed plants in the tertiary treatment of secondary domestic wastewater using hydroponic systems with different retention times. The outcome of the study indicated that a noteworthy reduction of the turbidity, as well as the phosphate, ammoniacal nitrogen, and nitrate concentrations, was obtained after the cultivation of the test plants. The best performance was observed with a 24 h retention treatment system, with up to 91% (P. stratiotes), 94% (S. molesta), and 89.3% (E. crassipes) reductions for turbidity; 81.2% (P. stratiotes), 82.7% (S. molesta), and 88.5% (E. crassipes) for the phosphate reductions, 88.66% (P. stratiotes), 90.47% (S. molesta), and 89.11% (E. crassipes) for the ammoniacal nitrogen reductions; 83.6% (P. stratiotes), 92.1% (S. molesta), and 93% (E. crassipes) for the nitrate reductions. The effluent samples obtained after the phytoremediation were safe to be discharged into the environment. Thus, the application of hydroponic systems in the cultivation of the macrophytes proved to be effective in the phytoremediation process (removing the residual nutrients present in the treated secondary domestic wastewater). In addition, this method can be used in the cultivation of plant-based biomass and other non-edible useful crops using the free nutrient content of the wastewater before discharge into the natural environment.
Author Contributions
Conceptualization, G.H. and H.M.M.; methodology, G.H.; validation, G.H. and H.M.M.; formal analysis, G.H. and H.M.M.; investigation, H.M.M.; resources, G.H. and H.M.M.; data curation, G.H. and H.M.M.; writing—original draft preparation, H.M.M.; writing—review and editing, H.M.M.; visualization, G.H. and H.M.M.; supervision, G.H.; project administration, G.H.; funding acquisition, G.H. All authors have read and agreed to the published version of the manuscript.
Funding
This research was funded by the Universiti Tenaga Nasional (UNITEN) under the iRMC BOLD Publication Fund.
Conflicts of Interest
The authors declare no conflict of interest.
References
- Mostafa, S.S.M.; Shalaby, E.A.; Mahmoud, G. Cultivating Microalgae in Domestic Wastewater for Biodiesel Production. Not. Sci. Biol. 2012, 4, 56–65. [Google Scholar] [CrossRef]
- Mustafa, H.M.; Hayder, G.; Jagaba, A. Microalgae: A Sustainable Renewable Source for Phytoremediation of Wastewater and Feedstock Supply for Biofuel Generation. Biointerface Res. Appl. Chem. 2021, 11, 7431–7444. [Google Scholar] [CrossRef]
- Thongtha, S.; Teamkao, P.; Boonapatcharoen, N.; Tripetchkul, S.; Techkarnjararuk, S.; Thiravetyan, P. Phosphorus removal from domestic wastewater by Nelumbo nucifera Gaertn. and Cyperus alternifolius L. J. Environ. Manag. 2014, 137, 54–60. [Google Scholar] [CrossRef] [PubMed]
- Kutty, S.; Ngatenah, S.; Isa, M.; Malakahmad, A. Nutrients removal from Municipal Wastewater Treatment Plant Effluent Using Eichhornia Crassipes. World Acad. Sci. Eng. Technol. 2009, 60, 1115–1123. [Google Scholar]
- Meena, R.A.A.; Yukesh Kannah, R.; Sindhu, J.; Ragavi, J.; Kumar, G.; Gunasekaran, M.; Rajesh Banu, J. Trends and resource recovery in biological wastewater treatment system. Bioresour. Technol. Rep. 2019, 7. [Google Scholar] [CrossRef]
- Lal, A. Salvinia Molesta: An Assessment of the Effects and Methods of Eradication. USF Scholarship: A Digital Repository @ Gleeson Library|Geschke Center. Master’s Thesis, The University of San Francisco, San Francisco, CA, USA, 2016. [Google Scholar]
- Oswald, W. Microalgae and wastewater treatment. In Micro-Algal Biotechnology; Borowitzka, M.A., Borowitzka, L.J., Eds.; Micro-Algal Biotechnology; Cambridge University Press: Cambridge UK, 1988; pp. 305–328. [Google Scholar]
- Abdel-Raouf, N.; Al-Homaidan, A.A.; Ibraheem, I.B.M. Microalgae and wastewater treatment. Saudi J. Biol. Sci. 2012, 19, 257–275. [Google Scholar] [CrossRef]
- United States Department of Agriculture (USDA). The plant database, National Plant Data Team 2019. NRCS, Greensboro, NC 27401-4901, USA, 2019. Available online: https://plants.usda.gov (accessed on 3 November 2019).
- Mustafa, H.M.; Hayder, G. Recent studies on applications of aquatic weed plants in phytoremediation of wastewater: A review article. Ain Shams Eng. J. 2020. [Google Scholar] [CrossRef]
- Qin, H.; Zhang, Z.; Liu, M.; Liu, H.; Wang, Y.; Wen, X.; Zhang, Y.; Yan, S. Site test of phytoremediation of an open pond contaminated with domestic sewage using water hyacinth and water lettuce. Ecol. Eng. 2016, 95, 753–762. [Google Scholar] [CrossRef]
- Jehawi, O.H.; Abdullah, S.R.S.; Kurniawan, S.B.; Ismail, N.I.; Idris, M.; Al Sbani, N.H.; Muhamad, M.H.; Hasan, H.A. Performance of pilot Hybrid Reed Bed constructed wetland with aeration system on nutrient removal for domestic wastewater treatment. Environ. Technol. Innov. 2020, 19, 100891. [Google Scholar] [CrossRef]
- Nizam, N.U.M.; Hanafiah, M.M.; Noor, I.M.; Karim, H.I.A. Efficiency of five selected aquatic plants in phytoremediation of aquaculture wastewater. Appl. Sci. 2020, 10, 2712. [Google Scholar] [CrossRef]
- Nelson, L.S. Chapter 13.4: Giant and Common Salvinia. In Biology and Control of Aquatic Plants: A Best Management Practices Handbook; Gettys, L.A., Haller, W.T., Bellaud, M., Eds.; Aquatic Ecosystem Restoration Foundation: Marietta, GA, USA, 2009; pp. 105–112. [Google Scholar]
- Holm, L.; Plucknett, D.; Pancho, J.; Herberger, J. ‘The World’s Weeds, Distribution and Biology; East-West Center, University Press of Hawaii: Honolulu, HI, USA, 1977. [Google Scholar]
- Rezania, S.; Din, M.; Taib, S.; Dahalan, F.; Songip, A.; Singh, L.; Hesam, K. The Efficient Role of Aquatic Plant (Water Hyacinth) in Treating Domestic Wastewater in Continuous System The Efficient Role of Aquatic Plant (Water Hyacinth) in Treating Domestic Wastewater in Continuous System. Int. J. Phytoremediation 2015. [Google Scholar] [CrossRef]
- McLeod, S.A. What a p-Value Tells You about Statistical Significance. Available online: https://www.simplypsychology.org/p-value.html (accessed on 8 December 2020).
- Valipour, A.; Raman, V.K.; Ahn, Y.H. Effectiveness of domestic wastewater treatment using a Bio-hedge water hyacinth wetland system. Water 2015, 7, 329–347. [Google Scholar] [CrossRef]
- International Organisation for Standardization. Water Quality—Determination of Turbidity; ISO 7027; International Organization for Standardization: Geneva, Switzerland, 1999; 10p. [Google Scholar]
- Hach Company. Phosphorous, Reactive (Orthophosphate) Method 8048 (DOC316.53.01119), 10th ed.; Water Analysis Handbook; Hach Company: Loveland, CO, USA, 2017. [Google Scholar]
- Hach Comapany. Nitrogen, Ammonia, Method 8038 (DOC316.53.01078), 9th ed.; Water Analysis Handbook; Hach Company: Loveland, CO, USA, 2017. [Google Scholar]
- Hach Company. Cadmium reduction method, Method 8039 (DOC316.53.01066), 10th ed.; Water Analysis Handbook; Hach Company: Loveland, CO, USA, 2019. [Google Scholar]
- APHA. Standard Methods, 21st ed.; American Public Health Association: Washington, DC, USA, 2005. [Google Scholar]
- Alley, E. Water Quality Control Handbook; McGrawHill: New York, NY, USA, 2007. [Google Scholar]
- Johnson, C. Mechanism of Water Wetland Water Quality Interaction. In Constructed Wetland for Water Quality Improvement; Moshiri, G.A., Ed.; CRC (Lewis Publishers): Boca Raton, FL, USA, 1993. [Google Scholar]
- Aswathy, M. Wastewater treatment using constructed wetland with water lettuce (Eichornia Crasipies). Int. J. Civ. Eng. Technol. 2017, 8, 1413–1421. [Google Scholar]
- Parwin, R.; Paul, K.K. Phytoremediation of Kitchen Wastewater Using Eichhornia crassipes. J. Environ. Eng. 2019, 145, 1–10. [Google Scholar] [CrossRef]
- Tisdale, S.; Nelson, W.; Beaton, J.; Havlin, J. Elements Required in Plant Nutrition: Soil Fertility and Fertilizers; MacMillan Publ. Co.: New York, NY, USA, 1993. [Google Scholar]
- Wickramasinghe, S.; Jayawardana, C.K. Potential of aquatic macrophytes eichhornia crassipes, pistia stratiotes and salvinia molesta in phytoremediation of textile wastewater. J. Water Secur. 2018, 4. [Google Scholar] [CrossRef]
- Akinbile, C.O.; Ogunrinde, T.A.; Che bt Man, H.; Aziz, H.A. Phytoremediation of domestic wastewaters in free water surface constructed wetlands using Azolla pinnata. Int. J. Phytoremediation 2016, 18, 54–61. [Google Scholar] [CrossRef]
- Henry-Silva, G.G.; Camargo, A.F.M. Efficiency of aquatic macrophytes to treat Nile tilapia pond effluents. Sci. Agric. 2006, 63, 433–438. [Google Scholar] [CrossRef]
- Wu, W.; Liu, A.; Wu, K.; Zhao, L.; Bai, X.; Li, K.Z.; Ashraf, M.A.; Chen, L. The physiological and biochemical mechanism of nitrate-nitrogen removal by water hyacinth from agriculture eutrophic wastewater. Braz. Arch. Biol. Technol. 2016, 59, 1–10. [Google Scholar] [CrossRef]
- Deng, Y.; Ni, F. Review of Ecological Floating Bed Restoration in Polluted Water. J. Water Resour. Prot. 2013, 05, 1203–1209. [Google Scholar] [CrossRef]
- Ting, W.H.T.; Tan, I.A.W.; Salleh, S.F.; Wahab, N.A. Application of water hyacinth (Eichhornia crassipes) for phytoremediation of ammoniacal nitrogen: A review. J. Water Process Eng. 2018, 22, 239–249. [Google Scholar] [CrossRef]
- Nivetha, C.; Subraja, S.; Sowmya, R.; Induja, N.M. Water Lettuce for Removal of Nitrogen and Phosphate from Sewage. IOSR J. Mech. Civ. Eng. 2016, 13, 98–101. [Google Scholar] [CrossRef]
- Ingersoll, T.L.; Baker, L.A. Nitrate removal in wetland microcosms. Water Res. 1998, 32, 677–684. [Google Scholar] [CrossRef]
- Ayyasamy, P.M.; Rajakumar, S.; Sathishkumar, M.; Swaminathan, K.; Shanthi, K.; Lakshmanaperumalsamy, P.; Lee, S. Nitrate removal from synthetic medium and groundwater with aquatic macrophytes. Desalination 2009, 242, 286–296. [Google Scholar] [CrossRef]
- Ng, Y.S.; Chan, D.J.C. Phytoremediation capabilities of Spirodela polyrhiza, Salvinia molesta and Lemna sp. in synthetic wastewater: A comparative study. Int. J. Phytoremediation 2017, 20, 1179–1186. [Google Scholar] [CrossRef] [PubMed]


Publisher’s Note: MDPI stays neutral with regard to jurisdictional claims in published maps and institutional affiliations. |
© 2020 by the authors. Licensee MDPI, Basel, Switzerland. This article is an open access article distributed under the terms and conditions of the Creative Commons Attribution (CC BY) license (http://creativecommons.org/licenses/by/4.0/).