1. Introduction
In general, measurement of the light energy conversion efficiency in a phosphor, a solar cell, or a plant is not easy technically even though the principle is very simple, because it requires accurate measurement [
1] of irradiation light intensity and absorption efficiency (input power), total light emission energy, generated electric power, or metabolite yield (output power). As demonstrated in this paper, by contrast, if the photothermal spectrum can be measured over a wide spectral range showing the difference in shape from the absorption spectrum, the light energy conversion efficiency can be evaluated based on physically reasonable assumptions about thermal relaxation.
For most substances (especially condensed matter) excluding atoms in a vacuum, most of the excitation energy relaxation rate is dominated by a non-radiative thermal relaxation rate, where the energy is finally released as heat to the surroundings of the sample. As a method for measuring this heat generation, photothermal spectroscopy including photoacoustic spectroscopy has been carried out for a long time. Since the photothermal spectrum is a measure of the heat generation rather than the luminescence amount as a function of the excitation light wavelength, it will be referred to as the photothermal excitation spectrum (PTES) in the rest of this paper as a counterpart of the photoluminescence excitation spectrum (PLES). The advantage of PTES over PLES is that it can be applied to all samples because any material has a non-radiative relaxation process, which is the main relaxation process for most substances except highly fluorescent material. Relaxation between the higher excited states is dominated by a non-radiative thermal relaxation, while relaxation from the lowest excited state to the ground state is characterized by the increased apparent photoluminescence rate including both radiative and non-radiative rates k(apparent) = k(radiative) + k(non-radiative). Thus, information of relaxation paths is obtained by comparing PTES with the absorption spectrum or PLES. To emphasize this feature, PTES is also called the thermal relaxation spectrum in this paper.
However, in the long history of photothermal spectroscopy including photoacoustic spectroscopy, this capability of PTES has not been fully explored. Although there are many pioneering studies that have evaluated various quantum yields (luminescence, metabolite, or triplet-state formation via intersystem crossing) with these spectroscopic methods [
2,
3,
4,
5,
6,
7] there are only a few examples [
4] of PTES with a clear difference from PLES. One of the reasons is that thermal detection is less sensitive than luminescence detection, so that a laser is often used as an excitation light source, making it difficult to measure photothermal spectra over a wide wavelength region. Another reason is that highly luminescent material, which is expected to show a photothermal spectrum clearly different from the absorption spectrum, has a low heat-generation efficiency to make it difficult to obtain the photothermal spectrum.
The difference between the photothermal spectrum and absorption spectrum is expected to be relevant to the relaxation mechanism. Important examples may be in biological systems. For example, this kind of process may be taking place in higher plants: Excessive light energy causes damage to the photosynthetic system, so that excess energy is dissipated by heat dissipation process for the photosynthetic mechanism to be protected. Such a dissipation process is important in nature where the environment changes, known as non-photochemical quenching [
8]. Since this heat dissipation process is known to work even with the excitation intensity as weak as 5 mW/cm
2 @ 680 nm, it is necessary to measure the photothermal spectrum in the weak excitation limit for acquisition of the thermal relaxation spectrum reflecting the quantum efficiency of photosynthesis. In the past, however, the photothermal spectrum of a leaf has not been measured with sufficiently weak excitation, and an apparent difference between the photothermal and the absorption spectra has never been observed [
5].
In photothermal deflection spectroscopy (PDS), representative of photothermal conversion spectroscopy because it is said that PDS is by one order of magnitude more sensitive than photoacoustic spectroscopy (PAS) [
9], a laser is generally used as an excitation light source, and a sample is immersed in a medium having a large temperature coefficient of the refractive index (
dn/
dT) as the surrounding deflection medium, such as carbon tetrachloride. When a bright white light source such as a Xe lamp is used, the wavelength is often selected by a narrow band filter instead of a diffraction grating spectrometer having a low throughput. The typical spectral excitation light intensity in that case is 1 nW/μm
2 = 0.1 W/cm
2.
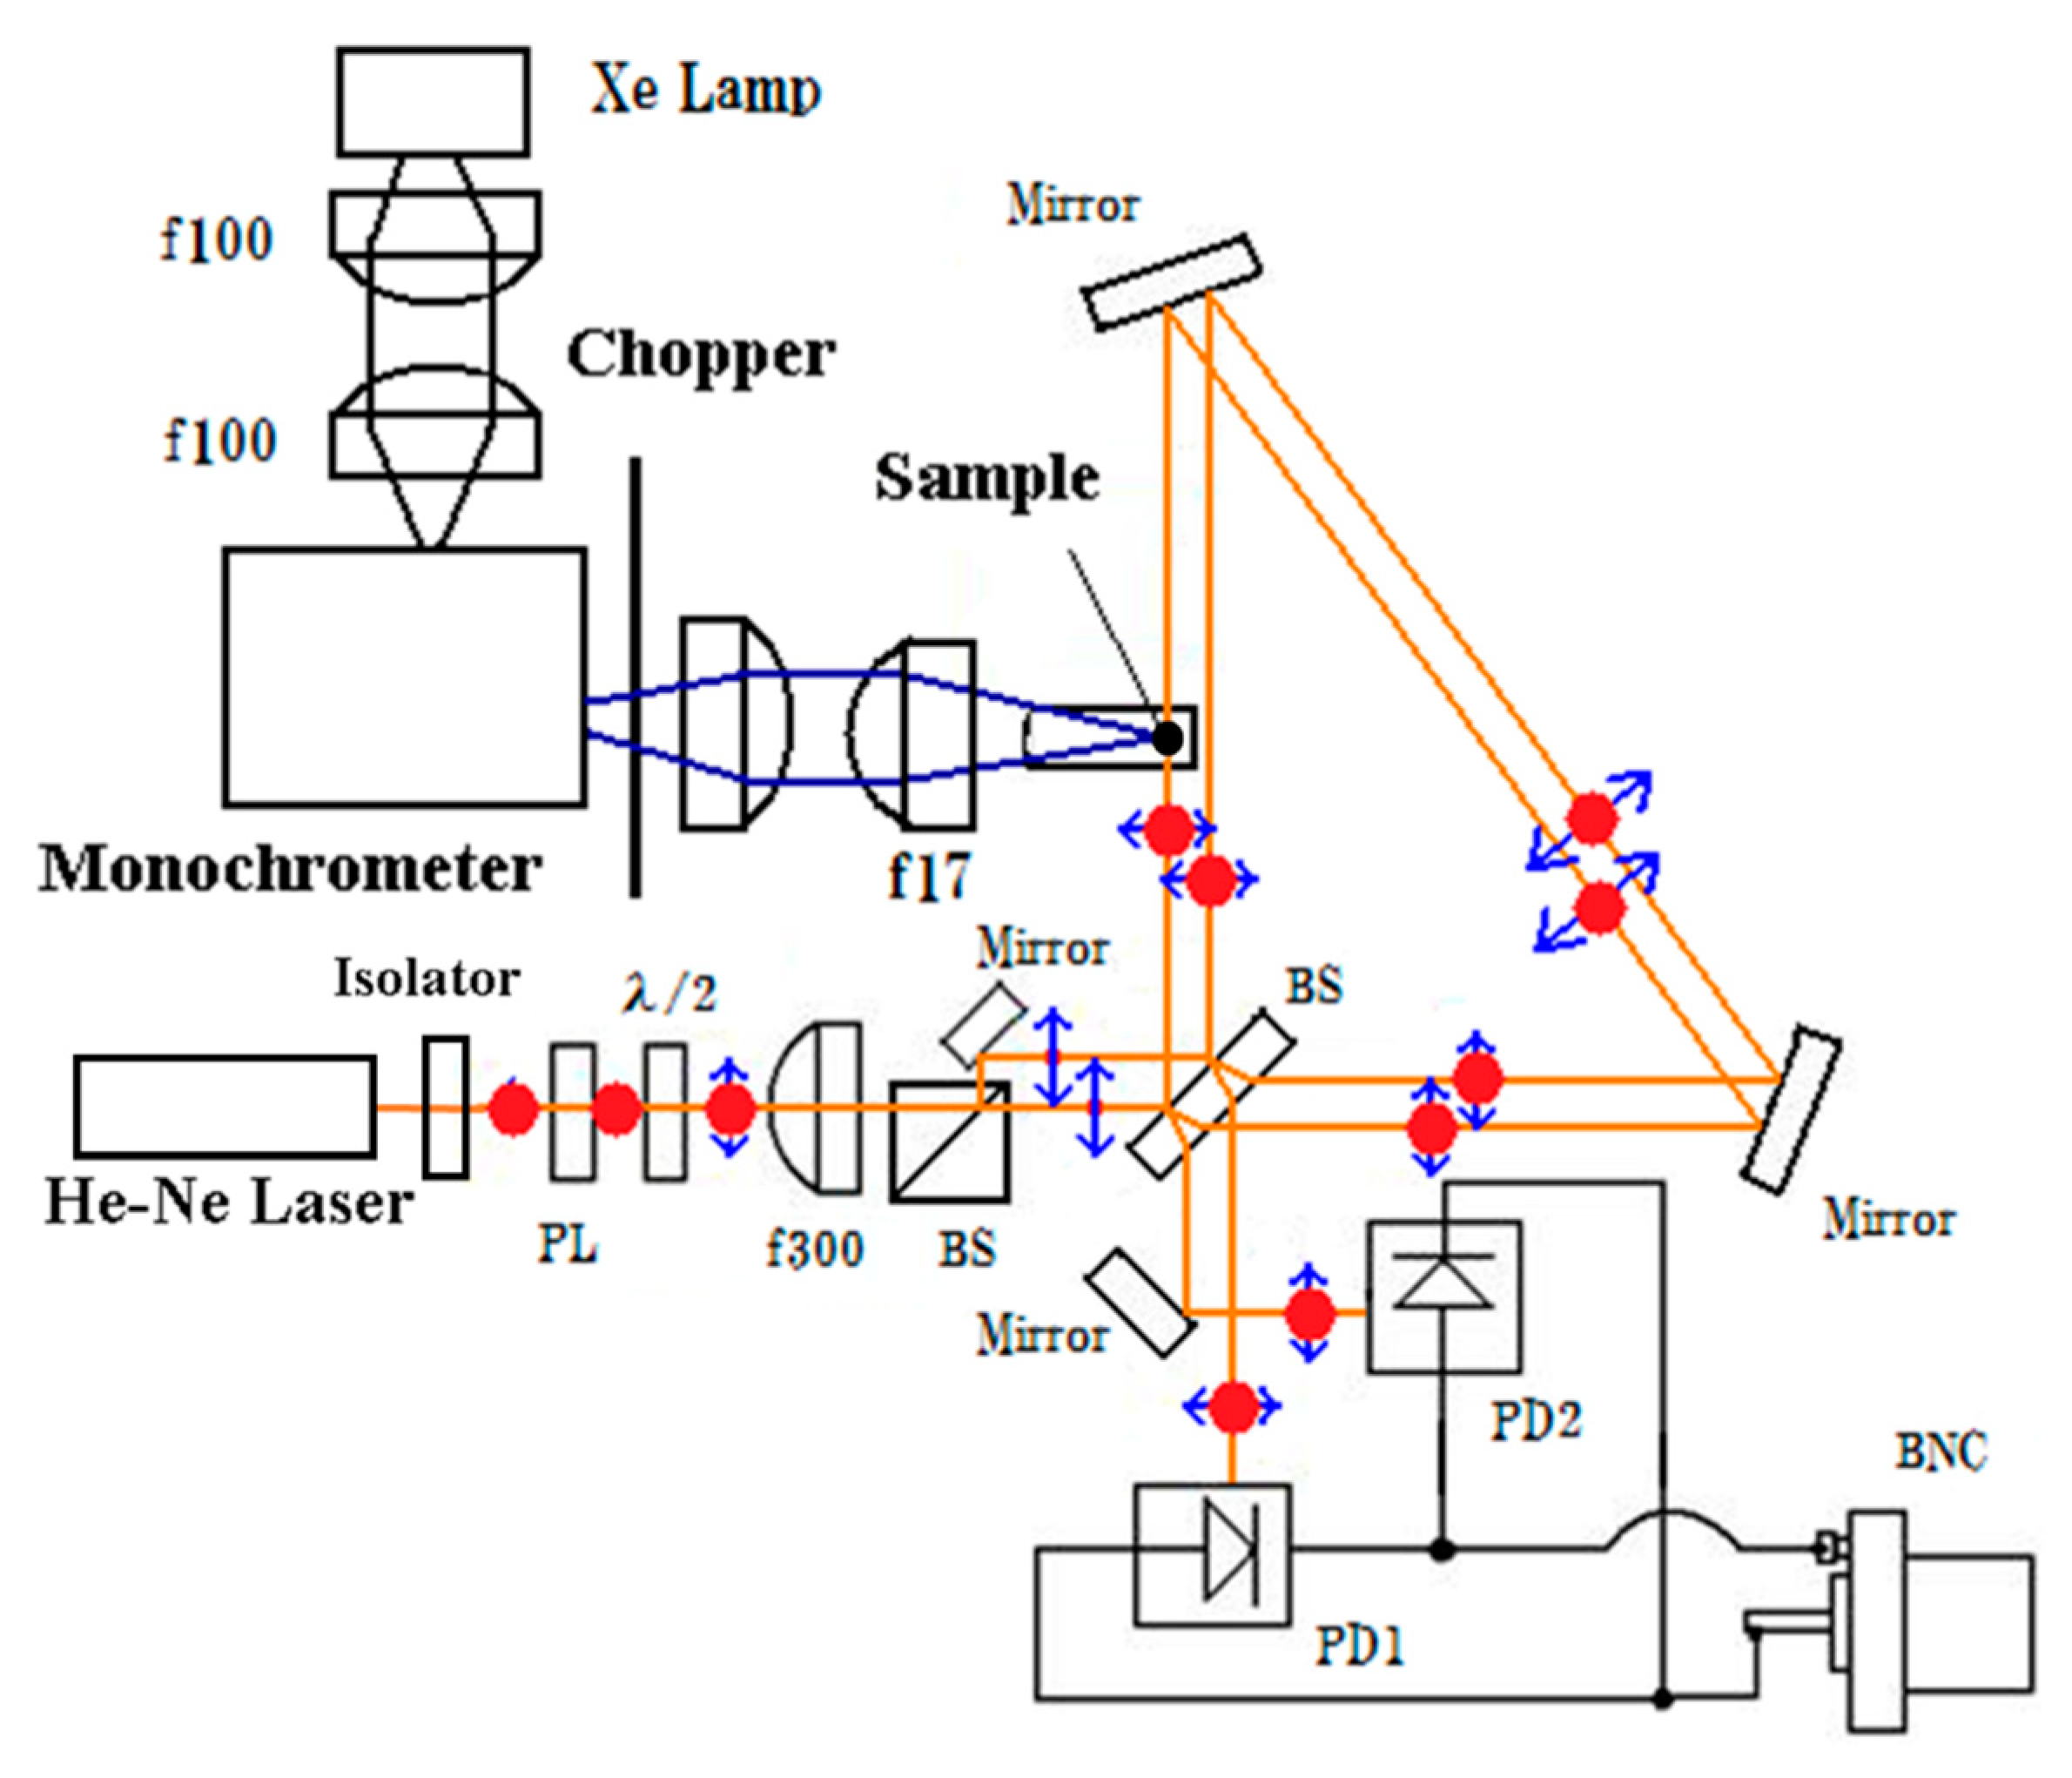
Since photothermal deflection spectroscopy detects heat generation accompanying non-radiative relaxation after light absorption of a specimen, many researches have been carried out since the analysis of its physical properties can be carried out non-destructively irrespective of the morphology of the specimen. Previously we developed the Sagnac-interferometer photothermal deflection spectroscopy (SIPDS) to improve the signal to noise ratio (S/N) by one order of magnitude (detectable temperature change 6 × 10
−5 K) [
10,
11] compared with the original report on PDS [
12]. As a result, measurement of broadband photothermal spectra is realized in the air by excitation with a weak narrow-spectrum light from a white-light lamp through a monochromator. The photothermal spectrum is equivalent to the absorption spectrum if 100% of the excitation energy is nonradiatively relaxed, but if it is converted to photoluminescence and/or chemical reaction energies, it becomes different from the absorption spectrum. The difference enables us to evaluate the quantum efficiency of luminescence or chemical energy conversion.
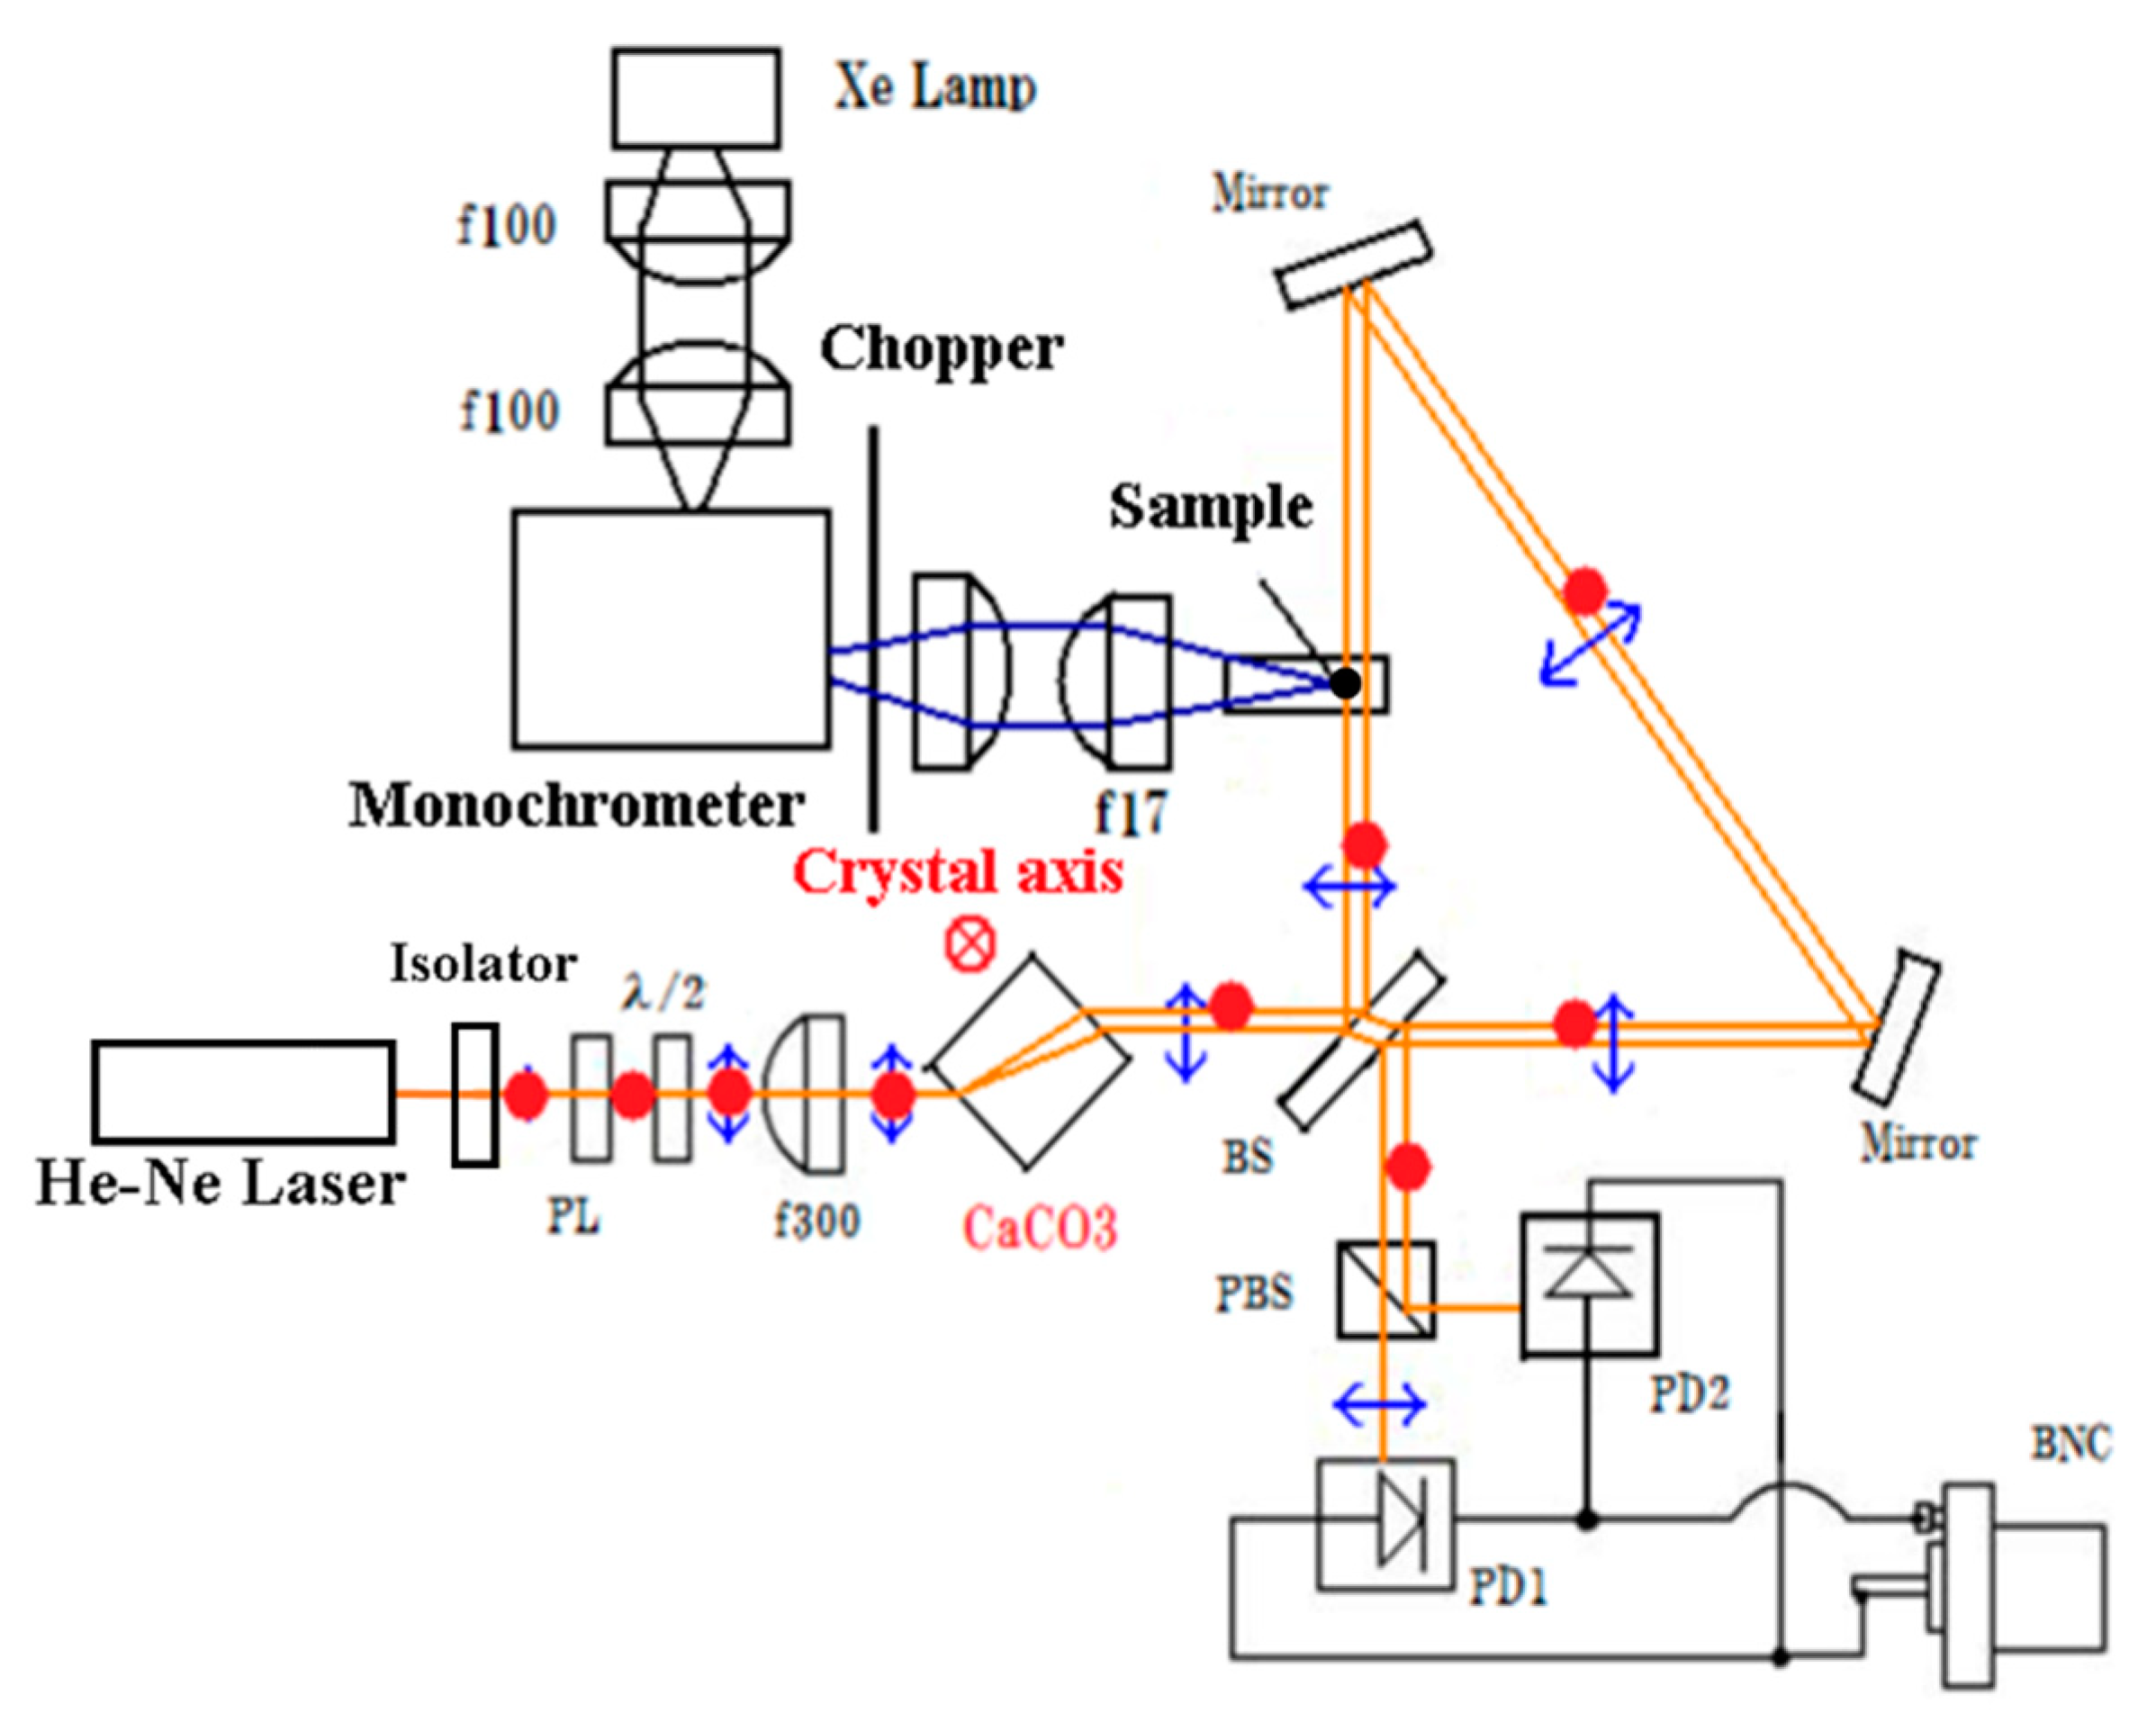
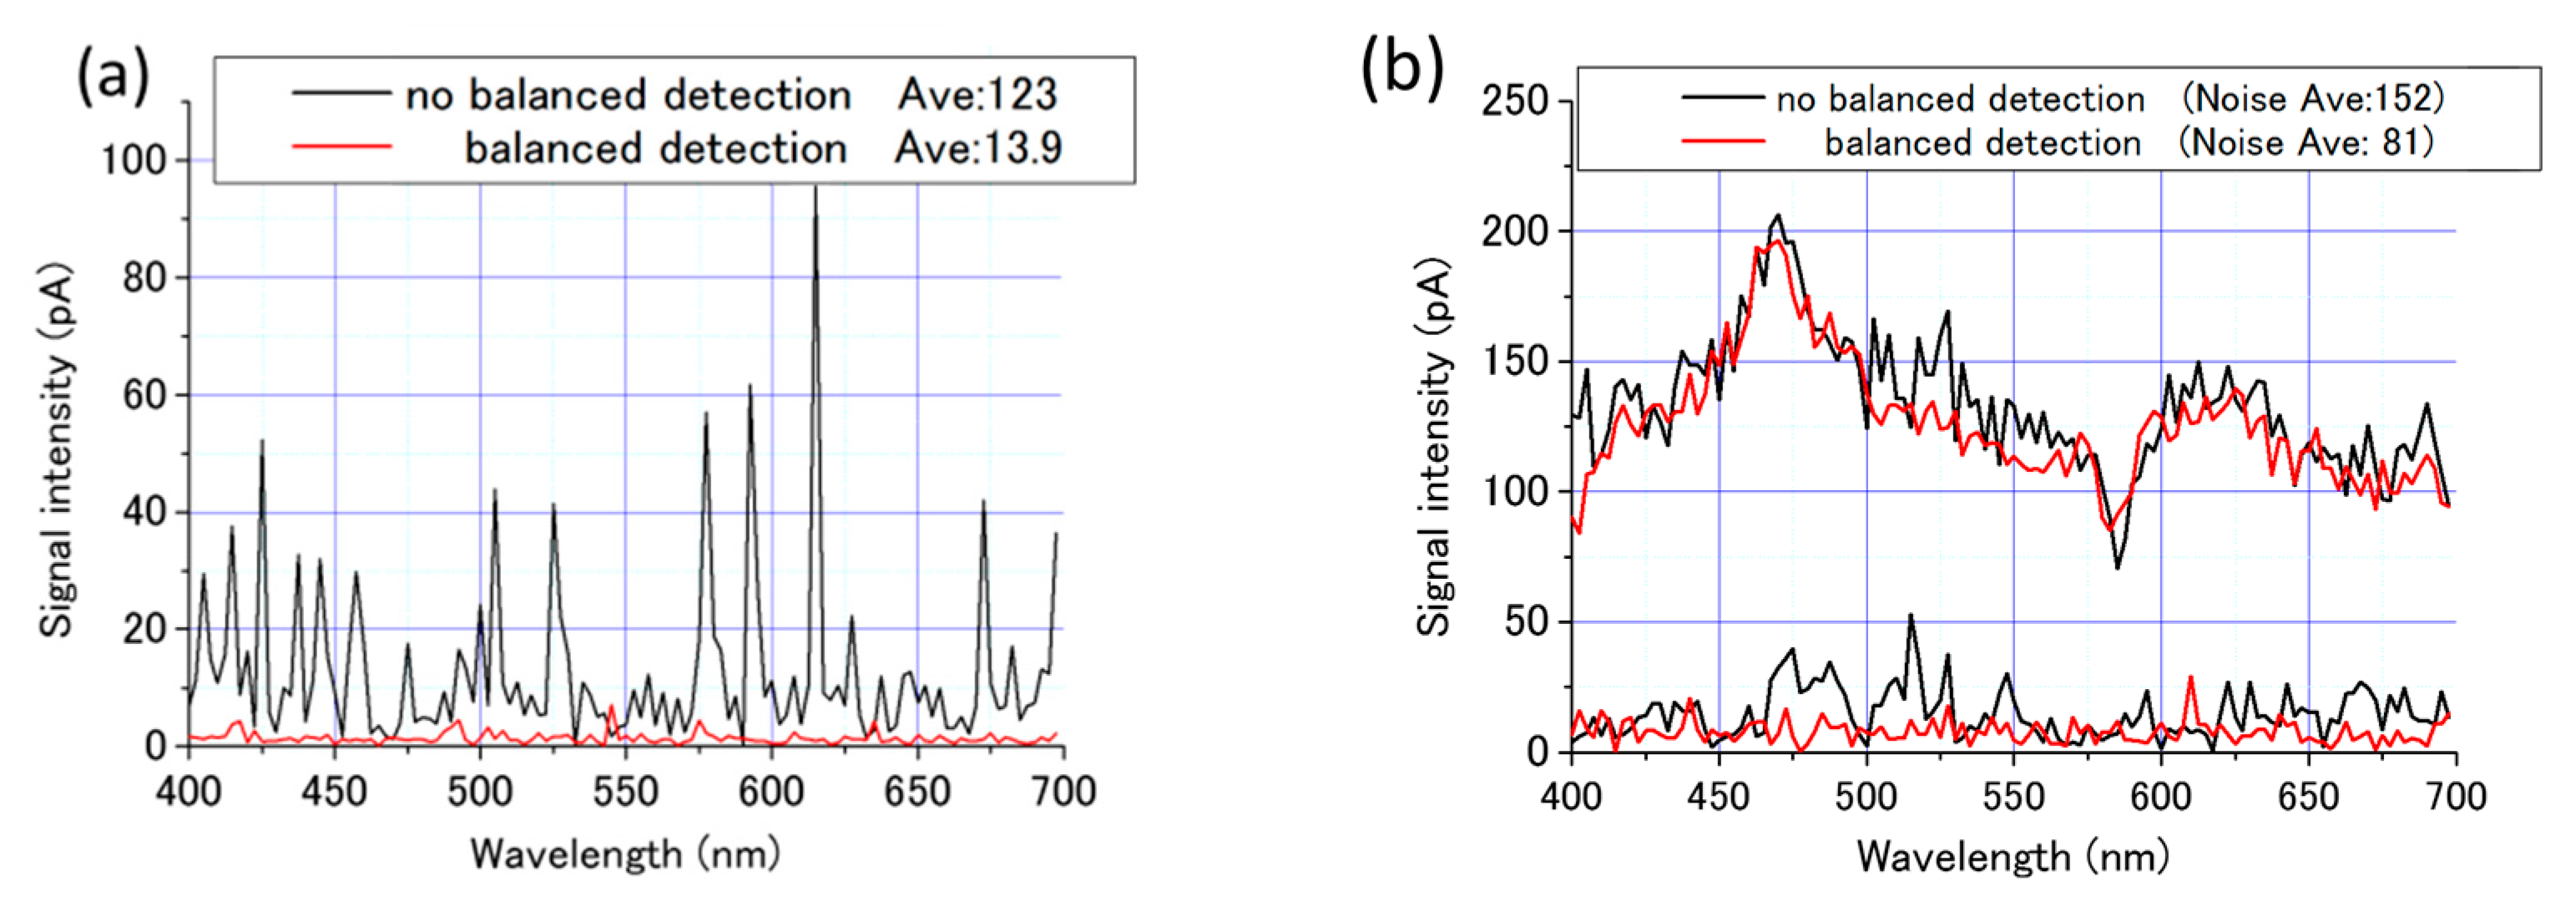
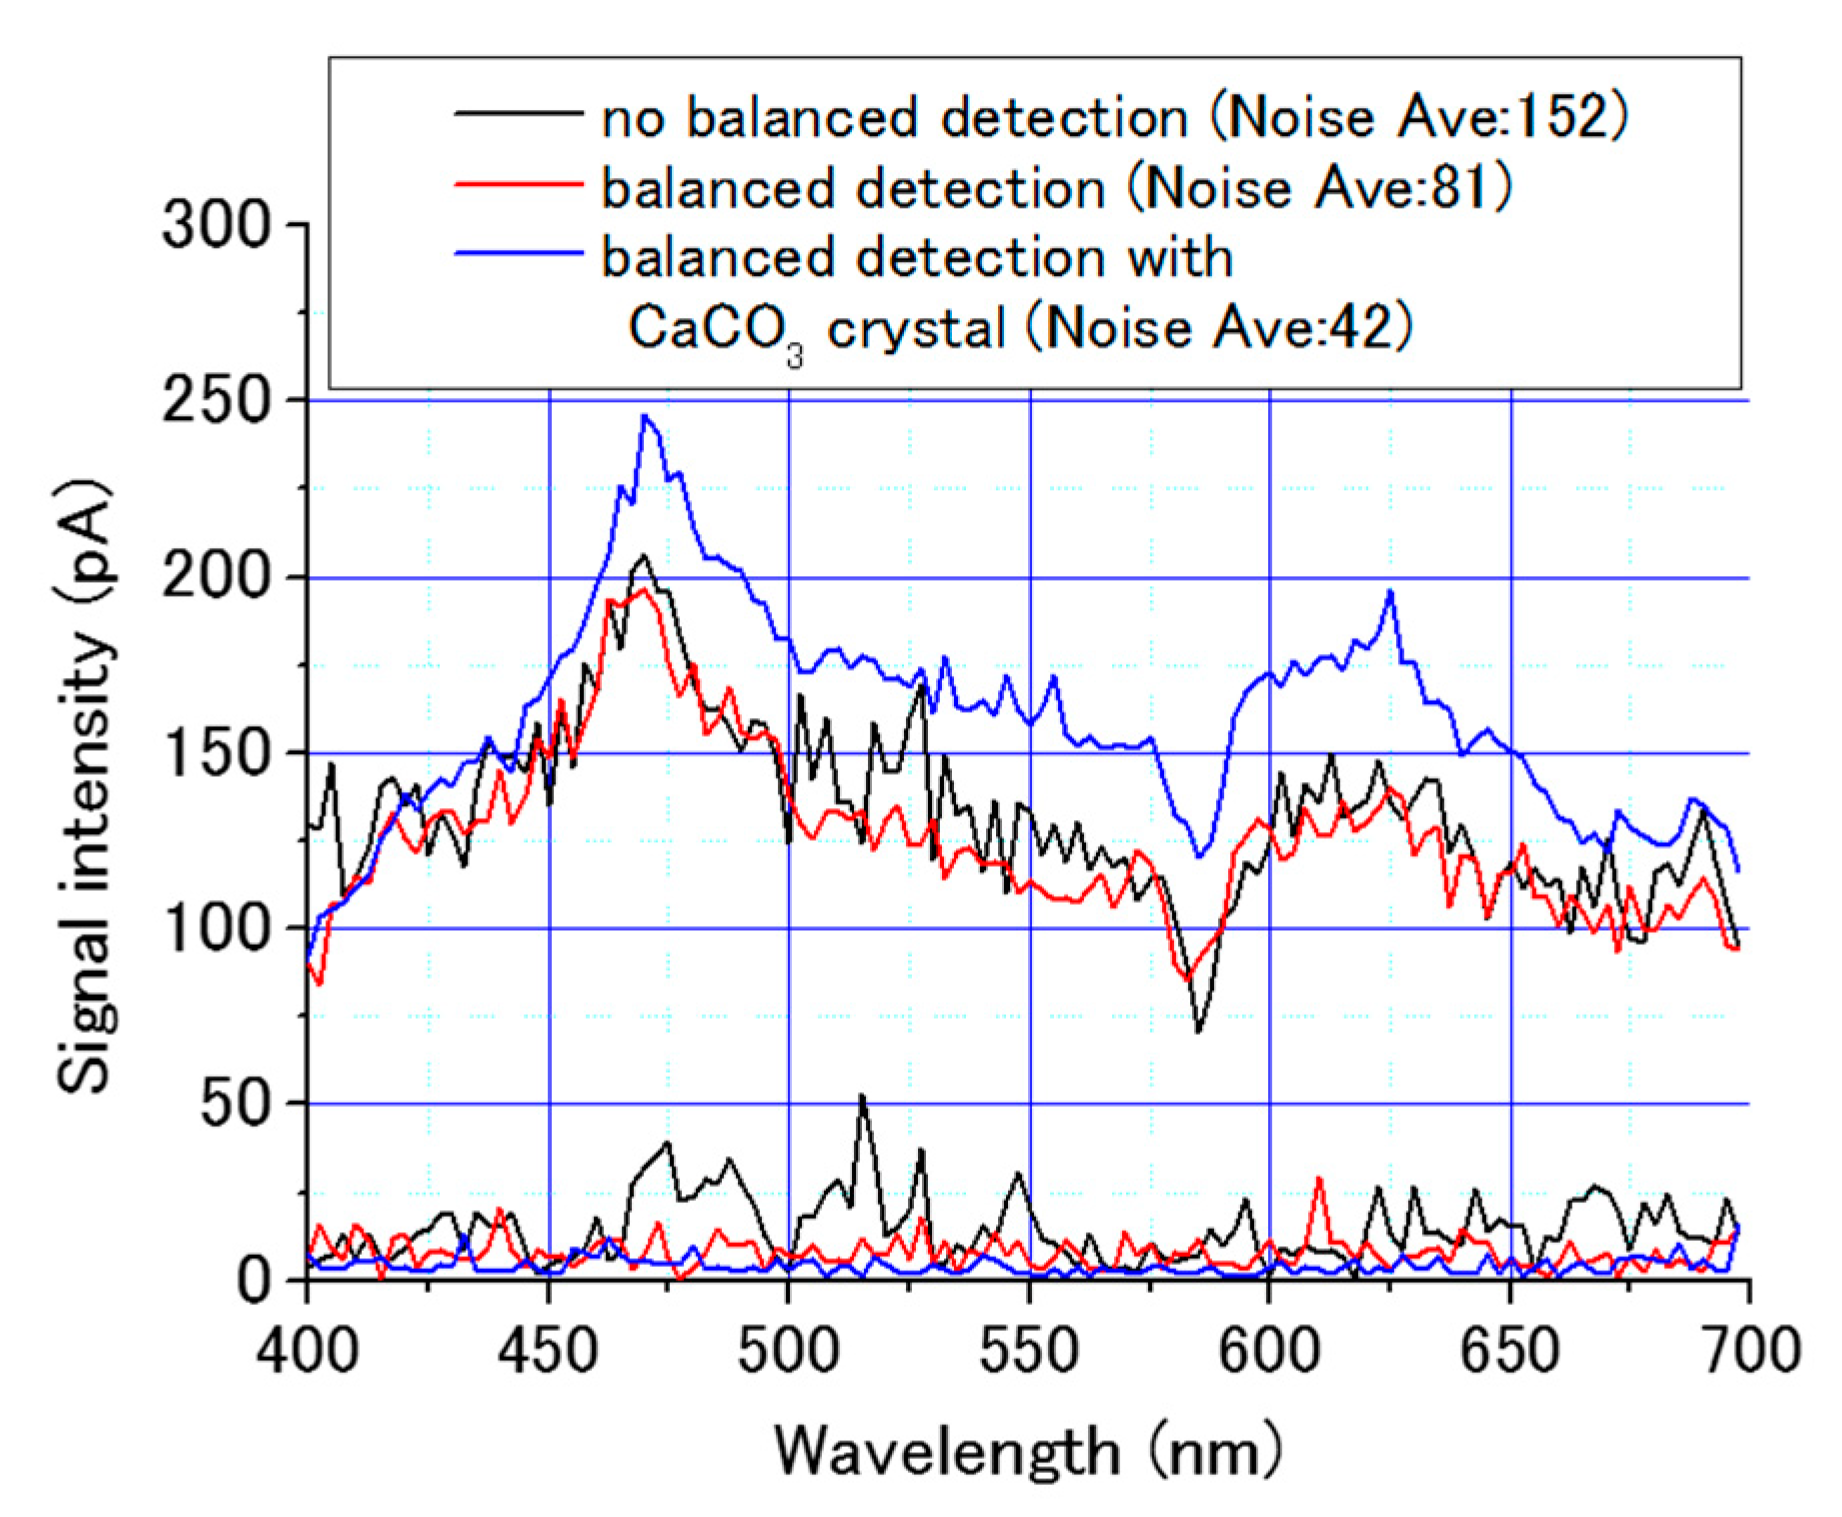
In this paper, we have implemented balanced detection into SIPDS and achieved fourfold improvement in S/N compared with SIPDS without balanced detection. We have applied this system to the measurement of photothermal excitation spectrum (PTES) of Eu
2+-doped CaAlSiN
3 phosphors [
13,
14] and estimated the luminescence quantum efficiency solely from comparison with the photoluminescence excitation spectrum (PLES), in good agreement with that measured independently by the absolute quantum efficiency measurement system using integrating sphere [
15].
4. Relation Between Photothermal and Photoluminescence Excitation Spectra
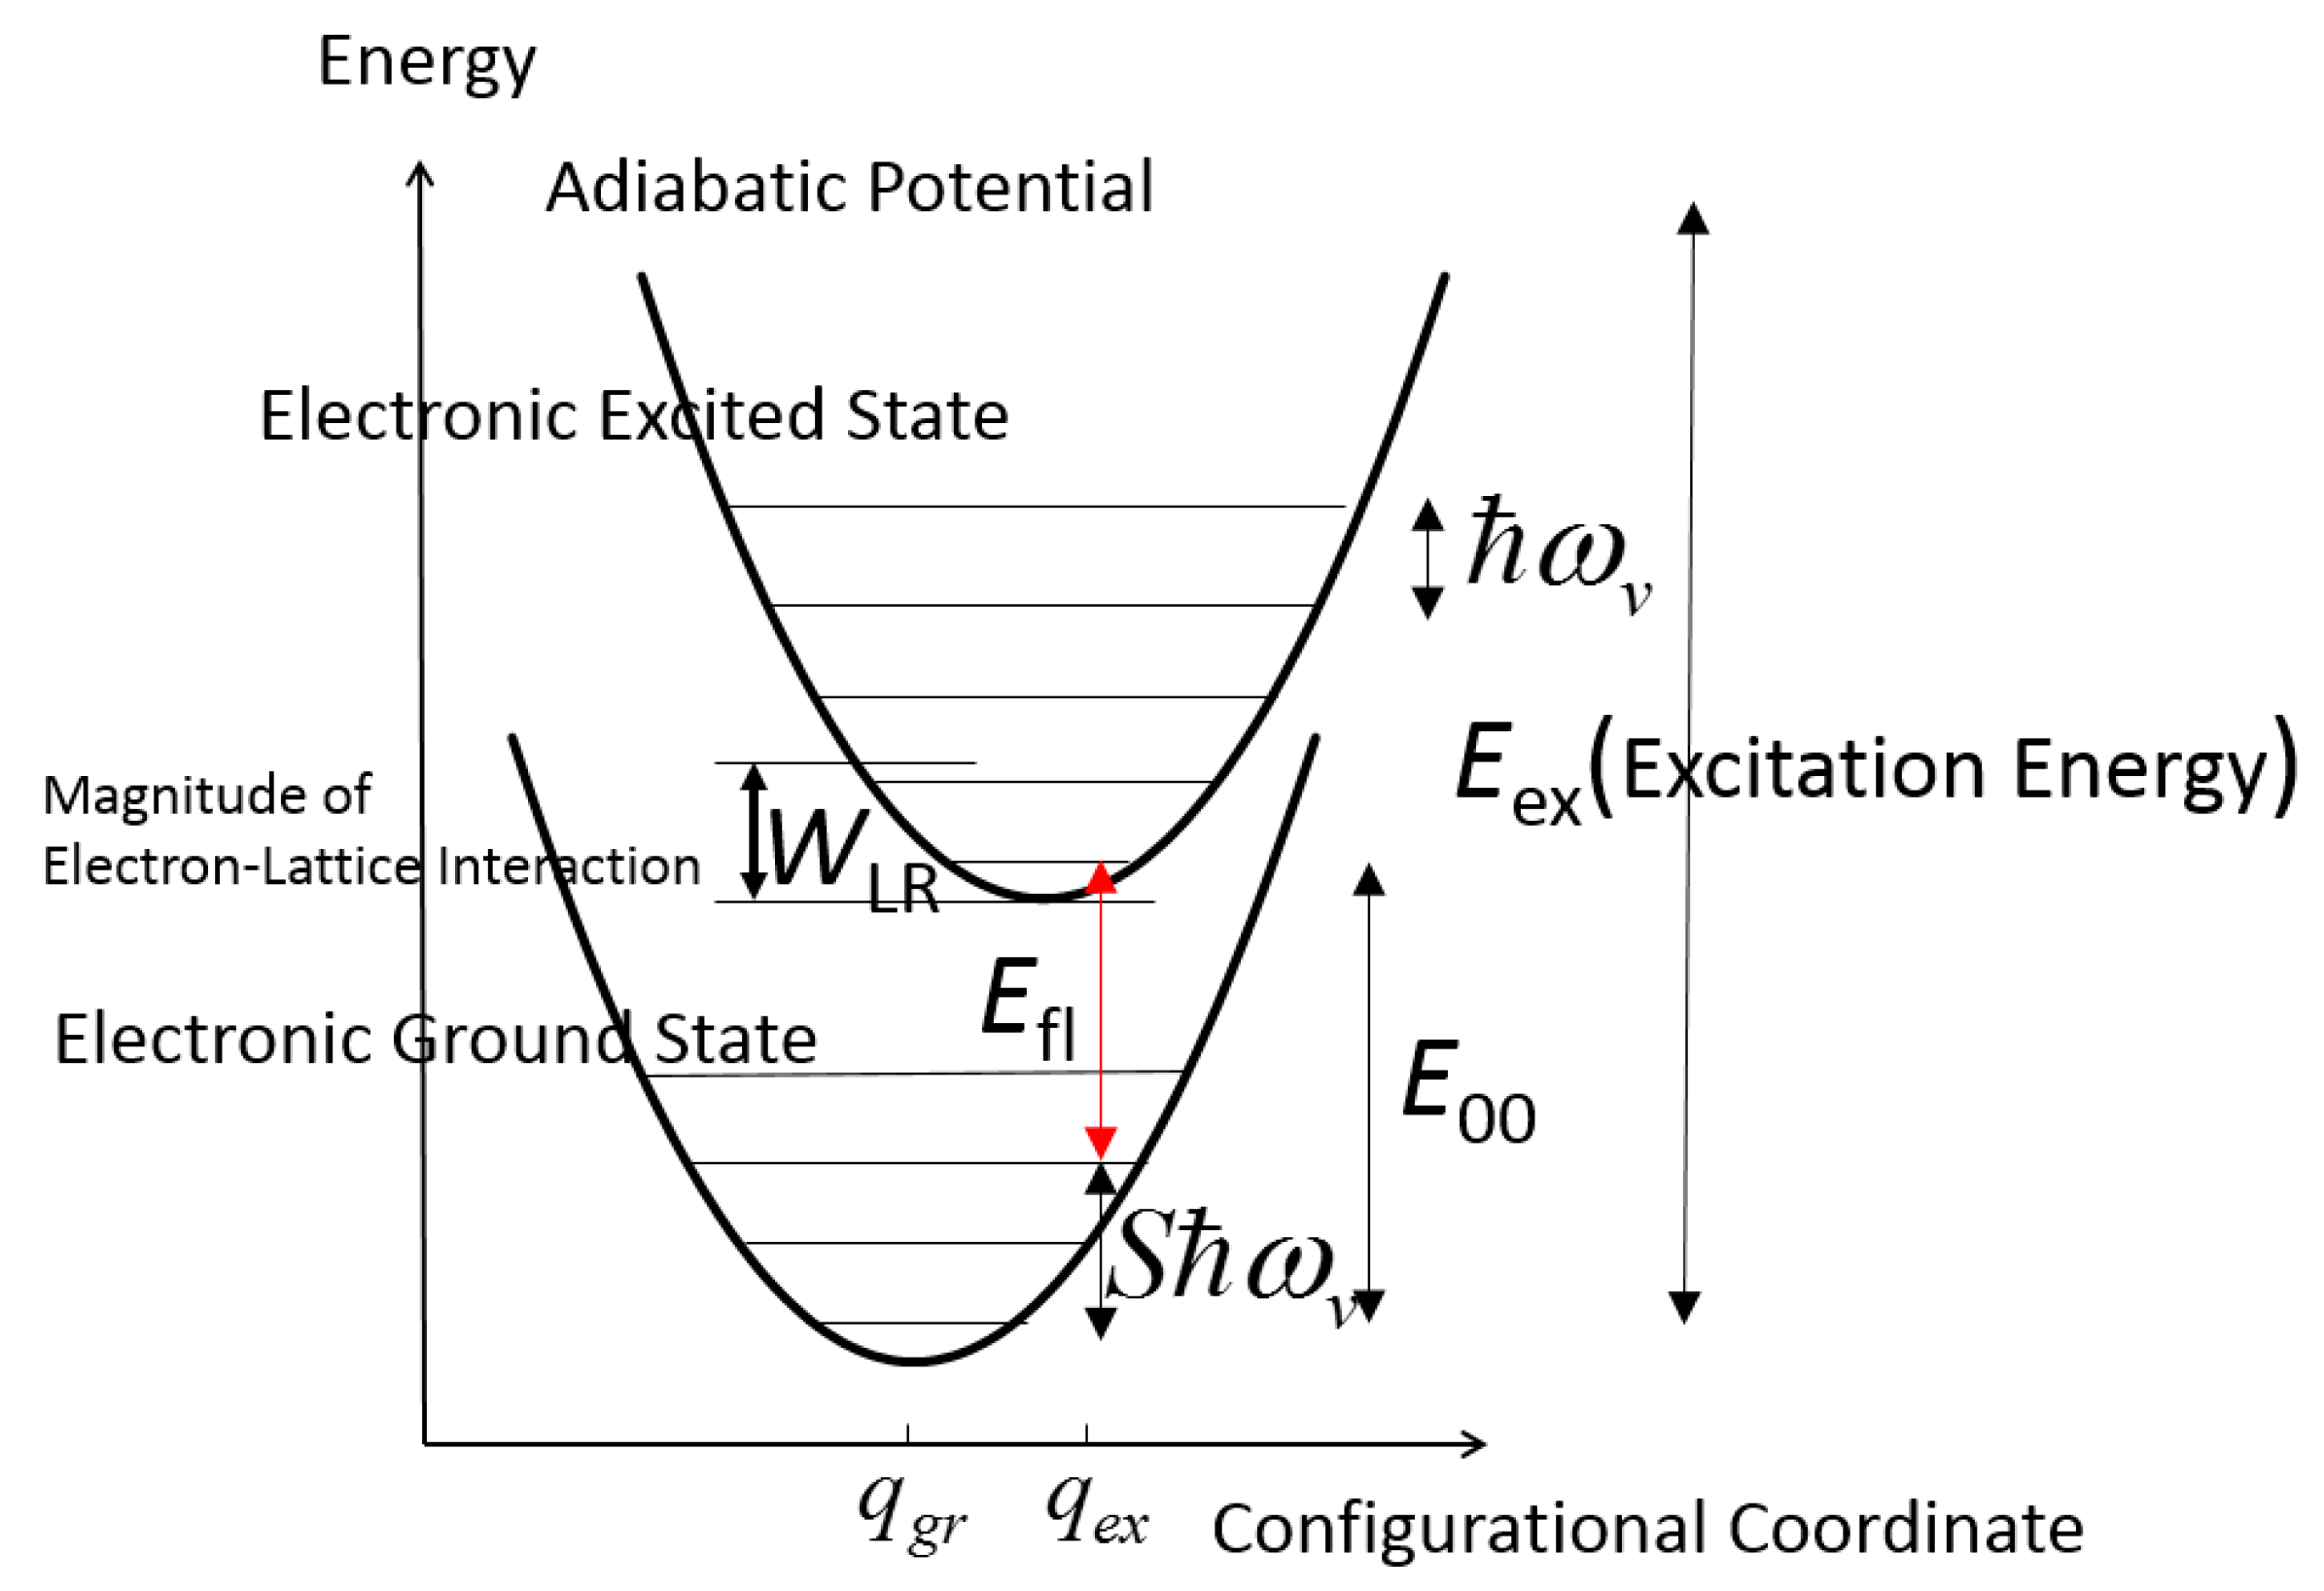
Let us formulate the relation between PTES and PLES in terms of the luminescence quantum efficiency (or quantum yield) based on radiative transition in the conventional configurational coordinate model in the harmonic approximation as shown in
Figure 6 [
16]. We can reasonably assume a typical non-radiative relaxation process where rapid non-radiative relaxation occurs from the higher to lower excited states and from the vibrationally excited state into the bottom of the adiabatic potentials in the lowest excited state and in the ground state. It is assumed that the radiative transition occurs with the luminescence quantum efficiency (≤1) from the bottom of the adiabatic potential of the lowest excited state into the vibrationally excited levels in the adiabatic potential of the ground state.
As usual as depicted in
Figure 6, we define the magnitude of electron-lattice interaction
and phonon energy
to obtain the Huang-Rhys factor
S and the Franck–Condon factor
as follows:
The conversion ratio
P of excitation energy to thermal energy when luminescence quantum efficiency is 100% (assuming that relaxation within the adiabatic potential occurs non-radiatively):
where
is the excitation photon energy,
is the fluorescence photon energy, and
is the zero phonon energy.
The photothermal excitation signal intensity (raw signal)
is expressed by:
where
is the luminescence quantum efficiency,
is the spectral response function of the measurement apparatus,
is the photon flux density of the excitation light, and
is the absorption coefficient of the sample at
.
Then, the photothermal excitation spectrum
of the sample is obtained by normalizing
with that of activated carbon (
,
, as:
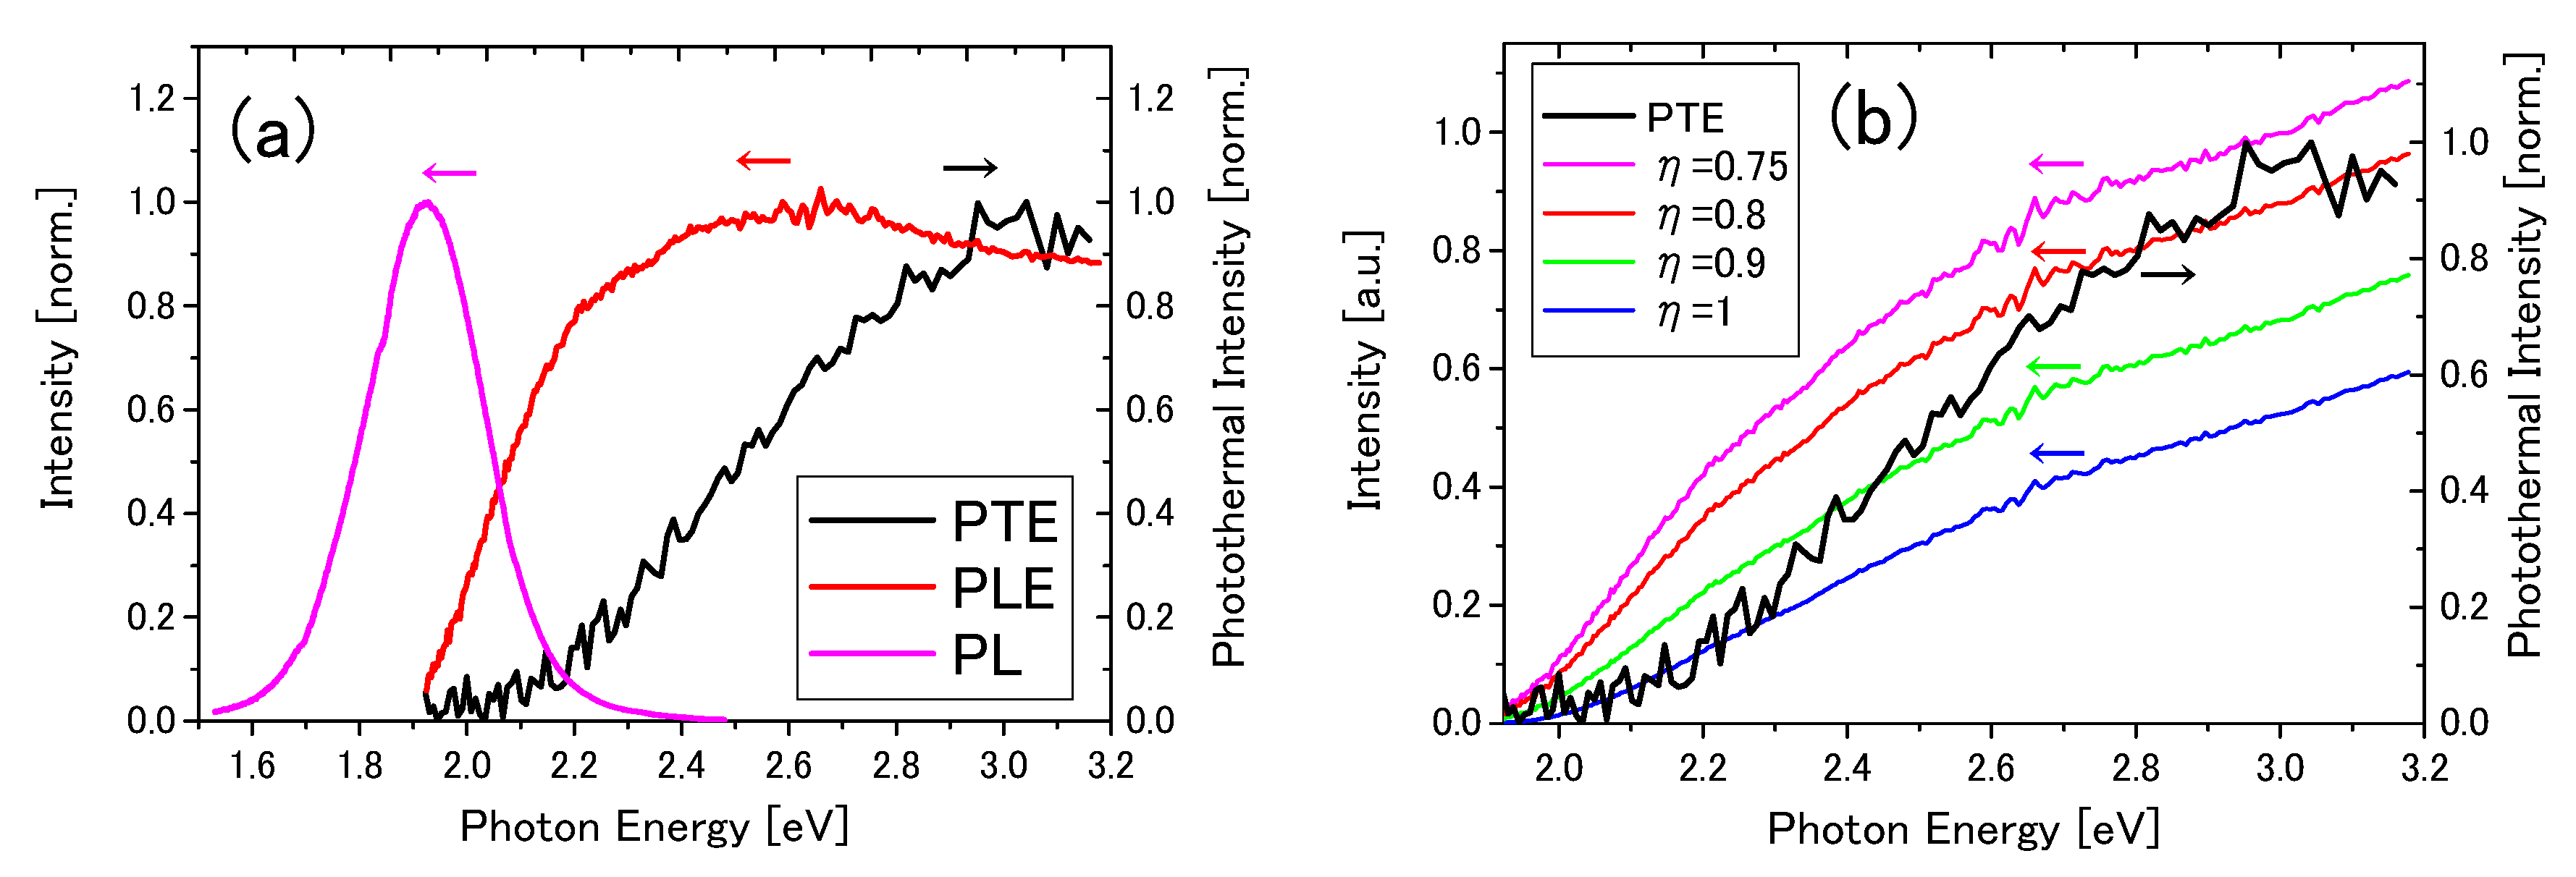
This equation shows PTES is proportional to the absorption spectrum () if and .
The raw signal intensity for the photoluminescence excitation spectrum is expressed by:
which is normalized by
to give the photoluminescence excitation spectrum:
Thus, we finally obtain the relation between
and
as:
In
Figure 5, we assumed
and
(the peak of the photoluminescence spectrum).
The PTES agrees with the transformed PLES within , consistent with independently measured with the absolute quantum efficiency measurement system. Even though agreement is fairly good, there is evident residual difference. Possible reasons for the discrepancy are as follows.
Firstly, thermoluminescence from CASN:Eu
2+ may distort PLES and/or PTES, causing departure from ideal behavior expected in the standard energy relaxation model. CASN:Eu
2+ is known not only for high quantum efficiency but also for excellent thermal-quenching behavior. The mechanism of the latter nature is studied [
17,
18] and it is revealed that photoexcited electrons are partially trapped at trapping sites and thermally excited to yield thermoluminescence. This may also affect apparent luminescence quantum efficiency.
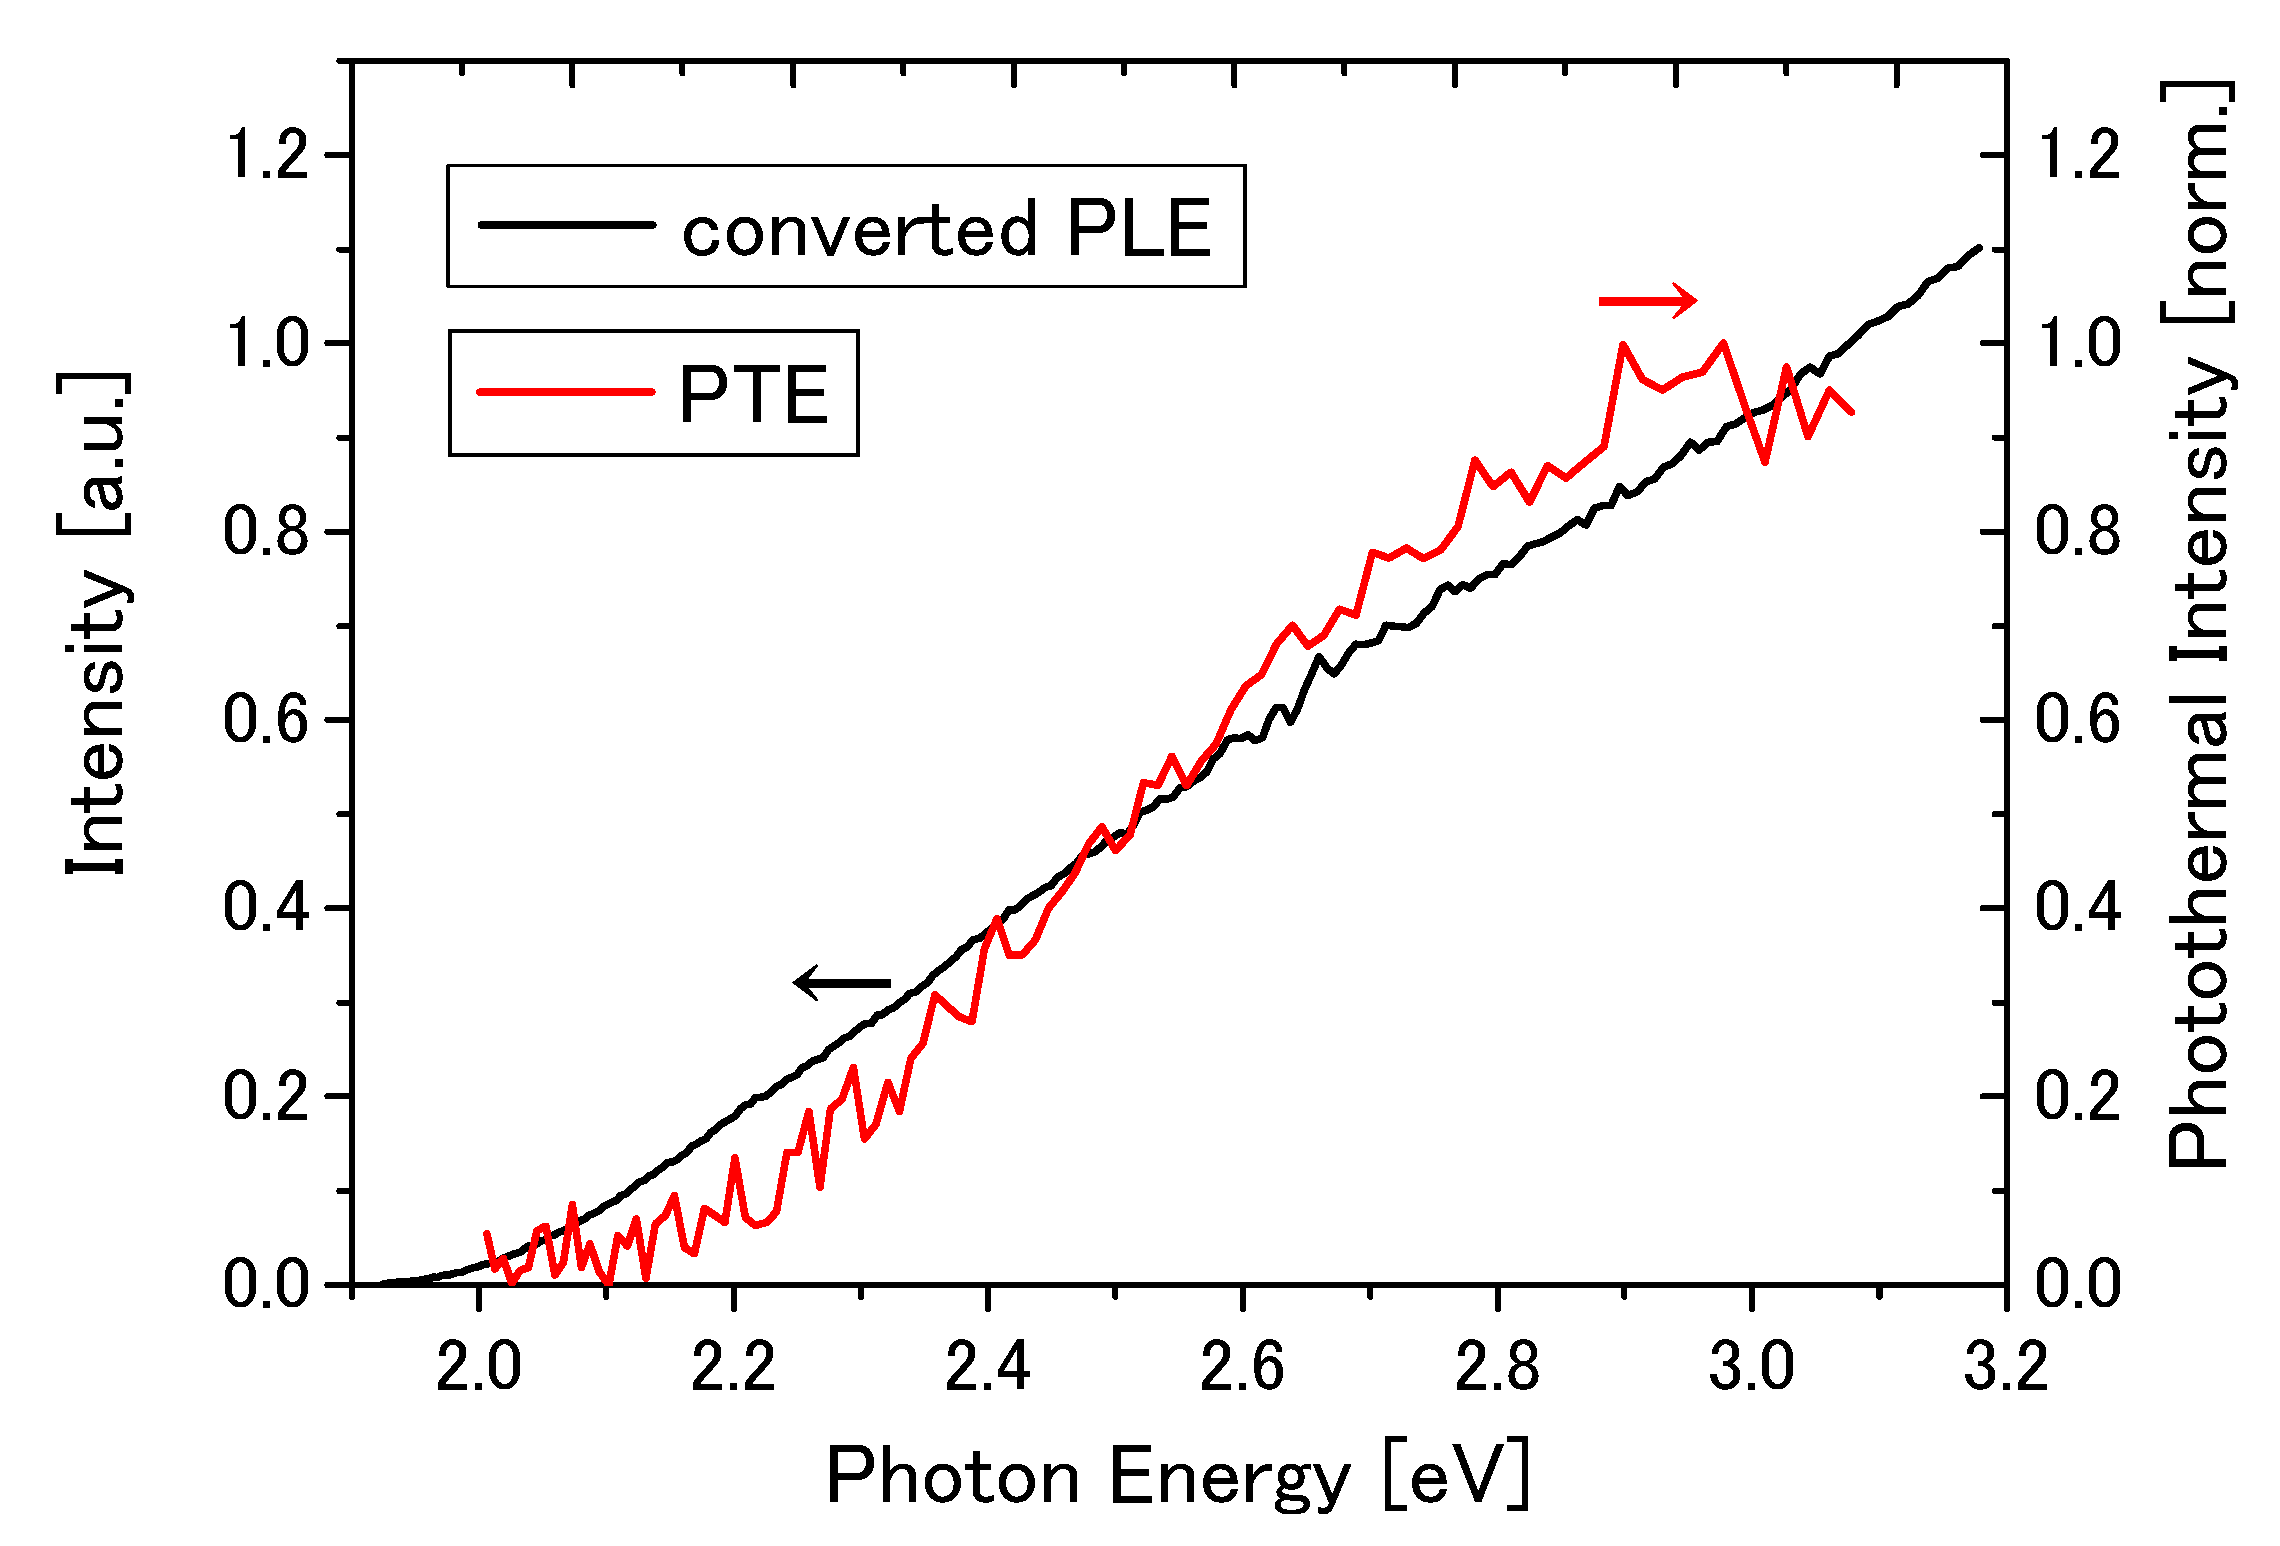
Secondly, it can be interpreted at face value, i.e., the luminescence quantum efficiency
depends on the excitation light energy as follows:
For example, if
, we obtain excellent agreement as shown in
Figure 7. In fact, calculation of absorption spectrum of CASN:Eu
2+ [
19] shows that absorption increases monotonically up to 3.6 eV, inconsistent with the PLES presently observed, where the absorption levels off around 2.5 eV and decreases above 2.6 eV. This may be indicative of the onset of a non-radiative channel by higher energy excitation, such as intersystem crossing into the radiatively inactive triplet state. Therefore, it is reasonable for the luminescence quantum efficiency tends to decrease with energy as assumed in
Figure 7. The other possibility is that
increases with photon energy to be in the absorption saturation region (
) above 2.6 eV. It is usually difficult to judge which is the case, but the improved agreement between the PTES and the transformed PLES in
Figure 7 supports the former case. In order for the comparison between PTES and PLES to be valid, it is not necessary that the PLES is proportional to the absorption spectrum since the PTES and PLES have the same (
) dependence.
Thirdly, excitation and observation geometry was not the same between PTES and PLES. In order to estimate the effect of geometry, we measured PLES in the geometry similar to PTES to find that almost the same PLES as shown in
Figure 5 was obtained. However, we need further to consider the effect of possible difference between the optical and thermal thickness of the sample as discussed in Reference [
20]. Therefore, we derive a more rigorous formula by taking these effects into account below.
When the incident photon flux density is
, the photon flux
at
(the depth from the surface), the density of the highest photoexcited state
the density of the lowest relaxed excited state
(initial state of luminescence), flux density of luminescent photon
, and flux density of photon which is converted to emitted heat
obey the equations:
respectively, where
and
are the absorption coefficients at
and
is the reciprocal of the thermal diffusion length, and
,
, and
are the non-radiative decay time from the highest photoexcited state, radiative and non-radiative decay times from the lowest relaxed excited state, respectively. The luminescence quantum efficiency is given by:
The steady-state solutions for
and
are
and
. Thus, luminescence photon flux density is given by:
and photon flux which is converted to heat and emitted from the sample surface is:
The raw photothermal excitation signal is:
Then, the photothermal excitation spectrum
of the sample is obtained by normalizing
with that of activated carbon
(
), as:
(If
,
, and
(thermally thick sample), then
. In this case, even if
,
as discussed in Reference [
20]).
The raw photoluminescence excitation signal is:
which is normalized by
(excitation light spectrum) to obtain:
Thus, we finally obtain a more rigorous relation:
If it is assumed that
and
, we again obtain the simple relation between
and
as:
In the present experiment, it is a good approximation that
and
, so:
The absorption coefficient of CaAlSiN
3 is calculated to amount to 10
4 cm
−1 in the visible, so that
is satisfied since the CASN:Eu
2+ particles are >10 µm in diameter [
19,
21].
There is no literature available for
of CASN:Eu
2+, the reciprocal of thermal diffusion length which is a function of thermal diffusivity and modulation frequency of the excitation light. Thermal diffusivity is given by thermal conductivity/(density × specific heat). For CASN:Eu
2+, thermal conductivity (4 W m
−1·K
−1) and density (3.15 g·cm
−1) are measured in Reference [
22], but specific heat is not known. From thermal diffusivity of similar phosphor ceramic material is given in Reference [
23] and that of typical ceramics in Wikipedia [
24], we can safely take 1 to 10 mm
2/s. Then, thermal diffusion length at
f = 20 Hz is estimated to be 0.1 to 0.4 mm from (2
thermal diffusivity/2π
f)
1/2. Therefore, the sample is thermally thin (
) considering the particle size, and
. Consequently, the Equation (22) holds as a good approximation.


